Afghan vs Immigrants from Eritrea Disability Age Under 5
COMPARE
Afghan
Immigrants from Eritrea
Disability Age Under 5
Disability Age Under 5 Comparison
Afghans
Immigrants from Eritrea
0.94%
DISABILITY AGE UNDER 5
100.0/ 100
METRIC RATING
11th/ 347
METRIC RANK
1.2%
DISABILITY AGE UNDER 5
92.3/ 100
METRIC RATING
120th/ 347
METRIC RANK
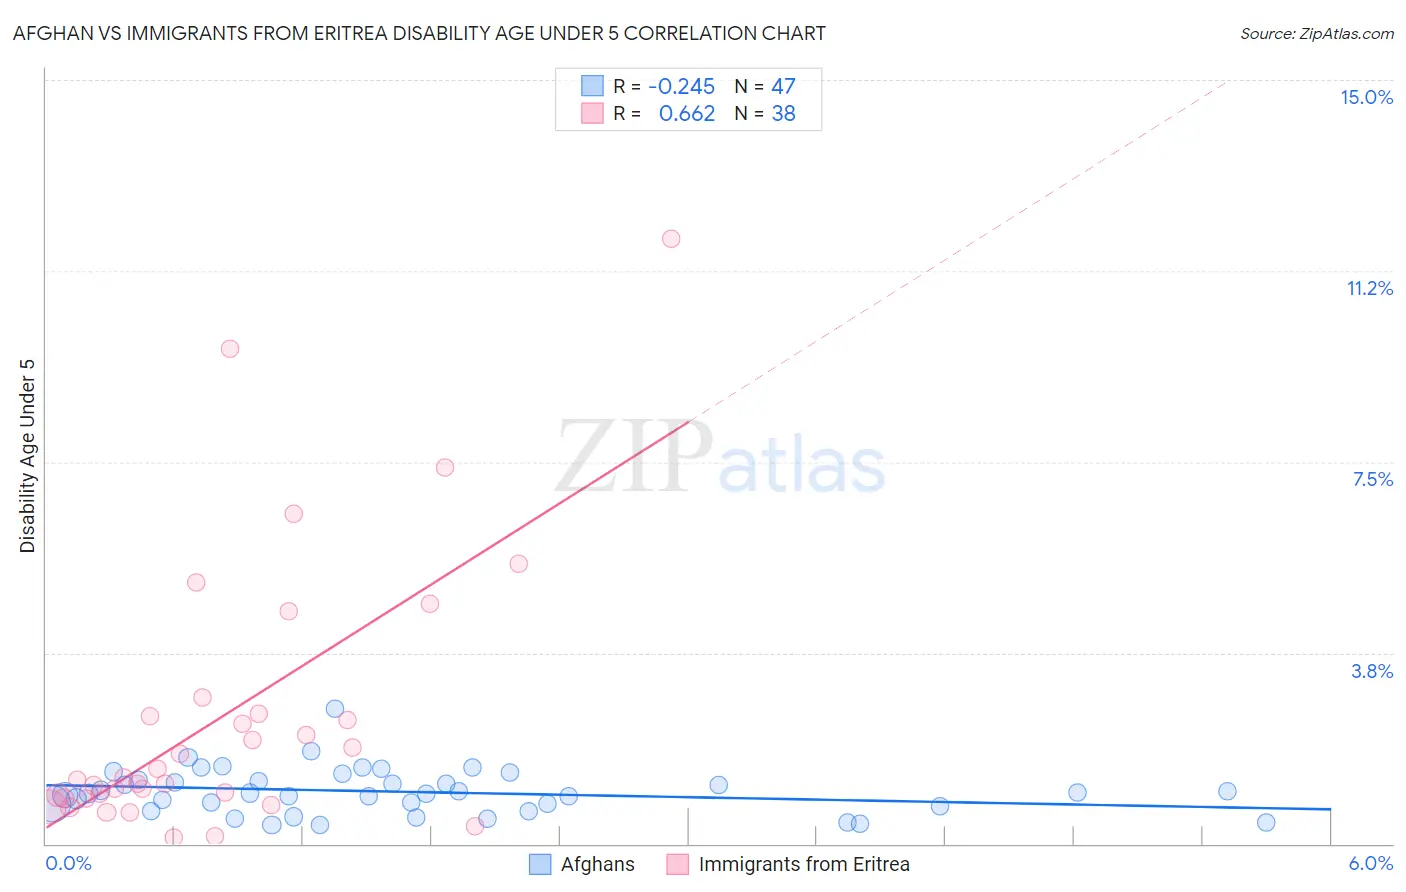
Afghan vs Immigrants from Eritrea Disability Age Under 5 Correlation Chart
The statistical analysis conducted on geographies consisting of 107,918,931 people shows a weak negative correlation between the proportion of Afghans and percentage of population with a disability under the age of 5 in the United States with a correlation coefficient (R) of -0.245 and weighted average of 0.94%. Similarly, the statistical analysis conducted on geographies consisting of 83,045,711 people shows a significant positive correlation between the proportion of Immigrants from Eritrea and percentage of population with a disability under the age of 5 in the United States with a correlation coefficient (R) of 0.662 and weighted average of 1.2%, a difference of 24.0%.
Disability Age Under 5 Correlation Summary
| Measurement | Afghan | Immigrants from Eritrea |
| Minimum | 0.37% | 0.12% |
| Maximum | 2.7% | 11.9% |
| Range | 2.3% | 11.8% |
| Mean | 1.0% | 2.5% |
| Median | 0.99% | 1.3% |
| Interquartile 25% (IQ1) | 0.74% | 0.90% |
| Interquartile 75% (IQ3) | 1.3% | 2.5% |
| Interquartile Range (IQR) | 0.52% | 1.6% |
| Standard Deviation (Sample) | 0.45% | 2.7% |
| Standard Deviation (Population) | 0.44% | 2.6% |
Similar Demographics by Disability Age Under 5
Demographics Similar to Afghans by Disability Age Under 5
In terms of disability age under 5, the demographic groups most similar to Afghans are Immigrants from Grenada (0.94%, a difference of 0.020%), Soviet Union (0.95%, a difference of 0.19%), Yuman (0.95%, a difference of 0.27%), Immigrants from Hong Kong (0.95%, a difference of 0.30%), and Marshallese (0.94%, a difference of 0.76%).
| Demographics | Rating | Rank | Disability Age Under 5 |
| Immigrants | Uzbekistan | 100.0 /100 | #4 | Exceptional 0.85% |
| Immigrants | Bangladesh | 100.0 /100 | #5 | Exceptional 0.85% |
| Ute | 100.0 /100 | #6 | Exceptional 0.86% |
| Immigrants | Afghanistan | 100.0 /100 | #7 | Exceptional 0.91% |
| Immigrants | Yemen | 100.0 /100 | #8 | Exceptional 0.91% |
| Immigrants | Fiji | 100.0 /100 | #9 | Exceptional 0.92% |
| Marshallese | 100.0 /100 | #10 | Exceptional 0.94% |
| Afghans | 100.0 /100 | #11 | Exceptional 0.94% |
| Immigrants | Grenada | 100.0 /100 | #12 | Exceptional 0.94% |
| Soviet Union | 100.0 /100 | #13 | Exceptional 0.95% |
| Yuman | 100.0 /100 | #14 | Exceptional 0.95% |
| Immigrants | Hong Kong | 100.0 /100 | #15 | Exceptional 0.95% |
| Immigrants | Israel | 100.0 /100 | #16 | Exceptional 0.96% |
| Immigrants | China | 100.0 /100 | #17 | Exceptional 0.96% |
| Immigrants | Barbados | 100.0 /100 | #18 | Exceptional 0.97% |
Demographics Similar to Immigrants from Eritrea by Disability Age Under 5
In terms of disability age under 5, the demographic groups most similar to Immigrants from Eritrea are Bhutanese (1.2%, a difference of 0.070%), Immigrants from Senegal (1.2%, a difference of 0.28%), Immigrants from Venezuela (1.2%, a difference of 0.41%), Immigrants from Philippines (1.2%, a difference of 0.44%), and Aleut (1.2%, a difference of 0.47%).
| Demographics | Rating | Rank | Disability Age Under 5 |
| Immigrants | Oceania | 94.2 /100 | #113 | Exceptional 1.2% |
| Belizeans | 93.9 /100 | #114 | Exceptional 1.2% |
| Immigrants | Caribbean | 93.8 /100 | #115 | Exceptional 1.2% |
| Immigrants | Northern Africa | 93.8 /100 | #116 | Exceptional 1.2% |
| Immigrants | Philippines | 93.5 /100 | #117 | Exceptional 1.2% |
| Immigrants | Venezuela | 93.4 /100 | #118 | Exceptional 1.2% |
| Bhutanese | 92.5 /100 | #119 | Exceptional 1.2% |
| Immigrants | Eritrea | 92.3 /100 | #120 | Exceptional 1.2% |
| Immigrants | Senegal | 91.4 /100 | #121 | Exceptional 1.2% |
| Aleuts | 90.7 /100 | #122 | Exceptional 1.2% |
| Zimbabweans | 90.6 /100 | #123 | Exceptional 1.2% |
| Immigrants | Cambodia | 90.5 /100 | #124 | Exceptional 1.2% |
| Japanese | 90.3 /100 | #125 | Exceptional 1.2% |
| Central Americans | 89.7 /100 | #126 | Excellent 1.2% |
| Immigrants | Romania | 88.4 /100 | #127 | Excellent 1.2% |