Afghan vs Immigrants from Africa Disability Age Under 5
COMPARE
Afghan
Immigrants from Africa
Disability Age Under 5
Disability Age Under 5 Comparison
Afghans
Immigrants from Africa
0.94%
DISABILITY AGE UNDER 5
100.0/ 100
METRIC RATING
11th/ 347
METRIC RANK
1.2%
DISABILITY AGE UNDER 5
65.1/ 100
METRIC RATING
161st/ 347
METRIC RANK
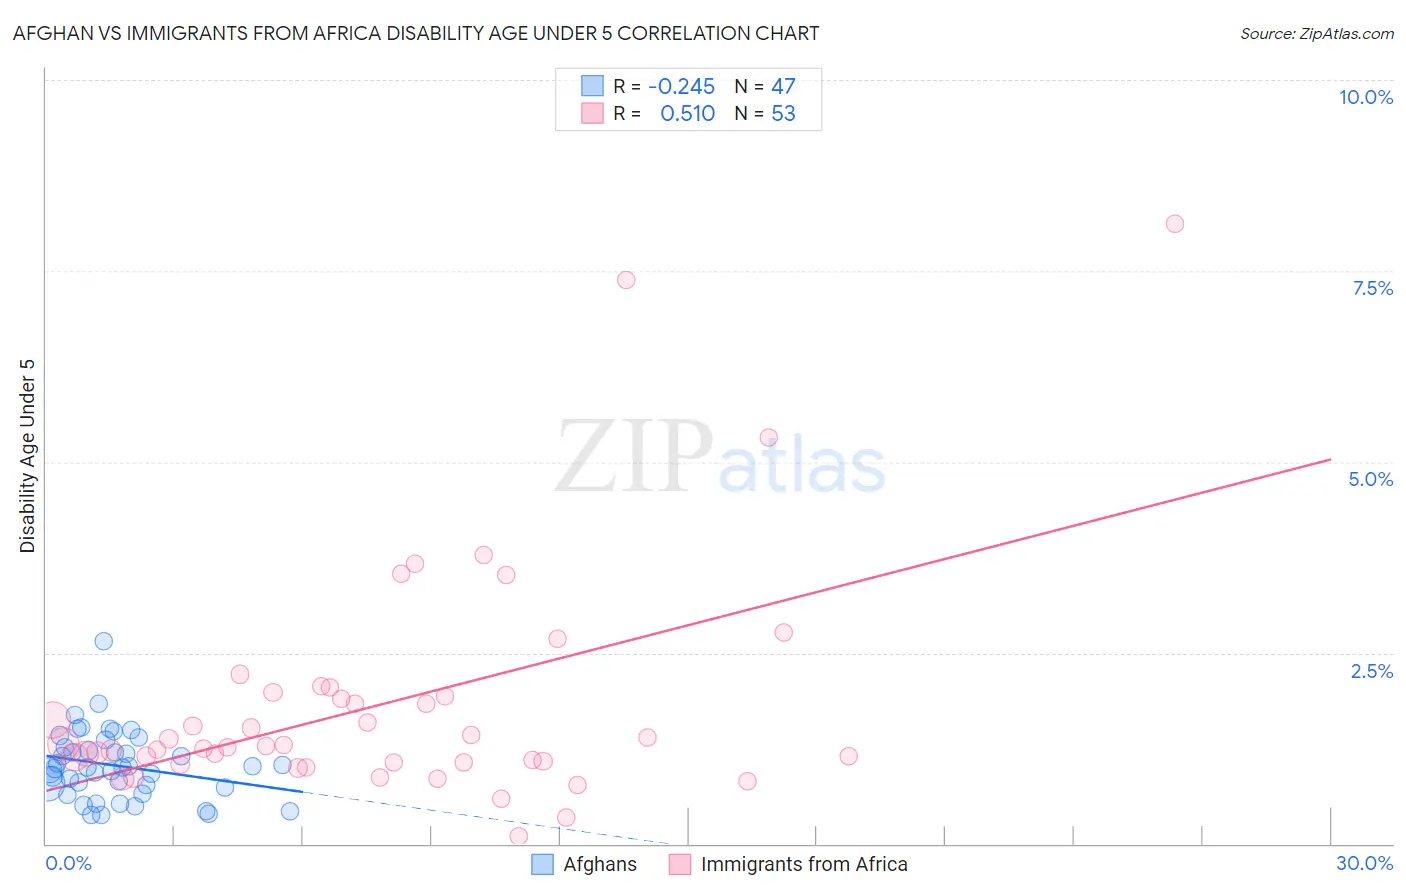
Afghan vs Immigrants from Africa Disability Age Under 5 Correlation Chart
The statistical analysis conducted on geographies consisting of 107,918,931 people shows a weak negative correlation between the proportion of Afghans and percentage of population with a disability under the age of 5 in the United States with a correlation coefficient (R) of -0.245 and weighted average of 0.94%. Similarly, the statistical analysis conducted on geographies consisting of 240,976,621 people shows a substantial positive correlation between the proportion of Immigrants from Africa and percentage of population with a disability under the age of 5 in the United States with a correlation coefficient (R) of 0.510 and weighted average of 1.2%, a difference of 29.5%.
Disability Age Under 5 Correlation Summary
| Measurement | Afghan | Immigrants from Africa |
| Minimum | 0.37% | 0.10% |
| Maximum | 2.7% | 8.1% |
| Range | 2.3% | 8.0% |
| Mean | 1.0% | 1.8% |
| Median | 0.99% | 1.3% |
| Interquartile 25% (IQ1) | 0.74% | 1.1% |
| Interquartile 75% (IQ3) | 1.3% | 2.0% |
| Interquartile Range (IQR) | 0.52% | 0.89% |
| Standard Deviation (Sample) | 0.45% | 1.5% |
| Standard Deviation (Population) | 0.44% | 1.5% |
Similar Demographics by Disability Age Under 5
Demographics Similar to Afghans by Disability Age Under 5
In terms of disability age under 5, the demographic groups most similar to Afghans are Immigrants from Grenada (0.94%, a difference of 0.020%), Soviet Union (0.95%, a difference of 0.19%), Yuman (0.95%, a difference of 0.27%), Immigrants from Hong Kong (0.95%, a difference of 0.30%), and Marshallese (0.94%, a difference of 0.76%).
| Demographics | Rating | Rank | Disability Age Under 5 |
| Immigrants | Uzbekistan | 100.0 /100 | #4 | Exceptional 0.85% |
| Immigrants | Bangladesh | 100.0 /100 | #5 | Exceptional 0.85% |
| Ute | 100.0 /100 | #6 | Exceptional 0.86% |
| Immigrants | Afghanistan | 100.0 /100 | #7 | Exceptional 0.91% |
| Immigrants | Yemen | 100.0 /100 | #8 | Exceptional 0.91% |
| Immigrants | Fiji | 100.0 /100 | #9 | Exceptional 0.92% |
| Marshallese | 100.0 /100 | #10 | Exceptional 0.94% |
| Afghans | 100.0 /100 | #11 | Exceptional 0.94% |
| Immigrants | Grenada | 100.0 /100 | #12 | Exceptional 0.94% |
| Soviet Union | 100.0 /100 | #13 | Exceptional 0.95% |
| Yuman | 100.0 /100 | #14 | Exceptional 0.95% |
| Immigrants | Hong Kong | 100.0 /100 | #15 | Exceptional 0.95% |
| Immigrants | Israel | 100.0 /100 | #16 | Exceptional 0.96% |
| Immigrants | China | 100.0 /100 | #17 | Exceptional 0.96% |
| Immigrants | Barbados | 100.0 /100 | #18 | Exceptional 0.97% |
Demographics Similar to Immigrants from Africa by Disability Age Under 5
In terms of disability age under 5, the demographic groups most similar to Immigrants from Africa are Colombian (1.2%, a difference of 0.070%), Immigrants from Latin America (1.2%, a difference of 0.070%), Arab (1.2%, a difference of 0.13%), Guatemalan (1.2%, a difference of 0.15%), and Immigrants from South America (1.2%, a difference of 0.19%).
| Demographics | Rating | Rank | Disability Age Under 5 |
| Uruguayans | 68.8 /100 | #154 | Good 1.2% |
| Immigrants | Ghana | 68.7 /100 | #155 | Good 1.2% |
| Hawaiians | 68.5 /100 | #156 | Good 1.2% |
| Immigrants | South America | 67.0 /100 | #157 | Good 1.2% |
| Arabs | 66.4 /100 | #158 | Good 1.2% |
| Colombians | 65.8 /100 | #159 | Good 1.2% |
| Immigrants | Latin America | 65.8 /100 | #160 | Good 1.2% |
| Immigrants | Africa | 65.1 /100 | #161 | Good 1.2% |
| Guatemalans | 63.6 /100 | #162 | Good 1.2% |
| Immigrants | Guatemala | 63.2 /100 | #163 | Good 1.2% |
| Laotians | 62.8 /100 | #164 | Good 1.2% |
| Immigrants | Kuwait | 62.6 /100 | #165 | Good 1.2% |
| Immigrants | Central America | 61.4 /100 | #166 | Good 1.2% |
| Immigrants | Argentina | 60.2 /100 | #167 | Good 1.2% |
| Sierra Leoneans | 59.1 /100 | #168 | Average 1.2% |