Zip Codes with the Highest Percentage of Population Employed in Transportation in Littleton, CO
RELATED REPORTS & OPTIONS
Transportation
Littleton
Compare Zip Codes
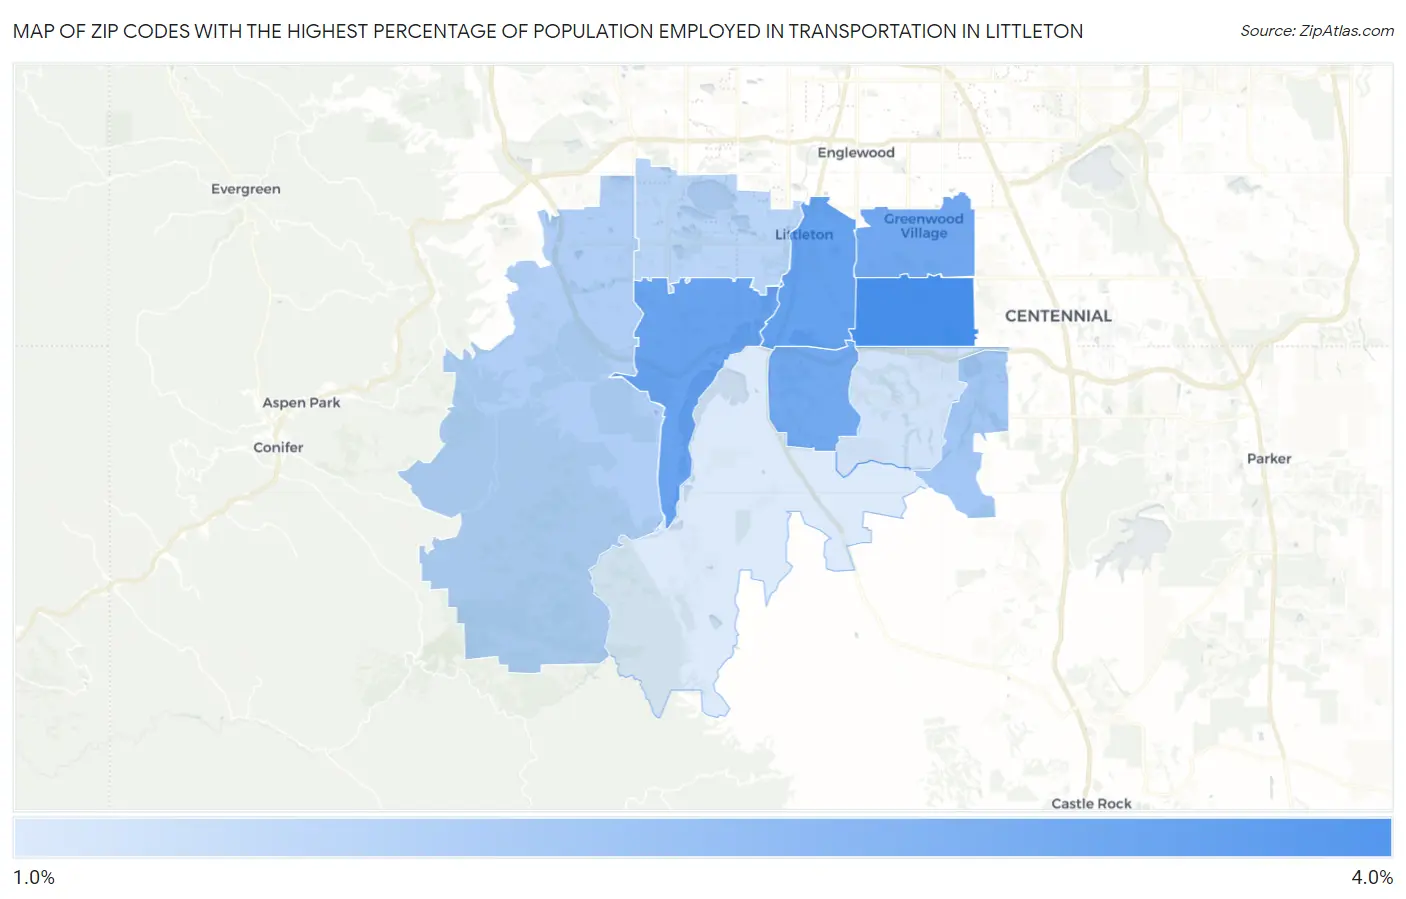
Map of Zip Codes with the Highest Percentage of Population Employed in Transportation in Littleton
1.2%
3.5%
Zip Codes with the Highest Percentage of Population Employed in Transportation in Littleton, CO
| Zip Code | % Employed | vs State | vs National | |
| 1. | 80122 | 3.5% | 3.5%(+0.097)#204 | 3.8%(-0.269)#16,597 |
| 2. | 80120 | 3.1% | 3.5%(-0.360)#241 | 3.8%(-0.726)#18,806 |
| 3. | 80128 | 3.0% | 3.5%(-0.421)#250 | 3.8%(-0.788)#19,111 |
| 4. | 80121 | 2.9% | 3.5%(-0.543)#259 | 3.8%(-0.910)#19,671 |
| 5. | 80129 | 2.9% | 3.5%(-0.583)#263 | 3.8%(-0.950)#19,839 |
| 6. | 80130 | 2.1% | 3.5%(-1.34)#320 | 3.8%(-1.71)#23,240 |
| 7. | 80127 | 1.9% | 3.5%(-1.56)#333 | 3.8%(-1.92)#24,066 |
| 8. | 80123 | 1.8% | 3.5%(-1.69)#347 | 3.8%(-2.06)#24,579 |
| 9. | 80126 | 1.4% | 3.5%(-2.07)#370 | 3.8%(-2.43)#25,780 |
| 10. | 80125 | 1.2% | 3.5%(-2.24)#381 | 3.8%(-2.61)#26,301 |
1
Common Questions
What are the Top 5 Zip Codes with the Highest Percentage of Population Employed in Transportation in Littleton, CO?
Top 5 Zip Codes with the Highest Percentage of Population Employed in Transportation in Littleton, CO are:
What zip code has the Highest Percentage of Population Employed in Transportation in Littleton, CO?
80122 has the Highest Percentage of Population Employed in Transportation in Littleton, CO with 3.5%.
What is the Percentage of Population Employed in Transportation in Littleton, CO?
Percentage of Population Employed in Transportation in Littleton is 3.4%.
What is the Percentage of Population Employed in Transportation in Colorado?
Percentage of Population Employed in Transportation in Colorado is 3.5%.
What is the Percentage of Population Employed in Transportation in the United States?
Percentage of Population Employed in Transportation in the United States is 3.8%.