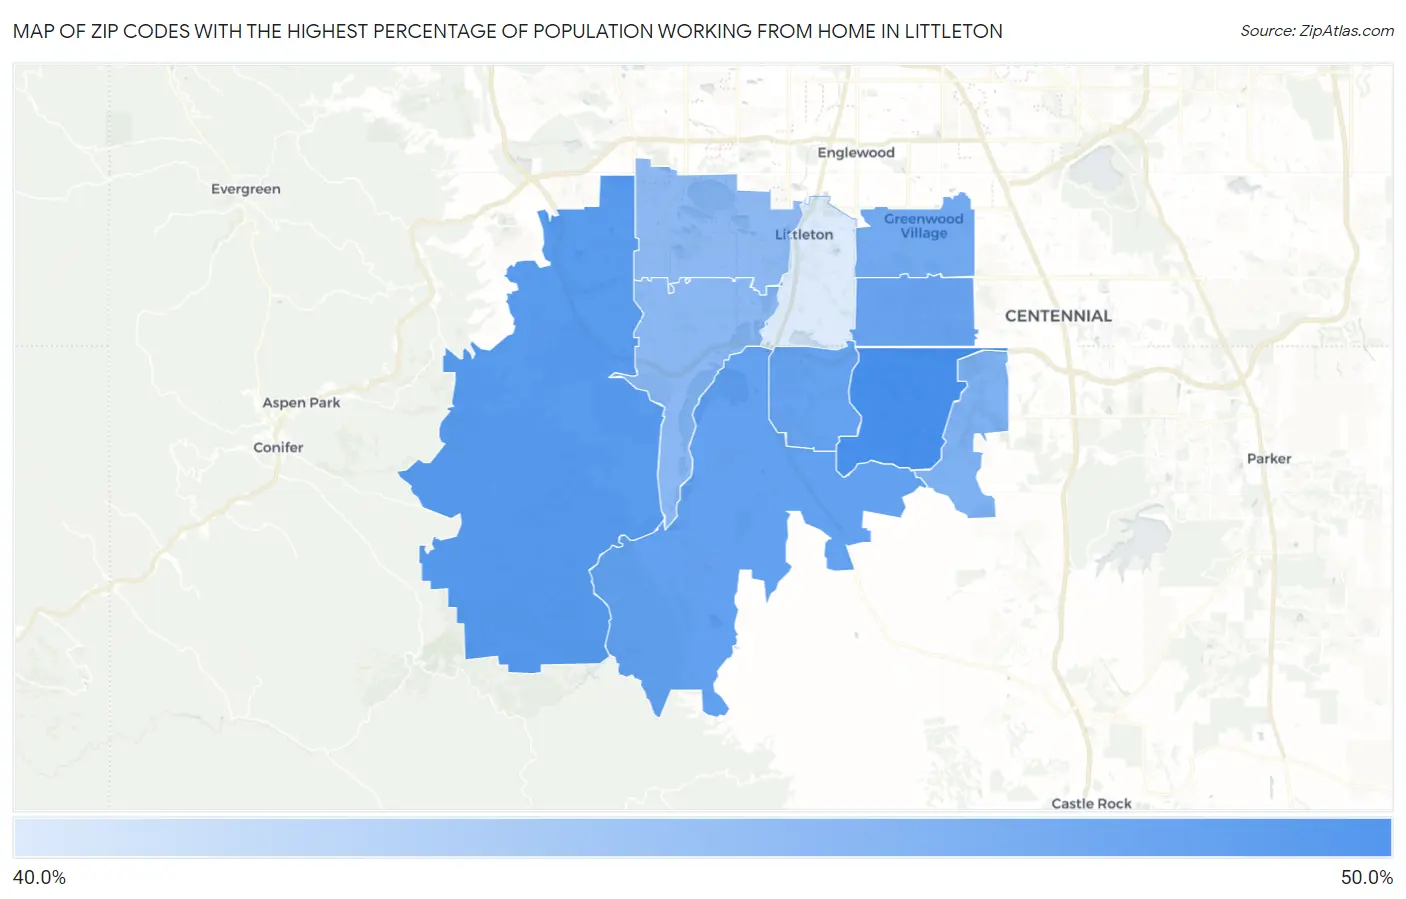
Zip Codes with the Highest Percentage of Population Working from Home in Littleton, CO
RELATED REPORTS & OPTIONS
Work from Home
Littleton
Compare Zip Codes
Map of Zip Codes with the Highest Percentage of Population Working from Home in Littleton
40.8%
49.7%
Zip Codes with the Highest Percentage of Population Working from Home in Littleton, CO
| Zip Code | % Work from Home | vs State | vs National | |
| 1. | 80126 | 49.7% | 43.6%(+6.10)#155 | 44.0%(+5.70)#8,848 |
| 2. | 80127 | 48.7% | 43.6%(+5.10)#172 | 44.0%(+4.70)#9,962 |
| 3. | 80125 | 48.0% | 43.6%(+4.40)#190 | 44.0%(+4.00)#10,816 |
| 4. | 80129 | 47.9% | 43.6%(+4.30)#193 | 44.0%(+3.90)#10,904 |
| 5. | 80122 | 47.7% | 43.6%(+4.10)#195 | 44.0%(+3.70)#11,151 |
| 6. | 80121 | 47.0% | 43.6%(+3.40)#214 | 44.0%(+3.00)#11,999 |
| 7. | 80130 | 46.3% | 43.6%(+2.70)#226 | 44.0%(+2.30)#12,825 |
| 8. | 80128 | 45.7% | 43.6%(+2.10)#237 | 44.0%(+1.70)#13,464 |
| 9. | 80123 | 45.5% | 43.6%(+1.90)#242 | 44.0%(+1.50)#13,703 |
| 10. | 80120 | 40.8% | 43.6%(-2.80)#316 | 44.0%(-3.20)#18,884 |
1
Common Questions
What are the Top 5 Zip Codes with the Highest Percentage of Population Working from Home in Littleton, CO?
Top 5 Zip Codes with the Highest Percentage of Population Working from Home in Littleton, CO are:
What zip code has the Highest Percentage of Population Working from Home in Littleton, CO?
80126 has the Highest Percentage of Population Working from Home in Littleton, CO with 49.7%.
What is the Percentage of Population Working from Home in Littleton, CO?
Percentage of Population Working from Home in Littleton is 41.3%.
What is the Percentage of Population Working from Home in Colorado?
Percentage of Population Working from Home in Colorado is 43.6%.
What is the Percentage of Population Working from Home in the United States?
Percentage of Population Working from Home in the United States is 44.0%.