Zip Codes with the Highest Percentage of Population with a Degree in Psychology in Littleton, CO
RELATED REPORTS & OPTIONS
Psychology
Littleton
Compare Zip Codes
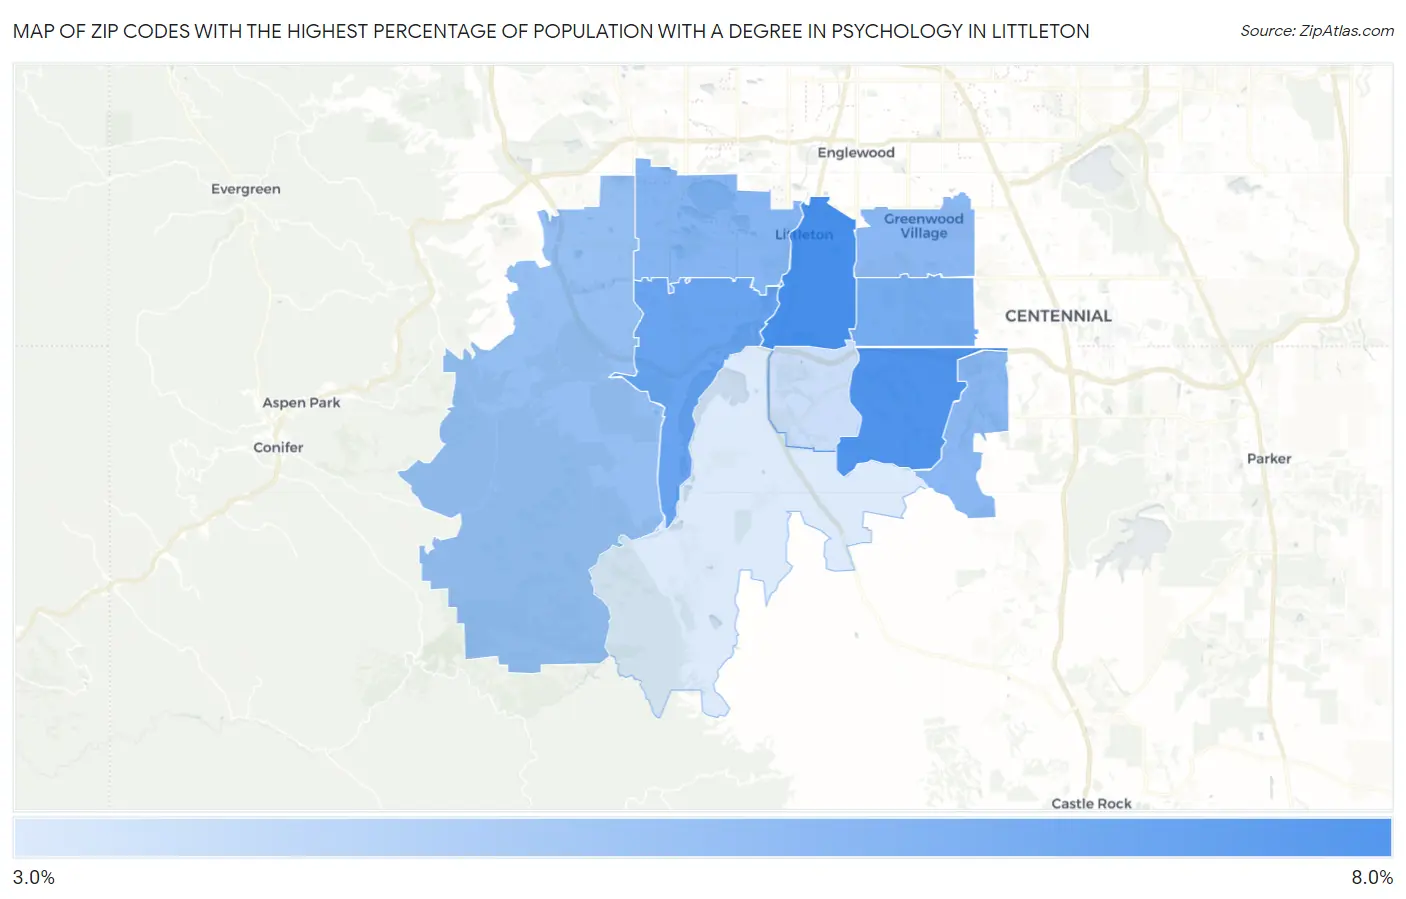
Map of Zip Codes with the Highest Percentage of Population with a Degree in Psychology in Littleton
3.8%
6.2%
Zip Codes with the Highest Percentage of Population with a Degree in Psychology in Littleton, CO
| Zip Code | % Graduates | vs State | vs National | |
| 1. | 80120 | 6.2% | 5.6%(+0.634)#149 | 5.1%(+1.15)#7,364 |
| 2. | 80126 | 6.1% | 5.6%(+0.515)#159 | 5.1%(+1.03)#7,714 |
| 3. | 80128 | 5.6% | 5.6%(+0.057)#189 | 5.1%(+0.574)#9,108 |
| 4. | 80122 | 5.5% | 5.6%(-0.096)#196 | 5.1%(+0.421)#9,630 |
| 5. | 80123 | 5.2% | 5.6%(-0.387)#217 | 5.1%(+0.131)#10,616 |
| 6. | 80130 | 5.1% | 5.6%(-0.435)#219 | 5.1%(+0.082)#10,769 |
| 7. | 80121 | 5.1% | 5.6%(-0.441)#221 | 5.1%(+0.076)#10,812 |
| 8. | 80127 | 4.9% | 5.6%(-0.648)#235 | 5.1%(-0.131)#11,554 |
| 9. | 80129 | 4.1% | 5.6%(-1.47)#280 | 5.1%(-0.949)#14,562 |
| 10. | 80125 | 3.8% | 5.6%(-1.78)#293 | 5.1%(-1.26)#15,653 |
1
Common Questions
What are the Top 5 Zip Codes with the Highest Percentage of Population with a Degree in Psychology in Littleton, CO?
Top 5 Zip Codes with the Highest Percentage of Population with a Degree in Psychology in Littleton, CO are:
What zip code has the Highest Percentage of Population with a Degree in Psychology in Littleton, CO?
80120 has the Highest Percentage of Population with a Degree in Psychology in Littleton, CO with 6.2%.
What is the Percentage of Population with a Degree in Psychology in Littleton, CO?
Percentage of Population with a Degree in Psychology in Littleton is 5.8%.
What is the Percentage of Population with a Degree in Psychology in Colorado?
Percentage of Population with a Degree in Psychology in Colorado is 5.6%.
What is the Percentage of Population with a Degree in Psychology in the United States?
Percentage of Population with a Degree in Psychology in the United States is 5.1%.