Zip Codes with the Highest Percentage of Population Carpooling to Work in Littleton, CO
RELATED REPORTS & OPTIONS
Drive | Carpool
Littleton
Compare Zip Codes
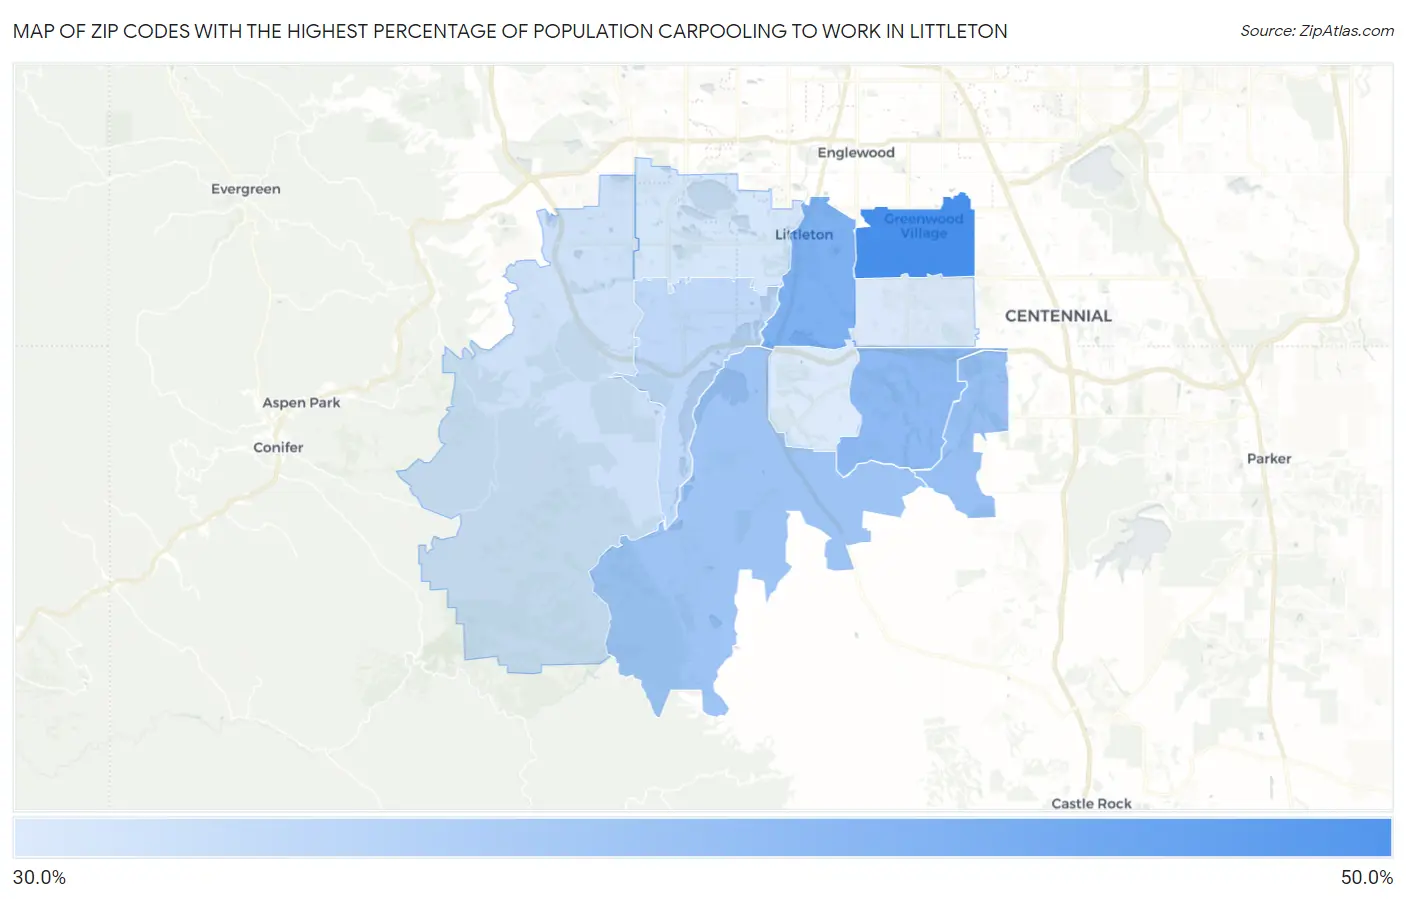
Map of Zip Codes with the Highest Percentage of Population Carpooling to Work in Littleton
36.1%
49.7%
Zip Codes with the Highest Percentage of Population Carpooling to Work in Littleton, CO
| Zip Code | % Carpool | vs State | vs National | |
| 1. | 80121 | 49.7% | 36.6%(+13.1)#47 | 38.2%(+11.5)#2,986 |
| 2. | 80120 | 44.6% | 36.6%(+8.00)#87 | 38.2%(+6.40)#6,143 |
| 3. | 80126 | 43.0% | 36.6%(+6.40)#108 | 38.2%(+4.80)#7,672 |
| 4. | 80130 | 42.3% | 36.6%(+5.70)#124 | 38.2%(+4.10)#8,444 |
| 5. | 80125 | 41.6% | 36.6%(+5.00)#140 | 38.2%(+3.40)#9,280 |
| 6. | 80128 | 38.7% | 36.6%(+2.10)#193 | 38.2%(+0.500)#13,266 |
| 7. | 80127 | 37.4% | 36.6%(+0.800)#223 | 38.2%(-0.800)#15,149 |
| 8. | 80123 | 36.7% | 36.6%(+0.100)#247 | 38.2%(-1.50)#16,146 |
| 9. | 80122 | 36.2% | 36.6%(-0.400)#255 | 38.2%(-2.00)#16,877 |
| 10. | 80129 | 36.1% | 36.6%(-0.500)#257 | 38.2%(-2.10)#16,992 |
1
Common Questions
What are the Top 5 Zip Codes with the Highest Percentage of Population Carpooling to Work in Littleton, CO?
Top 5 Zip Codes with the Highest Percentage of Population Carpooling to Work in Littleton, CO are:
What zip code has the Highest Percentage of Population Carpooling to Work in Littleton, CO?
80121 has the Highest Percentage of Population Carpooling to Work in Littleton, CO with 49.7%.
What is the Percentage of Population Carpooling to Work in Littleton, CO?
Percentage of Population Carpooling to Work in Littleton is 39.2%.
What is the Percentage of Population Carpooling to Work in Colorado?
Percentage of Population Carpooling to Work in Colorado is 36.6%.
What is the Percentage of Population Carpooling to Work in the United States?
Percentage of Population Carpooling to Work in the United States is 38.2%.