Zip Codes with the Highest Percentage of Immigrants from Eastern Asia in Littleton, CO
RELATED REPORTS & OPTIONS
Eastern Asia
Littleton
Compare Zip Codes
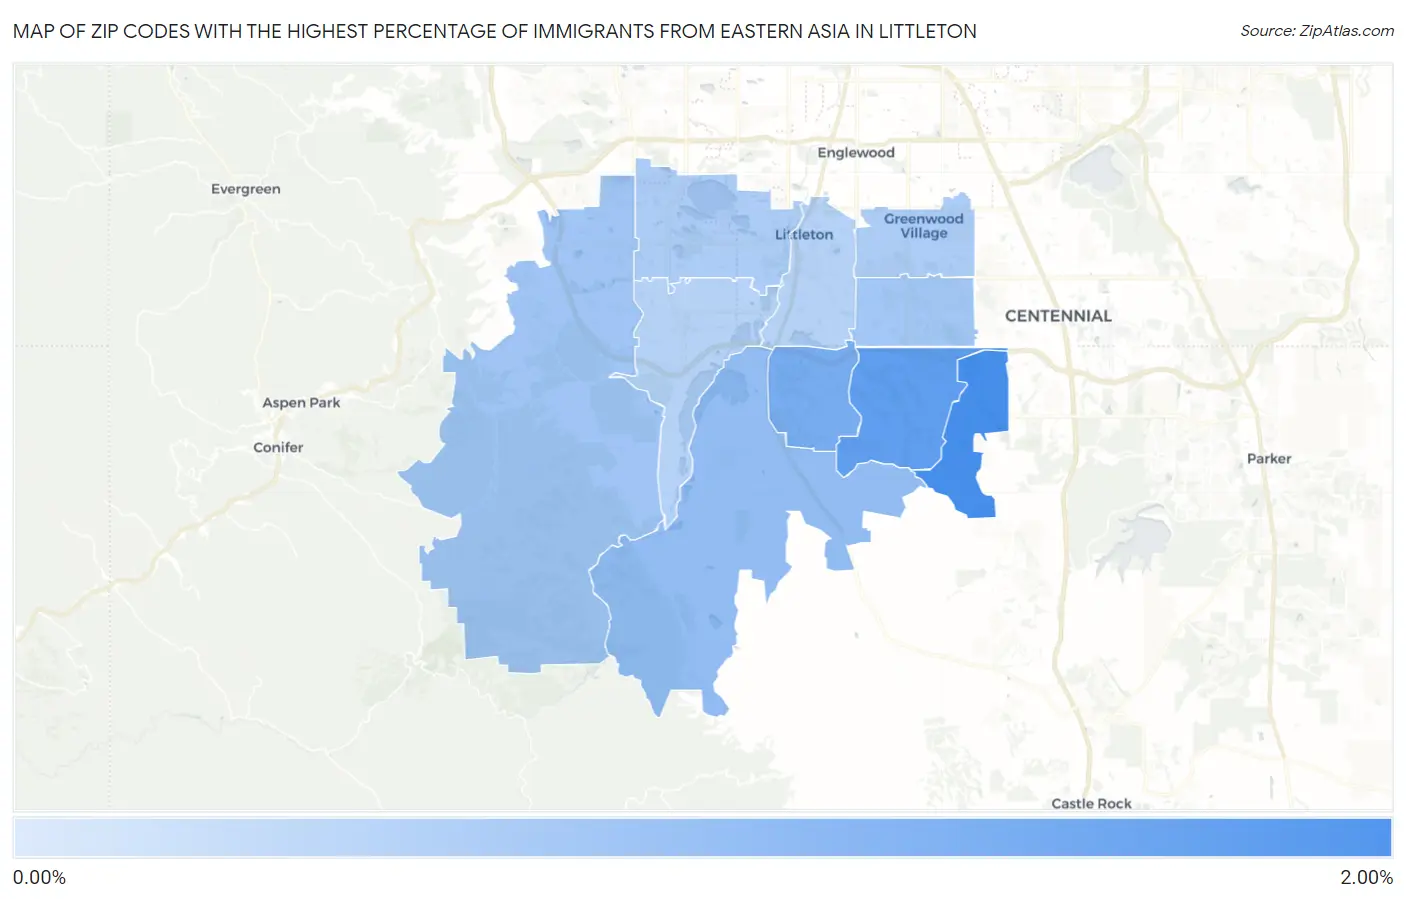
Map of Zip Codes with the Highest Percentage of Immigrants from Eastern Asia in Littleton
0.50%
1.95%
Zip Codes with the Highest Percentage of Immigrants from Eastern Asia in Littleton, CO
| Zip Code | Eastern Asia | vs State | vs National | |
| 1. | 80130 | 1.95% | 0.73%(+1.22)#16 | 1.28%(+0.677)#2,043 |
| 2. | 80126 | 1.63% | 0.73%(+0.892)#26 | 1.28%(+0.349)#2,479 |
| 3. | 80129 | 1.31% | 0.73%(+0.578)#38 | 1.28%(+0.035)#3,037 |
| 4. | 80125 | 0.96% | 0.73%(+0.225)#58 | 1.28%(-0.318)#4,050 |
| 5. | 80127 | 0.79% | 0.73%(+0.058)#78 | 1.28%(-0.484)#4,752 |
| 6. | 80122 | 0.75% | 0.73%(+0.012)#83 | 1.28%(-0.530)#4,987 |
| 7. | 80121 | 0.63% | 0.73%(-0.102)#92 | 1.28%(-0.644)#5,632 |
| 8. | 80123 | 0.62% | 0.73%(-0.112)#95 | 1.28%(-0.654)#5,691 |
| 9. | 80120 | 0.52% | 0.73%(-0.214)#111 | 1.28%(-0.756)#6,428 |
| 10. | 80128 | 0.50% | 0.73%(-0.231)#114 | 1.28%(-0.774)#6,576 |
1
Common Questions
What are the Top 5 Zip Codes with the Highest Percentage of Immigrants from Eastern Asia in Littleton, CO?
Top 5 Zip Codes with the Highest Percentage of Immigrants from Eastern Asia in Littleton, CO are:
What zip code has the Highest Percentage of Immigrants from Eastern Asia in Littleton, CO?
80130 has the Highest Percentage of Immigrants from Eastern Asia in Littleton, CO with 1.95%.
What is the Percentage of Immigrants from Eastern Asia in Littleton, CO?
Percentage of Immigrants from Eastern Asia in Littleton is 0.55%.
What is the Percentage of Immigrants from Eastern Asia in Colorado?
Percentage of Immigrants from Eastern Asia in Colorado is 0.73%.
What is the Percentage of Immigrants from Eastern Asia in the United States?
Percentage of Immigrants from Eastern Asia in the United States is 1.28%.