Zip Codes with the Highest Percentage of Households With Two or more Vehicles in Desert Hot Springs, CA
RELATED REPORTS & OPTIONS
Households with 2 or more Cars
Desert Hot Springs
Compare Zip Codes
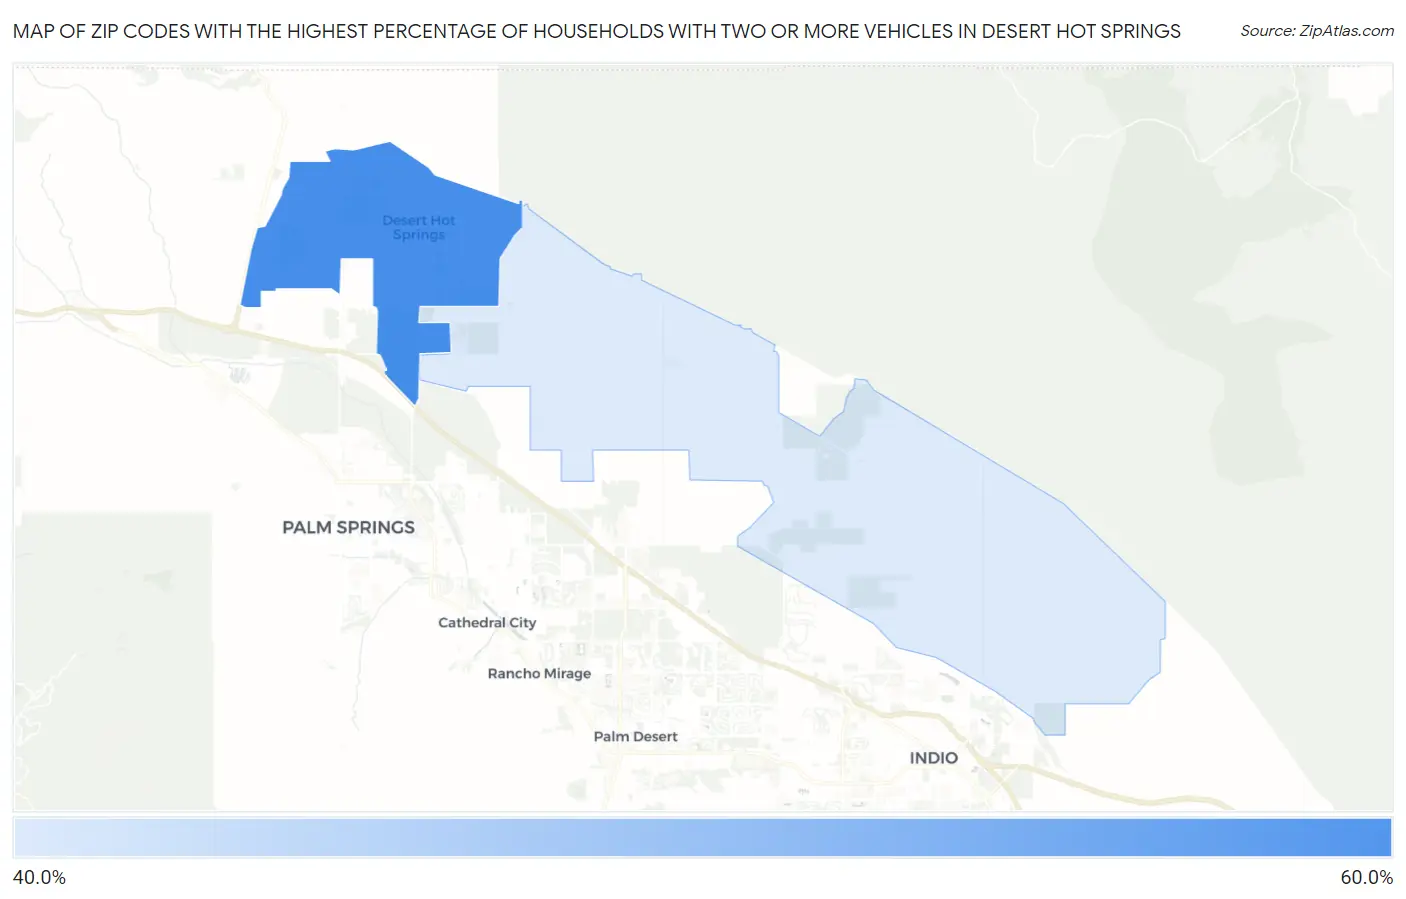
Map of Zip Codes with the Highest Percentage of Households With Two or more Vehicles in Desert Hot Springs
49.4%
60.0%
Zip Codes with the Highest Percentage of Households With Two or more Vehicles in Desert Hot Springs, CA
| Zip Code | Housholds With 2+ Cars | vs State | vs National | |
| 1. | 92240 | 60.0% | 62.9%(-2.90)#1,203 | 59.1%(+0.900)#22,653 |
| 2. | 92241 | 49.4% | 62.9%(-13.5)#1,492 | 59.1%(-9.70)#28,255 |
1
Common Questions
What are the Top Zip Codes with the Highest Percentage of Households With Two or more Vehicles in Desert Hot Springs, CA?
Top Zip Codes with the Highest Percentage of Households With Two or more Vehicles in Desert Hot Springs, CA are:
What zip code has the Highest Percentage of Households With Two or more Vehicles in Desert Hot Springs, CA?
92240 has the Highest Percentage of Households With Two or more Vehicles in Desert Hot Springs, CA with 60.0%.
What is the Percentage of Households With Two or more Vehicles in Desert Hot Springs, CA?
Percentage of Households With Two or more Vehicles in Desert Hot Springs is 57.8%.
What is the Percentage of Households With Two or more Vehicles in California?
Percentage of Households With Two or more Vehicles in California is 62.9%.
What is the Percentage of Households With Two or more Vehicles in the United States?
Percentage of Households With Two or more Vehicles in the United States is 59.1%.