Zip Codes with the Highest Percentage of Population with a Degree in Science and Engineering in Alabama
RELATED REPORTS & OPTIONS
Science and Engineering
Alabama
Compare Zip Codes
Map of Zip Codes with the Highest Percentage of Population with a Degree in Science and Engineering in Alabama
0.0%
100.0%
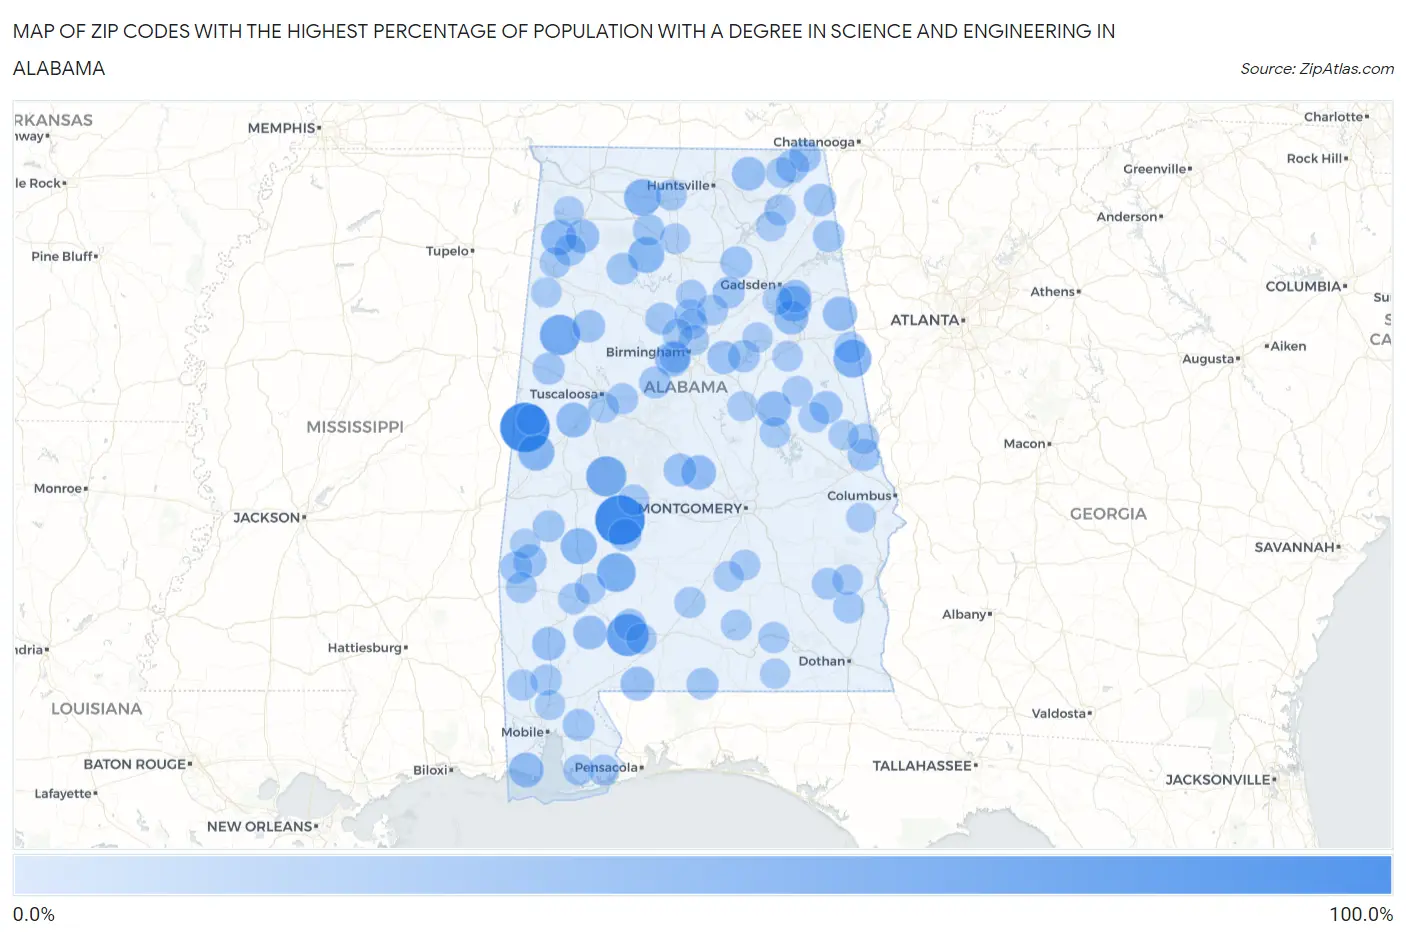
Zip Codes with the Highest Percentage of Population with a Degree in Science and Engineering in Alabama
| Zip Code | % Graduates | vs State | vs National | |
| 1. | 36773 | 100.0% | 11.0% (+89.0)#1 | 9.8% (+90.2)#40 |
| 2. | 35477 | 100.0% | 11.0% (+89.0)#2 | 9.8% (+90.2)#72 |
| 3. | 36439 | 68.2% | 11.0% (+57.2)#3 | 9.8% (+58.4)#195 |
| 4. | 35545 | 60.0% | 11.0% (+49.0)#4 | 9.8% (+50.2)#258 |
| 5. | 36765 | 59.4% | 11.0% (+48.4)#5 | 9.8% (+49.6)#266 |
| 6. | 36435 | 53.8% | 11.0% (+42.9)#6 | 9.8% (+44.1)#339 |
| 7. | 36263 | 50.0% | 11.0% (+39.0)#7 | 9.8% (+40.2)#381 |
| 8. | 35643 | 45.0% | 11.0% (+34.0)#8 | 9.8% (+35.2)#525 |
| 9. | 35464 | 43.5% | 11.0% (+32.6)#9 | 9.8% (+33.8)#556 |
| 10. | 36736 | 42.3% | 11.0% (+31.3)#10 | 9.8% (+32.5)#600 |
| 11. | 35540 | 41.7% | 11.0% (+30.7)#11 | 9.8% (+31.9)#610 |
| 12. | 36279 | 40.3% | 11.0% (+29.3)#12 | 9.8% (+30.5)#665 |
| 13. | 35571 | 39.1% | 11.0% (+28.1)#13 | 9.8% (+29.3)#710 |
| 14. | 35061 | 38.0% | 11.0% (+27.0)#14 | 9.8% (+28.2)#750 |
| 15. | 35072 | 37.3% | 11.0% (+26.4)#15 | 9.8% (+27.6)#790 |
| 16. | 35469 | 36.9% | 11.0% (+25.9)#16 | 9.8% (+27.1)#812 |
| 17. | 36509 | 36.6% | 11.0% (+25.6)#17 | 9.8% (+26.8)#832 |
| 18. | 36006 | 35.8% | 11.0% (+24.8)#18 | 9.8% (+26.1)#880 |
| 19. | 36262 | 34.9% | 11.0% (+23.9)#19 | 9.8% (+25.1)#941 |
| 20. | 36250 | 33.7% | 11.0% (+22.7)#20 | 9.8% (+23.9)#1,018 |
| 21. | 36441 | 33.3% | 11.0% (+22.3)#21 | 9.8% (+23.5)#1,070 |
| 22. | 35581 | 32.2% | 11.0% (+21.2)#22 | 9.8% (+22.4)#1,126 |
| 23. | 36540 | 31.8% | 11.0% (+20.8)#23 | 9.8% (+22.0)#1,149 |
| 24. | 35751 | 31.8% | 11.0% (+20.8)#24 | 9.8% (+22.0)#1,153 |
| 25. | 36585 | 31.1% | 11.0% (+20.1)#25 | 9.8% (+21.3)#1,219 |
| 26. | 36921 | 30.0% | 11.0% (+19.0)#26 | 9.8% (+20.2)#1,311 |
| 27. | 35772 | 29.5% | 11.0% (+18.5)#27 | 9.8% (+19.7)#1,363 |
| 28. | 36758 | 29.4% | 11.0% (+18.4)#28 | 9.8% (+19.6)#1,373 |
| 29. | 35176 | 29.2% | 11.0% (+18.2)#29 | 9.8% (+19.4)#1,387 |
| 30. | 36276 | 28.7% | 11.0% (+17.7)#30 | 9.8% (+18.9)#1,446 |
| 31. | 36720 | 28.6% | 11.0% (+17.6)#31 | 9.8% (+18.8)#1,462 |
| 32. | 35542 | 28.3% | 11.0% (+17.3)#32 | 9.8% (+18.5)#1,500 |
| 33. | 35989 | 27.5% | 11.0% (+16.5)#33 | 9.8% (+17.7)#1,600 |
| 34. | 35905 | 27.4% | 11.0% (+16.4)#34 | 9.8% (+17.6)#1,605 |
| 35. | 36852 | 26.7% | 11.0% (+15.7)#35 | 9.8% (+16.9)#1,688 |
| 36. | 36908 | 26.5% | 11.0% (+15.5)#36 | 9.8% (+16.7)#1,725 |
| 37. | 35980 | 26.3% | 11.0% (+15.3)#37 | 9.8% (+16.5)#1,750 |
| 38. | 35148 | 26.2% | 11.0% (+15.2)#38 | 9.8% (+16.4)#1,761 |
| 39. | 35481 | 26.1% | 11.0% (+15.1)#39 | 9.8% (+16.3)#1,774 |
| 40. | 36460 | 25.9% | 11.0% (+14.9)#40 | 9.8% (+16.1)#1,797 |
| 41. | 35121 | 25.4% | 11.0% (+14.4)#41 | 9.8% (+15.6)#1,876 |
| 42. | 36578 | 25.2% | 11.0% (+14.2)#42 | 9.8% (+15.4)#1,910 |
| 43. | 35054 | 25.2% | 11.0% (+14.2)#43 | 9.8% (+15.4)#1,917 |
| 44. | 35111 | 24.9% | 11.0% (+13.9)#44 | 9.8% (+15.1)#2,006 |
| 45. | 35553 | 24.7% | 11.0% (+13.8)#45 | 9.8% (+15.0)#2,021 |
| 46. | 36483 | 24.5% | 11.0% (+13.5)#46 | 9.8% (+14.7)#2,059 |
| 47. | 35740 | 24.2% | 11.0% (+13.2)#47 | 9.8% (+14.4)#2,112 |
| 48. | 35973 | 24.2% | 11.0% (+13.2)#48 | 9.8% (+14.4)#2,115 |
| 49. | 36916 | 23.8% | 11.0% (+12.8)#49 | 9.8% (+14.0)#2,194 |
| 50. | 35564 | 23.7% | 11.0% (+12.7)#50 | 9.8% (+13.9)#2,213 |
| 51. | 35619 | 23.5% | 11.0% (+12.5)#51 | 9.8% (+13.7)#2,264 |
| 52. | 36273 | 23.1% | 11.0% (+12.1)#52 | 9.8% (+13.4)#2,353 |
| 53. | 36317 | 22.5% | 11.0% (+11.5)#53 | 9.8% (+12.7)#2,507 |
| 54. | 36451 | 22.4% | 11.0% (+11.4)#54 | 9.8% (+12.7)#2,521 |
| 55. | 36048 | 22.3% | 11.0% (+11.3)#55 | 9.8% (+12.6)#2,546 |
| 56. | 35091 | 22.2% | 11.0% (+11.2)#56 | 9.8% (+12.4)#2,567 |
| 57. | 35671 | 22.2% | 11.0% (+11.2)#57 | 9.8% (+12.4)#2,572 |
| 58. | 35453 | 22.1% | 11.0% (+11.1)#58 | 9.8% (+12.3)#2,632 |
| 59. | 36560 | 21.9% | 11.0% (+11.0)#59 | 9.8% (+12.2)#2,657 |
| 60. | 36033 | 21.6% | 11.0% (+10.7)#60 | 9.8% (+11.9)#2,740 |
| 61. | 35771 | 21.6% | 11.0% (+10.6)#61 | 9.8% (+11.8)#2,753 |
| 62. | 36323 | 21.5% | 11.0% (+10.6)#62 | 9.8% (+11.8)#2,771 |
| 63. | 35133 | 21.2% | 11.0% (+10.2)#63 | 9.8% (+11.4)#2,880 |
| 64. | 36919 | 21.1% | 11.0% (+10.1)#64 | 9.8% (+11.3)#2,925 |
| 65. | 36436 | 21.1% | 11.0% (+10.1)#65 | 9.8% (+11.3)#2,946 |
| 66. | 36522 | 21.0% | 11.0% (+9.99)#66 | 9.8% (+11.2)#2,967 |
| 67. | 35089 | 20.8% | 11.0% (+9.84)#67 | 9.8% (+11.1)#3,020 |
| 68. | 36759 | 20.6% | 11.0% (+9.60)#68 | 9.8% (+10.8)#3,116 |
| 69. | 35405 | 20.6% | 11.0% (+9.57)#69 | 9.8% (+10.8)#3,124 |
| 70. | 35570 | 20.5% | 11.0% (+9.49)#70 | 9.8% (+10.7)#3,148 |
| 71. | 36555 | 20.4% | 11.0% (+9.41)#71 | 9.8% (+10.6)#3,181 |
| 72. | 35064 | 20.3% | 11.0% (+9.35)#72 | 9.8% (+10.6)#3,203 |
| 73. | 36530 | 20.3% | 11.0% (+9.30)#73 | 9.8% (+10.5)#3,227 |
| 74. | 36028 | 20.2% | 11.0% (+9.25)#74 | 9.8% (+10.5)#3,246 |
| 75. | 36475 | 20.2% | 11.0% (+9.25)#75 | 9.8% (+10.5)#3,251 |
| 76. | 36256 | 19.9% | 11.0% (+8.89)#76 | 9.8% (+10.1)#3,420 |
| 77. | 36251 | 19.8% | 11.0% (+8.85)#77 | 9.8% (+10.1)#3,438 |
| 78. | 36016 | 19.8% | 11.0% (+8.84)#78 | 9.8% (+10.0)#3,445 |
| 79. | 36863 | 19.7% | 11.0% (+8.75)#79 | 9.8% (+9.96)#3,467 |
| 80. | 35079 | 19.6% | 11.0% (+8.63)#80 | 9.8% (+9.84)#3,506 |
| 81. | 36268 | 19.4% | 11.0% (+8.44)#81 | 9.8% (+9.64)#3,603 |
| 82. | 36041 | 19.3% | 11.0% (+8.34)#82 | 9.8% (+9.55)#3,639 |
| 83. | 35622 | 19.3% | 11.0% (+8.33)#83 | 9.8% (+9.54)#3,641 |
| 84. | 35116 | 19.3% | 11.0% (+8.27)#84 | 9.8% (+9.48)#3,668 |
| 85. | 35746 | 19.2% | 11.0% (+8.24)#85 | 9.8% (+9.45)#3,692 |
| 86. | 35217 | 19.0% | 11.0% (+8.05)#86 | 9.8% (+9.26)#3,789 |
| 87. | 36042 | 18.8% | 11.0% (+7.76)#87 | 9.8% (+8.97)#3,912 |
| 88. | 35544 | 18.7% | 11.0% (+7.73)#88 | 9.8% (+8.94)#3,934 |
| 89. | 35442 | 18.6% | 11.0% (+7.59)#89 | 9.8% (+8.80)#4,003 |
| 90. | 35151 | 18.3% | 11.0% (+7.31)#90 | 9.8% (+8.52)#4,134 |
| 91. | 35117 | 18.3% | 11.0% (+7.31)#91 | 9.8% (+8.52)#4,136 |
| 92. | 35135 | 18.3% | 11.0% (+7.28)#92 | 9.8% (+8.49)#4,148 |
| 93. | 36904 | 18.2% | 11.0% (+7.25)#93 | 9.8% (+8.46)#4,161 |
| 94. | 35975 | 18.0% | 11.0% (+7.02)#94 | 9.8% (+8.23)#4,313 |
| 95. | 36862 | 18.0% | 11.0% (+7.01)#95 | 9.8% (+8.22)#4,324 |
| 96. | 36525 | 17.9% | 11.0% (+6.94)#96 | 9.8% (+8.15)#4,366 |
| 97. | 36477 | 17.9% | 11.0% (+6.92)#97 | 9.8% (+8.13)#4,372 |
| 98. | 35907 | 17.8% | 11.0% (+6.77)#98 | 9.8% (+7.98)#4,446 |
| 99. | 36858 | 17.7% | 11.0% (+6.75)#99 | 9.8% (+7.96)#4,456 |
| 100. | 35653 | 17.7% | 11.0% (+6.72)#100 | 9.8% (+7.93)#4,472 |
Common Questions
What are the Top 10 Zip Codes with the Highest Percentage of Population with a Degree in Science and Engineering in Alabama?
Top 10 Zip Codes with the Highest Percentage of Population with a Degree in Science and Engineering in Alabama are:
What zip code has the Highest Percentage of Population with a Degree in Science and Engineering in Alabama?
36773 has the Highest Percentage of Population with a Degree in Science and Engineering in Alabama with 100.0%.
What is the Percentage of Population with a Degree in Science and Engineering in the State of Alabama?
Percentage of Population with a Degree in Science and Engineering in Alabama is 11.0%.
What is the Percentage of Population with a Degree in Science and Engineering in the United States?
Percentage of Population with a Degree in Science and Engineering in the United States is 9.8%.