Zip Codes with the Highest Percentage of Households with Income Above $200,000 in Alabama
RELATED REPORTS & OPTIONS
Household Income | $200k+
Alabama
Compare Zip Codes
Map of Zip Codes with the Highest Percentage of Households with Income Above $200,000 in Alabama
0.0%
50.0%
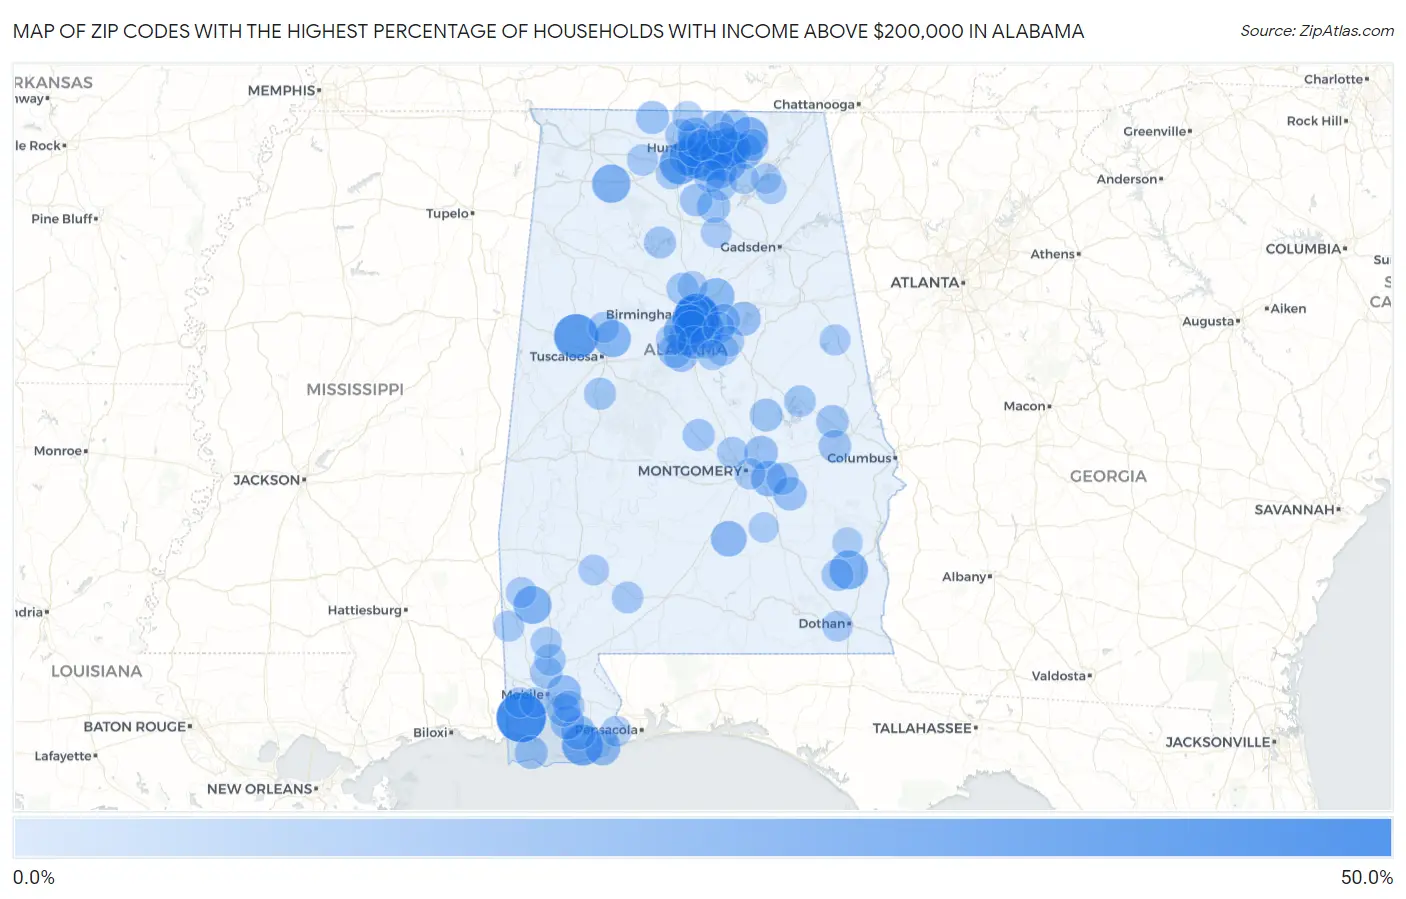
Zip Codes with the Highest Percentage of Households with Income Above $200,000 in Alabama
| Zip Code | Households with Income > $200k | vs State | vs National | |
| 1. | 36568 | 44.4% | 6.5% (+37.9)#1 | 11.4% (+33.0)#451 |
| 2. | 35223 | 37.0% | 6.5% (+30.5)#2 | 11.4% (+25.6)#837 |
| 3. | 35213 | 35.6% | 6.5% (+29.1)#3 | 11.4% (+24.2)#928 |
| 4. | 35458 | 34.6% | 6.5% (+28.1)#4 | 11.4% (+23.2)#1,007 |
| 5. | 36511 | 28.1% | 6.5% (+21.6)#5 | 11.4% (+16.7)#1,715 |
| 6. | 35649 | 27.8% | 6.5% (+21.3)#6 | 11.4% (+16.4)#1,767 |
| 7. | 35741 | 27.6% | 6.5% (+21.1)#7 | 11.4% (+16.2)#1,786 |
| 8. | 35808 | 24.9% | 6.5% (+18.4)#8 | 11.4% (+13.5)#2,215 |
| 9. | 35242 | 24.8% | 6.5% (+18.3)#9 | 11.4% (+13.4)#2,219 |
| 10. | 36317 | 23.5% | 6.5% (+17.0)#10 | 11.4% (+12.1)#2,473 |
| 11. | 35751 | 22.9% | 6.5% (+16.4)#11 | 11.4% (+11.5)#2,587 |
| 12. | 35651 | 22.8% | 6.5% (+16.3)#12 | 11.4% (+11.4)#2,614 |
| 13. | 35243 | 22.7% | 6.5% (+16.2)#13 | 11.4% (+11.3)#2,624 |
| 14. | 36583 | 22.1% | 6.5% (+15.6)#14 | 11.4% (+10.7)#2,762 |
| 15. | 35763 | 21.7% | 6.5% (+15.2)#15 | 11.4% (+10.3)#2,846 |
| 16. | 35226 | 21.6% | 6.5% (+15.1)#16 | 11.4% (+10.2)#2,865 |
| 17. | 35824 | 21.2% | 6.5% (+14.7)#17 | 11.4% (+9.80)#2,971 |
| 18. | 35406 | 20.2% | 6.5% (+13.7)#18 | 11.4% (+8.80)#3,233 |
| 19. | 35756 | 19.9% | 6.5% (+13.4)#19 | 11.4% (+8.50)#3,316 |
| 20. | 35801 | 19.1% | 6.5% (+12.6)#20 | 11.4% (+7.70)#3,536 |
| 21. | 35173 | 19.0% | 6.5% (+12.5)#21 | 11.4% (+7.60)#3,563 |
| 22. | 35244 | 18.1% | 6.5% (+11.6)#22 | 11.4% (+6.70)#3,808 |
| 23. | 36561 | 18.0% | 6.5% (+11.5)#23 | 11.4% (+6.60)#3,854 |
| 24. | 36042 | 17.8% | 6.5% (+11.3)#24 | 11.4% (+6.40)#3,924 |
| 25. | 36064 | 17.5% | 6.5% (+11.0)#25 | 11.4% (+6.10)#4,020 |
| 26. | 35764 | 17.5% | 6.5% (+11.0)#26 | 11.4% (+6.10)#4,033 |
| 27. | 35759 | 17.2% | 6.5% (+10.7)#27 | 11.4% (+5.80)#4,116 |
| 28. | 35748 | 16.9% | 6.5% (+10.4)#28 | 11.4% (+5.50)#4,230 |
| 29. | 35222 | 16.7% | 6.5% (+10.2)#29 | 11.4% (+5.30)#4,298 |
| 30. | 35749 | 15.9% | 6.5% (+9.40)#30 | 11.4% (+4.50)#4,603 |
| 31. | 36527 | 15.9% | 6.5% (+9.40)#31 | 11.4% (+4.50)#4,607 |
| 32. | 35758 | 15.7% | 6.5% (+9.20)#32 | 11.4% (+4.30)#4,682 |
| 33. | 36555 | 15.5% | 6.5% (+9.00)#33 | 11.4% (+4.10)#4,787 |
| 34. | 36532 | 14.7% | 6.5% (+8.20)#34 | 11.4% (+3.30)#5,117 |
| 35. | 35054 | 14.7% | 6.5% (+8.20)#35 | 11.4% (+3.30)#5,145 |
| 36. | 35803 | 14.6% | 6.5% (+8.10)#36 | 11.4% (+3.20)#5,178 |
| 37. | 35209 | 14.4% | 6.5% (+7.90)#37 | 11.4% (+3.00)#5,256 |
| 38. | 35114 | 14.3% | 6.5% (+7.80)#38 | 11.4% (+2.90)#5,315 |
| 39. | 35080 | 14.0% | 6.5% (+7.50)#39 | 11.4% (+2.60)#5,469 |
| 40. | 36029 | 14.0% | 6.5% (+7.50)#40 | 11.4% (+2.60)#5,496 |
| 41. | 35216 | 13.8% | 6.5% (+7.30)#41 | 11.4% (+2.40)#5,560 |
| 42. | 36093 | 13.7% | 6.5% (+7.20)#42 | 11.4% (+2.30)#5,634 |
| 43. | 35757 | 13.4% | 6.5% (+6.90)#43 | 11.4% (+2.00)#5,793 |
| 44. | 35087 | 13.3% | 6.5% (+6.80)#44 | 11.4% (+1.90)#5,867 |
| 45. | 36559 | 13.3% | 6.5% (+6.80)#45 | 11.4% (+1.90)#5,879 |
| 46. | 35647 | 13.2% | 6.5% (+6.70)#46 | 11.4% (+1.80)#5,932 |
| 47. | 36528 | 13.0% | 6.5% (+6.50)#47 | 11.4% (+1.60)#6,043 |
| 48. | 35124 | 12.8% | 6.5% (+6.30)#48 | 11.4% (+1.40)#6,131 |
| 49. | 36026 | 12.6% | 6.5% (+6.10)#49 | 11.4% (+1.20)#6,305 |
| 50. | 36879 | 12.3% | 6.5% (+5.80)#50 | 11.4% (+0.900)#6,499 |
| 51. | 35621 | 12.2% | 6.5% (+5.70)#51 | 11.4% (+0.800)#6,552 |
| 52. | 35802 | 12.1% | 6.5% (+5.60)#52 | 11.4% (+0.700)#6,606 |
| 53. | 36830 | 12.0% | 6.5% (+5.50)#53 | 11.4% (+0.600)#6,660 |
| 54. | 35176 | 12.0% | 6.5% (+5.50)#54 | 11.4% (+0.600)#6,707 |
| 55. | 36572 | 11.8% | 6.5% (+5.30)#55 | 11.4% (+0.400)#6,815 |
| 56. | 36013 | 11.5% | 6.5% (+5.00)#56 | 11.4% (+0.100)#7,061 |
| 57. | 35043 | 11.4% | 6.5% (+4.90)#57 | 11.4% (=0.000)#7,093 |
| 58. | 35754 | 11.4% | 6.5% (+4.90)#58 | 11.4% (=0.000)#7,104 |
| 59. | 36006 | 11.4% | 6.5% (+4.90)#59 | 11.4% (=0.000)#7,117 |
| 60. | 35613 | 11.2% | 6.5% (+4.70)#60 | 11.4% (-0.200)#7,235 |
| 61. | 35071 | 11.1% | 6.5% (+4.60)#61 | 11.4% (-0.300)#7,318 |
| 62. | 36374 | 11.1% | 6.5% (+4.60)#62 | 11.4% (-0.300)#7,369 |
| 63. | 35774 | 11.1% | 6.5% (+4.60)#63 | 11.4% (-0.300)#7,377 |
| 64. | 35474 | 11.0% | 6.5% (+4.50)#64 | 11.4% (-0.400)#7,425 |
| 65. | 35053 | 11.0% | 6.5% (+4.50)#65 | 11.4% (-0.400)#7,449 |
| 66. | 35806 | 10.7% | 6.5% (+4.20)#66 | 11.4% (-0.700)#7,618 |
| 67. | 35147 | 10.6% | 6.5% (+4.10)#67 | 11.4% (-0.800)#7,726 |
| 68. | 36861 | 10.5% | 6.5% (+4.00)#68 | 11.4% (-0.900)#7,818 |
| 69. | 36505 | 10.3% | 6.5% (+3.80)#69 | 11.4% (-1.10)#8,013 |
| 70. | 36439 | 10.3% | 6.5% (+3.80)#70 | 11.4% (-1.10)#8,034 |
| 71. | 36526 | 10.2% | 6.5% (+3.70)#71 | 11.4% (-1.20)#8,052 |
| 72. | 35186 | 10.0% | 6.5% (+3.50)#72 | 11.4% (-1.40)#8,281 |
| 73. | 36111 | 9.6% | 6.5% (+3.10)#73 | 11.4% (-1.80)#8,648 |
| 74. | 35475 | 9.5% | 6.5% (+3.00)#74 | 11.4% (-1.90)#8,731 |
| 75. | 35175 | 9.5% | 6.5% (+3.00)#75 | 11.4% (-1.90)#8,768 |
| 76. | 35643 | 9.5% | 6.5% (+3.00)#76 | 11.4% (-1.90)#8,770 |
| 77. | 36560 | 9.4% | 6.5% (+2.90)#77 | 11.4% (-2.00)#8,882 |
| 78. | 36066 | 9.3% | 6.5% (+2.80)#78 | 11.4% (-2.10)#8,940 |
| 79. | 36584 | 9.3% | 6.5% (+2.80)#79 | 11.4% (-2.10)#8,999 |
| 80. | 35761 | 9.2% | 6.5% (+2.70)#80 | 11.4% (-2.20)#9,059 |
| 81. | 35603 | 9.1% | 6.5% (+2.60)#81 | 11.4% (-2.30)#9,133 |
| 82. | 35811 | 9.1% | 6.5% (+2.60)#82 | 11.4% (-2.30)#9,138 |
| 83. | 36278 | 9.0% | 6.5% (+2.50)#83 | 11.4% (-2.40)#9,256 |
| 84. | 35078 | 9.0% | 6.5% (+2.50)#84 | 11.4% (-2.40)#9,272 |
| 85. | 35031 | 8.9% | 6.5% (+2.40)#85 | 11.4% (-2.50)#9,345 |
| 86. | 36518 | 8.9% | 6.5% (+2.40)#86 | 11.4% (-2.50)#9,371 |
| 87. | 35022 | 8.8% | 6.5% (+2.30)#87 | 11.4% (-2.60)#9,427 |
| 88. | 36305 | 8.7% | 6.5% (+2.20)#88 | 11.4% (-2.70)#9,541 |
| 89. | 36549 | 8.6% | 6.5% (+2.10)#89 | 11.4% (-2.80)#9,678 |
| 90. | 35975 | 8.6% | 6.5% (+2.10)#90 | 11.4% (-2.80)#9,706 |
| 91. | 36482 | 8.5% | 6.5% (+2.00)#91 | 11.4% (-2.90)#9,830 |
| 92. | 35739 | 8.2% | 6.5% (+1.70)#92 | 11.4% (-3.20)#10,137 |
| 93. | 35755 | 8.2% | 6.5% (+1.70)#93 | 11.4% (-3.20)#10,196 |
| 94. | 36695 | 8.1% | 6.5% (+1.60)#94 | 11.4% (-3.30)#10,215 |
| 95. | 35116 | 8.1% | 6.5% (+1.60)#95 | 11.4% (-3.30)#10,274 |
| 96. | 35051 | 8.0% | 6.5% (+1.50)#96 | 11.4% (-3.40)#10,395 |
| 97. | 35747 | 8.0% | 6.5% (+1.50)#97 | 11.4% (-3.40)#10,404 |
| 98. | 36693 | 7.9% | 6.5% (+1.40)#98 | 11.4% (-3.50)#10,505 |
| 99. | 36016 | 7.9% | 6.5% (+1.40)#99 | 11.4% (-3.50)#10,534 |
| 100. | 36036 | 7.9% | 6.5% (+1.40)#100 | 11.4% (-3.50)#10,563 |
Common Questions
What are the Top 10 Zip Codes with the Highest Percentage of Households with Income Above $200,000 in Alabama?
Top 10 Zip Codes with the Highest Percentage of Households with Income Above $200,000 in Alabama are:
What zip code has the Highest Percentage of Households with Income Above $200,000 in Alabama?
36568 has the Highest Percentage of Households with Income Above $200,000 in Alabama with 44.4%.
What is the Percentage of Households with Income Above $200,000 in the State of Alabama?
Percentage of Households with Income Above $200,000 in Alabama is 6.5%.
What is the Percentage of Households with Income Above $200,000 in the United States?
Percentage of Households with Income Above $200,000 in the United States is 11.4%.