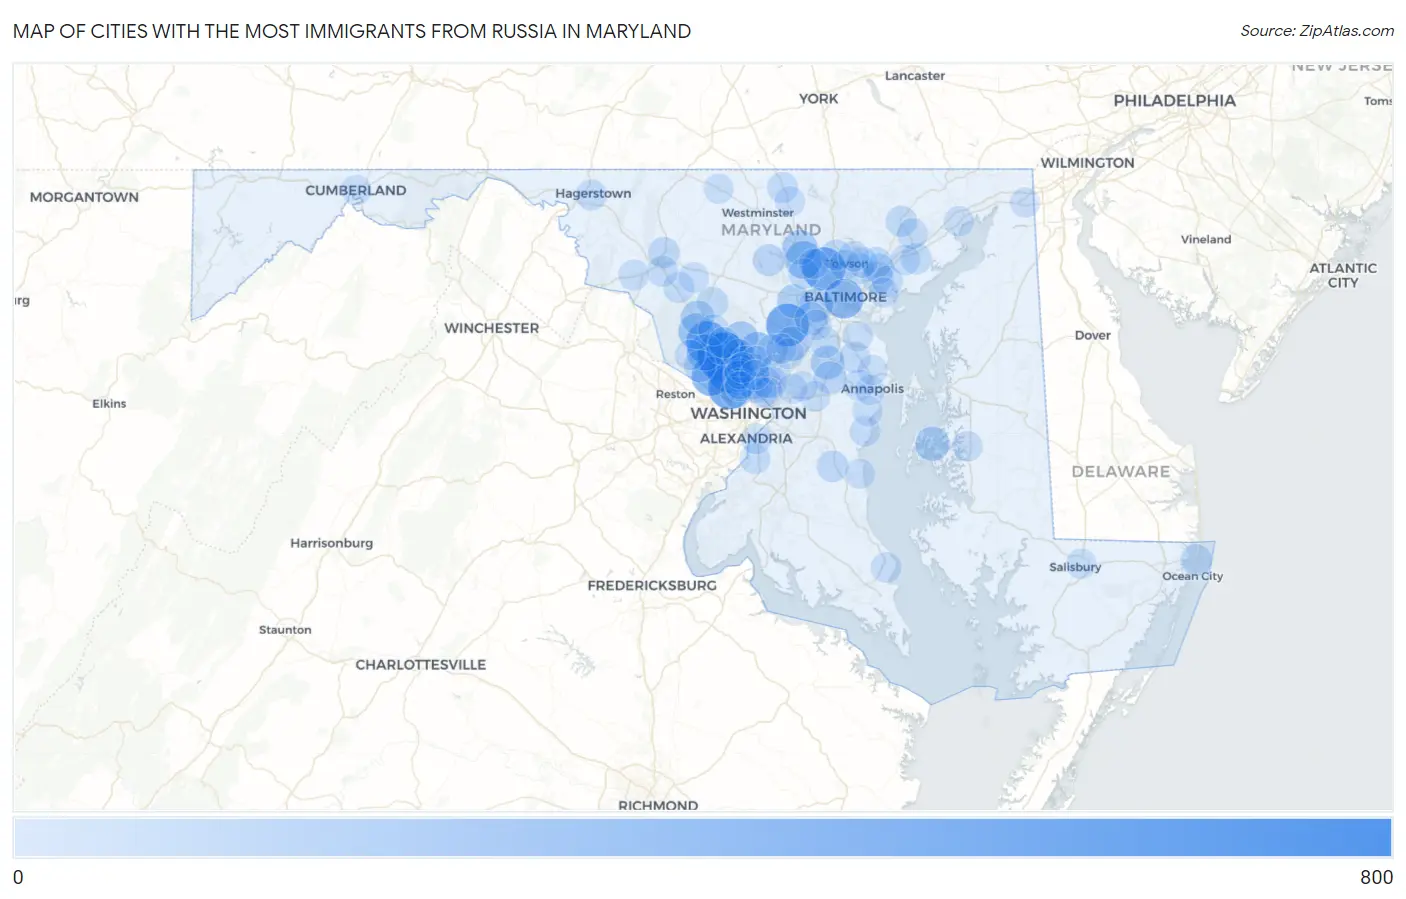
Cities with the Most Immigrants from Russia in Maryland
RELATED REPORTS & OPTIONS
Russia
Maryland
Compare Cities
Map of Cities with the Most Immigrants from Russia in Maryland
0
800
Cities with the Most Immigrants from Russia in Maryland
| City | Russia | vs State | vs National | |
| 1. | Rockville | 677 | 9,481(7.14%)#1 | 406,732(0.17%)#54 |
| 2. | North Bethesda | 545 | 9,481(5.75%)#2 | 406,732(0.13%)#78 |
| 3. | Bethesda | 460 | 9,481(4.85%)#3 | 406,732(0.11%)#103 |
| 4. | Pikesville | 449 | 9,481(4.74%)#4 | 406,732(0.11%)#104 |
| 5. | Columbia | 435 | 9,481(4.59%)#5 | 406,732(0.11%)#108 |
| 6. | Gaithersburg | 430 | 9,481(4.54%)#6 | 406,732(0.11%)#113 |
| 7. | Baltimore | 324 | 9,481(3.42%)#7 | 406,732(0.08%)#158 |
| 8. | Potomac | 322 | 9,481(3.40%)#8 | 406,732(0.08%)#161 |
| 9. | Owings Mills | 253 | 9,481(2.67%)#9 | 406,732(0.06%)#201 |
| 10. | North Potomac | 214 | 9,481(2.26%)#10 | 406,732(0.05%)#246 |
| 11. | Germantown | 202 | 9,481(2.13%)#11 | 406,732(0.05%)#268 |
| 12. | Cloverly | 198 | 9,481(2.09%)#12 | 406,732(0.05%)#277 |
| 13. | Olney | 165 | 9,481(1.74%)#13 | 406,732(0.04%)#351 |
| 14. | Reisterstown | 163 | 9,481(1.72%)#14 | 406,732(0.04%)#359 |
| 15. | North Laurel | 160 | 9,481(1.69%)#15 | 406,732(0.04%)#362 |
| 16. | St Michaels | 146 | 9,481(1.54%)#16 | 406,732(0.04%)#400 |
| 17. | Odenton | 133 | 9,481(1.40%)#17 | 406,732(0.03%)#430 |
| 18. | Catonsville | 125 | 9,481(1.32%)#18 | 406,732(0.03%)#459 |
| 19. | Ellicott City | 123 | 9,481(1.30%)#19 | 406,732(0.03%)#466 |
| 20. | Clarksburg | 123 | 9,481(1.30%)#20 | 406,732(0.03%)#470 |
| 21. | Silver Spring | 120 | 9,481(1.27%)#21 | 406,732(0.03%)#480 |
| 22. | Ilchester | 111 | 9,481(1.17%)#22 | 406,732(0.03%)#524 |
| 23. | Kemp Mill | 101 | 9,481(1.07%)#23 | 406,732(0.02%)#582 |
| 24. | Crofton | 81 | 9,481(0.85%)#24 | 406,732(0.02%)#711 |
| 25. | Derwood | 72 | 9,481(0.76%)#25 | 406,732(0.02%)#787 |
| 26. | Eldersburg | 71 | 9,481(0.75%)#26 | 406,732(0.02%)#794 |
| 27. | Travilah | 71 | 9,481(0.75%)#27 | 406,732(0.02%)#798 |
| 28. | North Kensington | 69 | 9,481(0.73%)#28 | 406,732(0.02%)#820 |
| 29. | Aspen Hill | 67 | 9,481(0.71%)#29 | 406,732(0.02%)#839 |
| 30. | College Park | 66 | 9,481(0.70%)#30 | 406,732(0.02%)#863 |
| 31. | Dunkirk | 59 | 9,481(0.62%)#31 | 406,732(0.01%)#953 |
| 32. | Burtonsville | 58 | 9,481(0.61%)#32 | 406,732(0.01%)#962 |
| 33. | Frederick | 55 | 9,481(0.58%)#33 | 406,732(0.01%)#1,005 |
| 34. | Ocean City | 54 | 9,481(0.57%)#34 | 406,732(0.01%)#1,034 |
| 35. | Rossville | 53 | 9,481(0.56%)#35 | 406,732(0.01%)#1,050 |
| 36. | Bel Air North | 43 | 9,481(0.45%)#36 | 406,732(0.01%)#1,252 |
| 37. | Damascus | 43 | 9,481(0.45%)#37 | 406,732(0.01%)#1,255 |
| 38. | Perry Hall | 42 | 9,481(0.44%)#38 | 406,732(0.01%)#1,284 |
| 39. | Mays Chapel | 41 | 9,481(0.43%)#39 | 406,732(0.01%)#1,321 |
| 40. | Severn | 40 | 9,481(0.42%)#40 | 406,732(0.01%)#1,340 |
| 41. | Severna Park | 40 | 9,481(0.42%)#41 | 406,732(0.01%)#1,343 |
| 42. | Edgewood | 40 | 9,481(0.42%)#42 | 406,732(0.01%)#1,348 |
| 43. | Montgomery Village | 39 | 9,481(0.41%)#43 | 406,732(0.01%)#1,370 |
| 44. | Parkville | 39 | 9,481(0.41%)#44 | 406,732(0.01%)#1,371 |
| 45. | Redland | 39 | 9,481(0.41%)#45 | 406,732(0.01%)#1,377 |
| 46. | Urbana | 39 | 9,481(0.41%)#46 | 406,732(0.01%)#1,378 |
| 47. | Bel Air South | 37 | 9,481(0.39%)#47 | 406,732(0.01%)#1,414 |
| 48. | Woodlawn Cdp Baltimore County | 36 | 9,481(0.38%)#48 | 406,732(0.01%)#1,442 |
| 49. | Ballenger Creek | 36 | 9,481(0.38%)#49 | 406,732(0.01%)#1,447 |
| 50. | South Kensington | 36 | 9,481(0.38%)#50 | 406,732(0.01%)#1,459 |
| 51. | Manchester | 35 | 9,481(0.37%)#51 | 406,732(0.01%)#1,486 |
| 52. | Friendship Heights Village | 35 | 9,481(0.37%)#52 | 406,732(0.01%)#1,489 |
| 53. | Hagerstown | 34 | 9,481(0.36%)#53 | 406,732(0.01%)#1,499 |
| 54. | Randallstown | 34 | 9,481(0.36%)#54 | 406,732(0.01%)#1,503 |
| 55. | Middle River | 34 | 9,481(0.36%)#55 | 406,732(0.01%)#1,504 |
| 56. | Parole | 34 | 9,481(0.36%)#56 | 406,732(0.01%)#1,512 |
| 57. | White Marsh | 34 | 9,481(0.36%)#57 | 406,732(0.01%)#1,522 |
| 58. | Glenmont | 33 | 9,481(0.35%)#58 | 406,732(0.01%)#1,548 |
| 59. | Takoma Park | 32 | 9,481(0.34%)#59 | 406,732(0.01%)#1,579 |
| 60. | Chevy Chase | 32 | 9,481(0.34%)#60 | 406,732(0.01%)#1,588 |
| 61. | Kensington | 32 | 9,481(0.34%)#61 | 406,732(0.01%)#1,597 |
| 62. | Towson | 30 | 9,481(0.32%)#62 | 406,732(0.01%)#1,635 |
| 63. | Carney | 30 | 9,481(0.32%)#63 | 406,732(0.01%)#1,647 |
| 64. | Fort Washington | 30 | 9,481(0.32%)#64 | 406,732(0.01%)#1,650 |
| 65. | Hampton | 29 | 9,481(0.31%)#65 | 406,732(0.01%)#1,694 |
| 66. | Forest Heights | 29 | 9,481(0.31%)#66 | 406,732(0.01%)#1,695 |
| 67. | Adelphi | 27 | 9,481(0.28%)#67 | 406,732(0.01%)#1,753 |
| 68. | Jefferson | 25 | 9,481(0.26%)#68 | 406,732(0.01%)#1,863 |
| 69. | Beltsville | 24 | 9,481(0.25%)#69 | 406,732(0.01%)#1,879 |
| 70. | Colesville | 24 | 9,481(0.25%)#70 | 406,732(0.01%)#1,888 |
| 71. | Bowie | 23 | 9,481(0.24%)#71 | 406,732(0.01%)#1,910 |
| 72. | Wheaton | 23 | 9,481(0.24%)#72 | 406,732(0.01%)#1,912 |
| 73. | Lusby | 23 | 9,481(0.24%)#73 | 406,732(0.01%)#1,961 |
| 74. | Elkridge | 22 | 9,481(0.23%)#74 | 406,732(0.01%)#1,977 |
| 75. | Joppatowne | 22 | 9,481(0.23%)#75 | 406,732(0.01%)#1,988 |
| 76. | Monrovia | 22 | 9,481(0.23%)#76 | 406,732(0.01%)#2,007 |
| 77. | Shady Side | 21 | 9,481(0.22%)#77 | 406,732(0.01%)#2,052 |
| 78. | Laurel | 20 | 9,481(0.21%)#78 | 406,732(0.00%)#2,073 |
| 79. | Easton | 20 | 9,481(0.21%)#79 | 406,732(0.00%)#2,086 |
| 80. | Hyattsville | 19 | 9,481(0.20%)#80 | 406,732(0.00%)#2,137 |
| 81. | Pasadena | 15 | 9,481(0.16%)#81 | 406,732(0.00%)#2,371 |
| 82. | Garrison | 15 | 9,481(0.16%)#82 | 406,732(0.00%)#2,397 |
| 83. | Darnestown | 15 | 9,481(0.16%)#83 | 406,732(0.00%)#2,402 |
| 84. | Salisbury | 14 | 9,481(0.15%)#84 | 406,732(0.00%)#2,435 |
| 85. | Havre De Grace | 13 | 9,481(0.14%)#85 | 406,732(0.00%)#2,540 |
| 86. | Mayo | 12 | 9,481(0.13%)#86 | 406,732(0.00%)#2,634 |
| 87. | West Laurel | 12 | 9,481(0.13%)#87 | 406,732(0.00%)#2,645 |
| 88. | Glenn Dale | 11 | 9,481(0.12%)#88 | 406,732(0.00%)#2,716 |
| 89. | Annapolis | 10 | 9,481(0.11%)#89 | 406,732(0.00%)#2,787 |
| 90. | Arnold | 10 | 9,481(0.11%)#90 | 406,732(0.00%)#2,801 |
| 91. | Cumberland | 10 | 9,481(0.11%)#91 | 406,732(0.00%)#2,809 |
| 92. | Essex | 9 | 9,481(0.09%)#92 | 406,732(0.00%)#2,902 |
| 93. | Seabrook | 9 | 9,481(0.09%)#93 | 406,732(0.00%)#2,925 |
| 94. | Chesapeake Beach | 9 | 9,481(0.09%)#94 | 406,732(0.00%)#2,964 |
| 95. | Hampstead | 9 | 9,481(0.09%)#95 | 406,732(0.00%)#2,965 |
| 96. | Taneytown | 8 | 9,481(0.08%)#96 | 406,732(0.00%)#3,048 |
| 97. | Chevy Chase Section Five | 8 | 9,481(0.08%)#97 | 406,732(0.00%)#3,091 |
| 98. | Chillum | 7 | 9,481(0.07%)#98 | 406,732(0.00%)#3,110 |
| 99. | Elkton | 7 | 9,481(0.07%)#99 | 406,732(0.00%)#3,128 |
| 100. | Four Corners | 7 | 9,481(0.07%)#100 | 406,732(0.00%)#3,139 |
Common Questions
What are the Top 10 Cities with the Most Immigrants from Russia in Maryland?
Top 10 Cities with the Most Immigrants from Russia in Maryland are:
#1
677
#2
545
#3
460
#4
449
#5
435
#6
430
#7
324
#8
322
#9
253
#10
214
What city has the Most Immigrants from Russia in Maryland?
Rockville has the Most Immigrants from Russia in Maryland with 677.
What is the Total Immigrants from Russia in the State of Maryland?
Total Immigrants from Russia in Maryland is 9,481.
What is the Total Immigrants from Russia in the United States?
Total Immigrants from Russia in the United States is 406,732.