Mayo, MD Map & Demographics
Mayo Map

Mayo Overview
$61,983
PER CAPITA INCOME
$148,667
AVG FAMILY INCOME
$138,862
AVG HOUSEHOLD INCOME
24.5%
WAGE / INCOME GAP [ % ]
75.5¢/ $1
WAGE / INCOME GAP [ $ ]
0.39
INEQUALITY / GINI INDEX
8,255
TOTAL POPULATION
4,141
MALE POPULATION
4,114
FEMALE POPULATION
100.66
MALES / 100 FEMALES
99.35
FEMALES / 100 MALES
38.6
MEDIAN AGE
3.1
AVG FAMILY SIZE
2.8
AVG HOUSEHOLD SIZE
4,705
LABOR FORCE [ PEOPLE ]
70.6%
PERCENT IN LABOR FORCE
5.6%
UNEMPLOYMENT RATE
Mayo Area Codes
Income in Mayo
Income Overview in Mayo
Per Capita Income in Mayo is $61,983, while median incomes of families and households are $148,667 and $138,862 respectively.
| Characteristic | Number | Measure |
| Per Capita Income | 8,255 | $61,983 |
| Median Family Income | 2,389 | $148,667 |
| Mean Family Income | 2,389 | $185,431 |
| Median Household Income | 2,968 | $138,862 |
| Mean Household Income | 2,968 | $168,504 |
| Income Deficit | 2,389 | $0 |
| Wage / Income Gap (%) | 8,255 | 24.54% |
| Wage / Income Gap ($) | 8,255 | 75.46¢ per $1 |
| Gini / Inequality Index | 8,255 | 0.39 |
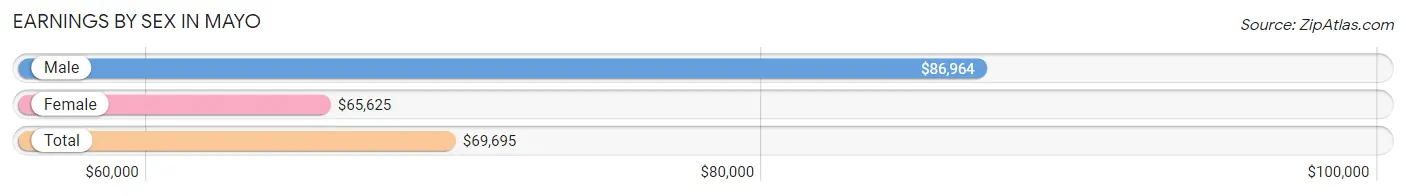
Earnings by Sex in Mayo
Average Earnings in Mayo are $69,695, $86,964 for men and $65,625 for women, a difference of 24.5%.
| Sex | Number | Average Earnings |
| Male | 2,555 (51.2%) | $86,964 |
| Female | 2,432 (48.8%) | $65,625 |
| Total | 4,987 (100.0%) | $69,695 |
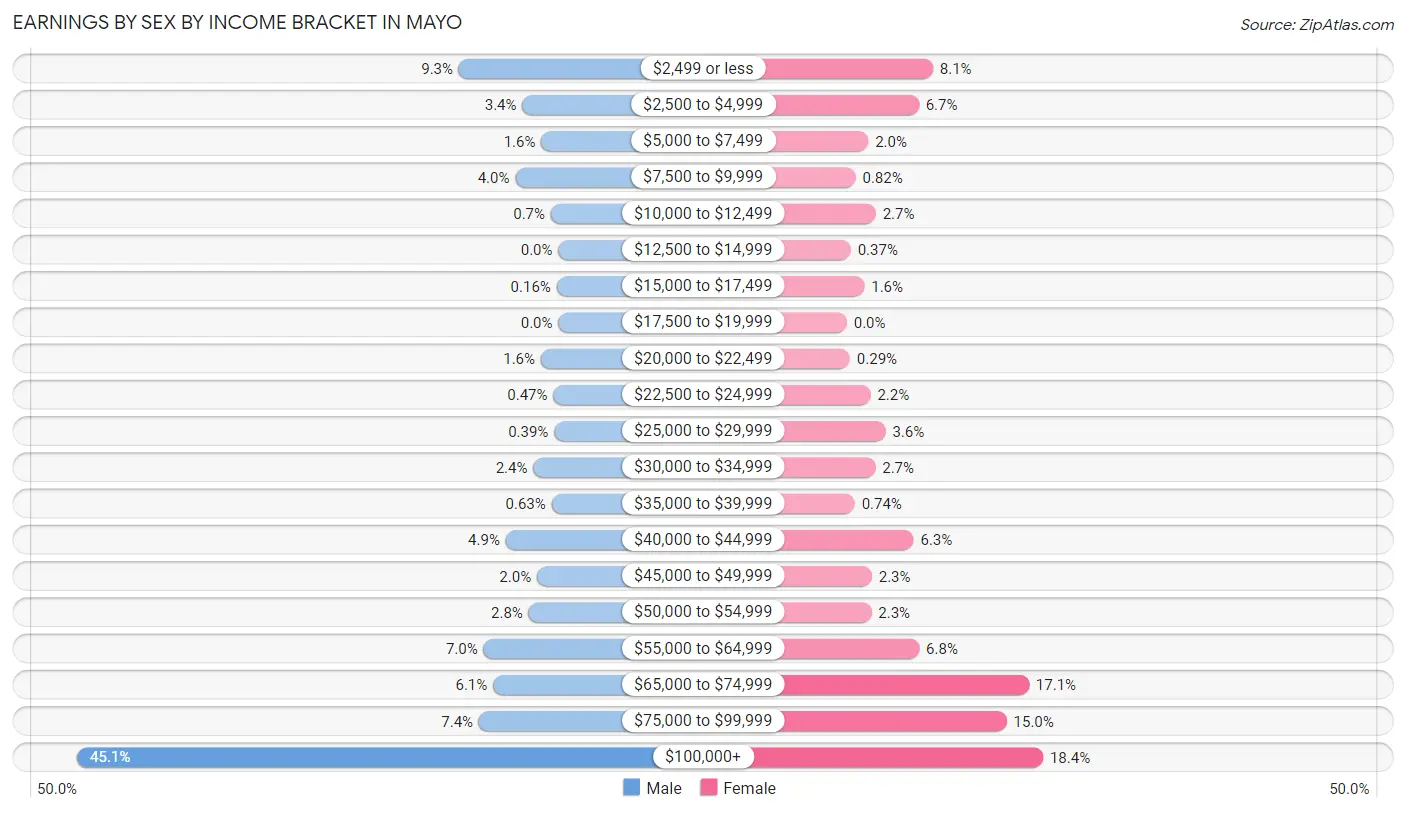
Earnings by Sex by Income Bracket in Mayo
The most common earnings brackets in Mayo are $100,000+ for men (1,152 | 45.1%) and $100,000+ for women (447 | 18.4%).
| Income | Male | Female |
| $2,499 or less | 238 (9.3%) | 196 (8.1%) |
| $2,500 to $4,999 | 86 (3.4%) | 164 (6.7%) |
| $5,000 to $7,499 | 41 (1.6%) | 49 (2.0%) |
| $7,500 to $9,999 | 103 (4.0%) | 20 (0.8%) |
| $10,000 to $12,499 | 18 (0.7%) | 66 (2.7%) |
| $12,500 to $14,999 | 0 (0.0%) | 9 (0.4%) |
| $15,000 to $17,499 | 4 (0.2%) | 40 (1.6%) |
| $17,500 to $19,999 | 0 (0.0%) | 0 (0.0%) |
| $20,000 to $22,499 | 42 (1.6%) | 7 (0.3%) |
| $22,500 to $24,999 | 12 (0.5%) | 54 (2.2%) |
| $25,000 to $29,999 | 10 (0.4%) | 88 (3.6%) |
| $30,000 to $34,999 | 60 (2.4%) | 65 (2.7%) |
| $35,000 to $39,999 | 16 (0.6%) | 18 (0.7%) |
| $40,000 to $44,999 | 126 (4.9%) | 152 (6.2%) |
| $45,000 to $49,999 | 51 (2.0%) | 57 (2.3%) |
| $50,000 to $54,999 | 71 (2.8%) | 56 (2.3%) |
| $55,000 to $64,999 | 179 (7.0%) | 165 (6.8%) |
| $65,000 to $74,999 | 156 (6.1%) | 415 (17.1%) |
| $75,000 to $99,999 | 190 (7.4%) | 364 (15.0%) |
| $100,000+ | 1,152 (45.1%) | 447 (18.4%) |
| Total | 2,555 (100.0%) | 2,432 (100.0%) |
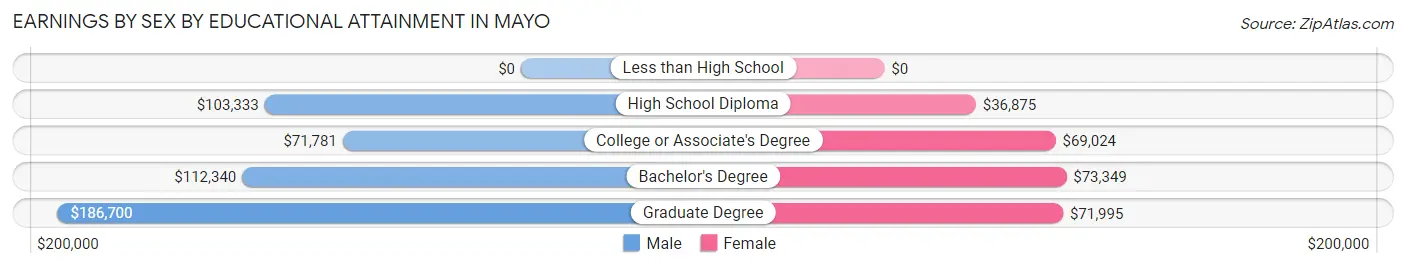
Earnings by Sex by Educational Attainment in Mayo
Average earnings in Mayo are $112,188 for men and $68,692 for women, a difference of 38.8%. Men with an educational attainment of graduate degree enjoy the highest average annual earnings of $186,700, while those with college or associate's degree education earn the least with $71,781. Women with an educational attainment of bachelor's degree earn the most with the average annual earnings of $73,349, while those with high school diploma education have the smallest earnings of $36,875.
| Educational Attainment | Male Income | Female Income |
| Less than High School | - | - |
| High School Diploma | $103,333 | $36,875 |
| College or Associate's Degree | $71,781 | $69,024 |
| Bachelor's Degree | $112,340 | $73,349 |
| Graduate Degree | $186,700 | $71,995 |
| Total | $112,188 | $68,692 |
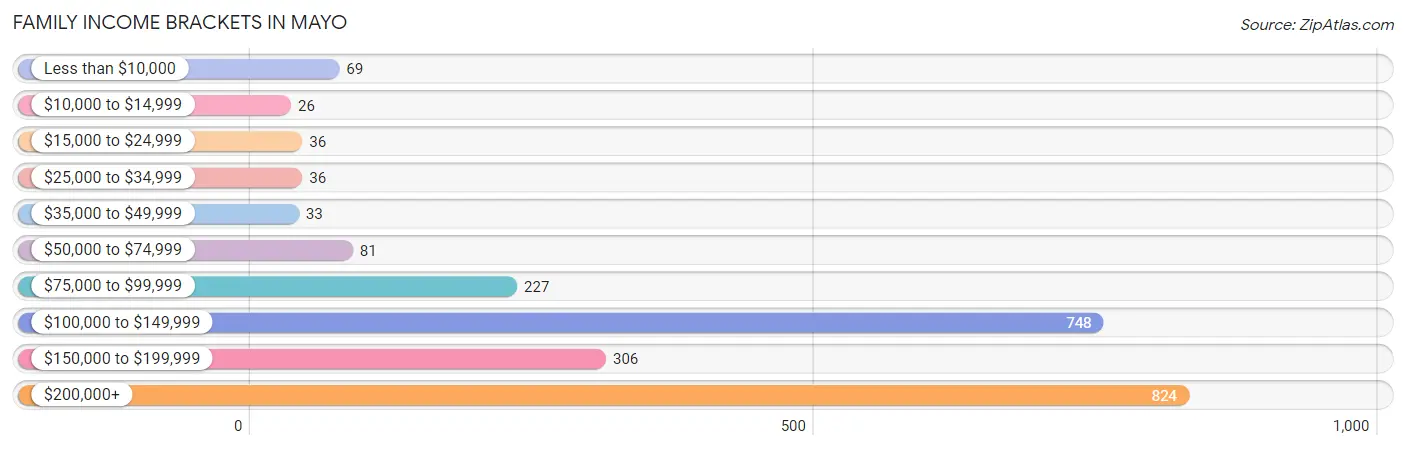
Family Income in Mayo
Family Income Brackets in Mayo
According to the Mayo family income data, there are 824 families falling into the $200,000+ income range, which is the most common income bracket and makes up 34.5% of all families. Conversely, the $10,000 to $14,999 income bracket is the least frequent group with only 26 families (1.1%) belonging to this category.
| Income Bracket | # Families | % Families |
| Less than $10,000 | 69 | 2.9% |
| $10,000 to $14,999 | 26 | 1.1% |
| $15,000 to $24,999 | 36 | 1.5% |
| $25,000 to $34,999 | 36 | 1.5% |
| $35,000 to $49,999 | 33 | 1.4% |
| $50,000 to $74,999 | 81 | 3.4% |
| $75,000 to $99,999 | 227 | 9.5% |
| $100,000 to $149,999 | 748 | 31.3% |
| $150,000 to $199,999 | 306 | 12.8% |
| $200,000+ | 824 | 34.5% |
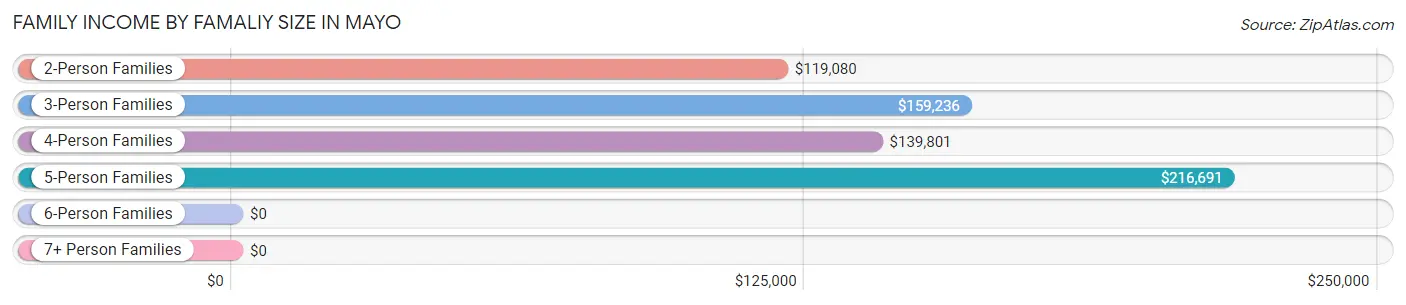
Family Income by Famaliy Size in Mayo
5-person families (291 | 12.2%) account for the highest median family income in Mayo with $216,691 per family, while 2-person families (901 | 37.7%) have the highest median income of $59,540 per family member.
| Income Bracket | # Families | Median Income |
| 2-Person Families | 901 (37.7%) | $119,080 |
| 3-Person Families | 741 (31.0%) | $159,236 |
| 4-Person Families | 393 (16.5%) | $139,801 |
| 5-Person Families | 291 (12.2%) | $216,691 |
| 6-Person Families | 63 (2.6%) | $0 |
| 7+ Person Families | 0 (0.0%) | $0 |
| Total | 2,389 (100.0%) | $148,667 |
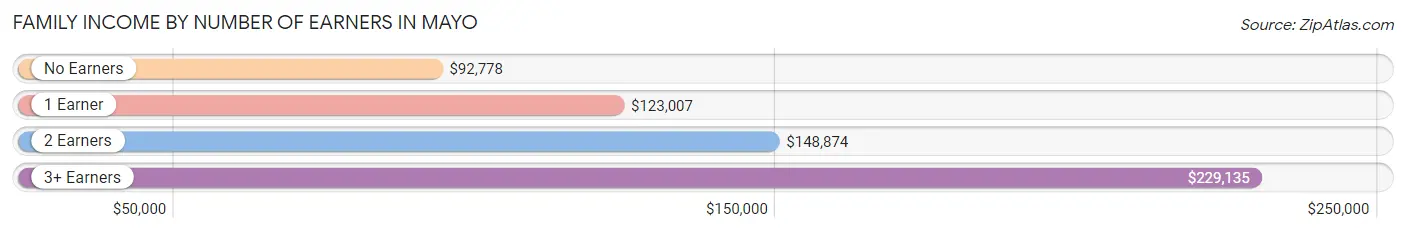
Family Income by Number of Earners in Mayo
The median family income in Mayo is $148,667, with families comprising 3+ earners (385) having the highest median family income of $229,135, while families with no earners (212) have the lowest median family income of $92,778, accounting for 16.1% and 8.9% of families, respectively.
| Number of Earners | # Families | Median Income |
| No Earners | 212 (8.9%) | $92,778 |
| 1 Earner | 515 (21.6%) | $123,007 |
| 2 Earners | 1,277 (53.4%) | $148,874 |
| 3+ Earners | 385 (16.1%) | $229,135 |
| Total | 2,389 (100.0%) | $148,667 |
Household Income in Mayo
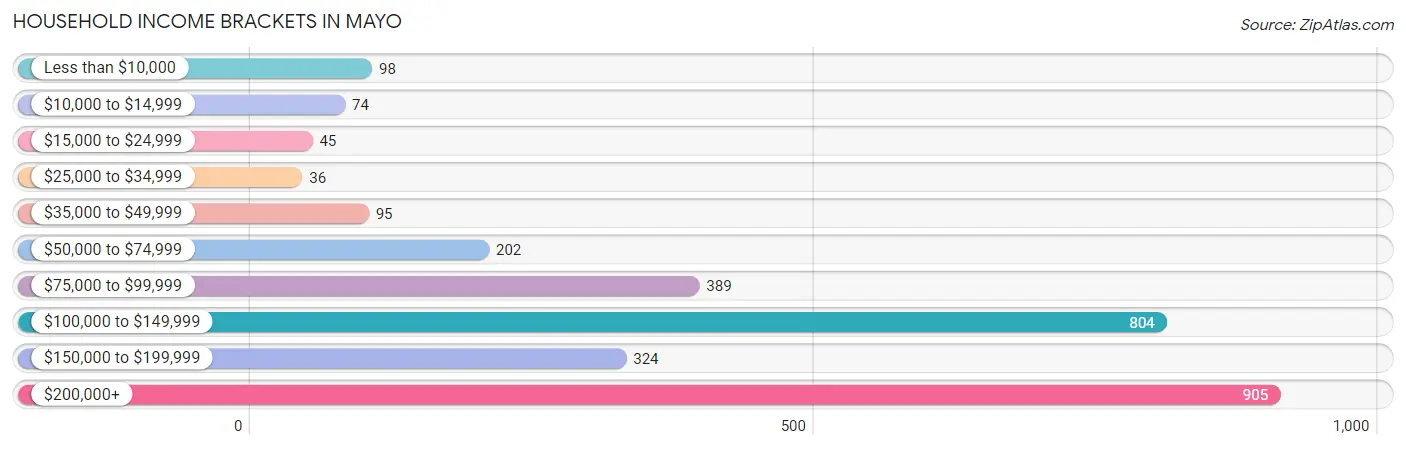
Household Income Brackets in Mayo
With 905 households falling in the category, the $200,000+ income range is the most frequent in Mayo, accounting for 30.5% of all households. In contrast, only 36 households (1.2%) fall into the $25,000 to $34,999 income bracket, making it the least populous group.
| Income Bracket | # Households | % Households |
| Less than $10,000 | 98 | 3.3% |
| $10,000 to $14,999 | 74 | 2.5% |
| $15,000 to $24,999 | 45 | 1.5% |
| $25,000 to $34,999 | 36 | 1.2% |
| $35,000 to $49,999 | 95 | 3.2% |
| $50,000 to $74,999 | 202 | 6.8% |
| $75,000 to $99,999 | 389 | 13.1% |
| $100,000 to $149,999 | 804 | 27.1% |
| $150,000 to $199,999 | 324 | 10.9% |
| $200,000+ | 905 | 30.5% |
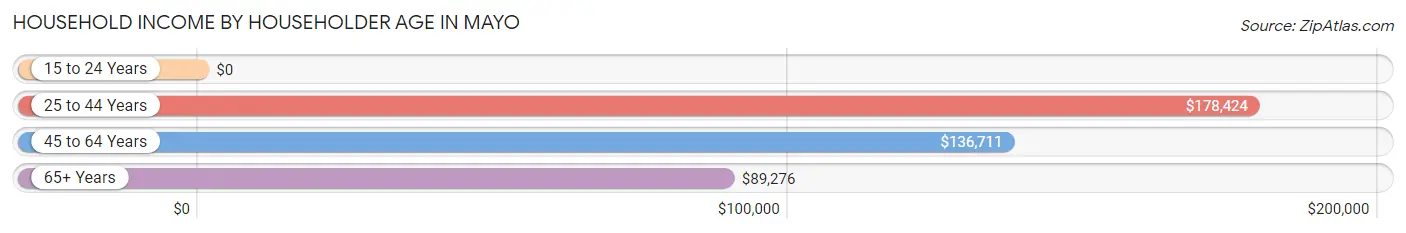
Household Income by Householder Age in Mayo
The median household income in Mayo is $138,862, with the highest median household income of $178,424 found in the 25 to 44 years age bracket for the primary householder. A total of 909 households (30.6%) fall into this category. Meanwhile, the 15 to 24 years age bracket for the primary householder has the lowest median household income of $0, with 79 households (2.7%) in this group.
| Income Bracket | # Households | Median Income |
| 15 to 24 Years | 79 (2.7%) | $0 |
| 25 to 44 Years | 909 (30.6%) | $178,424 |
| 45 to 64 Years | 1,406 (47.4%) | $136,711 |
| 65+ Years | 574 (19.3%) | $89,276 |
| Total | 2,968 (100.0%) | $138,862 |
Poverty in Mayo
Income Below Poverty by Sex and Age in Mayo
With 4.0% poverty level for males and 6.2% for females among the residents of Mayo, 12 to 14 year old males and 16 and 17 year old females are the most vulnerable to poverty, with 12 males (14.1%) and 28 females (20.4%) in their respective age groups living below the poverty level.
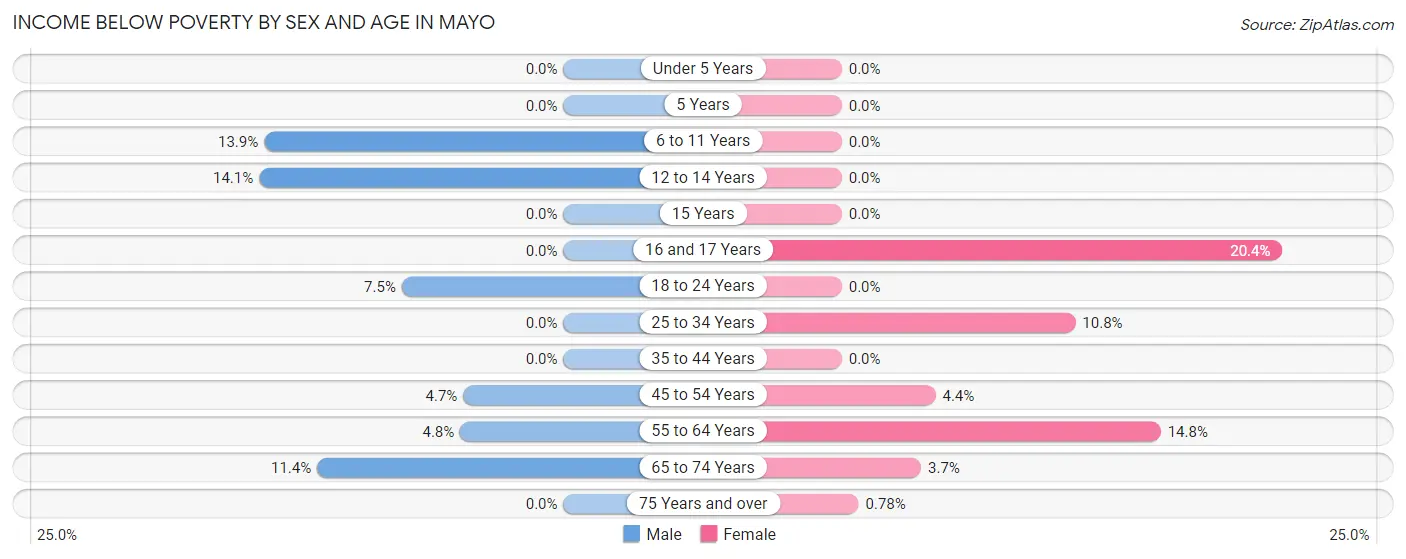
| Age Bracket | Male | Female |
| Under 5 Years | 0 (0.0%) | 0 (0.0%) |
| 5 Years | 0 (0.0%) | 0 (0.0%) |
| 6 to 11 Years | 25 (13.9%) | 0 (0.0%) |
| 12 to 14 Years | 12 (14.1%) | 0 (0.0%) |
| 15 Years | 0 (0.0%) | 0 (0.0%) |
| 16 and 17 Years | 0 (0.0%) | 28 (20.4%) |
| 18 to 24 Years | 47 (7.5%) | 0 (0.0%) |
| 25 to 34 Years | 0 (0.0%) | 71 (10.8%) |
| 35 to 44 Years | 0 (0.0%) | 0 (0.0%) |
| 45 to 54 Years | 30 (4.6%) | 29 (4.3%) |
| 55 to 64 Years | 21 (4.8%) | 115 (14.8%) |
| 65 to 74 Years | 32 (11.4%) | 11 (3.7%) |
| 75 Years and over | 0 (0.0%) | 2 (0.8%) |
| Total | 167 (4.0%) | 256 (6.2%) |
Income Above Poverty by Sex and Age in Mayo
According to the poverty statistics in Mayo, males aged under 5 years and females aged under 5 years are the age groups that are most secure financially, with 100.0% of males and 100.0% of females in these age groups living above the poverty line.
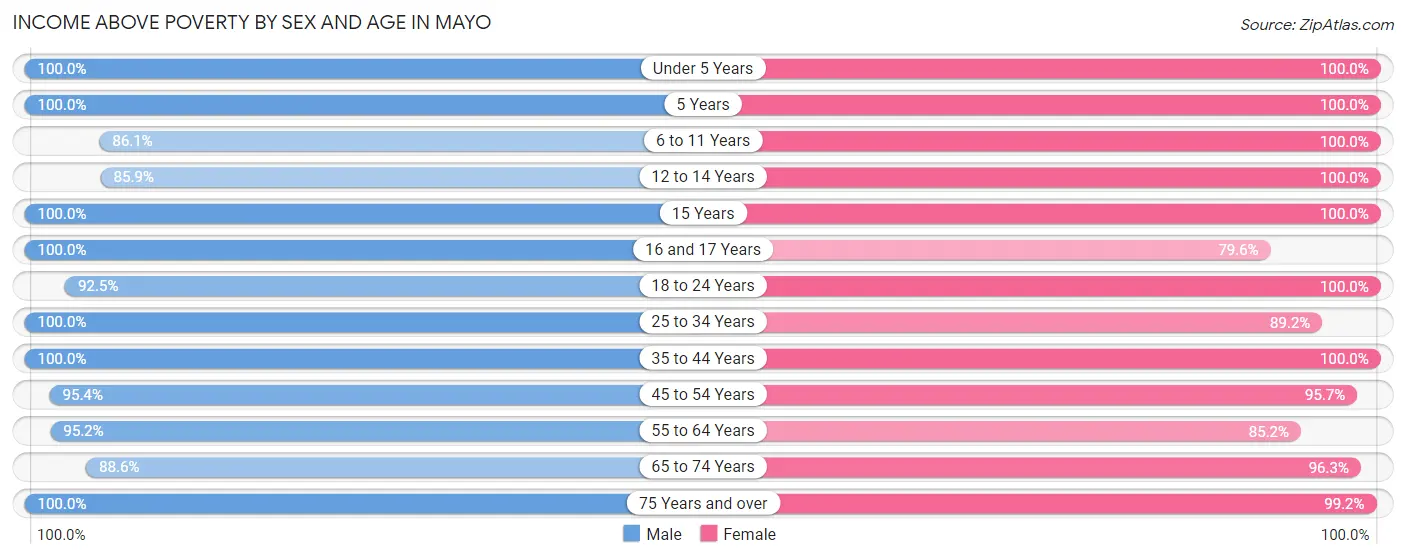
| Age Bracket | Male | Female |
| Under 5 Years | 427 (100.0%) | 345 (100.0%) |
| 5 Years | 23 (100.0%) | 73 (100.0%) |
| 6 to 11 Years | 155 (86.1%) | 167 (100.0%) |
| 12 to 14 Years | 73 (85.9%) | 132 (100.0%) |
| 15 Years | 99 (100.0%) | 60 (100.0%) |
| 16 and 17 Years | 135 (100.0%) | 109 (79.6%) |
| 18 to 24 Years | 580 (92.5%) | 146 (100.0%) |
| 25 to 34 Years | 542 (100.0%) | 584 (89.2%) |
| 35 to 44 Years | 476 (100.0%) | 402 (100.0%) |
| 45 to 54 Years | 615 (95.4%) | 637 (95.7%) |
| 55 to 64 Years | 417 (95.2%) | 662 (85.2%) |
| 65 to 74 Years | 248 (88.6%) | 288 (96.3%) |
| 75 Years and over | 184 (100.0%) | 253 (99.2%) |
| Total | 3,974 (96.0%) | 3,858 (93.8%) |
Income Below Poverty Among Married-Couple Families in Mayo
The poverty statistics for married-couple families in Mayo show that 2.8% or 53 of the total 1,873 families live below the poverty line. Families with no children have the highest poverty rate of 5.7%, comprising of 53 families. On the other hand, families with 1 or 2 children have the lowest poverty rate of 0.0%, which includes 0 families.
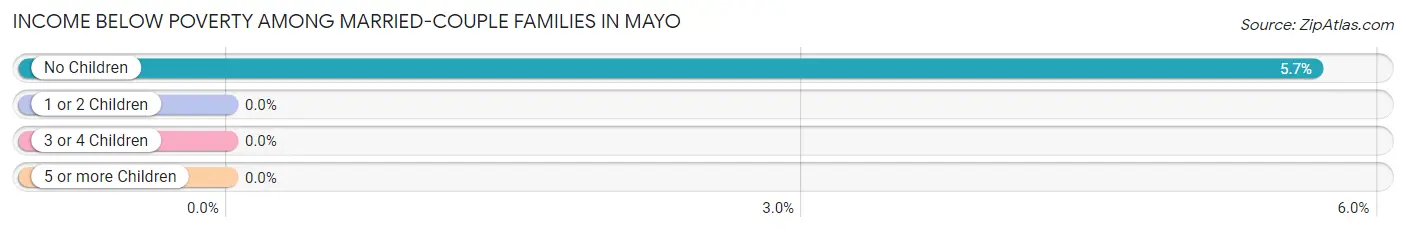
| Children | Above Poverty | Below Poverty |
| No Children | 881 (94.3%) | 53 (5.7%) |
| 1 or 2 Children | 760 (100.0%) | 0 (0.0%) |
| 3 or 4 Children | 179 (100.0%) | 0 (0.0%) |
| 5 or more Children | 0 (0.0%) | 0 (0.0%) |
| Total | 1,820 (97.2%) | 53 (2.8%) |
Income Below Poverty Among Single-Parent Households in Mayo
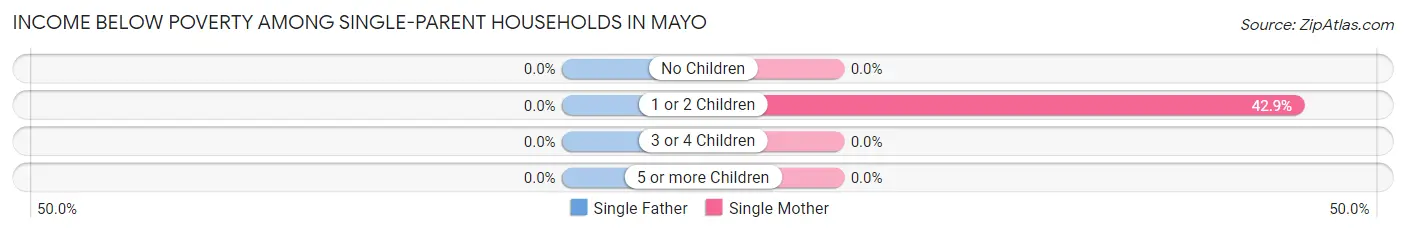
| Children | Single Father | Single Mother |
| No Children | 0 (0.0%) | 0 (0.0%) |
| 1 or 2 Children | 0 (0.0%) | 63 (42.9%) |
| 3 or 4 Children | 0 (0.0%) | 0 (0.0%) |
| 5 or more Children | 0 (0.0%) | 0 (0.0%) |
| Total | 0 (0.0%) | 63 (15.4%) |
Income Below Poverty Among Married-Couple vs Single-Parent Households in Mayo
The poverty data for Mayo shows that 53 of the married-couple family households (2.8%) and 63 of the single-parent households (12.2%) are living below the poverty level. Within the married-couple family households, those with no children have the highest poverty rate, with 53 households (5.7%) falling below the poverty line. Among the single-parent households, those with 1 or 2 children have the highest poverty rate, with 63 household (27.9%) living below poverty.
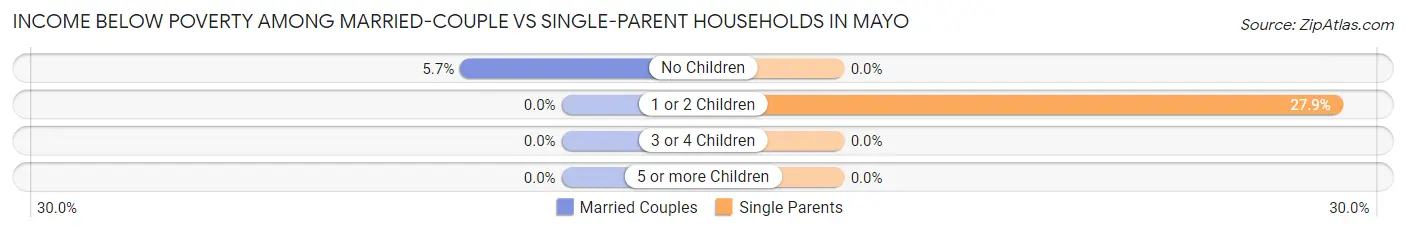
| Children | Married-Couple Families | Single-Parent Households |
| No Children | 53 (5.7%) | 0 (0.0%) |
| 1 or 2 Children | 0 (0.0%) | 63 (27.9%) |
| 3 or 4 Children | 0 (0.0%) | 0 (0.0%) |
| 5 or more Children | 0 (0.0%) | 0 (0.0%) |
| Total | 53 (2.8%) | 63 (12.2%) |
Race in Mayo
The most populous races in Mayo are White / Caucasian (7,545 | 91.4%), Two or more Races (446 | 5.4%), and Hispanic or Latino (322 | 3.9%).
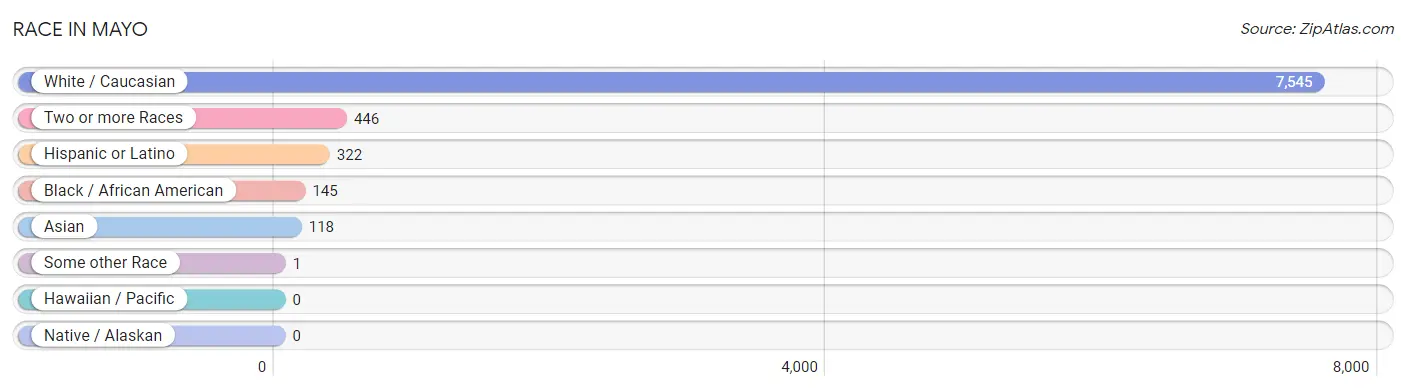
| Race | # Population | % Population |
| Asian | 118 | 1.4% |
| Black / African American | 145 | 1.8% |
| Hawaiian / Pacific | 0 | 0.0% |
| Hispanic or Latino | 322 | 3.9% |
| Native / Alaskan | 0 | 0.0% |
| White / Caucasian | 7,545 | 91.4% |
| Two or more Races | 446 | 5.4% |
| Some other Race | 1 | 0.0% |
| Total | 8,255 | 100.0% |
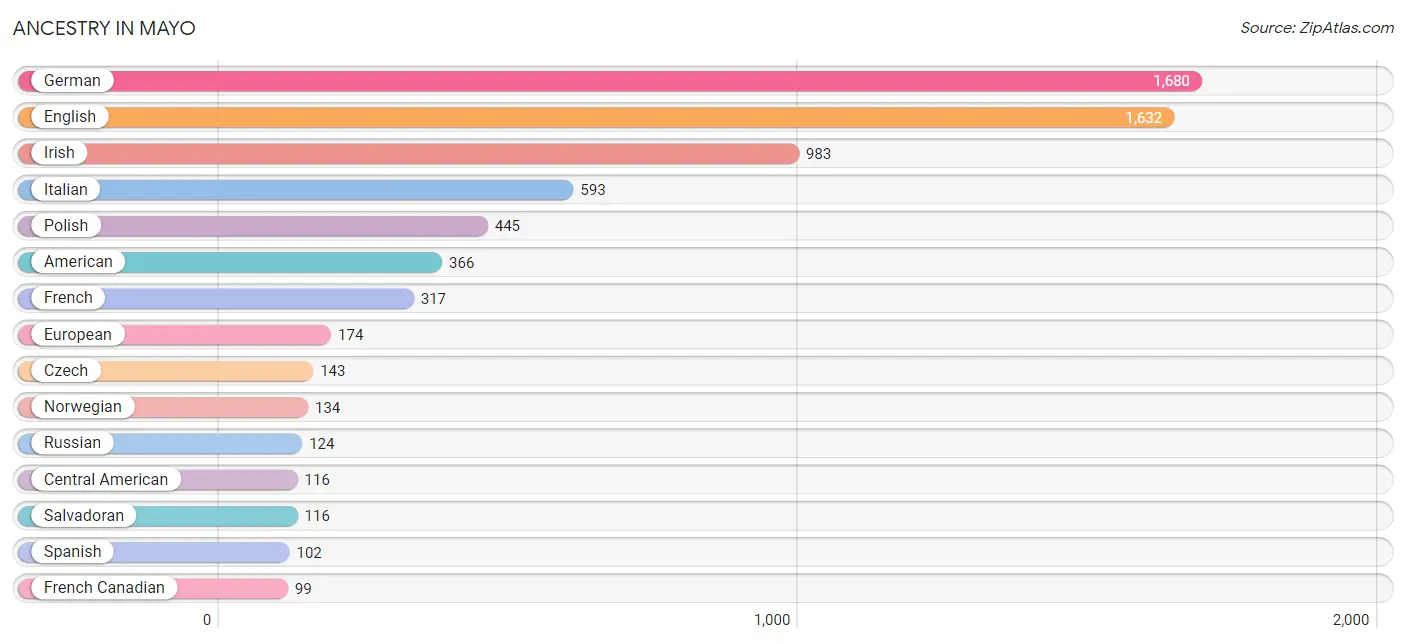
Ancestry in Mayo
The most populous ancestries reported in Mayo are German (1,680 | 20.3%), English (1,632 | 19.8%), Irish (983 | 11.9%), Italian (593 | 7.2%), and Polish (445 | 5.4%), together accounting for 64.6% of all Mayo residents.
| Ancestry | # Population | % Population |
| American | 366 | 4.4% |
| Armenian | 7 | 0.1% |
| Australian | 7 | 0.1% |
| Austrian | 14 | 0.2% |
| Bangladeshi | 32 | 0.4% |
| Bhutanese | 49 | 0.6% |
| Bolivian | 14 | 0.2% |
| Brazilian | 13 | 0.2% |
| British | 39 | 0.5% |
| Canadian | 12 | 0.2% |
| Central American | 116 | 1.4% |
| Cherokee | 35 | 0.4% |
| Croatian | 11 | 0.1% |
| Cuban | 1 | 0.0% |
| Czech | 143 | 1.7% |
| Danish | 11 | 0.1% |
| Dutch | 30 | 0.4% |
| English | 1,632 | 19.8% |
| European | 174 | 2.1% |
| Finnish | 38 | 0.5% |
| French | 317 | 3.8% |
| French Canadian | 99 | 1.2% |
| German | 1,680 | 20.3% |
| Greek | 24 | 0.3% |
| Hungarian | 11 | 0.1% |
| Indian (Asian) | 30 | 0.4% |
| Irish | 983 | 11.9% |
| Italian | 593 | 7.2% |
| Korean | 68 | 0.8% |
| Lithuanian | 28 | 0.3% |
| Mexican | 15 | 0.2% |
| Northern European | 23 | 0.3% |
| Norwegian | 134 | 1.6% |
| Pakistani | 25 | 0.3% |
| Peruvian | 73 | 0.9% |
| Polish | 445 | 5.4% |
| Puerto Rican | 1 | 0.0% |
| Russian | 124 | 1.5% |
| Salvadoran | 116 | 1.4% |
| Scandinavian | 14 | 0.2% |
| Scotch-Irish | 92 | 1.1% |
| Scottish | 77 | 0.9% |
| Seminole | 18 | 0.2% |
| Slovak | 25 | 0.3% |
| South American | 87 | 1.1% |
| Spanish | 102 | 1.2% |
| Swedish | 58 | 0.7% |
| Swiss | 8 | 0.1% |
| Ukrainian | 65 | 0.8% |
| Welsh | 40 | 0.5% | View All 50 Rows |
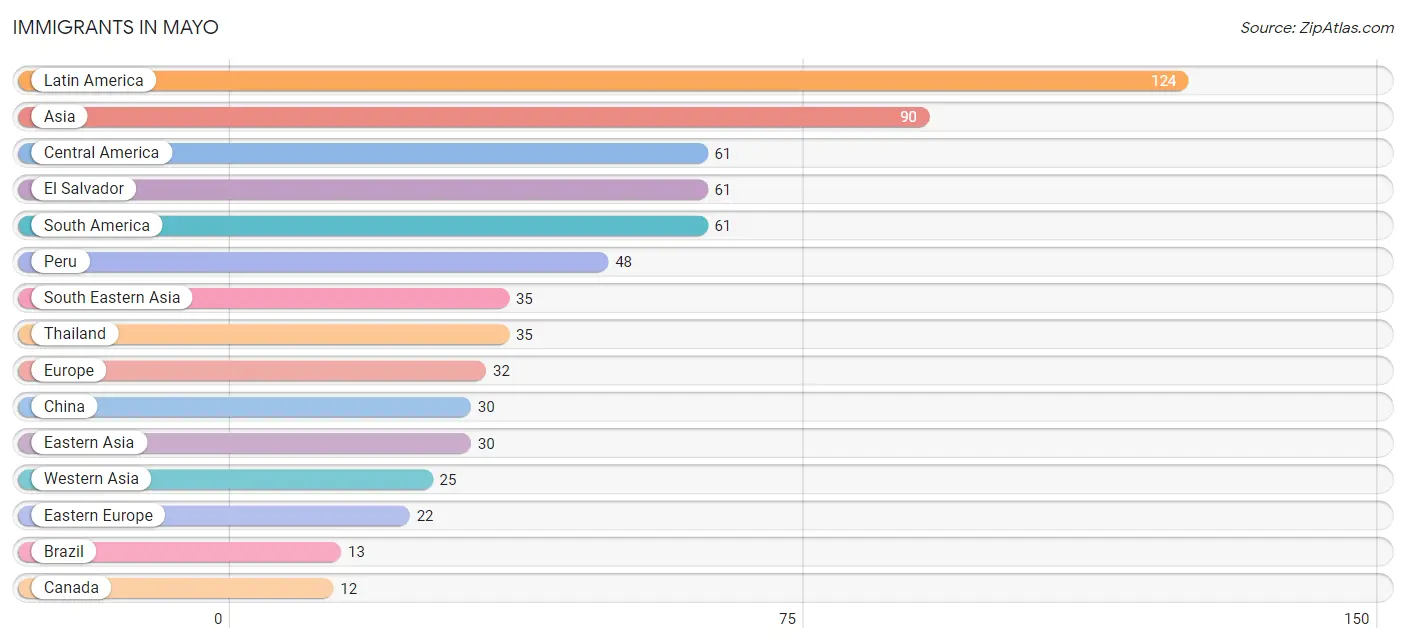
Immigrants in Mayo
The most numerous immigrant groups reported in Mayo came from Latin America (124 | 1.5%), Asia (90 | 1.1%), Central America (61 | 0.7%), El Salvador (61 | 0.7%), and South America (61 | 0.7%), together accounting for 4.8% of all Mayo residents.
| Immigration Origin | # Population | % Population |
| Asia | 90 | 1.1% |
| Brazil | 13 | 0.2% |
| Canada | 12 | 0.2% |
| Caribbean | 2 | 0.0% |
| Central America | 61 | 0.7% |
| China | 30 | 0.4% |
| Cuba | 2 | 0.0% |
| Eastern Asia | 30 | 0.4% |
| Eastern Europe | 22 | 0.3% |
| El Salvador | 61 | 0.7% |
| Europe | 32 | 0.4% |
| Germany | 10 | 0.1% |
| Latin America | 124 | 1.5% |
| Peru | 48 | 0.6% |
| Russia | 12 | 0.2% |
| South America | 61 | 0.7% |
| South Eastern Asia | 35 | 0.4% |
| Thailand | 35 | 0.4% |
| Ukraine | 10 | 0.1% |
| Western Asia | 25 | 0.3% |
| Western Europe | 10 | 0.1% | View All 21 Rows |
Sex and Age in Mayo
Sex and Age in Mayo
The most populous age groups in Mayo are 15 to 19 Years (662 | 16.0%) for men and 55 to 59 Years (428 | 10.4%) for women.
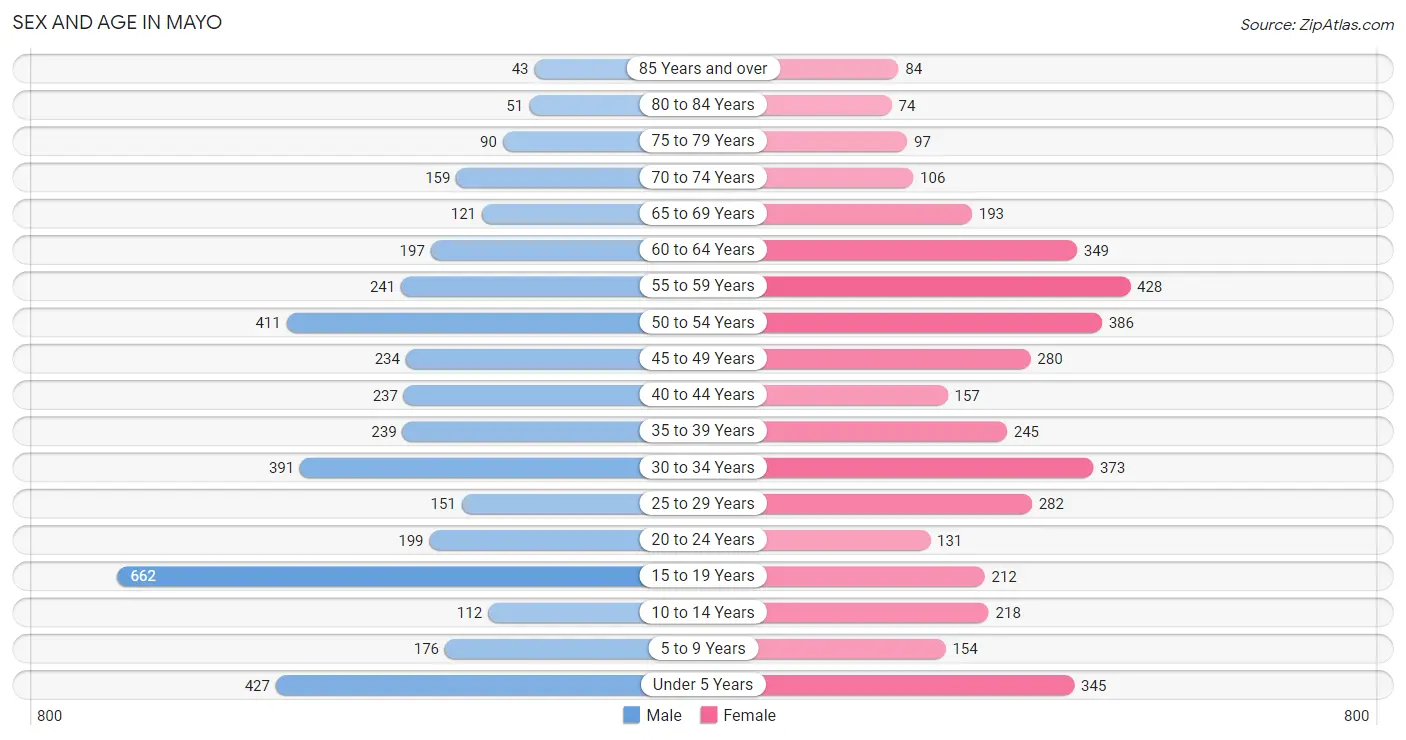
| Age Bracket | Male | Female |
| Under 5 Years | 427 (10.3%) | 345 (8.4%) |
| 5 to 9 Years | 176 (4.3%) | 154 (3.7%) |
| 10 to 14 Years | 112 (2.7%) | 218 (5.3%) |
| 15 to 19 Years | 662 (16.0%) | 212 (5.1%) |
| 20 to 24 Years | 199 (4.8%) | 131 (3.2%) |
| 25 to 29 Years | 151 (3.6%) | 282 (6.9%) |
| 30 to 34 Years | 391 (9.4%) | 373 (9.1%) |
| 35 to 39 Years | 239 (5.8%) | 245 (6.0%) |
| 40 to 44 Years | 237 (5.7%) | 157 (3.8%) |
| 45 to 49 Years | 234 (5.7%) | 280 (6.8%) |
| 50 to 54 Years | 411 (9.9%) | 386 (9.4%) |
| 55 to 59 Years | 241 (5.8%) | 428 (10.4%) |
| 60 to 64 Years | 197 (4.8%) | 349 (8.5%) |
| 65 to 69 Years | 121 (2.9%) | 193 (4.7%) |
| 70 to 74 Years | 159 (3.8%) | 106 (2.6%) |
| 75 to 79 Years | 90 (2.2%) | 97 (2.4%) |
| 80 to 84 Years | 51 (1.2%) | 74 (1.8%) |
| 85 Years and over | 43 (1.0%) | 84 (2.0%) |
| Total | 4,141 (100.0%) | 4,114 (100.0%) |
Families and Households in Mayo
Median Family Size in Mayo
The median family size in Mayo is 3.15 persons per family, with married-couple families (1,873 | 78.4%) accounting for the largest median family size of 3.32 persons per family. On the other hand, single female/mother families (410 | 17.2%) represent the smallest median family size with 2.52 persons per family.
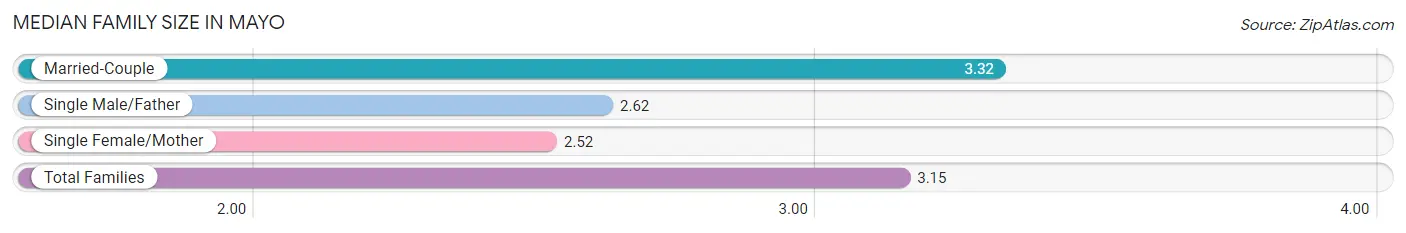
| Family Type | # Families | Family Size |
| Married-Couple | 1,873 (78.4%) | 3.32 |
| Single Male/Father | 106 (4.4%) | 2.62 |
| Single Female/Mother | 410 (17.2%) | 2.52 |
| Total Families | 2,389 (100.0%) | 3.15 |
Median Household Size in Mayo
The median household size in Mayo is 2.78 persons per household, with married-couple households (1,873 | 63.1%) accounting for the largest median household size of 3.33 persons per household. non-family households (579 | 19.5%) represent the smallest median household size with 1.08 persons per household.
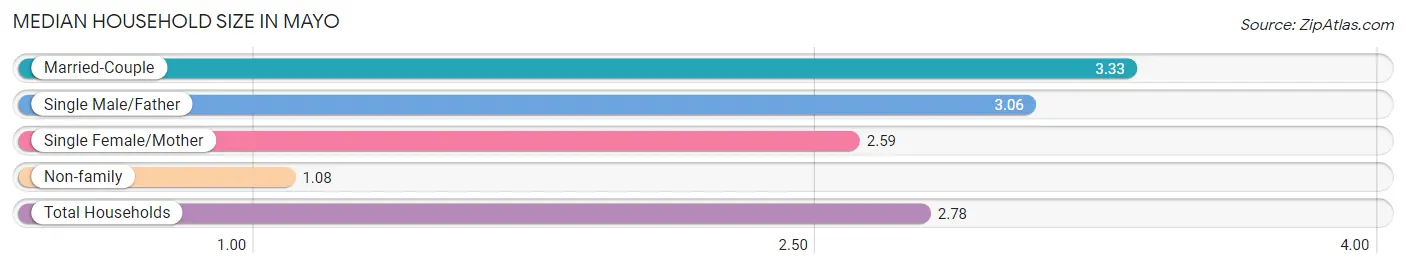
| Household Type | # Households | Household Size |
| Married-Couple | 1,873 (63.1%) | 3.33 |
| Single Male/Father | 106 (3.6%) | 3.06 |
| Single Female/Mother | 410 (13.8%) | 2.59 |
| Non-family | 579 (19.5%) | 1.08 |
| Total Households | 2,968 (100.0%) | 2.78 |
Household Size by Marriage Status in Mayo
Out of a total of 2,968 households in Mayo, 2,389 (80.5%) are family households, while 579 (19.5%) are nonfamily households. The most numerous type of family households are 2-person households, comprising 901, and the most common type of nonfamily households are 1-person households, comprising 536.
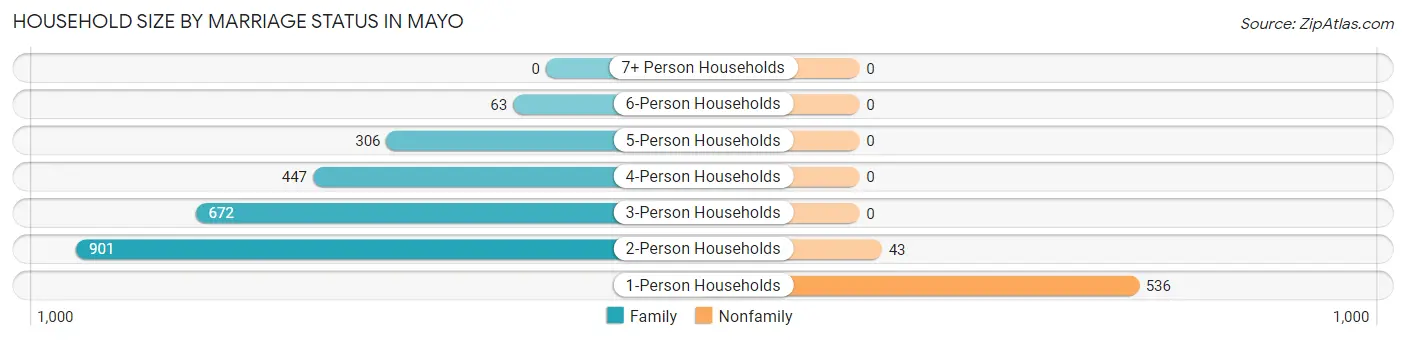
| Household Size | Family Households | Nonfamily Households |
| 1-Person Households | - | 536 (18.1%) |
| 2-Person Households | 901 (30.4%) | 43 (1.5%) |
| 3-Person Households | 672 (22.6%) | 0 (0.0%) |
| 4-Person Households | 447 (15.1%) | 0 (0.0%) |
| 5-Person Households | 306 (10.3%) | 0 (0.0%) |
| 6-Person Households | 63 (2.1%) | 0 (0.0%) |
| 7+ Person Households | 0 (0.0%) | 0 (0.0%) |
| Total | 2,389 (80.5%) | 579 (19.5%) |
Female Fertility in Mayo
Fertility by Age in Mayo
Average fertility rate in Mayo is 82.0 births per 1,000 women. Women in the age bracket of 20 to 34 years have the highest fertility rate with 167.0 births per 1,000 women. Women in the age bracket of 20 to 34 years acount for 85.1% of all women with births.
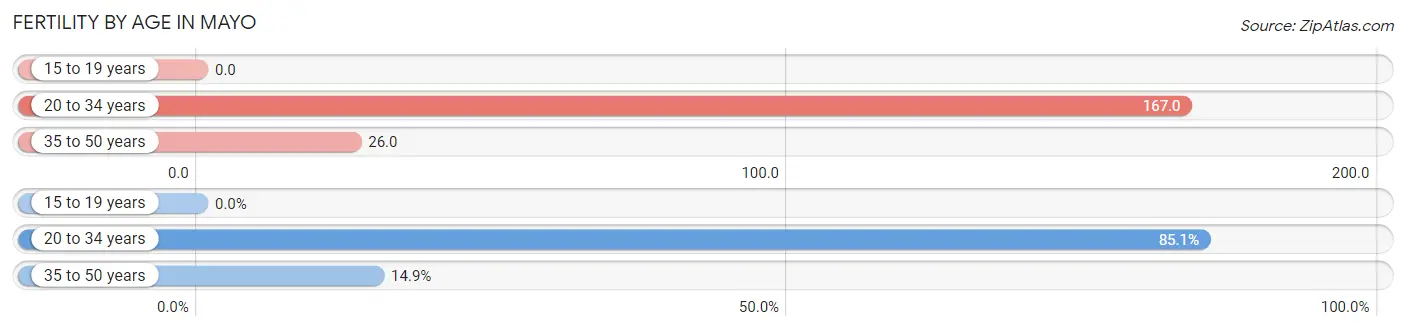
| Age Bracket | Women with Births | Births / 1,000 Women |
| 15 to 19 years | 0 (0.0%) | 0.0 |
| 20 to 34 years | 131 (85.1%) | 167.0 |
| 35 to 50 years | 23 (14.9%) | 26.0 |
| Total | 154 (100.0%) | 82.0 |
Fertility by Age by Marriage Status in Mayo
59.1% of women with births (154) in Mayo are married. The highest percentage of unmarried women with births falls into 20 to 34 years age bracket with 48.1% of them unmarried at the time of birth, while the lowest percentage of unmarried women with births belong to 35 to 50 years age bracket with 0.0% of them unmarried.
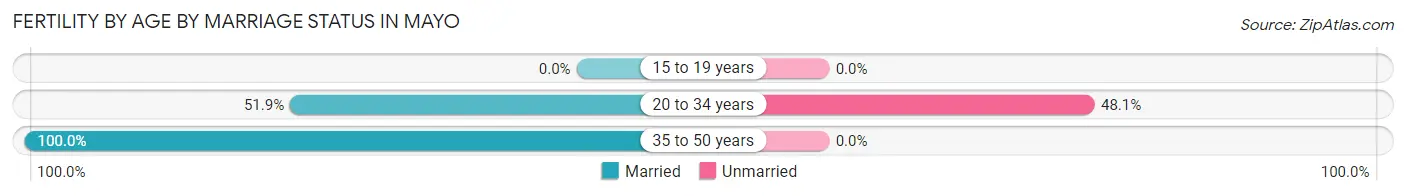
| Age Bracket | Married | Unmarried |
| 15 to 19 years | 0 (0.0%) | 0 (0.0%) |
| 20 to 34 years | 68 (51.9%) | 63 (48.1%) |
| 35 to 50 years | 23 (100.0%) | 0 (0.0%) |
| Total | 91 (59.1%) | 63 (40.9%) |
Fertility by Education in Mayo
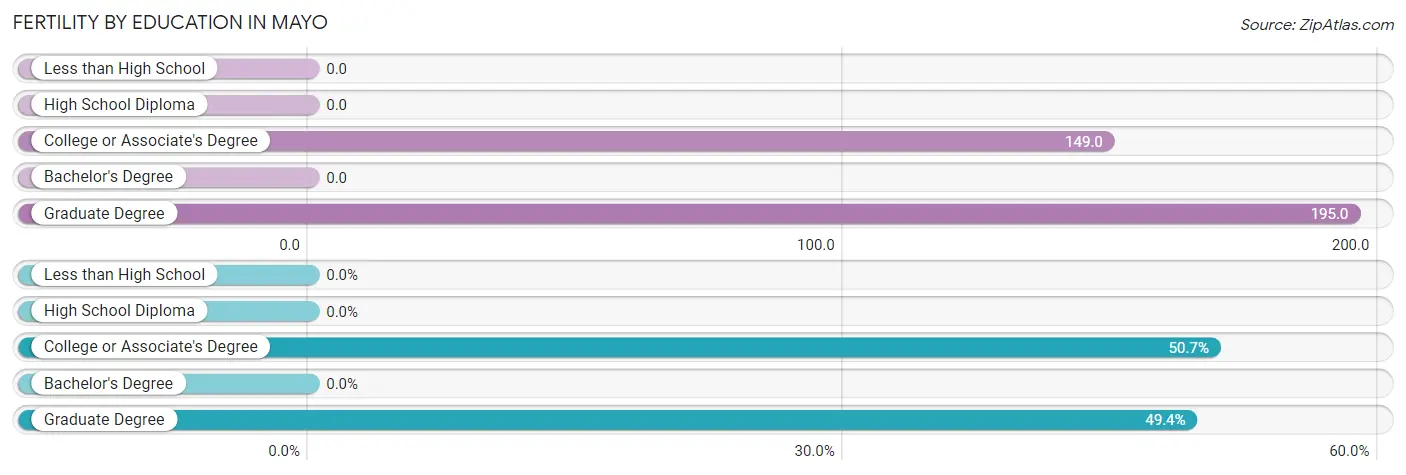
| Educational Attainment | Women with Births | Births / 1,000 Women |
| Less than High School | 0 (0.0%) | 0.0 |
| High School Diploma | 0 (0.0%) | 0.0 |
| College or Associate's Degree | 78 (50.6%) | 149.0 |
| Bachelor's Degree | 0 (0.0%) | 0.0 |
| Graduate Degree | 76 (49.3%) | 195.0 |
| Total | 154 (100.0%) | 82.0 |
Fertility by Education by Marriage Status in Mayo
40.9% of women with births in Mayo are unmarried. Women with the educational attainment of graduate degree are most likely to be married with 100.0% of them married at childbirth, while women with the educational attainment of college or associate's degree are least likely to be married with 80.8% of them unmarried at childbirth.
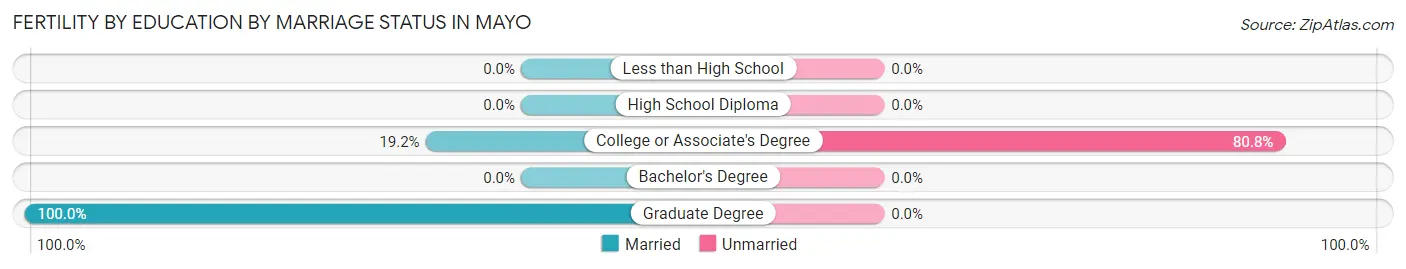
| Educational Attainment | Married | Unmarried |
| Less than High School | 0 (0.0%) | 0 (0.0%) |
| High School Diploma | 0 (0.0%) | 0 (0.0%) |
| College or Associate's Degree | 15 (19.2%) | 63 (80.8%) |
| Bachelor's Degree | 0 (0.0%) | 0 (0.0%) |
| Graduate Degree | 76 (100.0%) | 0 (0.0%) |
| Total | 91 (59.1%) | 63 (40.9%) |
Employment Characteristics in Mayo
Employment by Class of Employer in Mayo
Among the 4,382 employed individuals in Mayo, private company employees (2,384 | 54.4%), federal government employees (618 | 14.1%), and local government employees (382 | 8.7%) make up the most common classes of employment.
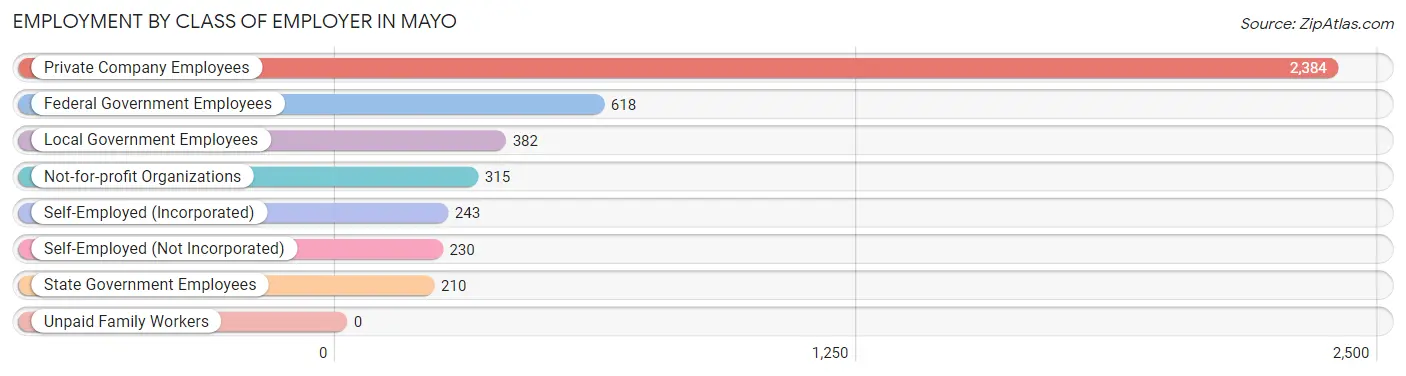
| Employer Class | # Employees | % Employees |
| Private Company Employees | 2,384 | 54.4% |
| Self-Employed (Incorporated) | 243 | 5.6% |
| Self-Employed (Not Incorporated) | 230 | 5.2% |
| Not-for-profit Organizations | 315 | 7.2% |
| Local Government Employees | 382 | 8.7% |
| State Government Employees | 210 | 4.8% |
| Federal Government Employees | 618 | 14.1% |
| Unpaid Family Workers | 0 | 0.0% |
| Total | 4,382 | 100.0% |
Employment Status by Age in Mayo
According to the labor force statistics for Mayo, out of the total population over 16 years of age (6,664), 70.6% or 4,705 individuals are in the labor force, with 5.6% or 263 of them unemployed. The age group with the highest labor force participation rate is 20 to 24 years, with 97.3% or 321 individuals in the labor force. Within the labor force, the 16 to 19 years age range has the highest percentage of unemployed individuals, with 30.4% or 133 of them being unemployed.
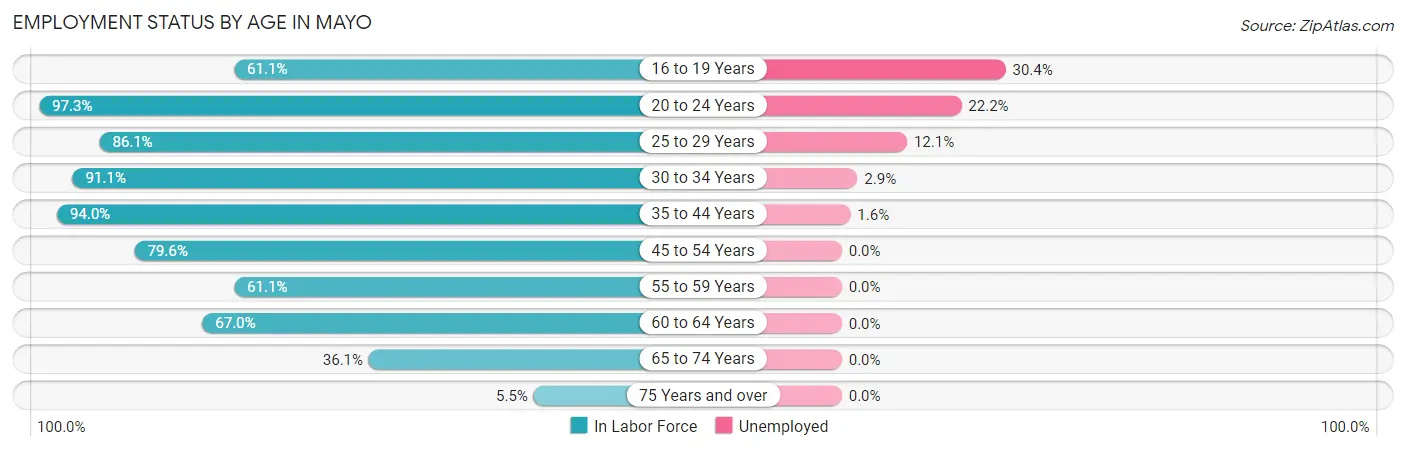
| Age Bracket | In Labor Force | Unemployed |
| 16 to 19 Years | 437 (61.1%) | 133 (30.4%) |
| 20 to 24 Years | 321 (97.3%) | 71 (22.2%) |
| 25 to 29 Years | 373 (86.1%) | 45 (12.1%) |
| 30 to 34 Years | 696 (91.1%) | 20 (2.9%) |
| 35 to 44 Years | 825 (94.0%) | 13 (1.6%) |
| 45 to 54 Years | 1,044 (79.6%) | 0 (0.0%) |
| 55 to 59 Years | 409 (61.1%) | 0 (0.0%) |
| 60 to 64 Years | 366 (67.0%) | 0 (0.0%) |
| 65 to 74 Years | 209 (36.1%) | 0 (0.0%) |
| 75 Years and over | 24 (5.5%) | 0 (0.0%) |
| Total | 4,705 (70.6%) | 263 (5.6%) |
Employment Status by Educational Attainment in Mayo
According to labor force statistics for Mayo, 80.7% of individuals (3,713) out of the total population between 25 and 64 years of age (4,601) are in the labor force, with 2.1% or 78 of them being unemployed. The group with the highest labor force participation rate are those with the educational attainment of bachelor's degree or higher, with 90.4% or 1,790 individuals in the labor force. Within the labor force, individuals with less than high school education have the highest percentage of unemployment, with 13.6% or 25 of them being unemployed.
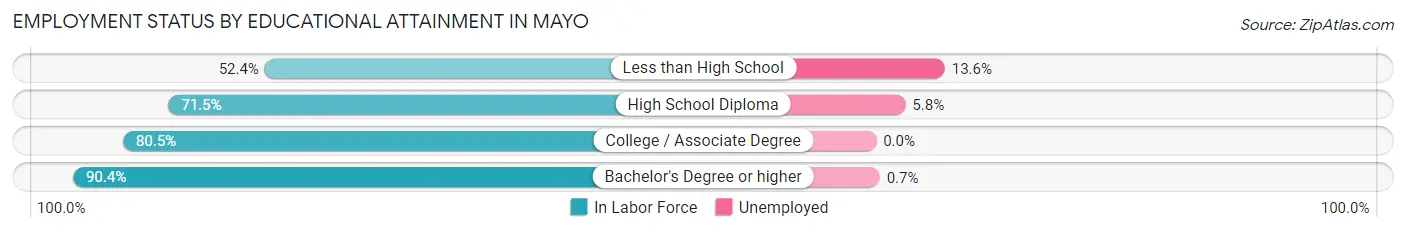
| Educational Attainment | In Labor Force | Unemployed |
| Less than High School | 184 (52.4%) | 48 (13.6%) |
| High School Diploma | 697 (71.5%) | 57 (5.8%) |
| College / Associate Degree | 1,042 (80.5%) | 0 (0.0%) |
| Bachelor's Degree or higher | 1,790 (90.4%) | 14 (0.7%) |
| Total | 3,713 (80.7%) | 97 (2.1%) |
Employment Occupations by Sex in Mayo
Management, Business, Science and Arts Occupations
The most common Management, Business, Science and Arts occupations in Mayo are Management (741 | 17.2%), Community & Social Service (523 | 12.2%), Computers, Engineering & Science (445 | 10.3%), Business & Financial (351 | 8.2%), and Education Instruction & Library (291 | 6.8%).
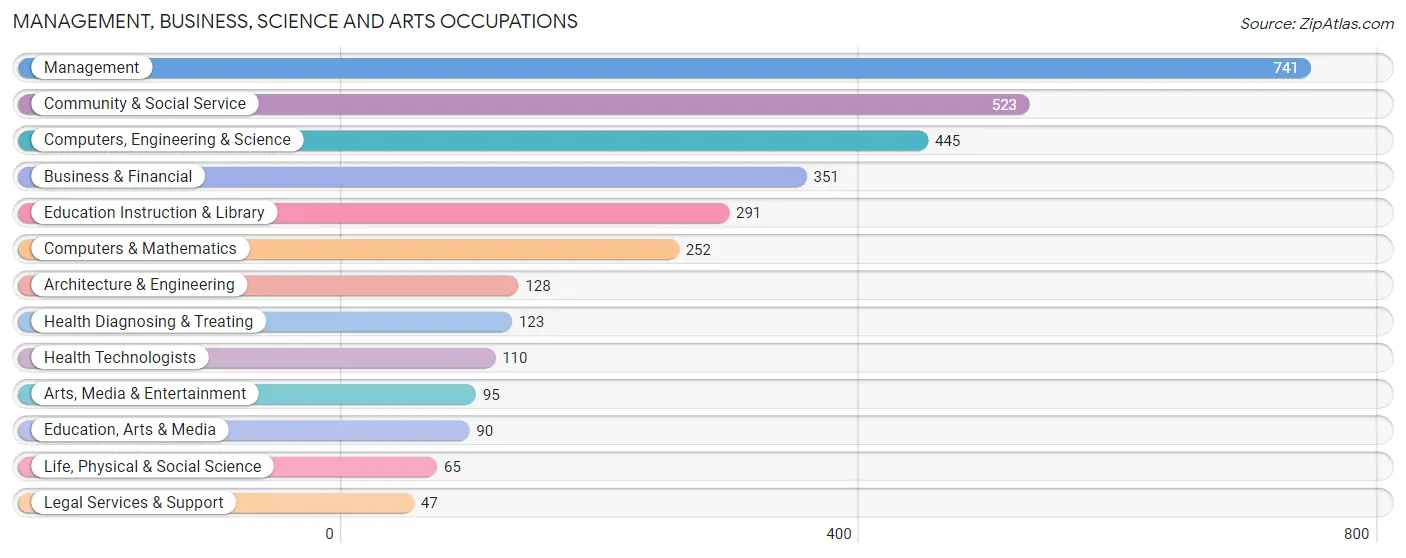
Management, Business, Science and Arts Occupations by Sex
Within the Management, Business, Science and Arts occupations in Mayo, the most male-oriented occupations are Architecture & Engineering (100.0%), Computers & Mathematics (96.0%), and Computers, Engineering & Science (93.3%), while the most female-oriented occupations are Education, Arts & Media (100.0%), Health Technologists (89.1%), and Health Diagnosing & Treating (79.7%).
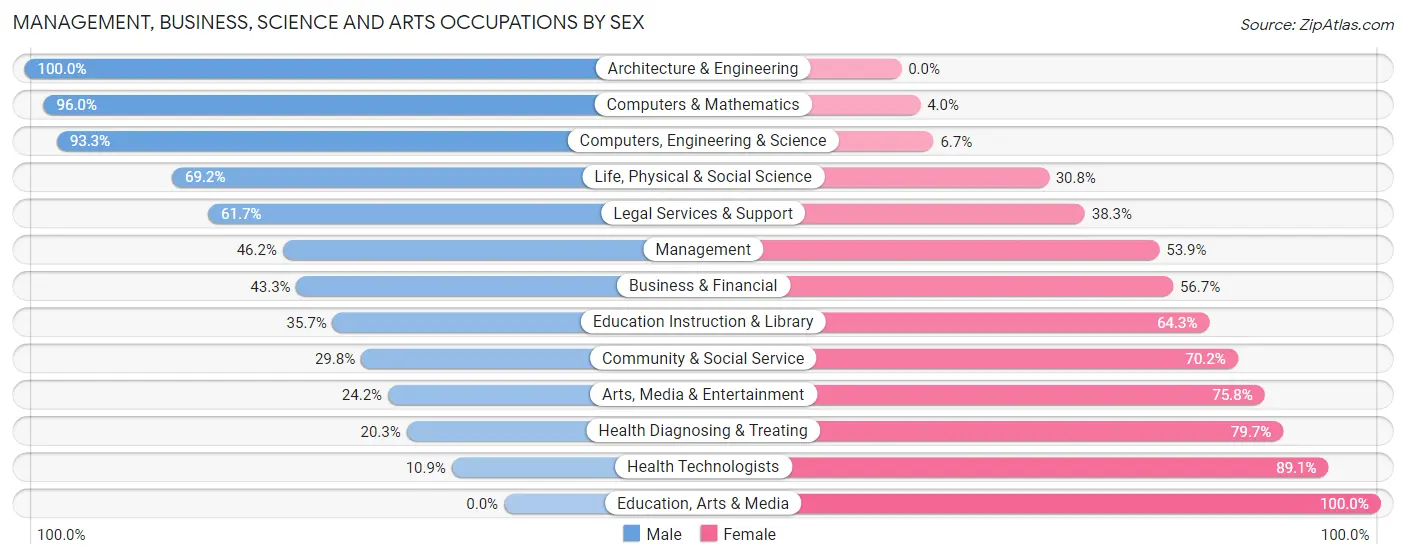
| Occupation | Male | Female |
| Management | 342 (46.2%) | 399 (53.8%) |
| Business & Financial | 152 (43.3%) | 199 (56.7%) |
| Computers, Engineering & Science | 415 (93.3%) | 30 (6.7%) |
| Computers & Mathematics | 242 (96.0%) | 10 (4.0%) |
| Architecture & Engineering | 128 (100.0%) | 0 (0.0%) |
| Life, Physical & Social Science | 45 (69.2%) | 20 (30.8%) |
| Community & Social Service | 156 (29.8%) | 367 (70.2%) |
| Education, Arts & Media | 0 (0.0%) | 90 (100.0%) |
| Legal Services & Support | 29 (61.7%) | 18 (38.3%) |
| Education Instruction & Library | 104 (35.7%) | 187 (64.3%) |
| Arts, Media & Entertainment | 23 (24.2%) | 72 (75.8%) |
| Health Diagnosing & Treating | 25 (20.3%) | 98 (79.7%) |
| Health Technologists | 12 (10.9%) | 98 (89.1%) |
| Total (Category) | 1,090 (49.9%) | 1,093 (50.1%) |
| Total (Overall) | 2,165 (50.3%) | 2,137 (49.7%) |
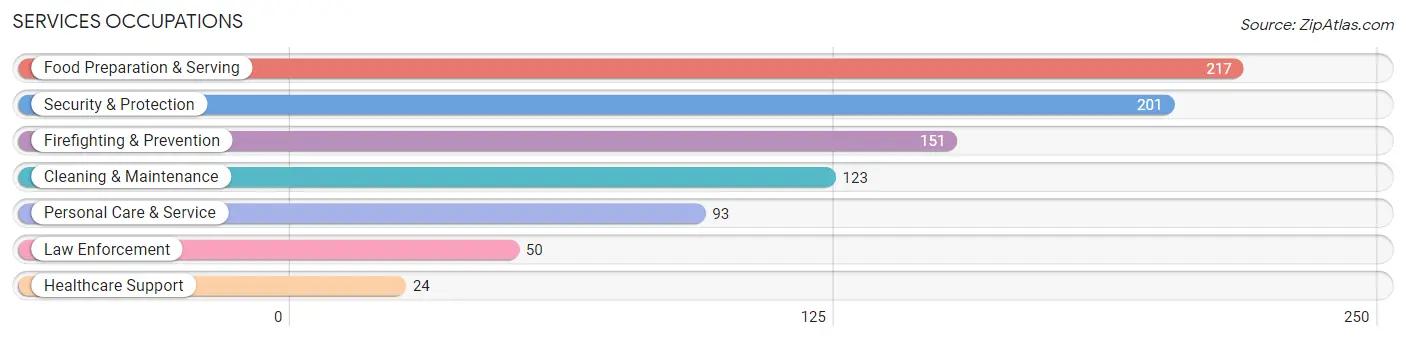
Services Occupations
The most common Services occupations in Mayo are Food Preparation & Serving (217 | 5.0%), Security & Protection (201 | 4.7%), Firefighting & Prevention (151 | 3.5%), Cleaning & Maintenance (123 | 2.9%), and Personal Care & Service (93 | 2.2%).
Services Occupations by Sex
Within the Services occupations in Mayo, the most male-oriented occupations are Law Enforcement (100.0%), Security & Protection (62.2%), and Firefighting & Prevention (49.7%), while the most female-oriented occupations are Cleaning & Maintenance (92.7%), Healthcare Support (83.3%), and Personal Care & Service (68.8%).
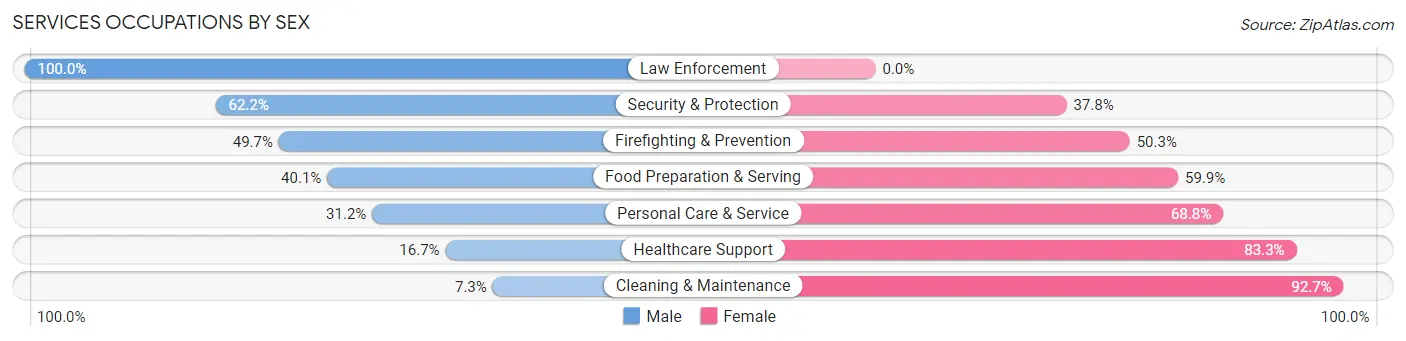
| Occupation | Male | Female |
| Healthcare Support | 4 (16.7%) | 20 (83.3%) |
| Security & Protection | 125 (62.2%) | 76 (37.8%) |
| Firefighting & Prevention | 75 (49.7%) | 76 (50.3%) |
| Law Enforcement | 50 (100.0%) | 0 (0.0%) |
| Food Preparation & Serving | 87 (40.1%) | 130 (59.9%) |
| Cleaning & Maintenance | 9 (7.3%) | 114 (92.7%) |
| Personal Care & Service | 29 (31.2%) | 64 (68.8%) |
| Total (Category) | 254 (38.6%) | 404 (61.4%) |
| Total (Overall) | 2,165 (50.3%) | 2,137 (49.7%) |
Sales and Office Occupations
The most common Sales and Office occupations in Mayo are Sales & Related (476 | 11.1%), and Office & Administration (387 | 9.0%).

Sales and Office Occupations by Sex
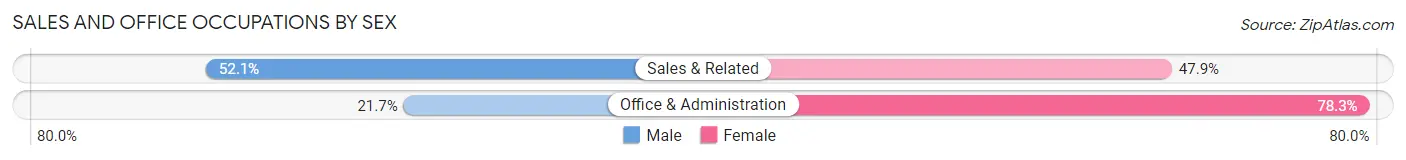
| Occupation | Male | Female |
| Sales & Related | 248 (52.1%) | 228 (47.9%) |
| Office & Administration | 84 (21.7%) | 303 (78.3%) |
| Total (Category) | 332 (38.5%) | 531 (61.5%) |
| Total (Overall) | 2,165 (50.3%) | 2,137 (49.7%) |
Natural Resources, Construction and Maintenance Occupations
The most common Natural Resources, Construction and Maintenance occupations in Mayo are Installation, Maintenance & Repair (169 | 3.9%), and Construction & Extraction (162 | 3.8%).
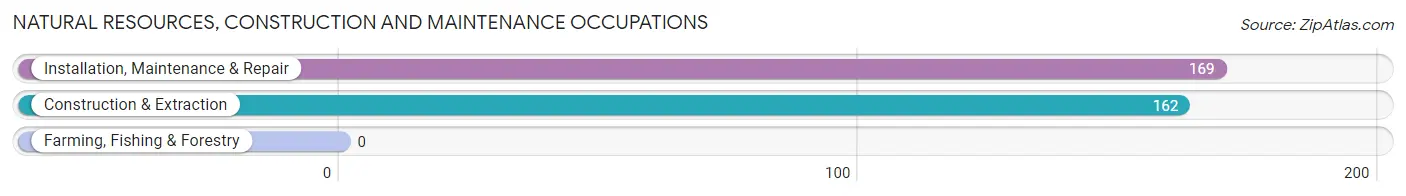
Natural Resources, Construction and Maintenance Occupations by Sex
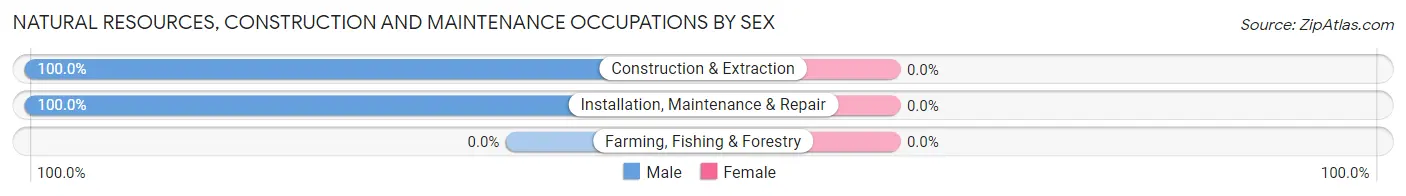
| Occupation | Male | Female |
| Farming, Fishing & Forestry | 0 (0.0%) | 0 (0.0%) |
| Construction & Extraction | 162 (100.0%) | 0 (0.0%) |
| Installation, Maintenance & Repair | 169 (100.0%) | 0 (0.0%) |
| Total (Category) | 331 (100.0%) | 0 (0.0%) |
| Total (Overall) | 2,165 (50.3%) | 2,137 (49.7%) |
Production, Transportation and Moving Occupations
The most common Production, Transportation and Moving occupations in Mayo are Transportation (119 | 2.8%), Production (104 | 2.4%), and Material Moving (44 | 1.0%).
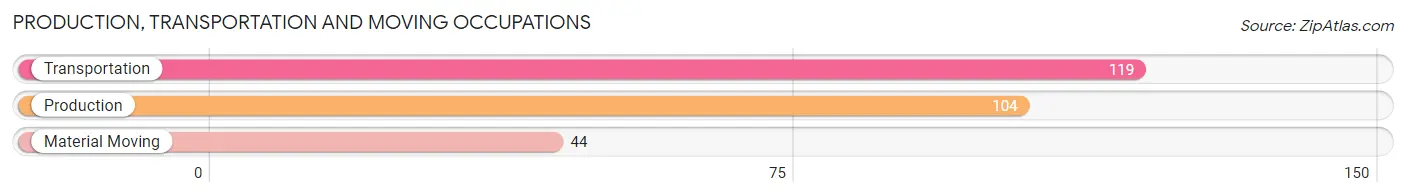
Production, Transportation and Moving Occupations by Sex
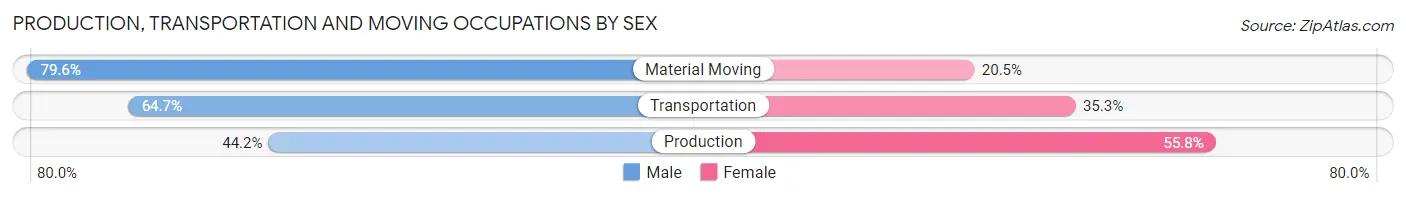
| Occupation | Male | Female |
| Production | 46 (44.2%) | 58 (55.8%) |
| Transportation | 77 (64.7%) | 42 (35.3%) |
| Material Moving | 35 (79.5%) | 9 (20.4%) |
| Total (Category) | 158 (59.2%) | 109 (40.8%) |
| Total (Overall) | 2,165 (50.3%) | 2,137 (49.7%) |
Employment Industries by Sex in Mayo
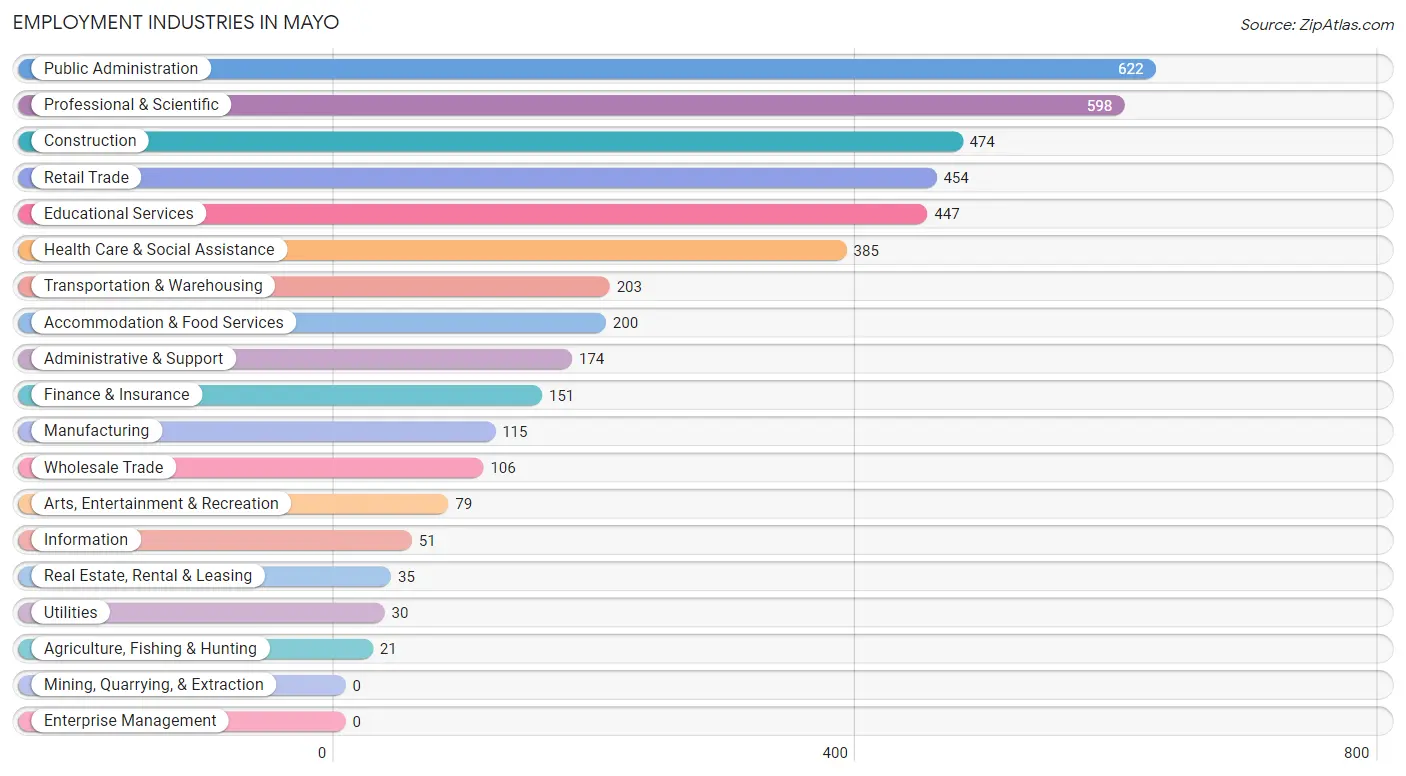
Employment Industries in Mayo
The major employment industries in Mayo include Public Administration (622 | 14.5%), Professional & Scientific (598 | 13.9%), Construction (474 | 11.0%), Retail Trade (454 | 10.5%), and Educational Services (447 | 10.4%).
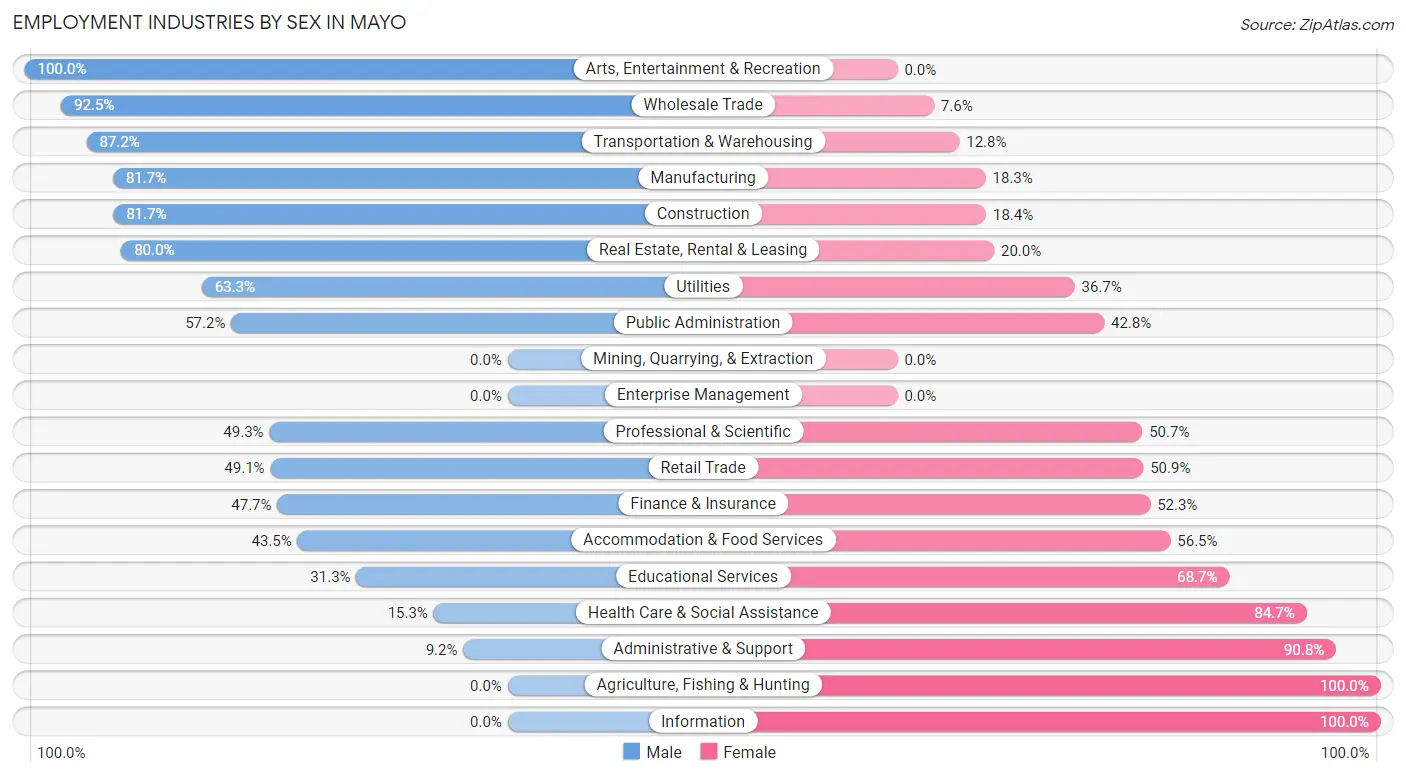
Employment Industries by Sex in Mayo
The Mayo industries that see more men than women are Arts, Entertainment & Recreation (100.0%), Wholesale Trade (92.4%), and Transportation & Warehousing (87.2%), whereas the industries that tend to have a higher number of women are Agriculture, Fishing & Hunting (100.0%), Information (100.0%), and Administrative & Support (90.8%).
| Industry | Male | Female |
| Agriculture, Fishing & Hunting | 0 (0.0%) | 21 (100.0%) |
| Mining, Quarrying, & Extraction | 0 (0.0%) | 0 (0.0%) |
| Construction | 387 (81.7%) | 87 (18.3%) |
| Manufacturing | 94 (81.7%) | 21 (18.3%) |
| Wholesale Trade | 98 (92.4%) | 8 (7.5%) |
| Retail Trade | 223 (49.1%) | 231 (50.9%) |
| Transportation & Warehousing | 177 (87.2%) | 26 (12.8%) |
| Utilities | 19 (63.3%) | 11 (36.7%) |
| Information | 0 (0.0%) | 51 (100.0%) |
| Finance & Insurance | 72 (47.7%) | 79 (52.3%) |
| Real Estate, Rental & Leasing | 28 (80.0%) | 7 (20.0%) |
| Professional & Scientific | 295 (49.3%) | 303 (50.7%) |
| Enterprise Management | 0 (0.0%) | 0 (0.0%) |
| Administrative & Support | 16 (9.2%) | 158 (90.8%) |
| Educational Services | 140 (31.3%) | 307 (68.7%) |
| Health Care & Social Assistance | 59 (15.3%) | 326 (84.7%) |
| Arts, Entertainment & Recreation | 79 (100.0%) | 0 (0.0%) |
| Accommodation & Food Services | 87 (43.5%) | 113 (56.5%) |
| Public Administration | 356 (57.2%) | 266 (42.8%) |
| Total | 2,165 (50.3%) | 2,137 (49.7%) |
Education in Mayo
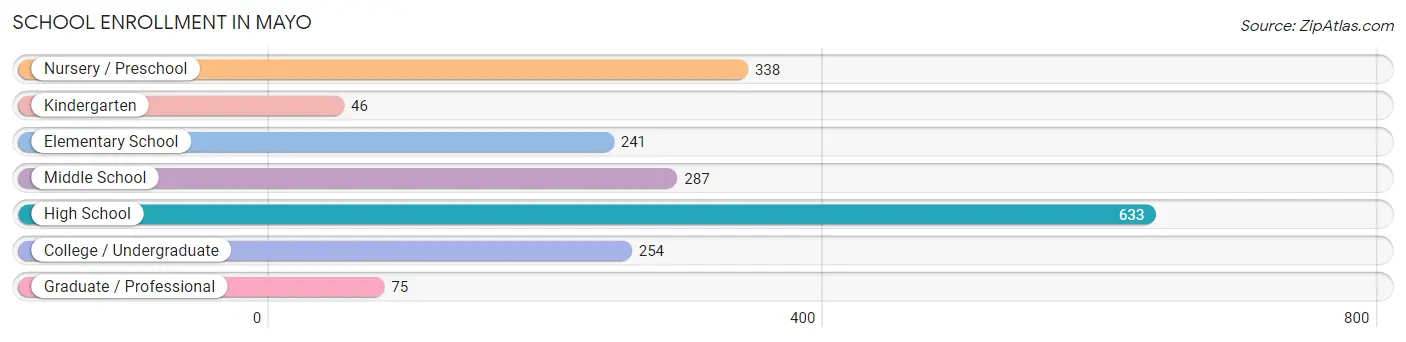
School Enrollment in Mayo
The most common levels of schooling among the 1,874 students in Mayo are high school (633 | 33.8%), nursery / preschool (338 | 18.0%), and middle school (287 | 15.3%).
| School Level | # Students | % Students |
| Nursery / Preschool | 338 | 18.0% |
| Kindergarten | 46 | 2.5% |
| Elementary School | 241 | 12.9% |
| Middle School | 287 | 15.3% |
| High School | 633 | 33.8% |
| College / Undergraduate | 254 | 13.6% |
| Graduate / Professional | 75 | 4.0% |
| Total | 1,874 | 100.0% |
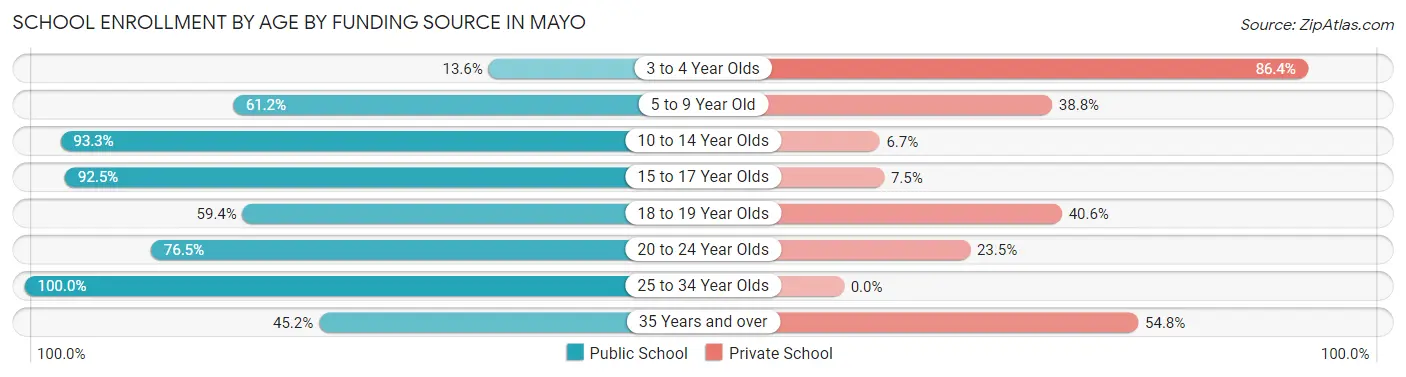
School Enrollment by Age by Funding Source in Mayo
Out of a total of 1,874 students who are enrolled in schools in Mayo, 630 (33.6%) attend a private institution, while the remaining 1,244 (66.4%) are enrolled in public schools. The age group of 3 to 4 year olds has the highest likelihood of being enrolled in private schools, with 229 (86.4% in the age bracket) enrolled. Conversely, the age group of 25 to 34 year olds has the lowest likelihood of being enrolled in a private school, with 38 (100.0% in the age bracket) attending a public institution.
| Age Bracket | Public School | Private School |
| 3 to 4 Year Olds | 36 (13.6%) | 229 (86.4%) |
| 5 to 9 Year Old | 202 (61.2%) | 128 (38.8%) |
| 10 to 14 Year Olds | 308 (93.3%) | 22 (6.7%) |
| 15 to 17 Year Olds | 345 (92.5%) | 28 (7.5%) |
| 18 to 19 Year Olds | 234 (59.4%) | 160 (40.6%) |
| 20 to 24 Year Olds | 39 (76.5%) | 12 (23.5%) |
| 25 to 34 Year Olds | 38 (100.0%) | 0 (0.0%) |
| 35 Years and over | 42 (45.2%) | 51 (54.8%) |
| Total | 1,244 (66.4%) | 630 (33.6%) |
Educational Attainment by Field of Study in Mayo
Business (413 | 16.2%), social sciences (311 | 12.2%), education (259 | 10.2%), arts & humanities (247 | 9.7%), and liberal arts & history (214 | 8.4%) are the most common fields of study among 2,550 individuals in Mayo who have obtained a bachelor's degree or higher.
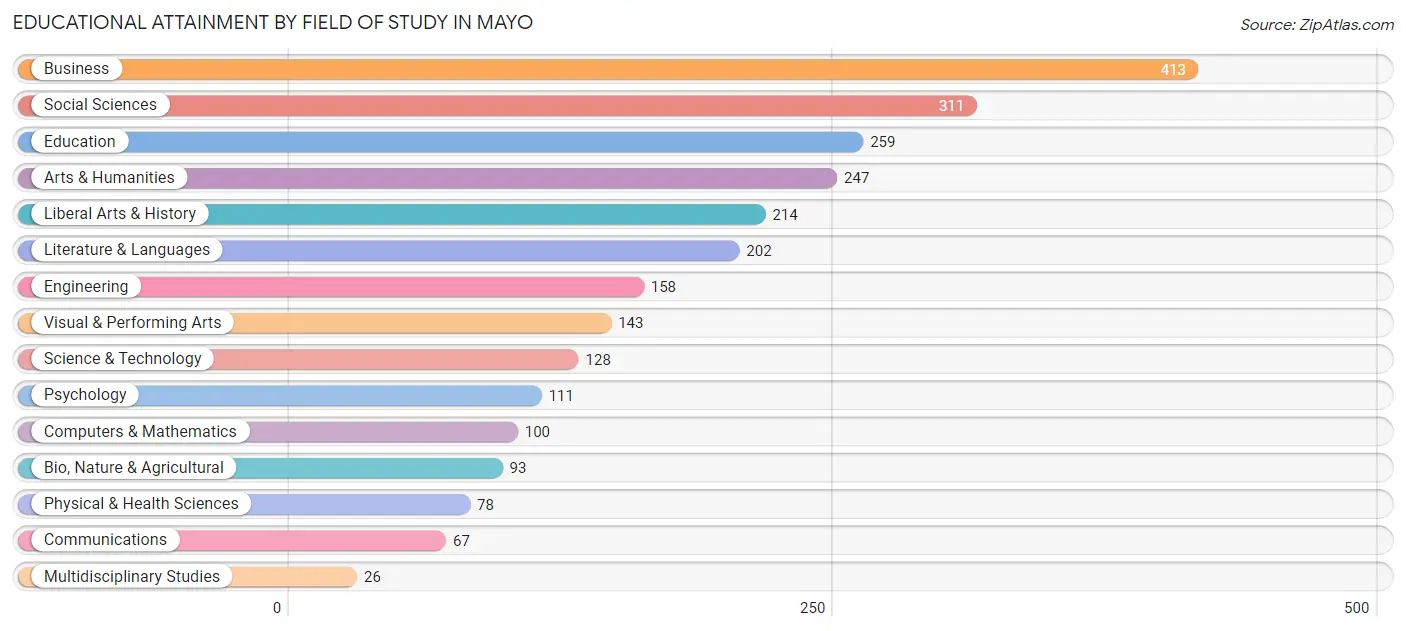
| Field of Study | # Graduates | % Graduates |
| Computers & Mathematics | 100 | 3.9% |
| Bio, Nature & Agricultural | 93 | 3.6% |
| Physical & Health Sciences | 78 | 3.1% |
| Psychology | 111 | 4.3% |
| Social Sciences | 311 | 12.2% |
| Engineering | 158 | 6.2% |
| Multidisciplinary Studies | 26 | 1.0% |
| Science & Technology | 128 | 5.0% |
| Business | 413 | 16.2% |
| Education | 259 | 10.2% |
| Literature & Languages | 202 | 7.9% |
| Liberal Arts & History | 214 | 8.4% |
| Visual & Performing Arts | 143 | 5.6% |
| Communications | 67 | 2.6% |
| Arts & Humanities | 247 | 9.7% |
| Total | 2,550 | 100.0% |
Transportation & Commute in Mayo
Vehicle Availability by Sex in Mayo
The most prevalent vehicle ownership categories in Mayo are males with 2 vehicles (1,011, accounting for 44.9%) and females with 2 vehicles (1,093, making up 47.5%).
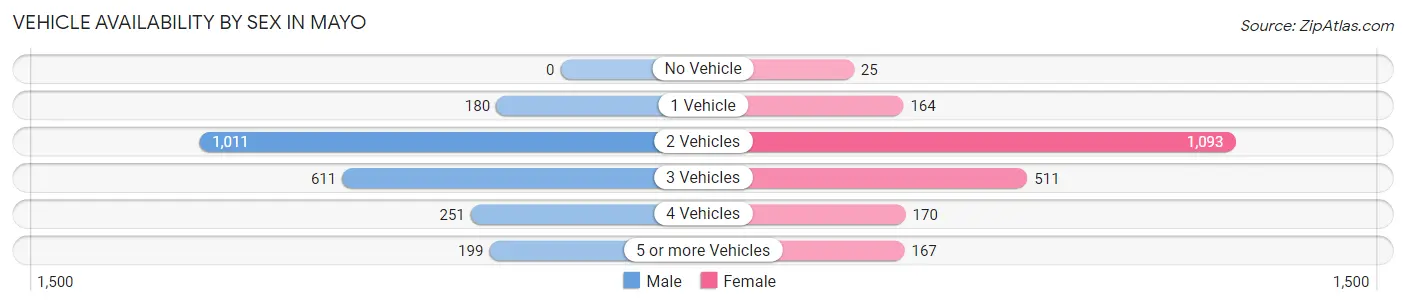
| Vehicles Available | Male | Female |
| No Vehicle | 0 (0.0%) | 25 (1.2%) |
| 1 Vehicle | 180 (8.0%) | 164 (7.7%) |
| 2 Vehicles | 1,011 (44.9%) | 1,093 (51.3%) |
| 3 Vehicles | 611 (27.1%) | 511 (24.0%) |
| 4 Vehicles | 251 (11.2%) | 170 (8.0%) |
| 5 or more Vehicles | 199 (8.8%) | 167 (7.8%) |
| Total | 2,252 (100.0%) | 2,130 (100.0%) |
Commute Time in Mayo
The most frequently occuring commute durations in Mayo are 40 to 44 minutes (487 commuters, 14.9%), 45 to 59 minutes (397 commuters, 12.1%), and 30 to 34 minutes (395 commuters, 12.1%).
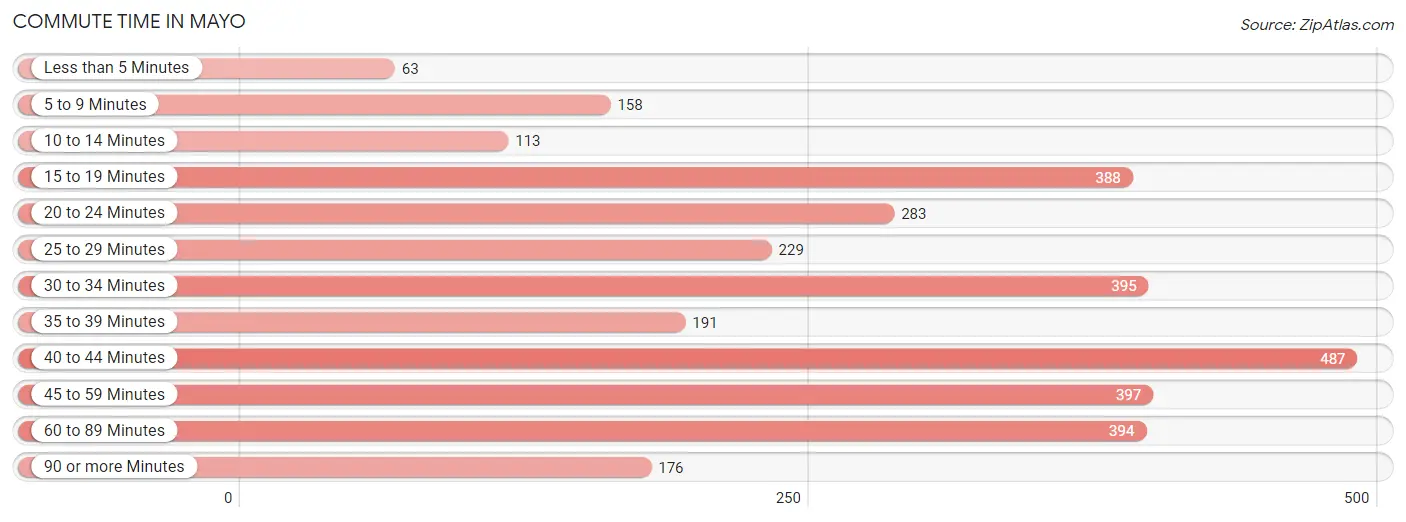
| Commute Time | # Commuters | % Commuters |
| Less than 5 Minutes | 63 | 1.9% |
| 5 to 9 Minutes | 158 | 4.8% |
| 10 to 14 Minutes | 113 | 3.5% |
| 15 to 19 Minutes | 388 | 11.8% |
| 20 to 24 Minutes | 283 | 8.6% |
| 25 to 29 Minutes | 229 | 7.0% |
| 30 to 34 Minutes | 395 | 12.1% |
| 35 to 39 Minutes | 191 | 5.8% |
| 40 to 44 Minutes | 487 | 14.9% |
| 45 to 59 Minutes | 397 | 12.1% |
| 60 to 89 Minutes | 394 | 12.0% |
| 90 or more Minutes | 176 | 5.4% |
Commute Time by Sex in Mayo
The most common commute times in Mayo are 30 to 34 minutes (294 commuters, 16.9%) for males and 40 to 44 minutes (273 commuters, 17.8%) for females.
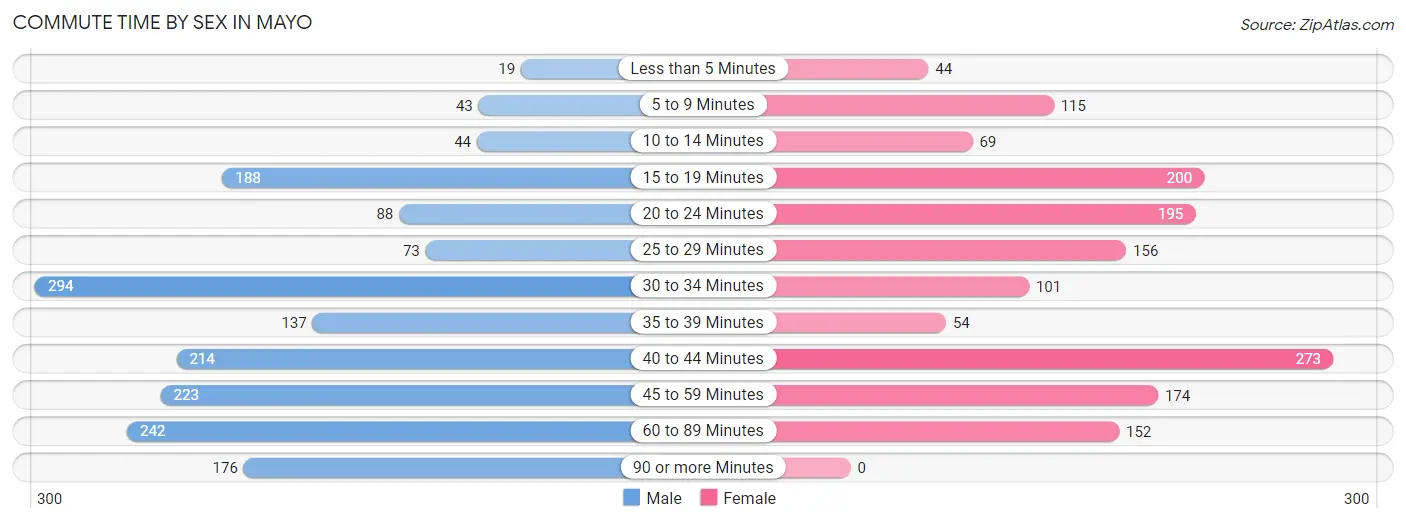
| Commute Time | Male | Female |
| Less than 5 Minutes | 19 (1.1%) | 44 (2.9%) |
| 5 to 9 Minutes | 43 (2.5%) | 115 (7.5%) |
| 10 to 14 Minutes | 44 (2.5%) | 69 (4.5%) |
| 15 to 19 Minutes | 188 (10.8%) | 200 (13.1%) |
| 20 to 24 Minutes | 88 (5.1%) | 195 (12.7%) |
| 25 to 29 Minutes | 73 (4.2%) | 156 (10.2%) |
| 30 to 34 Minutes | 294 (16.9%) | 101 (6.6%) |
| 35 to 39 Minutes | 137 (7.9%) | 54 (3.5%) |
| 40 to 44 Minutes | 214 (12.3%) | 273 (17.8%) |
| 45 to 59 Minutes | 223 (12.8%) | 174 (11.4%) |
| 60 to 89 Minutes | 242 (13.9%) | 152 (9.9%) |
| 90 or more Minutes | 176 (10.1%) | 0 (0.0%) |
Time of Departure to Work by Sex in Mayo
The most frequent times of departure to work in Mayo are 8:00 AM to 8:29 AM (305, 17.5%) for males and 7:00 AM to 7:29 AM (329, 21.5%) for females.
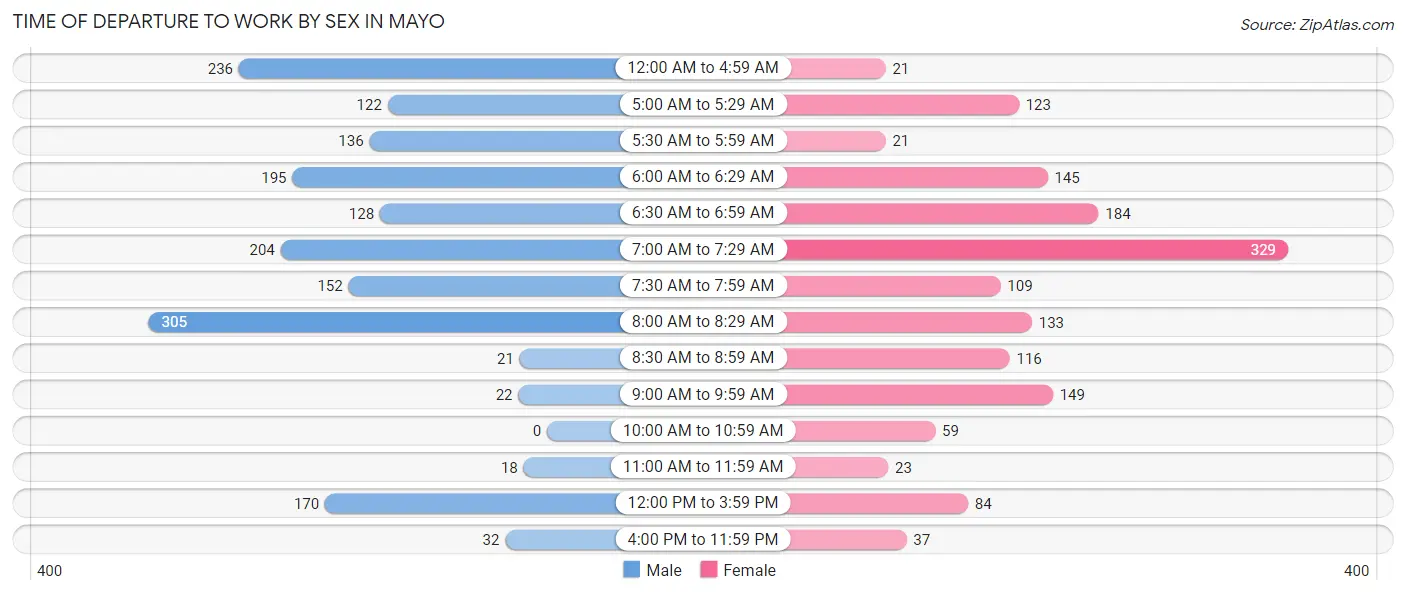
| Time of Departure | Male | Female |
| 12:00 AM to 4:59 AM | 236 (13.6%) | 21 (1.4%) |
| 5:00 AM to 5:29 AM | 122 (7.0%) | 123 (8.0%) |
| 5:30 AM to 5:59 AM | 136 (7.8%) | 21 (1.4%) |
| 6:00 AM to 6:29 AM | 195 (11.2%) | 145 (9.5%) |
| 6:30 AM to 6:59 AM | 128 (7.3%) | 184 (12.0%) |
| 7:00 AM to 7:29 AM | 204 (11.7%) | 329 (21.5%) |
| 7:30 AM to 7:59 AM | 152 (8.7%) | 109 (7.1%) |
| 8:00 AM to 8:29 AM | 305 (17.5%) | 133 (8.7%) |
| 8:30 AM to 8:59 AM | 21 (1.2%) | 116 (7.6%) |
| 9:00 AM to 9:59 AM | 22 (1.3%) | 149 (9.7%) |
| 10:00 AM to 10:59 AM | 0 (0.0%) | 59 (3.8%) |
| 11:00 AM to 11:59 AM | 18 (1.0%) | 23 (1.5%) |
| 12:00 PM to 3:59 PM | 170 (9.8%) | 84 (5.5%) |
| 4:00 PM to 11:59 PM | 32 (1.8%) | 37 (2.4%) |
| Total | 1,741 (100.0%) | 1,533 (100.0%) |
Housing Occupancy in Mayo
Occupancy by Ownership in Mayo
Of the total 2,968 dwellings in Mayo, owner-occupied units account for 2,486 (83.8%), while renter-occupied units make up 482 (16.2%).
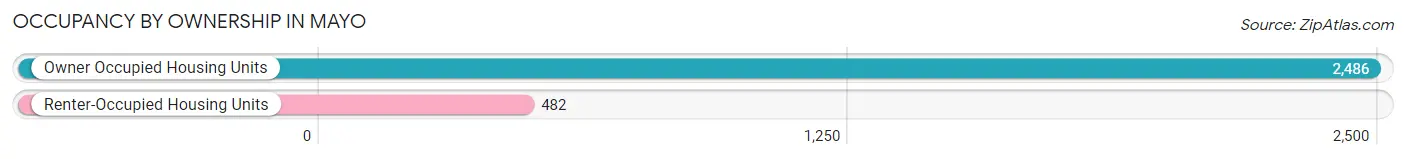
| Occupancy | # Housing Units | % Housing Units |
| Owner Occupied Housing Units | 2,486 | 83.8% |
| Renter-Occupied Housing Units | 482 | 16.2% |
| Total Occupied Housing Units | 2,968 | 100.0% |
Occupancy by Household Size in Mayo
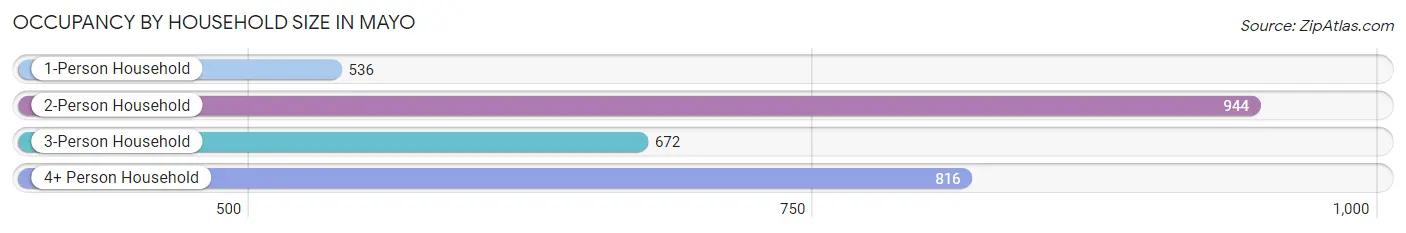
| Household Size | # Housing Units | % Housing Units |
| 1-Person Household | 536 | 18.1% |
| 2-Person Household | 944 | 31.8% |
| 3-Person Household | 672 | 22.6% |
| 4+ Person Household | 816 | 27.5% |
| Total Housing Units | 2,968 | 100.0% |
Occupancy by Ownership by Household Size in Mayo
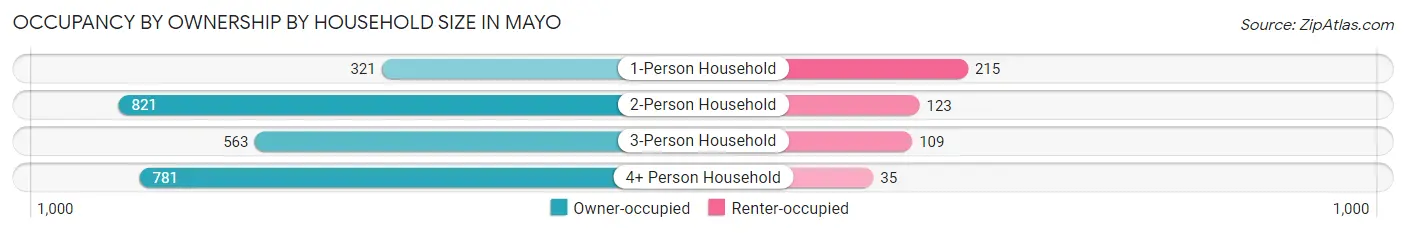
| Household Size | Owner-occupied | Renter-occupied |
| 1-Person Household | 321 (59.9%) | 215 (40.1%) |
| 2-Person Household | 821 (87.0%) | 123 (13.0%) |
| 3-Person Household | 563 (83.8%) | 109 (16.2%) |
| 4+ Person Household | 781 (95.7%) | 35 (4.3%) |
| Total Housing Units | 2,486 (83.8%) | 482 (16.2%) |
Occupancy by Educational Attainment in Mayo
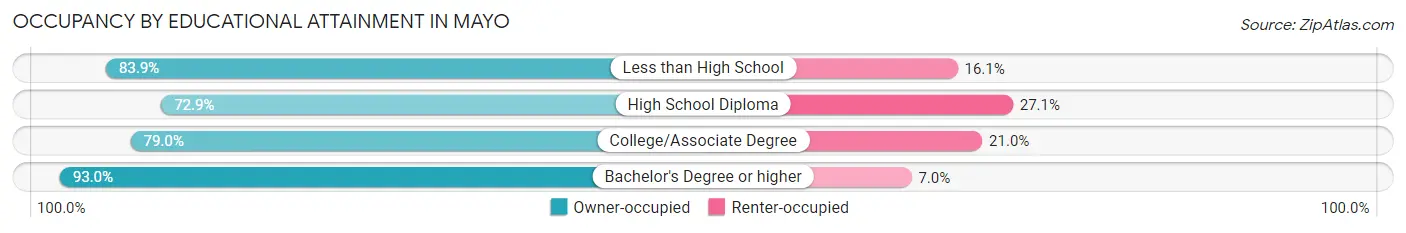
| Household Size | Owner-occupied | Renter-occupied |
| Less than High School | 130 (83.9%) | 25 (16.1%) |
| High School Diploma | 463 (72.9%) | 172 (27.1%) |
| College/Associate Degree | 748 (79.0%) | 199 (21.0%) |
| Bachelor's Degree or higher | 1,145 (93.0%) | 86 (7.0%) |
Occupancy by Age of Householder in Mayo
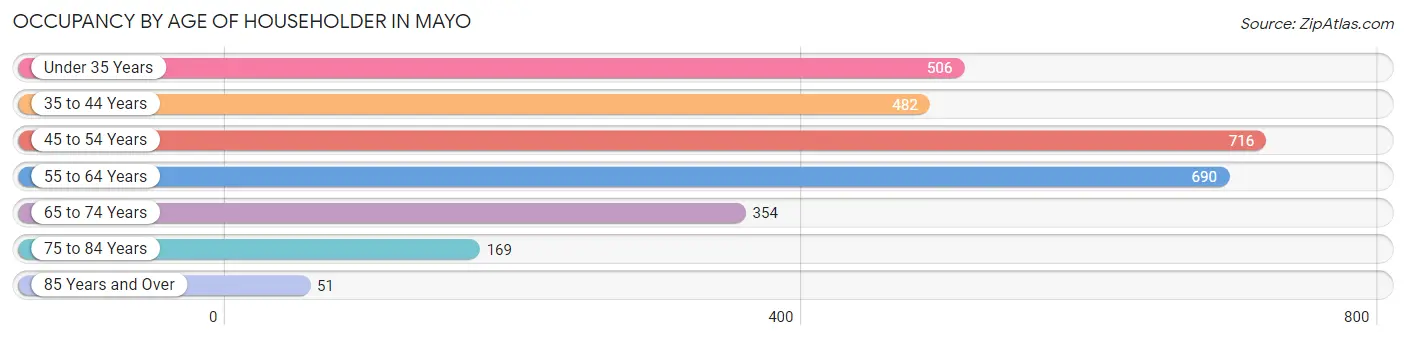
| Age Bracket | # Households | % Households |
| Under 35 Years | 506 | 17.1% |
| 35 to 44 Years | 482 | 16.2% |
| 45 to 54 Years | 716 | 24.1% |
| 55 to 64 Years | 690 | 23.3% |
| 65 to 74 Years | 354 | 11.9% |
| 75 to 84 Years | 169 | 5.7% |
| 85 Years and Over | 51 | 1.7% |
| Total | 2,968 | 100.0% |
Housing Finances in Mayo
Median Income by Occupancy in Mayo
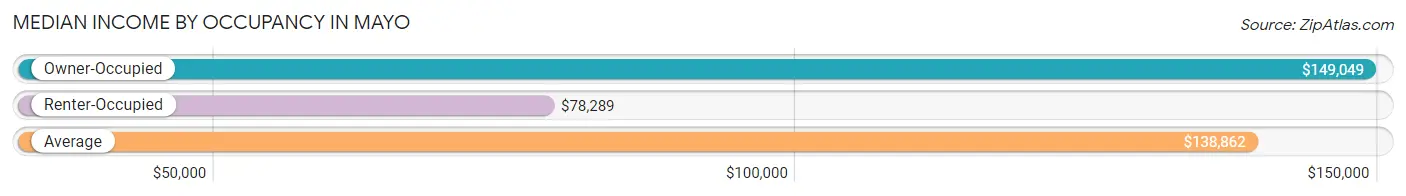
| Occupancy Type | # Households | Median Income |
| Owner-Occupied | 2,486 (83.8%) | $149,049 |
| Renter-Occupied | 482 (16.2%) | $78,289 |
| Average | 2,968 (100.0%) | $138,862 |
Occupancy by Householder Income Bracket in Mayo
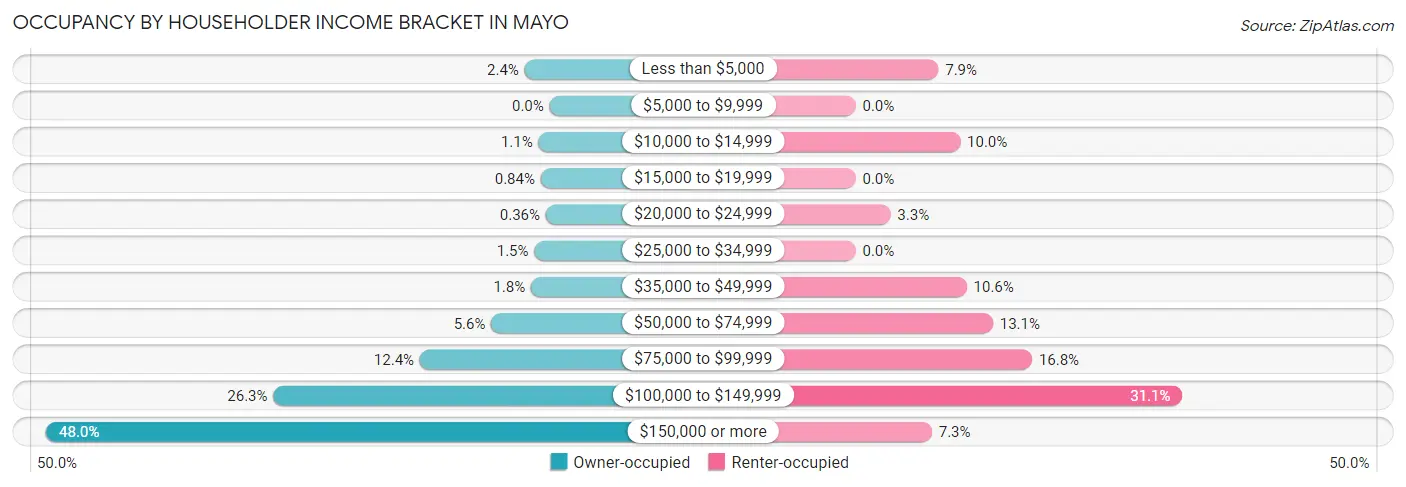
| Income Bracket | Owner-occupied | Renter-occupied |
| Less than $5,000 | 59 (2.4%) | 38 (7.9%) |
| $5,000 to $9,999 | 0 (0.0%) | 0 (0.0%) |
| $10,000 to $14,999 | 26 (1.1%) | 48 (10.0%) |
| $15,000 to $19,999 | 21 (0.8%) | 0 (0.0%) |
| $20,000 to $24,999 | 9 (0.4%) | 16 (3.3%) |
| $25,000 to $34,999 | 36 (1.5%) | 0 (0.0%) |
| $35,000 to $49,999 | 44 (1.8%) | 51 (10.6%) |
| $50,000 to $74,999 | 138 (5.6%) | 63 (13.1%) |
| $75,000 to $99,999 | 307 (12.3%) | 81 (16.8%) |
| $100,000 to $149,999 | 654 (26.3%) | 150 (31.1%) |
| $150,000 or more | 1,192 (47.9%) | 35 (7.3%) |
| Total | 2,486 (100.0%) | 482 (100.0%) |
Monthly Housing Cost Tiers in Mayo
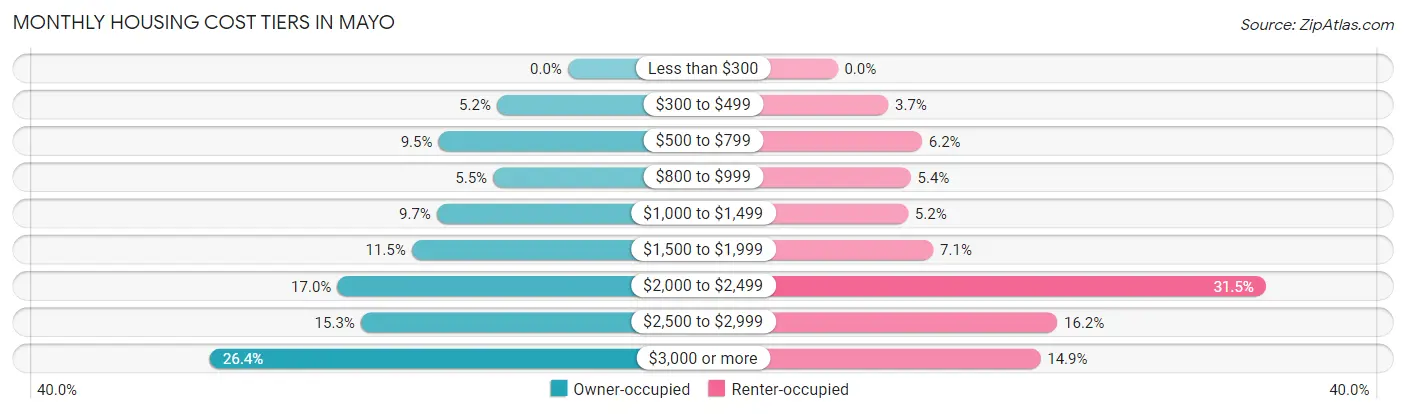
| Monthly Cost | Owner-occupied | Renter-occupied |
| Less than $300 | 0 (0.0%) | 0 (0.0%) |
| $300 to $499 | 130 (5.2%) | 18 (3.7%) |
| $500 to $799 | 237 (9.5%) | 30 (6.2%) |
| $800 to $999 | 137 (5.5%) | 26 (5.4%) |
| $1,000 to $1,499 | 240 (9.7%) | 25 (5.2%) |
| $1,500 to $1,999 | 286 (11.5%) | 34 (7.0%) |
| $2,000 to $2,499 | 422 (17.0%) | 152 (31.5%) |
| $2,500 to $2,999 | 379 (15.2%) | 78 (16.2%) |
| $3,000 or more | 655 (26.4%) | 72 (14.9%) |
| Total | 2,486 (100.0%) | 482 (100.0%) |
Physical Housing Characteristics in Mayo
Housing Structures in Mayo
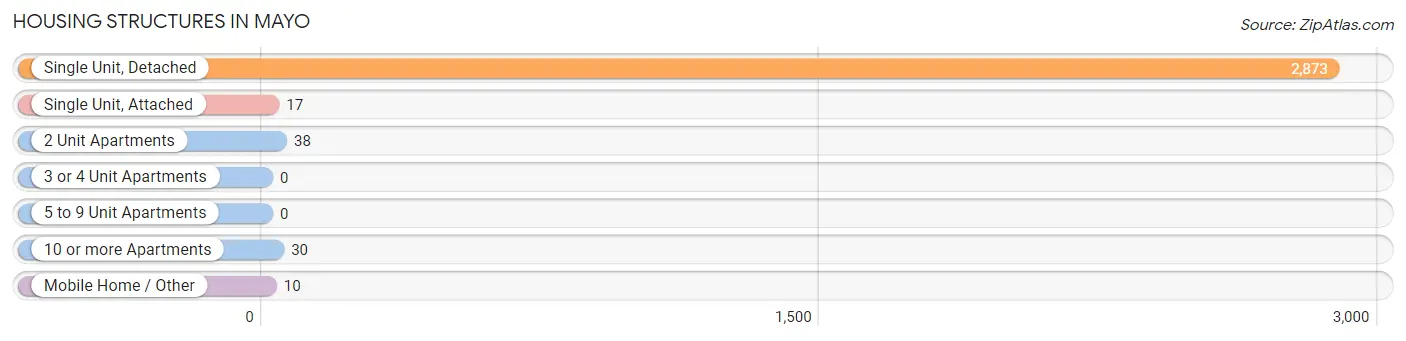
| Structure Type | # Housing Units | % Housing Units |
| Single Unit, Detached | 2,873 | 96.8% |
| Single Unit, Attached | 17 | 0.6% |
| 2 Unit Apartments | 38 | 1.3% |
| 3 or 4 Unit Apartments | 0 | 0.0% |
| 5 to 9 Unit Apartments | 0 | 0.0% |
| 10 or more Apartments | 30 | 1.0% |
| Mobile Home / Other | 10 | 0.3% |
| Total | 2,968 | 100.0% |
Housing Structures by Occupancy in Mayo
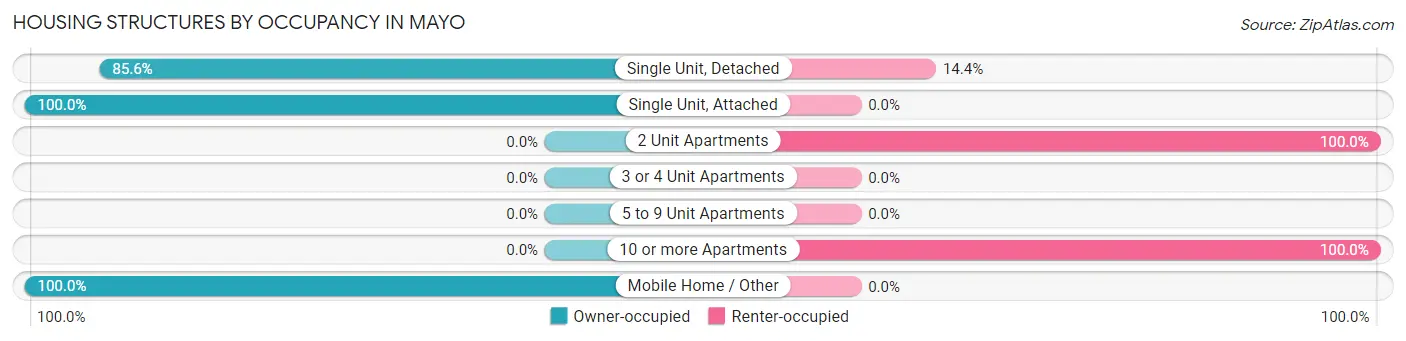
| Structure Type | Owner-occupied | Renter-occupied |
| Single Unit, Detached | 2,459 (85.6%) | 414 (14.4%) |
| Single Unit, Attached | 17 (100.0%) | 0 (0.0%) |
| 2 Unit Apartments | 0 (0.0%) | 38 (100.0%) |
| 3 or 4 Unit Apartments | 0 (0.0%) | 0 (0.0%) |
| 5 to 9 Unit Apartments | 0 (0.0%) | 0 (0.0%) |
| 10 or more Apartments | 0 (0.0%) | 30 (100.0%) |
| Mobile Home / Other | 10 (100.0%) | 0 (0.0%) |
| Total | 2,486 (83.8%) | 482 (16.2%) |
Housing Structures by Number of Rooms in Mayo
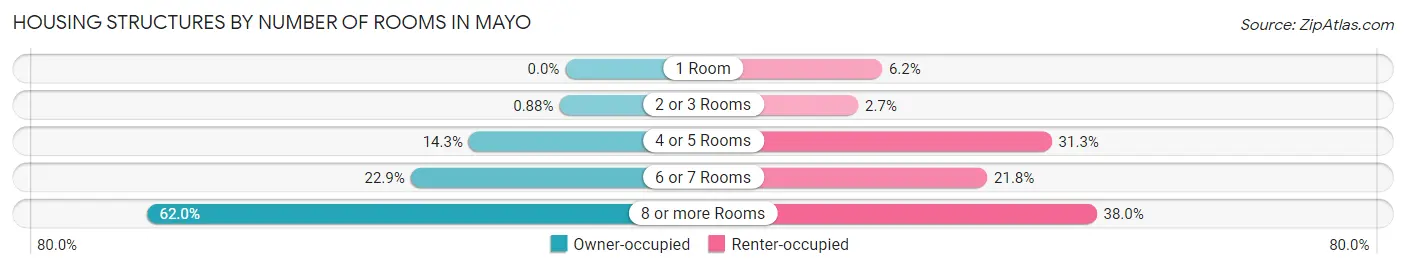
| Number of Rooms | Owner-occupied | Renter-occupied |
| 1 Room | 0 (0.0%) | 30 (6.2%) |
| 2 or 3 Rooms | 22 (0.9%) | 13 (2.7%) |
| 4 or 5 Rooms | 355 (14.3%) | 151 (31.3%) |
| 6 or 7 Rooms | 569 (22.9%) | 105 (21.8%) |
| 8 or more Rooms | 1,540 (62.0%) | 183 (38.0%) |
| Total | 2,486 (100.0%) | 482 (100.0%) |
Housing Structure by Heating Type in Mayo
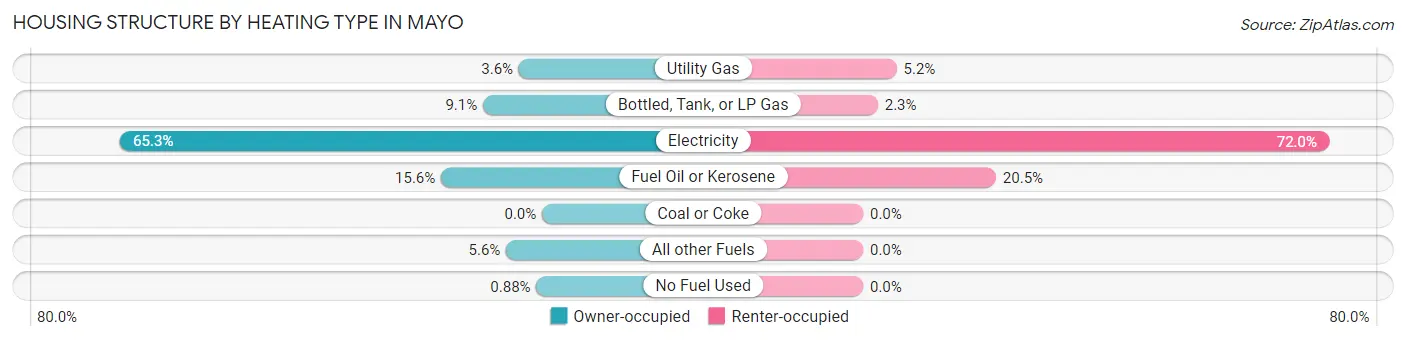
| Heating Type | Owner-occupied | Renter-occupied |
| Utility Gas | 89 (3.6%) | 25 (5.2%) |
| Bottled, Tank, or LP Gas | 227 (9.1%) | 11 (2.3%) |
| Electricity | 1,622 (65.2%) | 347 (72.0%) |
| Fuel Oil or Kerosene | 388 (15.6%) | 99 (20.5%) |
| Coal or Coke | 0 (0.0%) | 0 (0.0%) |
| All other Fuels | 138 (5.6%) | 0 (0.0%) |
| No Fuel Used | 22 (0.9%) | 0 (0.0%) |
| Total | 2,486 (100.0%) | 482 (100.0%) |
Household Vehicle Usage in Mayo
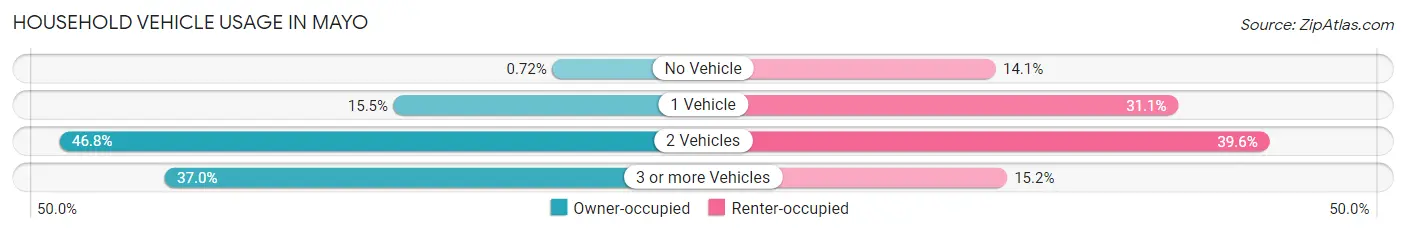
| Vehicles per Household | Owner-occupied | Renter-occupied |
| No Vehicle | 18 (0.7%) | 68 (14.1%) |
| 1 Vehicle | 386 (15.5%) | 150 (31.1%) |
| 2 Vehicles | 1,163 (46.8%) | 191 (39.6%) |
| 3 or more Vehicles | 919 (37.0%) | 73 (15.1%) |
| Total | 2,486 (100.0%) | 482 (100.0%) |
Real Estate & Mortgages in Mayo
Real Estate and Mortgage Overview in Mayo
| Characteristic | Without Mortgage | With Mortgage |
| Housing Units | 611 | 1,875 |
| Median Property Value | $453,400 | $567,900 |
| Median Household Income | $138,958 | $1,016 |
| Monthly Housing Costs | $779 | $655 |
| Real Estate Taxes | $3,706 | $29 |
Property Value by Mortgage Status in Mayo
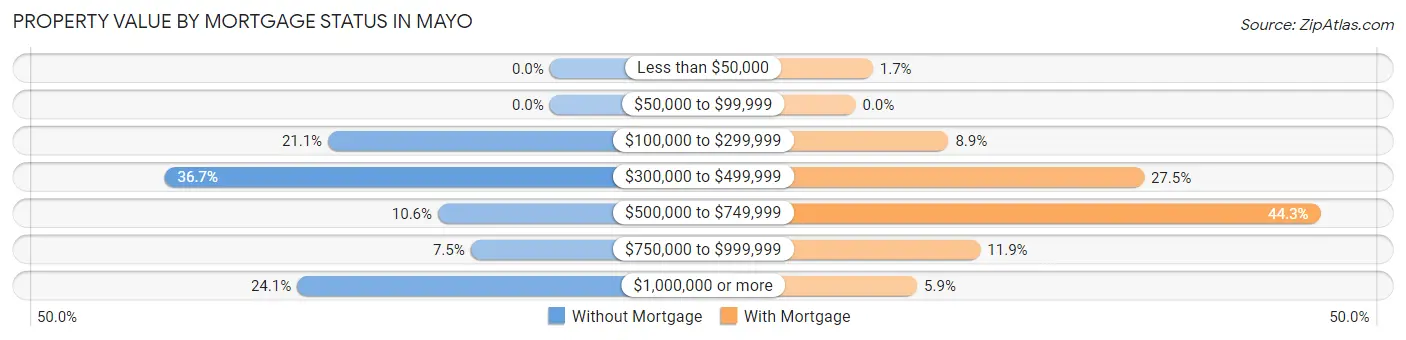
| Property Value | Without Mortgage | With Mortgage |
| Less than $50,000 | 0 (0.0%) | 31 (1.7%) |
| $50,000 to $99,999 | 0 (0.0%) | 0 (0.0%) |
| $100,000 to $299,999 | 129 (21.1%) | 166 (8.8%) |
| $300,000 to $499,999 | 224 (36.7%) | 515 (27.5%) |
| $500,000 to $749,999 | 65 (10.6%) | 830 (44.3%) |
| $750,000 to $999,999 | 46 (7.5%) | 223 (11.9%) |
| $1,000,000 or more | 147 (24.1%) | 110 (5.9%) |
| Total | 611 (100.0%) | 1,875 (100.0%) |
Household Income by Mortgage Status in Mayo
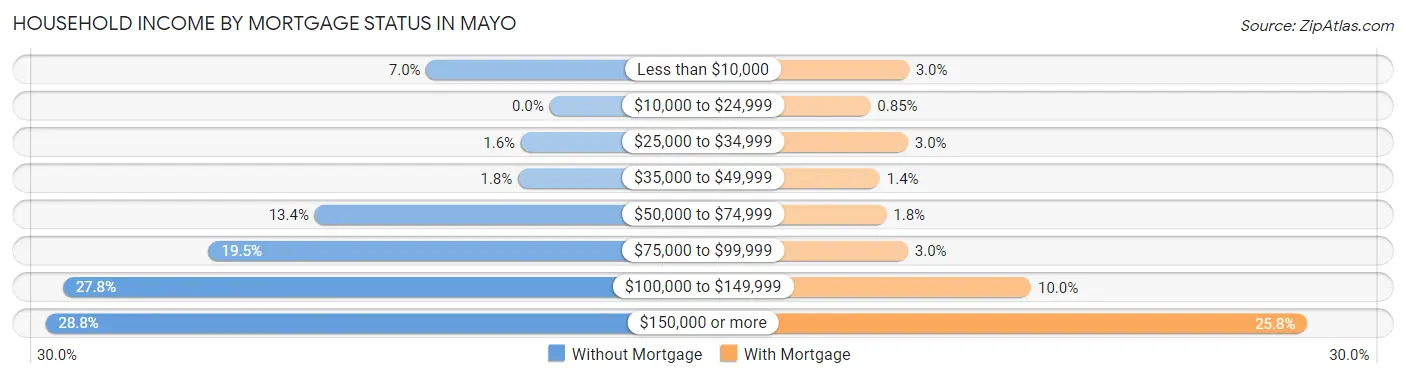
| Household Income | Without Mortgage | With Mortgage |
| Less than $10,000 | 43 (7.0%) | 57 (3.0%) |
| $10,000 to $24,999 | 0 (0.0%) | 16 (0.9%) |
| $25,000 to $34,999 | 10 (1.6%) | 56 (3.0%) |
| $35,000 to $49,999 | 11 (1.8%) | 26 (1.4%) |
| $50,000 to $74,999 | 82 (13.4%) | 33 (1.8%) |
| $75,000 to $99,999 | 119 (19.5%) | 56 (3.0%) |
| $100,000 to $149,999 | 170 (27.8%) | 188 (10.0%) |
| $150,000 or more | 176 (28.8%) | 484 (25.8%) |
| Total | 611 (100.0%) | 1,875 (100.0%) |
Property Value to Household Income Ratio in Mayo
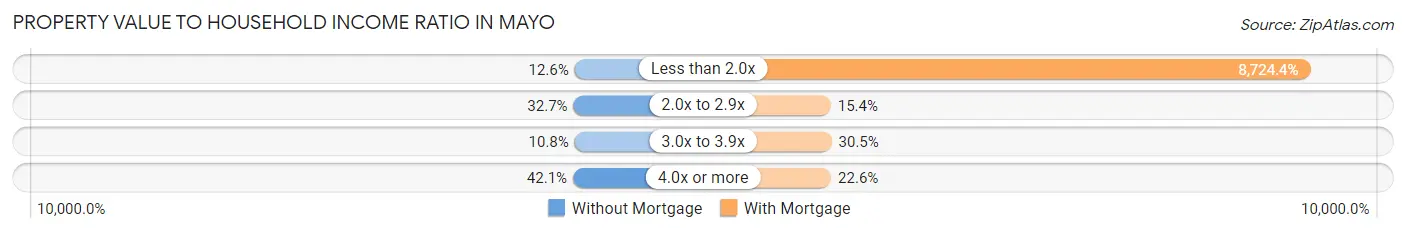
| Value-to-Income Ratio | Without Mortgage | With Mortgage |
| Less than 2.0x | 77 (12.6%) | 163,583 (8,724.4%) |
| 2.0x to 2.9x | 200 (32.7%) | 289 (15.4%) |
| 3.0x to 3.9x | 66 (10.8%) | 571 (30.4%) |
| 4.0x or more | 257 (42.1%) | 424 (22.6%) |
| Total | 611 (100.0%) | 1,875 (100.0%) |
Real Estate Taxes by Mortgage Status in Mayo
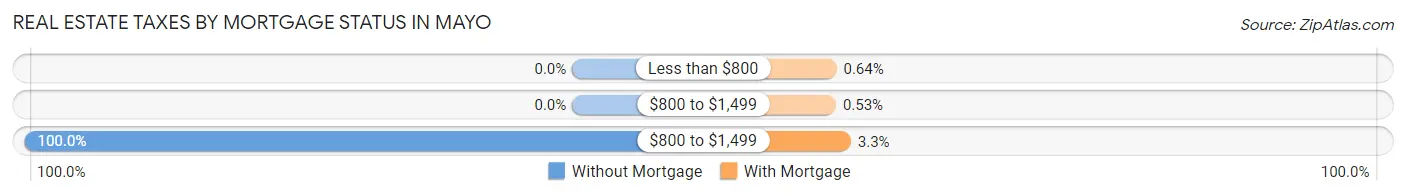
| Property Taxes | Without Mortgage | With Mortgage |
| Less than $800 | 0 (0.0%) | 12 (0.6%) |
| $800 to $1,499 | 0 (0.0%) | 10 (0.5%) |
| $800 to $1,499 | 611 (100.0%) | 61 (3.3%) |
| Total | 611 (100.0%) | 1,875 (100.0%) |
Health & Disability in Mayo
Health Insurance Coverage by Age in Mayo
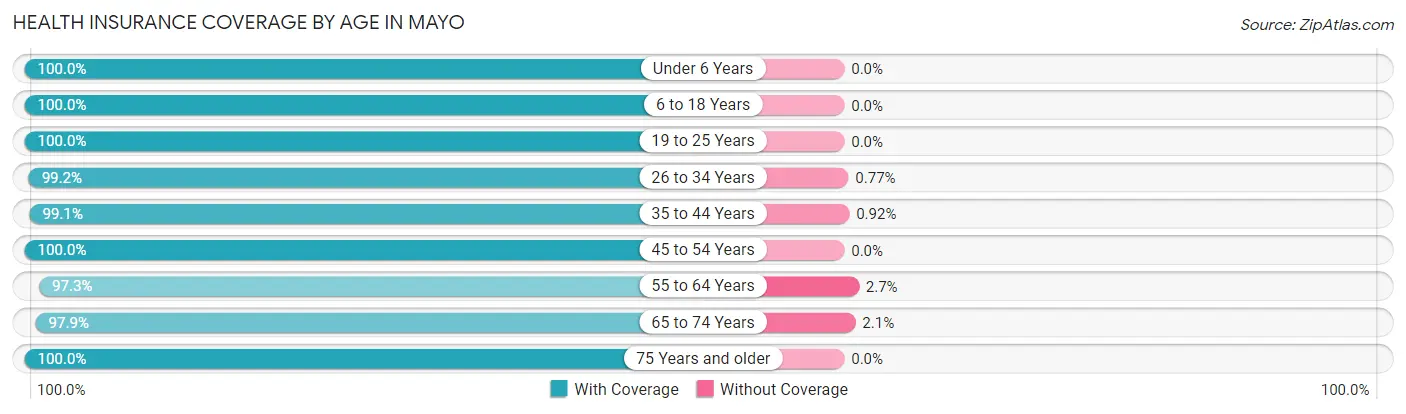
| Age Bracket | With Coverage | Without Coverage |
| Under 6 Years | 868 (100.0%) | 0 (0.0%) |
| 6 to 18 Years | 1,224 (100.0%) | 0 (0.0%) |
| 19 to 25 Years | 437 (100.0%) | 0 (0.0%) |
| 26 to 34 Years | 1,155 (99.2%) | 9 (0.8%) |
| 35 to 44 Years | 862 (99.1%) | 8 (0.9%) |
| 45 to 54 Years | 1,311 (100.0%) | 0 (0.0%) |
| 55 to 64 Years | 1,182 (97.3%) | 33 (2.7%) |
| 65 to 74 Years | 567 (97.9%) | 12 (2.1%) |
| 75 Years and older | 439 (100.0%) | 0 (0.0%) |
| Total | 8,045 (99.2%) | 62 (0.8%) |
Health Insurance Coverage by Citizenship Status in Mayo
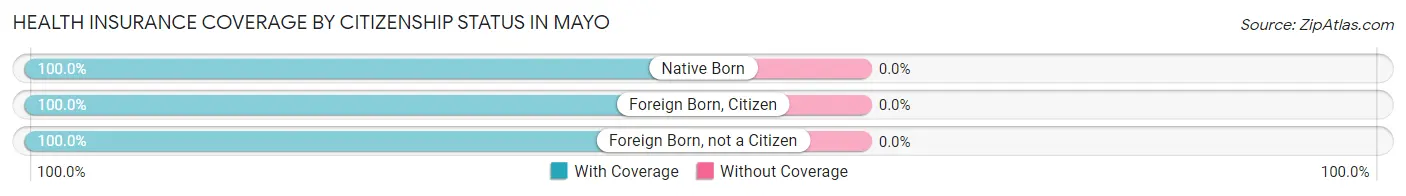
| Citizenship Status | With Coverage | Without Coverage |
| Native Born | 868 (100.0%) | 0 (0.0%) |
| Foreign Born, Citizen | 1,224 (100.0%) | 0 (0.0%) |
| Foreign Born, not a Citizen | 437 (100.0%) | 0 (0.0%) |
Health Insurance Coverage by Household Income in Mayo
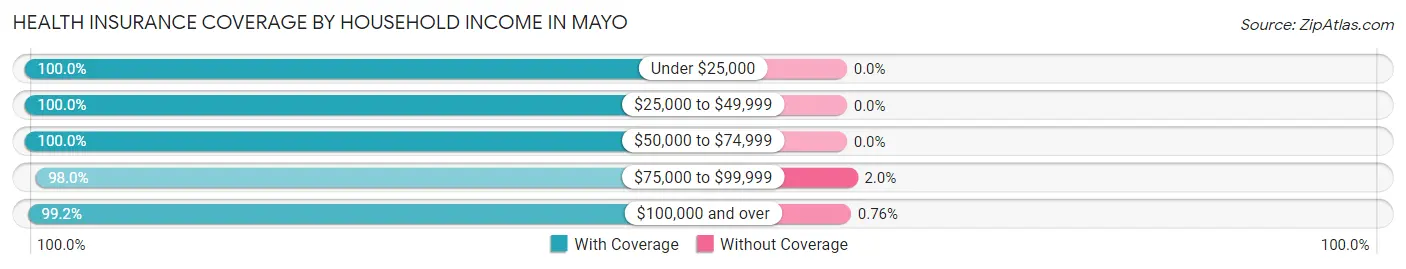
| Household Income | With Coverage | Without Coverage |
| Under $25,000 | 409 (100.0%) | 0 (0.0%) |
| $25,000 to $49,999 | 228 (100.0%) | 0 (0.0%) |
| $50,000 to $74,999 | 331 (100.0%) | 0 (0.0%) |
| $75,000 to $99,999 | 637 (98.0%) | 13 (2.0%) |
| $100,000 and over | 6,438 (99.2%) | 49 (0.8%) |
Public vs Private Health Insurance Coverage by Age in Mayo
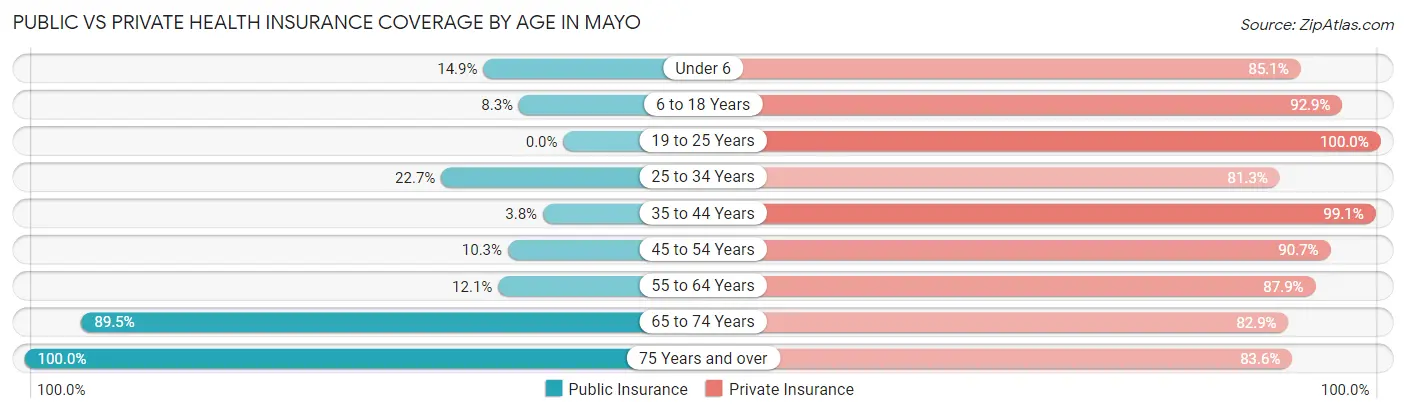
| Age Bracket | Public Insurance | Private Insurance |
| Under 6 | 129 (14.9%) | 739 (85.1%) |
| 6 to 18 Years | 101 (8.3%) | 1,137 (92.9%) |
| 19 to 25 Years | 0 (0.0%) | 437 (100.0%) |
| 25 to 34 Years | 264 (22.7%) | 946 (81.3%) |
| 35 to 44 Years | 33 (3.8%) | 862 (99.1%) |
| 45 to 54 Years | 135 (10.3%) | 1,189 (90.7%) |
| 55 to 64 Years | 147 (12.1%) | 1,068 (87.9%) |
| 65 to 74 Years | 518 (89.5%) | 480 (82.9%) |
| 75 Years and over | 439 (100.0%) | 367 (83.6%) |
| Total | 1,766 (21.8%) | 7,225 (89.1%) |
Disability Status by Sex by Age in Mayo
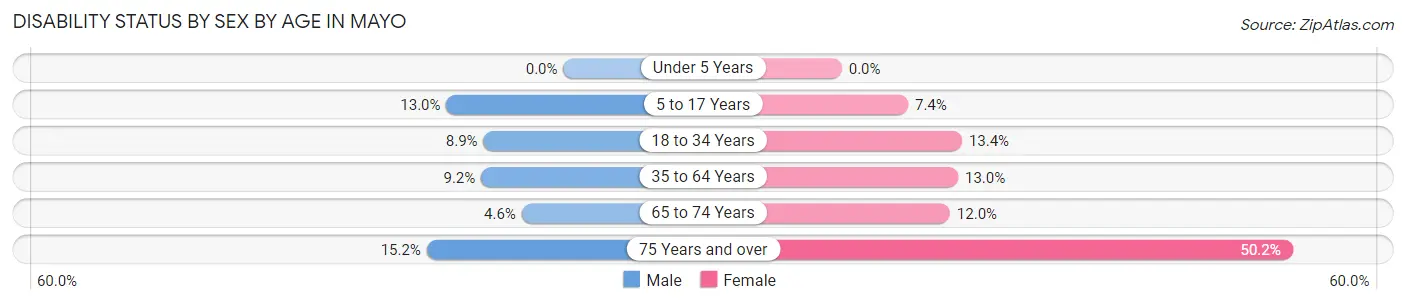
| Age Bracket | Male | Female |
| Under 5 Years | 0 (0.0%) | 0 (0.0%) |
| 5 to 17 Years | 68 (13.0%) | 42 (7.4%) |
| 18 to 34 Years | 97 (8.9%) | 99 (13.4%) |
| 35 to 64 Years | 142 (9.2%) | 239 (13.0%) |
| 65 to 74 Years | 13 (4.6%) | 36 (12.0%) |
| 75 Years and over | 28 (15.2%) | 128 (50.2%) |
Disability Class by Sex by Age in Mayo
Disability Class: Hearing Difficulty
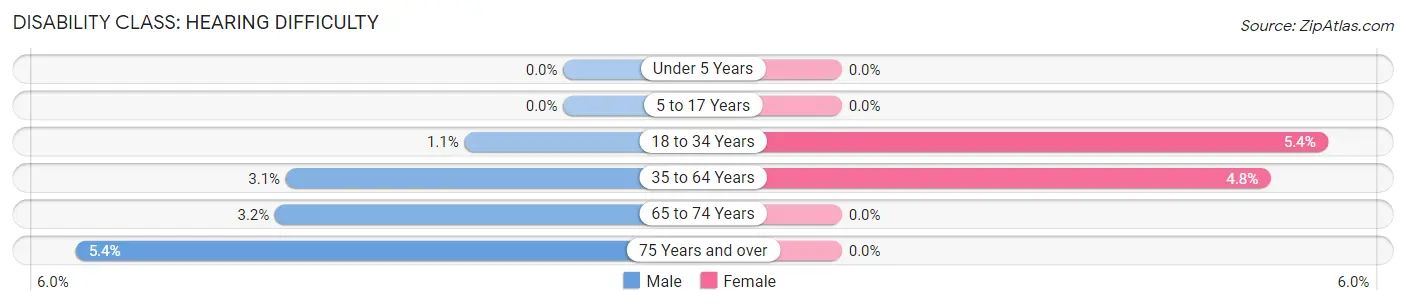
| Age Bracket | Male | Female |
| Under 5 Years | 0 (0.0%) | 0 (0.0%) |
| 5 to 17 Years | 0 (0.0%) | 0 (0.0%) |
| 18 to 34 Years | 12 (1.1%) | 40 (5.4%) |
| 35 to 64 Years | 48 (3.1%) | 88 (4.8%) |
| 65 to 74 Years | 9 (3.2%) | 0 (0.0%) |
| 75 Years and over | 10 (5.4%) | 0 (0.0%) |
Disability Class: Vision Difficulty
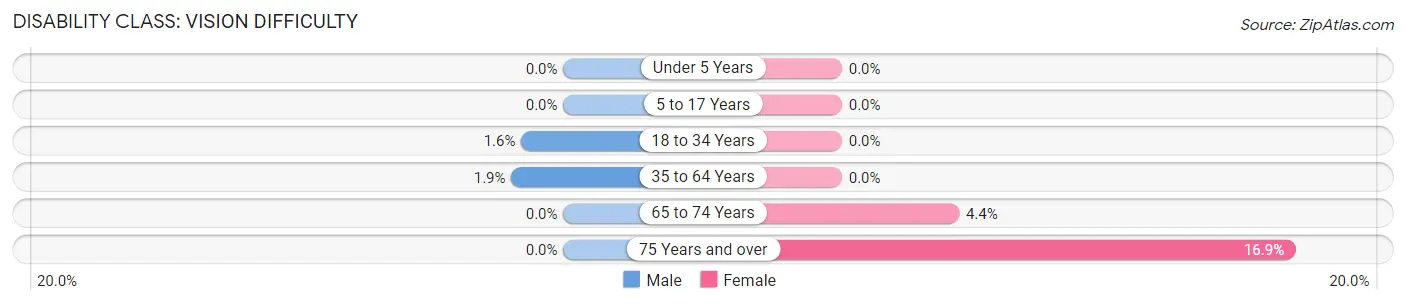
| Age Bracket | Male | Female |
| Under 5 Years | 0 (0.0%) | 0 (0.0%) |
| 5 to 17 Years | 0 (0.0%) | 0 (0.0%) |
| 18 to 34 Years | 17 (1.6%) | 0 (0.0%) |
| 35 to 64 Years | 30 (1.9%) | 0 (0.0%) |
| 65 to 74 Years | 0 (0.0%) | 13 (4.3%) |
| 75 Years and over | 0 (0.0%) | 43 (16.9%) |
Disability Class: Cognitive Difficulty
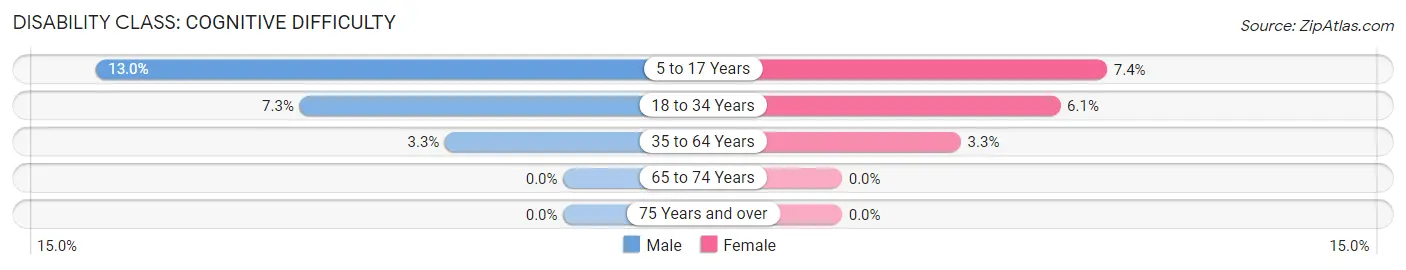
| Age Bracket | Male | Female |
| 5 to 17 Years | 68 (13.0%) | 42 (7.4%) |
| 18 to 34 Years | 80 (7.3%) | 45 (6.1%) |
| 35 to 64 Years | 51 (3.3%) | 61 (3.3%) |
| 65 to 74 Years | 0 (0.0%) | 0 (0.0%) |
| 75 Years and over | 0 (0.0%) | 0 (0.0%) |
Disability Class: Ambulatory Difficulty
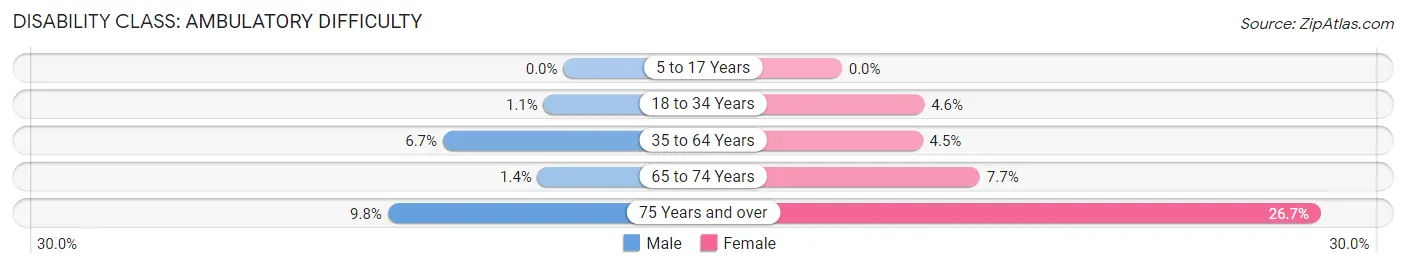
| Age Bracket | Male | Female |
| 5 to 17 Years | 0 (0.0%) | 0 (0.0%) |
| 18 to 34 Years | 12 (1.1%) | 34 (4.6%) |
| 35 to 64 Years | 104 (6.7%) | 83 (4.5%) |
| 65 to 74 Years | 4 (1.4%) | 23 (7.7%) |
| 75 Years and over | 18 (9.8%) | 68 (26.7%) |
Disability Class: Self-Care Difficulty
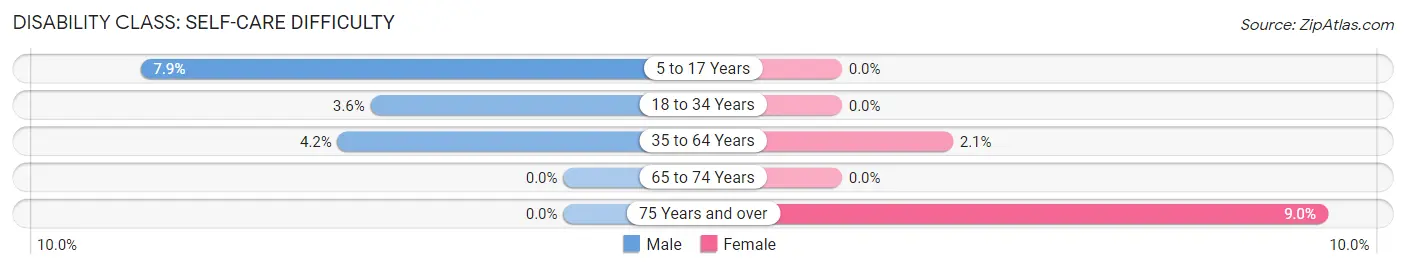
| Age Bracket | Male | Female |
| 5 to 17 Years | 41 (7.9%) | 0 (0.0%) |
| 18 to 34 Years | 39 (3.6%) | 0 (0.0%) |
| 35 to 64 Years | 65 (4.2%) | 38 (2.1%) |
| 65 to 74 Years | 0 (0.0%) | 0 (0.0%) |
| 75 Years and over | 0 (0.0%) | 23 (9.0%) |
Technology Access in Mayo
Computing Device Access in Mayo
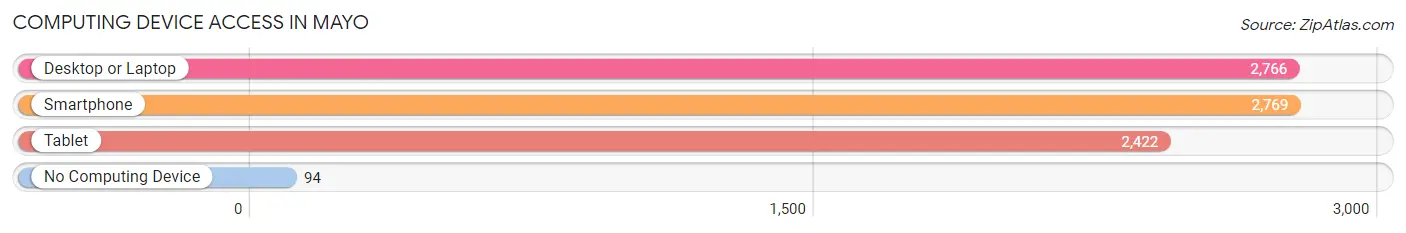
| Device Type | # Households | % Households |
| Desktop or Laptop | 2,766 | 93.2% |
| Smartphone | 2,769 | 93.3% |
| Tablet | 2,422 | 81.6% |
| No Computing Device | 94 | 3.2% |
| Total | 2,968 | 100.0% |
Internet Access in Mayo
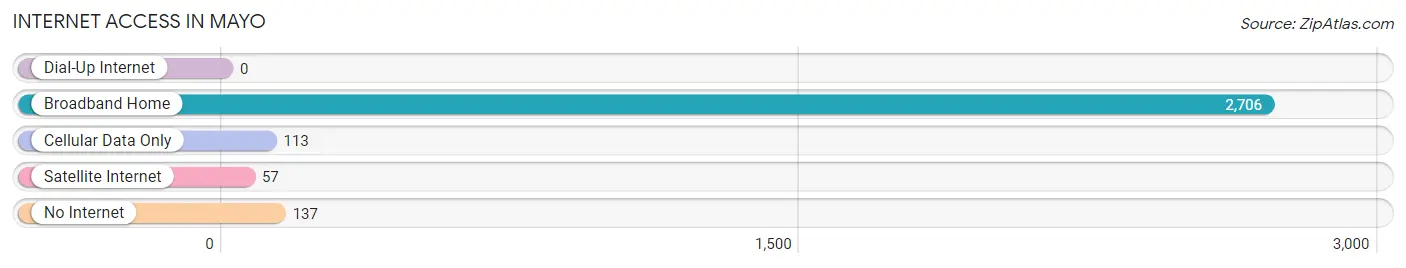
| Internet Type | # Households | % Households |
| Dial-Up Internet | 0 | 0.0% |
| Broadband Home | 2,706 | 91.2% |
| Cellular Data Only | 113 | 3.8% |
| Satellite Internet | 57 | 1.9% |
| No Internet | 137 | 4.6% |
| Total | 2,968 | 100.0% |
Mayo Summary
Mayo is a county located in the west of Ireland, in the province of Connacht. It is bordered by Galway, Roscommon, Sligo and Leitrim. Mayo is the third largest of Ireland’s 32 counties, with an area of 7,449 km2 (2,878 sq mi). Mayo has a population of 130,638, according to the 2016 census.
History
The history of Mayo dates back to pre-historic times. The county was part of the ancient kingdom of Connacht, which was ruled by the O’Connor dynasty. The county was also the site of many battles between the Irish and the English during the 16th and 17th centuries.
In the 19th century, Mayo was the site of the Great Famine, which caused the death of thousands of people and the emigration of many more. The county was also the site of the Land War, a period of agrarian unrest in the late 19th century.
Geography
Mayo is located in the west of Ireland, in the province of Connacht. It is bordered by Galway, Roscommon, Sligo and Leitrim. Mayo is the third largest of Ireland’s 32 counties, with an area of 7,449 km2 (2,878 sq mi).
The county is divided into four distinct geographical regions: the North Mayo Plain, the Central Plain, the South Mayo Plain and the West Mayo Mountains. The North Mayo Plain is a low-lying area of bogland and heath, while the Central Plain is a fertile agricultural area. The South Mayo Plain is a hilly area of limestone and sandstone, while the West Mayo Mountains are a range of rugged hills and mountains.
Economy
The economy of Mayo is largely based on agriculture, with dairy farming and livestock rearing being the main activities. Other industries in the county include tourism, fishing, food processing and manufacturing.
Mayo is also home to a number of technology companies, including the software company IONA Technologies, which is based in Castlebar.
Demographics
According to the 2016 census, Mayo has a population of 130,638. The county has a population density of 17.5 people per km2 (45.4 people per sq mi).
The majority of the population is Roman Catholic (87.2%), followed by Church of Ireland (4.2%), other Christian denominations (2.2%) and other religions (1.2%). The county has a young population, with a median age of 35.7 years.
Mayo has a high level of emigration, with many people leaving the county to seek work in other parts of Ireland and abroad. The county also has a high level of unemployment, with an unemployment rate of 13.2%.
Common Questions
What is Per Capita Income in Mayo?
Per Capita income in Mayo is $61,983.
What is the Median Family Income in Mayo?
Median Family Income in Mayo is $148,667.
What is the Median Household income in Mayo?
Median Household Income in Mayo is $138,862.
What is Income or Wage Gap in Mayo?
Income or Wage Gap in Mayo is 24.5%.
Women in Mayo earn 75.5 cents for every dollar earned by a man.
What is Inequality or Gini Index in Mayo?
Inequality or Gini Index in Mayo is 0.39.
What is the Total Population of Mayo?
Total Population of Mayo is 8,255.
What is the Total Male Population of Mayo?
Total Male Population of Mayo is 4,141.
What is the Total Female Population of Mayo?
Total Female Population of Mayo is 4,114.
What is the Ratio of Males per 100 Females in Mayo?
There are 100.66 Males per 100 Females in Mayo.
What is the Ratio of Females per 100 Males in Mayo?
There are 99.35 Females per 100 Males in Mayo.
What is the Median Population Age in Mayo?
Median Population Age in Mayo is 38.6 Years.
What is the Average Family Size in Mayo
Average Family Size in Mayo is 3.1 People.
What is the Average Household Size in Mayo
Average Household Size in Mayo is 2.8 People.
How Large is the Labor Force in Mayo?
There are 4,705 People in the Labor Forcein in Mayo.
What is the Percentage of People in the Labor Force in Mayo?
70.6% of People are in the Labor Force in Mayo.
What is the Unemployment Rate in Mayo?
Unemployment Rate in Mayo is 5.6%.