Arnold, MD Map & Demographics
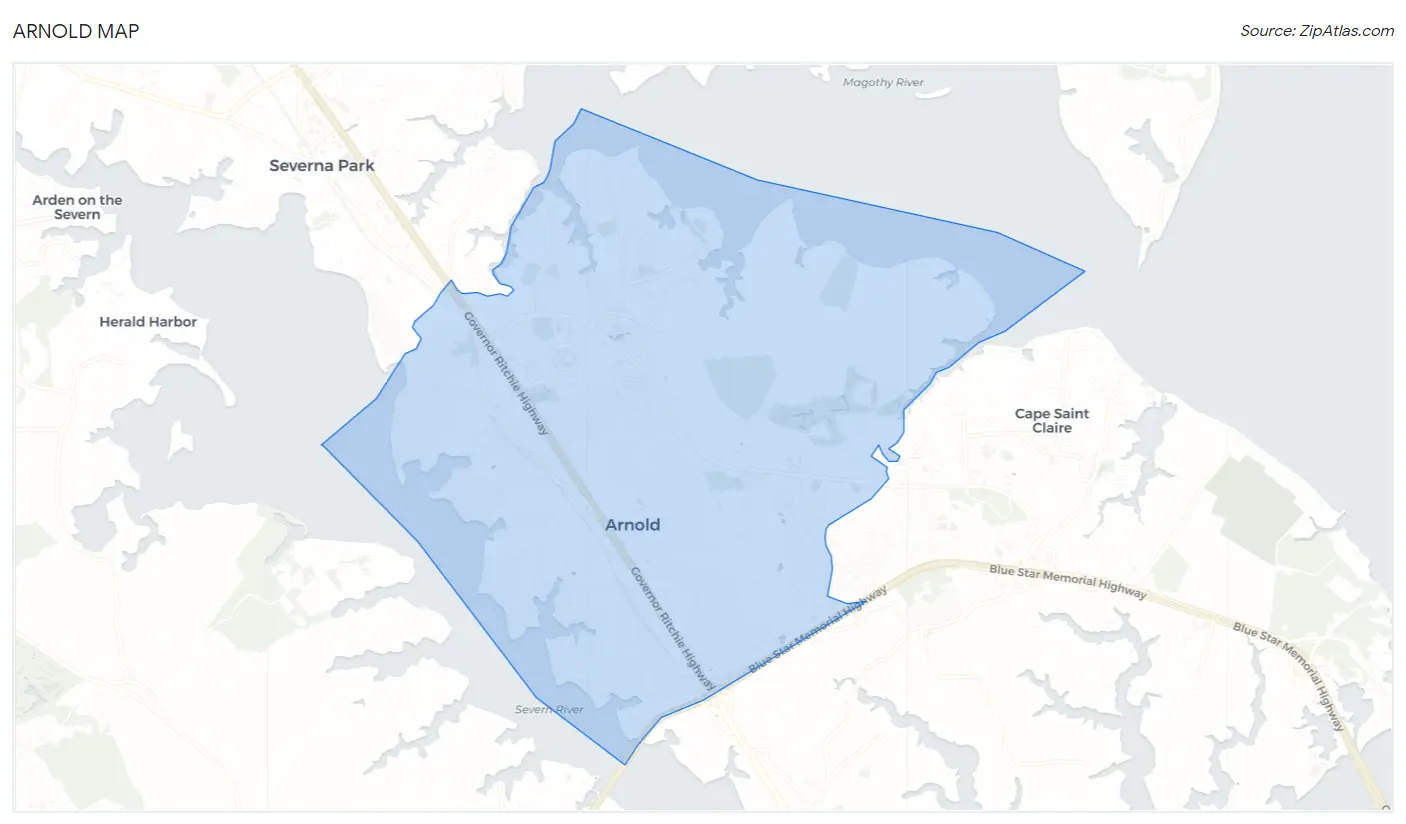
Arnold Map
Arnold Overview
$59,231
PER CAPITA INCOME
$149,865
AVG FAMILY INCOME
$137,075
AVG HOUSEHOLD INCOME
29.0%
WAGE / INCOME GAP [ % ]
71.0¢/ $1
WAGE / INCOME GAP [ $ ]
$13,845
FAMILY INCOME DEFICIT
0.38
INEQUALITY / GINI INDEX
24,825
TOTAL POPULATION
12,149
MALE POPULATION
12,676
FEMALE POPULATION
95.84
MALES / 100 FEMALES
104.34
FEMALES / 100 MALES
38.0
MEDIAN AGE
3.2
AVG FAMILY SIZE
2.8
AVG HOUSEHOLD SIZE
13,363
LABOR FORCE [ PEOPLE ]
70.1%
PERCENT IN LABOR FORCE
3.4%
UNEMPLOYMENT RATE
Arnold Zip Codes
Arnold Area Codes
Income in Arnold
Income Overview in Arnold
Per Capita Income in Arnold is $59,231, while median incomes of families and households are $149,865 and $137,075 respectively.
| Characteristic | Number | Measure |
| Per Capita Income | 24,825 | $59,231 |
| Median Family Income | 6,758 | $149,865 |
| Mean Family Income | 6,758 | $181,075 |
| Median Household Income | 8,669 | $137,075 |
| Mean Household Income | 8,669 | $169,091 |
| Income Deficit | 6,758 | $13,845 |
| Wage / Income Gap (%) | 24,825 | 29.04% |
| Wage / Income Gap ($) | 24,825 | 70.96¢ per $1 |
| Gini / Inequality Index | 24,825 | 0.38 |
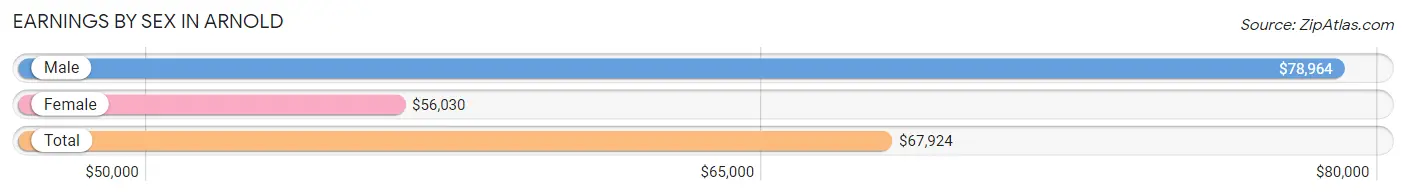
Earnings by Sex in Arnold
Average Earnings in Arnold are $67,924, $78,964 for men and $56,030 for women, a difference of 29.0%.
| Sex | Number | Average Earnings |
| Male | 7,315 (51.3%) | $78,964 |
| Female | 6,939 (48.7%) | $56,030 |
| Total | 14,254 (100.0%) | $67,924 |
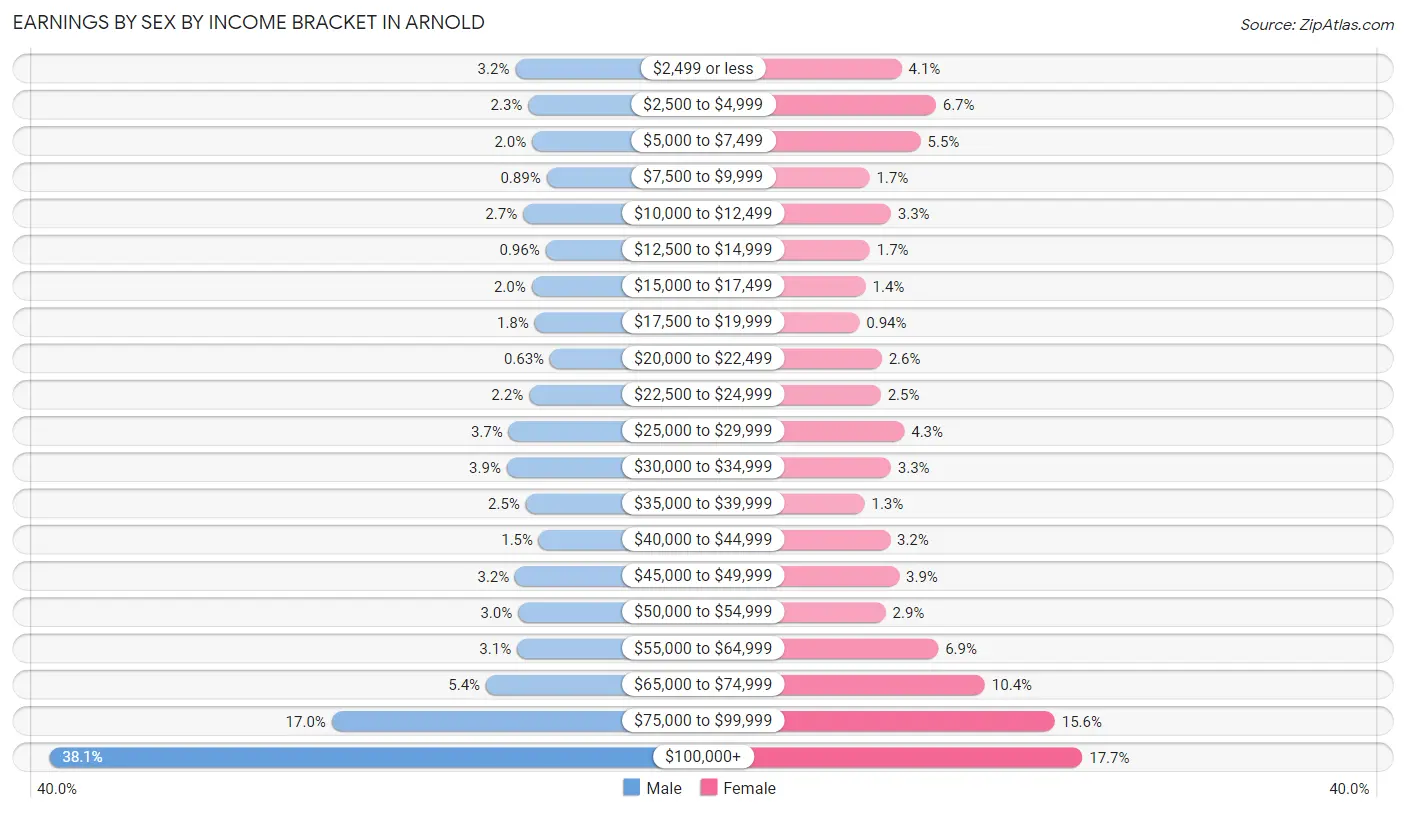
Earnings by Sex by Income Bracket in Arnold
The most common earnings brackets in Arnold are $100,000+ for men (2,790 | 38.1%) and $100,000+ for women (1,225 | 17.6%).
| Income | Male | Female |
| $2,499 or less | 236 (3.2%) | 285 (4.1%) |
| $2,500 to $4,999 | 165 (2.3%) | 463 (6.7%) |
| $5,000 to $7,499 | 144 (2.0%) | 384 (5.5%) |
| $7,500 to $9,999 | 65 (0.9%) | 118 (1.7%) |
| $10,000 to $12,499 | 194 (2.6%) | 229 (3.3%) |
| $12,500 to $14,999 | 70 (1.0%) | 120 (1.7%) |
| $15,000 to $17,499 | 147 (2.0%) | 98 (1.4%) |
| $17,500 to $19,999 | 130 (1.8%) | 65 (0.9%) |
| $20,000 to $22,499 | 46 (0.6%) | 182 (2.6%) |
| $22,500 to $24,999 | 161 (2.2%) | 176 (2.5%) |
| $25,000 to $29,999 | 273 (3.7%) | 299 (4.3%) |
| $30,000 to $34,999 | 283 (3.9%) | 229 (3.3%) |
| $35,000 to $39,999 | 179 (2.5%) | 92 (1.3%) |
| $40,000 to $44,999 | 107 (1.5%) | 225 (3.2%) |
| $45,000 to $49,999 | 237 (3.2%) | 272 (3.9%) |
| $50,000 to $54,999 | 221 (3.0%) | 202 (2.9%) |
| $55,000 to $64,999 | 227 (3.1%) | 475 (6.9%) |
| $65,000 to $74,999 | 397 (5.4%) | 718 (10.3%) |
| $75,000 to $99,999 | 1,243 (17.0%) | 1,082 (15.6%) |
| $100,000+ | 2,790 (38.1%) | 1,225 (17.6%) |
| Total | 7,315 (100.0%) | 6,939 (100.0%) |
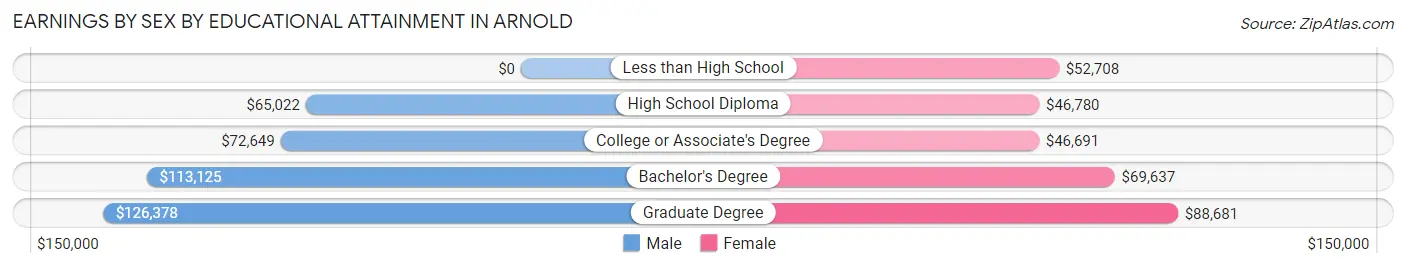
Earnings by Sex by Educational Attainment in Arnold
Average earnings in Arnold are $85,118 for men and $67,478 for women, a difference of 20.7%. Men with an educational attainment of graduate degree enjoy the highest average annual earnings of $126,378, while those with high school diploma education earn the least with $65,022. Women with an educational attainment of graduate degree earn the most with the average annual earnings of $88,681, while those with college or associate's degree education have the smallest earnings of $46,691.
| Educational Attainment | Male Income | Female Income |
| Less than High School | - | - |
| High School Diploma | $65,022 | $46,780 |
| College or Associate's Degree | $72,649 | $46,691 |
| Bachelor's Degree | $113,125 | $69,637 |
| Graduate Degree | $126,378 | $88,681 |
| Total | $85,118 | $67,478 |
Family Income in Arnold
Family Income Brackets in Arnold
According to the Arnold family income data, there are 2,034 families falling into the $200,000+ income range, which is the most common income bracket and makes up 30.1% of all families. Conversely, the $10,000 to $14,999 income bracket is the least frequent group with only 7 families (0.1%) belonging to this category.
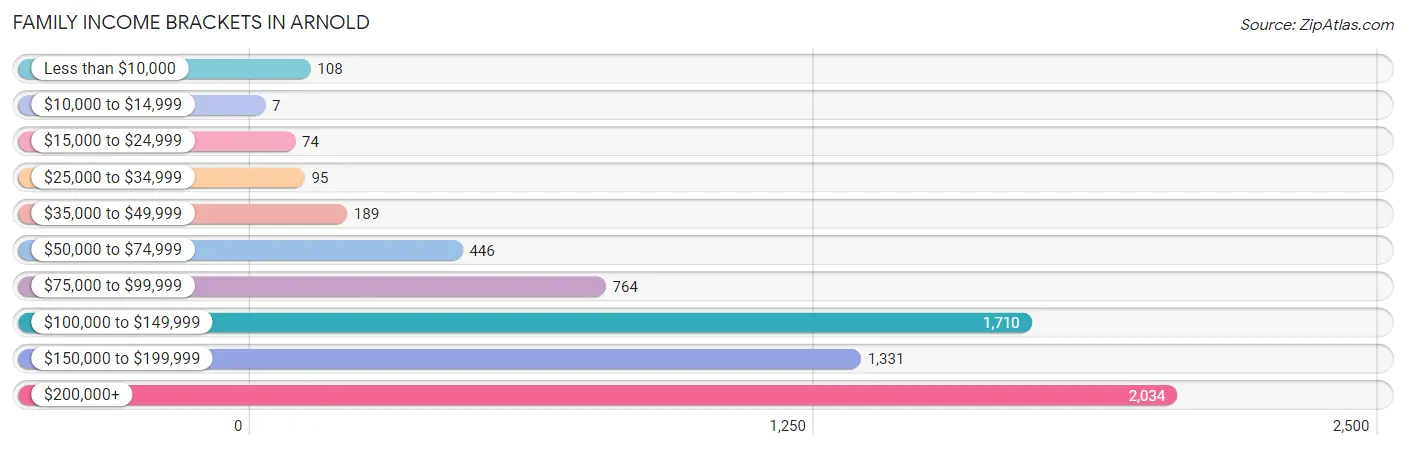
| Income Bracket | # Families | % Families |
| Less than $10,000 | 108 | 1.6% |
| $10,000 to $14,999 | 7 | 0.1% |
| $15,000 to $24,999 | 74 | 1.1% |
| $25,000 to $34,999 | 95 | 1.4% |
| $35,000 to $49,999 | 189 | 2.8% |
| $50,000 to $74,999 | 446 | 6.6% |
| $75,000 to $99,999 | 764 | 11.3% |
| $100,000 to $149,999 | 1,710 | 25.3% |
| $150,000 to $199,999 | 1,331 | 19.7% |
| $200,000+ | 2,034 | 30.1% |
Family Income by Famaliy Size in Arnold
7+ person families (84 | 1.2%) account for the highest median family income in Arnold with $250,001 per family, while 2-person families (2,600 | 38.5%) have the highest median income of $66,094 per family member.
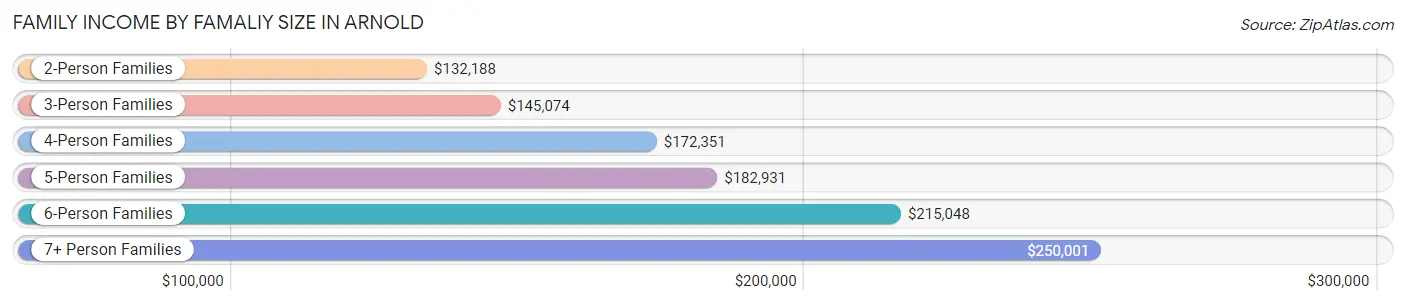
| Income Bracket | # Families | Median Income |
| 2-Person Families | 2,600 (38.5%) | $132,188 |
| 3-Person Families | 1,640 (24.3%) | $145,074 |
| 4-Person Families | 1,661 (24.6%) | $172,351 |
| 5-Person Families | 658 (9.7%) | $182,931 |
| 6-Person Families | 115 (1.7%) | $215,048 |
| 7+ Person Families | 84 (1.2%) | $250,001 |
| Total | 6,758 (100.0%) | $149,865 |
Family Income by Number of Earners in Arnold
The median family income in Arnold is $149,865, with families comprising 3+ earners (994) having the highest median family income of $186,667, while families with no earners (687) have the lowest median family income of $89,969, accounting for 14.7% and 10.2% of families, respectively.
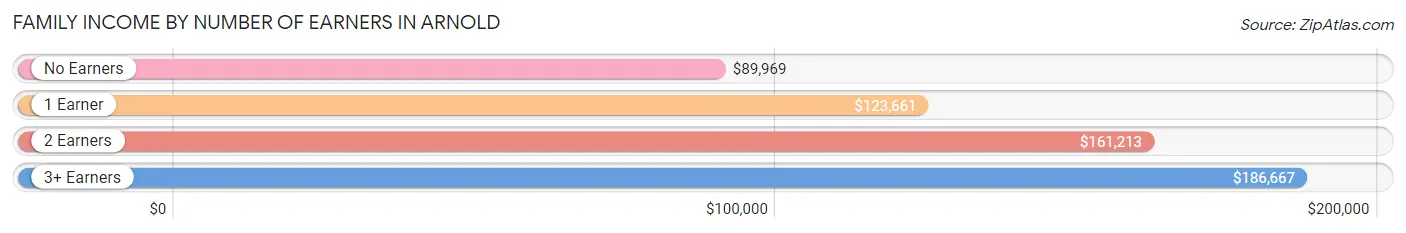
| Number of Earners | # Families | Median Income |
| No Earners | 687 (10.2%) | $89,969 |
| 1 Earner | 1,609 (23.8%) | $123,661 |
| 2 Earners | 3,468 (51.3%) | $161,213 |
| 3+ Earners | 994 (14.7%) | $186,667 |
| Total | 6,758 (100.0%) | $149,865 |
Household Income in Arnold
Household Income Brackets in Arnold
With 2,332 households falling in the category, the $200,000+ income range is the most frequent in Arnold, accounting for 26.9% of all households. In contrast, only 43 households (0.5%) fall into the $10,000 to $14,999 income bracket, making it the least populous group.
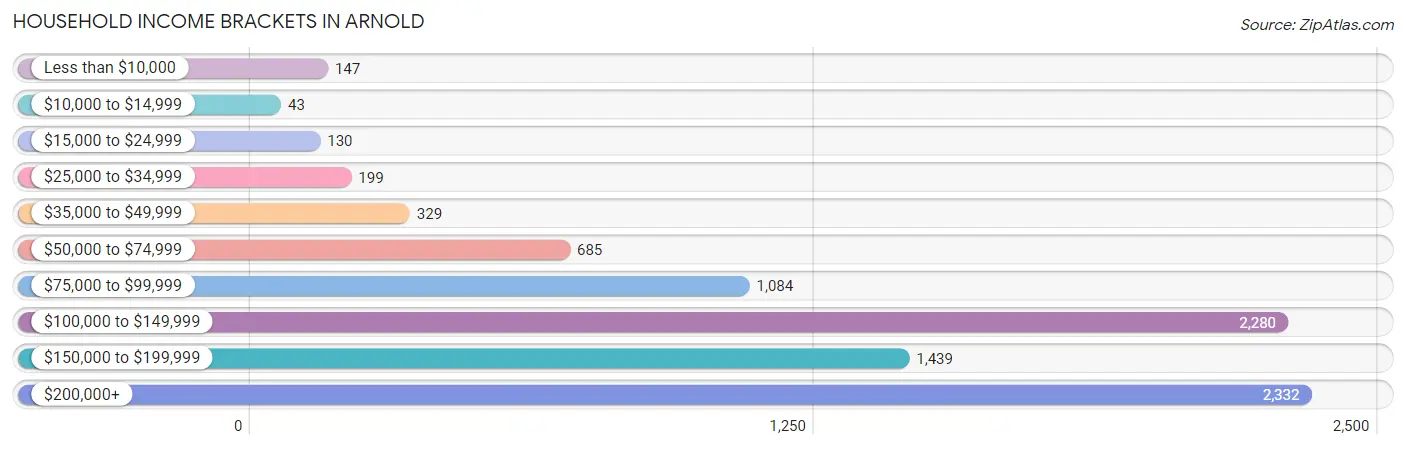
| Income Bracket | # Households | % Households |
| Less than $10,000 | 147 | 1.7% |
| $10,000 to $14,999 | 43 | 0.5% |
| $15,000 to $24,999 | 130 | 1.5% |
| $25,000 to $34,999 | 199 | 2.3% |
| $35,000 to $49,999 | 329 | 3.8% |
| $50,000 to $74,999 | 685 | 7.9% |
| $75,000 to $99,999 | 1,084 | 12.5% |
| $100,000 to $149,999 | 2,280 | 26.3% |
| $150,000 to $199,999 | 1,439 | 16.6% |
| $200,000+ | 2,332 | 26.9% |
Household Income by Householder Age in Arnold
The median household income in Arnold is $137,075, with the highest median household income of $157,934 found in the 45 to 64 years age bracket for the primary householder. A total of 3,433 households (39.6%) fall into this category. Meanwhile, the 15 to 24 years age bracket for the primary householder has the lowest median household income of $83,309, with 112 households (1.3%) in this group.
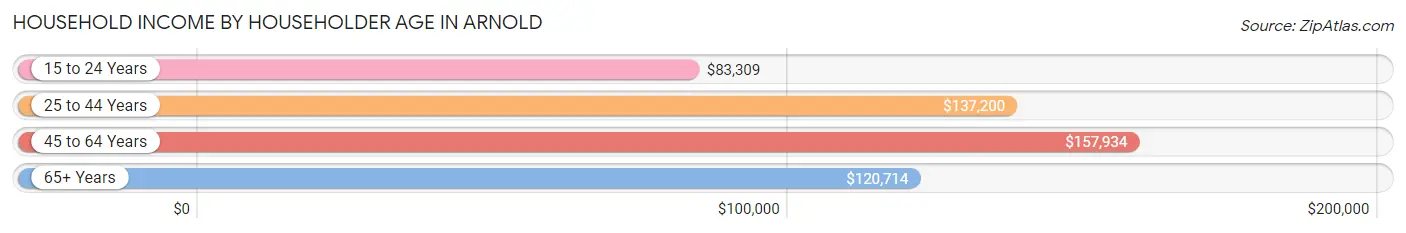
| Income Bracket | # Households | Median Income |
| 15 to 24 Years | 112 (1.3%) | $83,309 |
| 25 to 44 Years | 2,858 (33.0%) | $137,200 |
| 45 to 64 Years | 3,433 (39.6%) | $157,934 |
| 65+ Years | 2,266 (26.1%) | $120,714 |
| Total | 8,669 (100.0%) | $137,075 |
Poverty in Arnold
Income Below Poverty by Sex and Age in Arnold
With 3.3% poverty level for males and 3.5% for females among the residents of Arnold, 12 to 14 year old males and 18 to 24 year old females are the most vulnerable to poverty, with 101 males (14.1%) and 84 females (7.9%) in their respective age groups living below the poverty level.
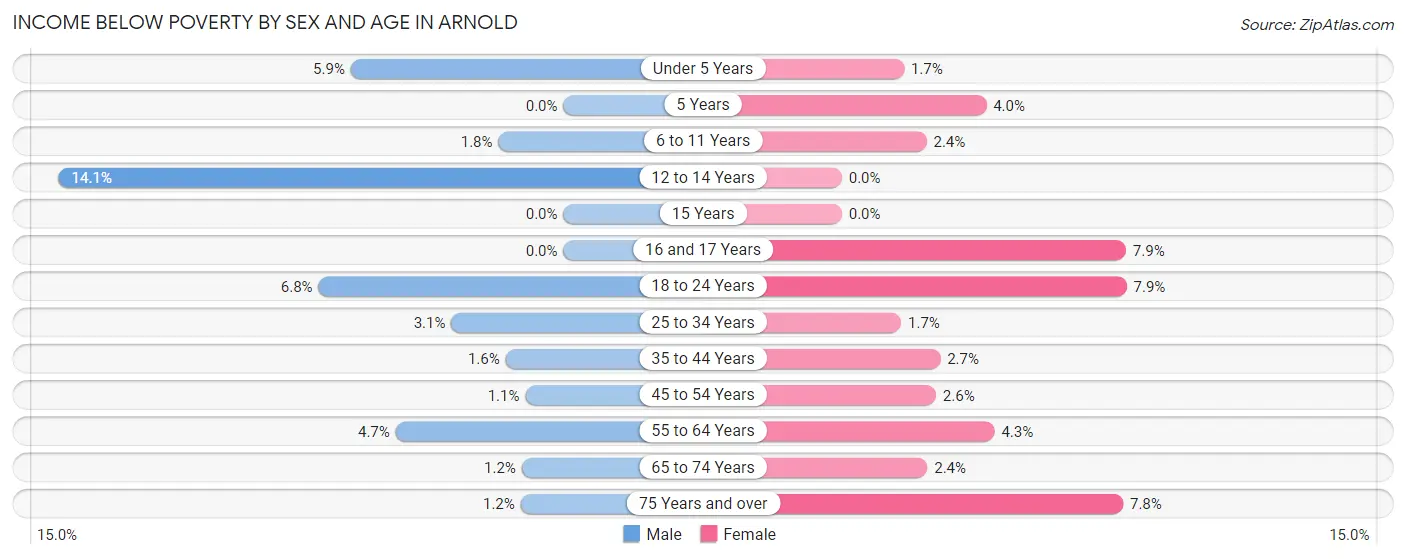
| Age Bracket | Male | Female |
| Under 5 Years | 34 (5.9%) | 14 (1.7%) |
| 5 Years | 0 (0.0%) | 7 (4.0%) |
| 6 to 11 Years | 20 (1.8%) | 28 (2.4%) |
| 12 to 14 Years | 101 (14.1%) | 0 (0.0%) |
| 15 Years | 0 (0.0%) | 0 (0.0%) |
| 16 and 17 Years | 0 (0.0%) | 33 (7.9%) |
| 18 to 24 Years | 61 (6.8%) | 84 (7.9%) |
| 25 to 34 Years | 41 (3.1%) | 18 (1.7%) |
| 35 to 44 Years | 31 (1.6%) | 51 (2.7%) |
| 45 to 54 Years | 16 (1.1%) | 44 (2.6%) |
| 55 to 64 Years | 69 (4.7%) | 73 (4.3%) |
| 65 to 74 Years | 13 (1.2%) | 25 (2.4%) |
| 75 Years and over | 9 (1.2%) | 61 (7.8%) |
| Total | 395 (3.3%) | 438 (3.5%) |
Income Above Poverty by Sex and Age in Arnold
According to the poverty statistics in Arnold, males aged 5 years and females aged 12 to 14 years are the age groups that are most secure financially, with 100.0% of males and 100.0% of females in these age groups living above the poverty line.
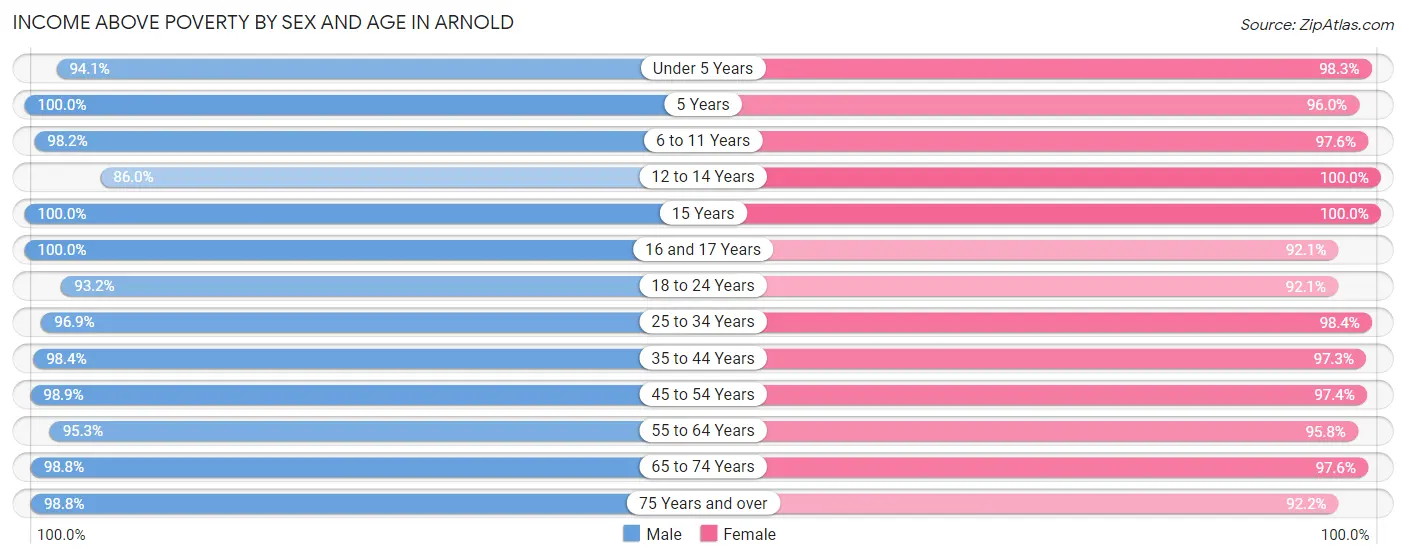
| Age Bracket | Male | Female |
| Under 5 Years | 540 (94.1%) | 797 (98.3%) |
| 5 Years | 152 (100.0%) | 167 (96.0%) |
| 6 to 11 Years | 1,088 (98.2%) | 1,159 (97.6%) |
| 12 to 14 Years | 618 (86.0%) | 559 (100.0%) |
| 15 Years | 219 (100.0%) | 250 (100.0%) |
| 16 and 17 Years | 355 (100.0%) | 384 (92.1%) |
| 18 to 24 Years | 833 (93.2%) | 975 (92.1%) |
| 25 to 34 Years | 1,272 (96.9%) | 1,073 (98.4%) |
| 35 to 44 Years | 1,889 (98.4%) | 1,808 (97.3%) |
| 45 to 54 Years | 1,495 (98.9%) | 1,637 (97.4%) |
| 55 to 64 Years | 1,408 (95.3%) | 1,646 (95.8%) |
| 65 to 74 Years | 1,110 (98.8%) | 1,025 (97.6%) |
| 75 Years and over | 750 (98.8%) | 718 (92.2%) |
| Total | 11,729 (96.7%) | 12,198 (96.5%) |
Income Below Poverty Among Married-Couple Families in Arnold
The poverty statistics for married-couple families in Arnold show that 1.6% or 87 of the total 5,520 families live below the poverty line. Families with 3 or 4 children have the highest poverty rate of 3.2%, comprising of 20 families. On the other hand, families with 5 or more children have the lowest poverty rate of 0.0%, which includes 0 families.
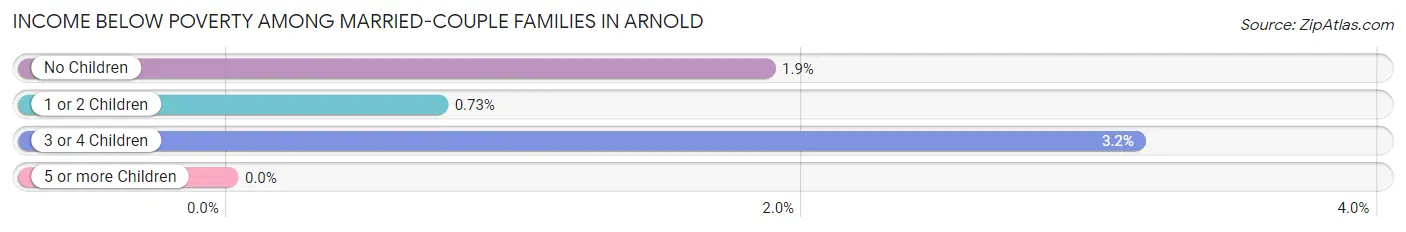
| Children | Above Poverty | Below Poverty |
| No Children | 2,728 (98.1%) | 52 (1.9%) |
| 1 or 2 Children | 2,049 (99.3%) | 15 (0.7%) |
| 3 or 4 Children | 613 (96.8%) | 20 (3.2%) |
| 5 or more Children | 43 (100.0%) | 0 (0.0%) |
| Total | 5,433 (98.4%) | 87 (1.6%) |
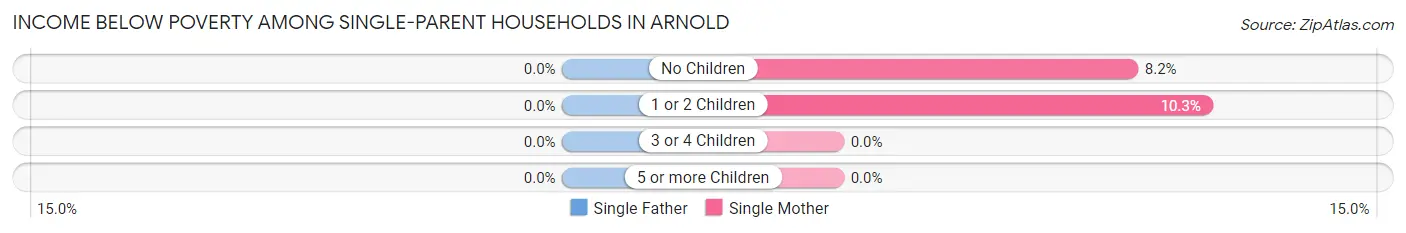
Income Below Poverty Among Single-Parent Households in Arnold
| Children | Single Father | Single Mother |
| No Children | 0 (0.0%) | 31 (8.2%) |
| 1 or 2 Children | 0 (0.0%) | 57 (10.3%) |
| 3 or 4 Children | 0 (0.0%) | 0 (0.0%) |
| 5 or more Children | 0 (0.0%) | 0 (0.0%) |
| Total | 0 (0.0%) | 88 (9.2%) |
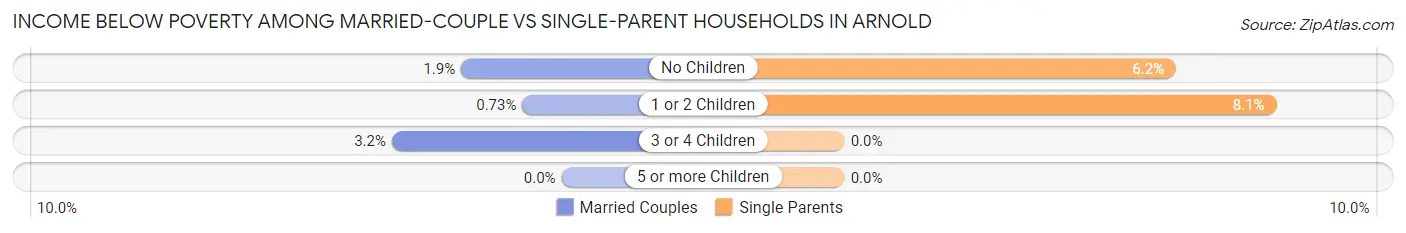
Income Below Poverty Among Married-Couple vs Single-Parent Households in Arnold
The poverty data for Arnold shows that 87 of the married-couple family households (1.6%) and 88 of the single-parent households (7.1%) are living below the poverty level. Within the married-couple family households, those with 3 or 4 children have the highest poverty rate, with 20 households (3.2%) falling below the poverty line. Among the single-parent households, those with 1 or 2 children have the highest poverty rate, with 57 household (8.1%) living below poverty.
| Children | Married-Couple Families | Single-Parent Households |
| No Children | 52 (1.9%) | 31 (6.2%) |
| 1 or 2 Children | 15 (0.7%) | 57 (8.1%) |
| 3 or 4 Children | 20 (3.2%) | 0 (0.0%) |
| 5 or more Children | 0 (0.0%) | 0 (0.0%) |
| Total | 87 (1.6%) | 88 (7.1%) |
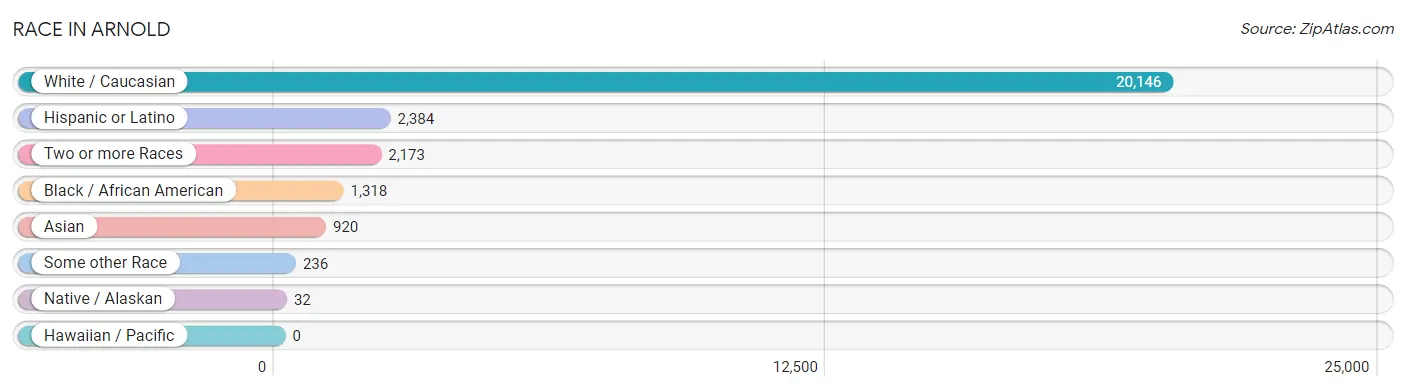
Race in Arnold
The most populous races in Arnold are White / Caucasian (20,146 | 81.1%), Hispanic or Latino (2,384 | 9.6%), and Two or more Races (2,173 | 8.7%).
| Race | # Population | % Population |
| Asian | 920 | 3.7% |
| Black / African American | 1,318 | 5.3% |
| Hawaiian / Pacific | 0 | 0.0% |
| Hispanic or Latino | 2,384 | 9.6% |
| Native / Alaskan | 32 | 0.1% |
| White / Caucasian | 20,146 | 81.1% |
| Two or more Races | 2,173 | 8.7% |
| Some other Race | 236 | 0.9% |
| Total | 24,825 | 100.0% |
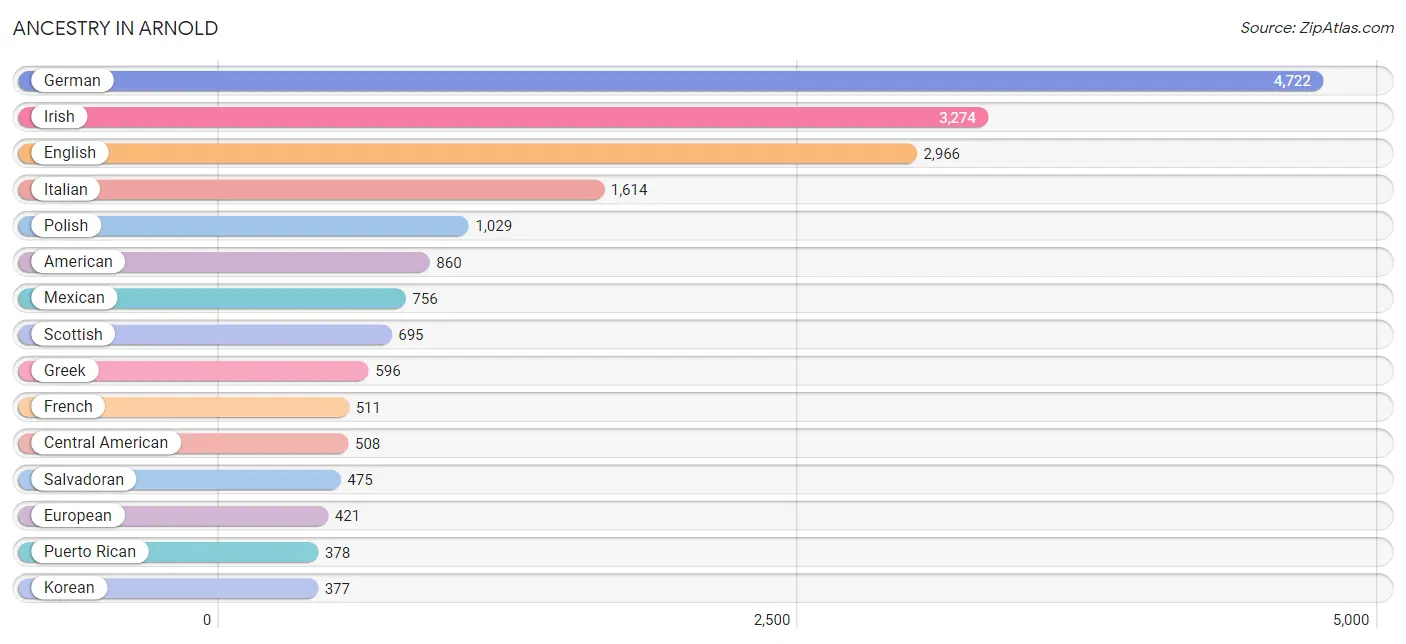
Ancestry in Arnold
The most populous ancestries reported in Arnold are German (4,722 | 19.0%), Irish (3,274 | 13.2%), English (2,966 | 11.9%), Italian (1,614 | 6.5%), and Polish (1,029 | 4.2%), together accounting for 54.8% of all Arnold residents.
| Ancestry | # Population | % Population |
| American | 860 | 3.5% |
| Arab | 125 | 0.5% |
| Austrian | 40 | 0.2% |
| Belgian | 8 | 0.0% |
| Bermudan | 27 | 0.1% |
| Bhutanese | 189 | 0.8% |
| Bolivian | 11 | 0.0% |
| Brazilian | 32 | 0.1% |
| British | 151 | 0.6% |
| Burmese | 243 | 1.0% |
| Canadian | 82 | 0.3% |
| Celtic | 2 | 0.0% |
| Central American | 508 | 2.1% |
| Central American Indian | 23 | 0.1% |
| Cherokee | 39 | 0.2% |
| Chilean | 20 | 0.1% |
| Creek | 2 | 0.0% |
| Croatian | 26 | 0.1% |
| Cuban | 41 | 0.2% |
| Cypriot | 11 | 0.0% |
| Czech | 83 | 0.3% |
| Czechoslovakian | 124 | 0.5% |
| Danish | 36 | 0.2% |
| Dominican | 111 | 0.4% |
| Dutch | 118 | 0.5% |
| Eastern European | 112 | 0.4% |
| Ecuadorian | 44 | 0.2% |
| Egyptian | 44 | 0.2% |
| English | 2,966 | 11.9% |
| Ethiopian | 24 | 0.1% |
| European | 421 | 1.7% |
| Filipino | 41 | 0.2% |
| Finnish | 15 | 0.1% |
| French | 511 | 2.1% |
| French Canadian | 51 | 0.2% |
| German | 4,722 | 19.0% |
| Greek | 596 | 2.4% |
| Guamanian / Chamorro | 44 | 0.2% |
| Guatemalan | 26 | 0.1% |
| Honduran | 7 | 0.0% |
| Hungarian | 166 | 0.7% |
| Indian (Asian) | 200 | 0.8% |
| Iranian | 33 | 0.1% |
| Irish | 3,274 | 13.2% |
| Italian | 1,614 | 6.5% |
| Korean | 377 | 1.5% |
| Lebanese | 29 | 0.1% |
| Lithuanian | 82 | 0.3% |
| Mexican | 756 | 3.0% |
| Mexican American Indian | 21 | 0.1% |
| Moroccan | 18 | 0.1% |
| Nigerian | 28 | 0.1% |
| Northern European | 67 | 0.3% |
| Norwegian | 111 | 0.4% |
| Pakistani | 47 | 0.2% |
| Palestinian | 10 | 0.0% |
| Peruvian | 136 | 0.5% |
| Polish | 1,029 | 4.2% |
| Portuguese | 48 | 0.2% |
| Puerto Rican | 378 | 1.5% |
| Romanian | 30 | 0.1% |
| Russian | 118 | 0.5% |
| Salvadoran | 475 | 1.9% |
| Scandinavian | 52 | 0.2% |
| Scotch-Irish | 351 | 1.4% |
| Scottish | 695 | 2.8% |
| Serbian | 11 | 0.0% |
| Slovak | 23 | 0.1% |
| Slovene | 93 | 0.4% |
| South African | 8 | 0.0% |
| South American | 366 | 1.5% |
| Spaniard | 25 | 0.1% |
| Spanish | 152 | 0.6% |
| Sri Lankan | 262 | 1.1% |
| Subsaharan African | 60 | 0.2% |
| Swedish | 220 | 0.9% |
| Swiss | 106 | 0.4% |
| Syrian | 13 | 0.1% |
| Thai | 185 | 0.7% |
| Turkish | 9 | 0.0% |
| Ukrainian | 66 | 0.3% |
| Venezuelan | 155 | 0.6% |
| Vietnamese | 54 | 0.2% |
| Welsh | 255 | 1.0% | View All 84 Rows |
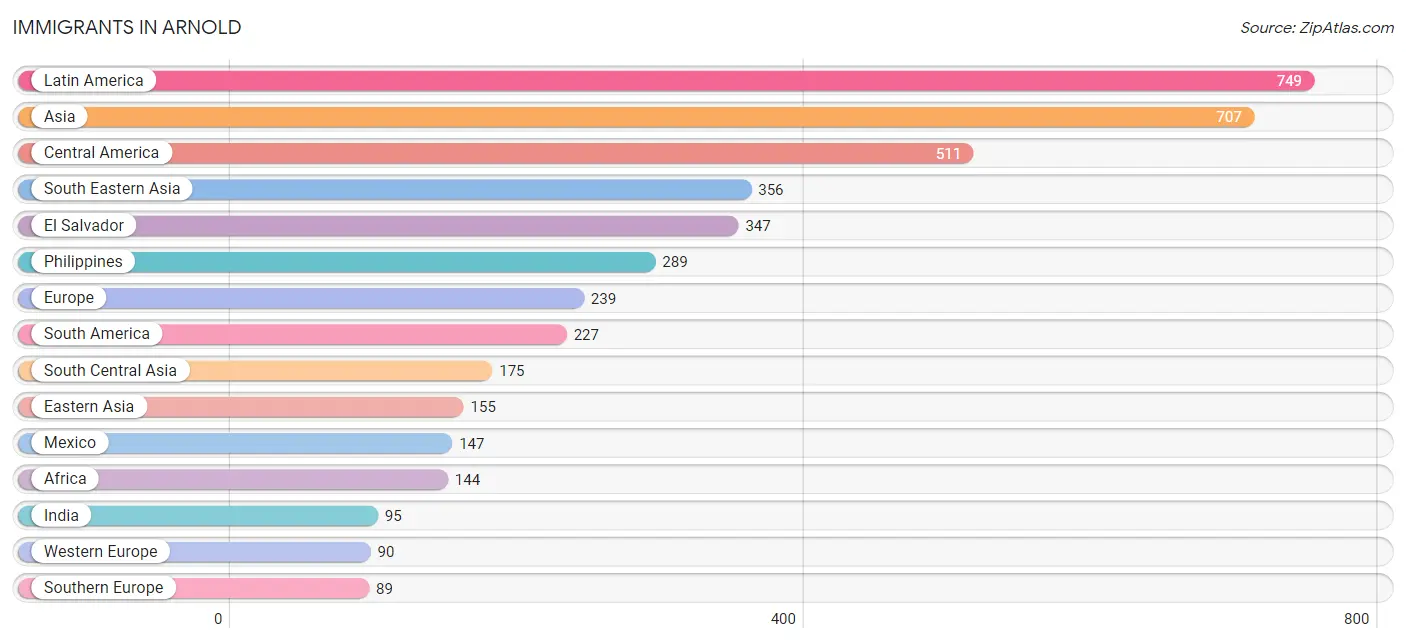
Immigrants in Arnold
The most numerous immigrant groups reported in Arnold came from Latin America (749 | 3.0%), Asia (707 | 2.9%), Central America (511 | 2.1%), South Eastern Asia (356 | 1.4%), and El Salvador (347 | 1.4%), together accounting for 10.8% of all Arnold residents.
| Immigration Origin | # Population | % Population |
| Africa | 144 | 0.6% |
| Asia | 707 | 2.9% |
| Bangladesh | 35 | 0.1% |
| Belarus | 12 | 0.1% |
| Bolivia | 11 | 0.0% |
| Brazil | 18 | 0.1% |
| Canada | 37 | 0.2% |
| Caribbean | 11 | 0.0% |
| Central America | 511 | 2.1% |
| Chile | 20 | 0.1% |
| China | 54 | 0.2% |
| Croatia | 7 | 0.0% |
| Dominican Republic | 11 | 0.0% |
| Eastern Africa | 24 | 0.1% |
| Eastern Asia | 155 | 0.6% |
| Eastern Europe | 46 | 0.2% |
| Ecuador | 39 | 0.2% |
| Egypt | 44 | 0.2% |
| El Salvador | 347 | 1.4% |
| England | 6 | 0.0% |
| Ethiopia | 24 | 0.1% |
| Europe | 239 | 1.0% |
| France | 37 | 0.2% |
| Germany | 53 | 0.2% |
| Greece | 30 | 0.1% |
| Guatemala | 17 | 0.1% |
| India | 95 | 0.4% |
| Indonesia | 8 | 0.0% |
| Iran | 26 | 0.1% |
| Ireland | 8 | 0.0% |
| Italy | 28 | 0.1% |
| Japan | 29 | 0.1% |
| Korea | 72 | 0.3% |
| Latin America | 749 | 3.0% |
| Lebanon | 10 | 0.0% |
| Malaysia | 12 | 0.1% |
| Mexico | 147 | 0.6% |
| Morocco | 35 | 0.1% |
| Nigeria | 41 | 0.2% |
| Northern Africa | 79 | 0.3% |
| Northern Europe | 14 | 0.1% |
| Oceania | 24 | 0.1% |
| Pakistan | 19 | 0.1% |
| Peru | 75 | 0.3% |
| Philippines | 289 | 1.2% |
| Romania | 17 | 0.1% |
| Russia | 10 | 0.0% |
| South America | 227 | 0.9% |
| South Central Asia | 175 | 0.7% |
| South Eastern Asia | 356 | 1.4% |
| Southern Europe | 89 | 0.4% |
| Spain | 31 | 0.1% |
| Taiwan | 47 | 0.2% |
| Venezuela | 64 | 0.3% |
| Vietnam | 47 | 0.2% |
| Western Africa | 41 | 0.2% |
| Western Asia | 21 | 0.1% |
| Western Europe | 90 | 0.4% | View All 58 Rows |
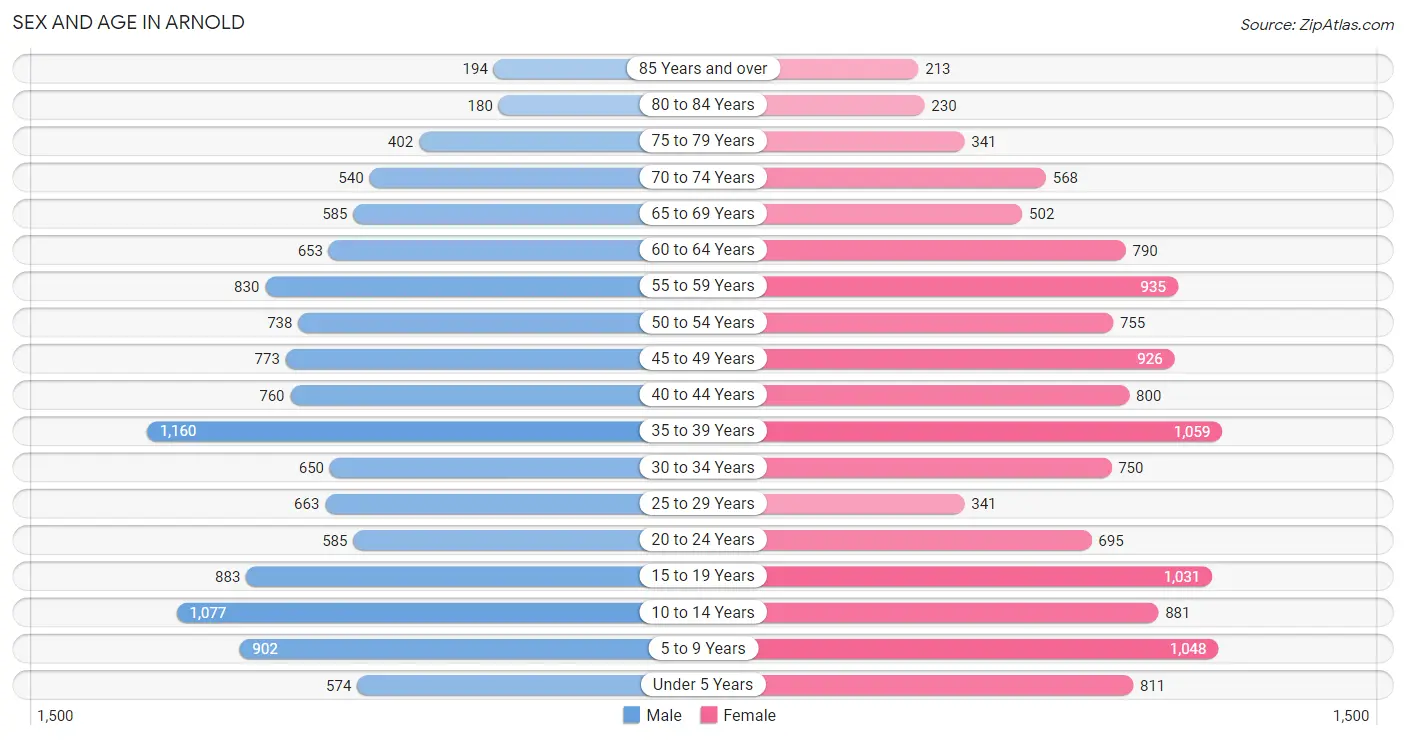
Sex and Age in Arnold
Sex and Age in Arnold
The most populous age groups in Arnold are 35 to 39 Years (1,160 | 9.6%) for men and 35 to 39 Years (1,059 | 8.4%) for women.
| Age Bracket | Male | Female |
| Under 5 Years | 574 (4.7%) | 811 (6.4%) |
| 5 to 9 Years | 902 (7.4%) | 1,048 (8.3%) |
| 10 to 14 Years | 1,077 (8.9%) | 881 (7.0%) |
| 15 to 19 Years | 883 (7.3%) | 1,031 (8.1%) |
| 20 to 24 Years | 585 (4.8%) | 695 (5.5%) |
| 25 to 29 Years | 663 (5.5%) | 341 (2.7%) |
| 30 to 34 Years | 650 (5.3%) | 750 (5.9%) |
| 35 to 39 Years | 1,160 (9.6%) | 1,059 (8.4%) |
| 40 to 44 Years | 760 (6.3%) | 800 (6.3%) |
| 45 to 49 Years | 773 (6.4%) | 926 (7.3%) |
| 50 to 54 Years | 738 (6.1%) | 755 (6.0%) |
| 55 to 59 Years | 830 (6.8%) | 935 (7.4%) |
| 60 to 64 Years | 653 (5.4%) | 790 (6.2%) |
| 65 to 69 Years | 585 (4.8%) | 502 (4.0%) |
| 70 to 74 Years | 540 (4.4%) | 568 (4.5%) |
| 75 to 79 Years | 402 (3.3%) | 341 (2.7%) |
| 80 to 84 Years | 180 (1.5%) | 230 (1.8%) |
| 85 Years and over | 194 (1.6%) | 213 (1.7%) |
| Total | 12,149 (100.0%) | 12,676 (100.0%) |
Families and Households in Arnold
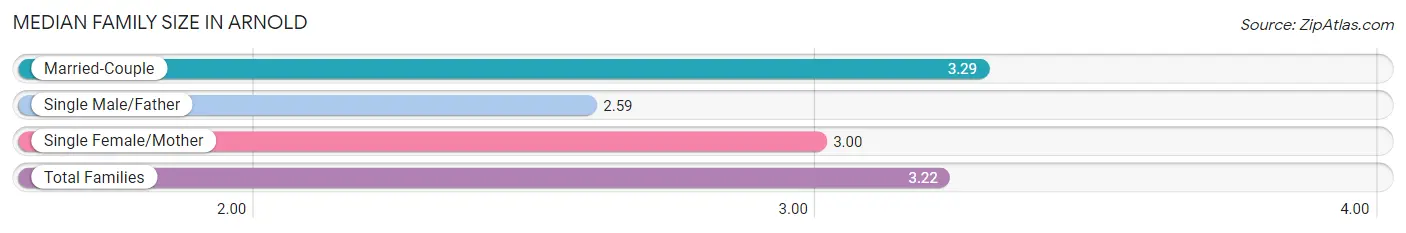
Median Family Size in Arnold
The median family size in Arnold is 3.22 persons per family, with married-couple families (5,520 | 81.7%) accounting for the largest median family size of 3.29 persons per family. On the other hand, single male/father families (278 | 4.1%) represent the smallest median family size with 2.59 persons per family.
| Family Type | # Families | Family Size |
| Married-Couple | 5,520 (81.7%) | 3.29 |
| Single Male/Father | 278 (4.1%) | 2.59 |
| Single Female/Mother | 960 (14.2%) | 3.00 |
| Total Families | 6,758 (100.0%) | 3.22 |
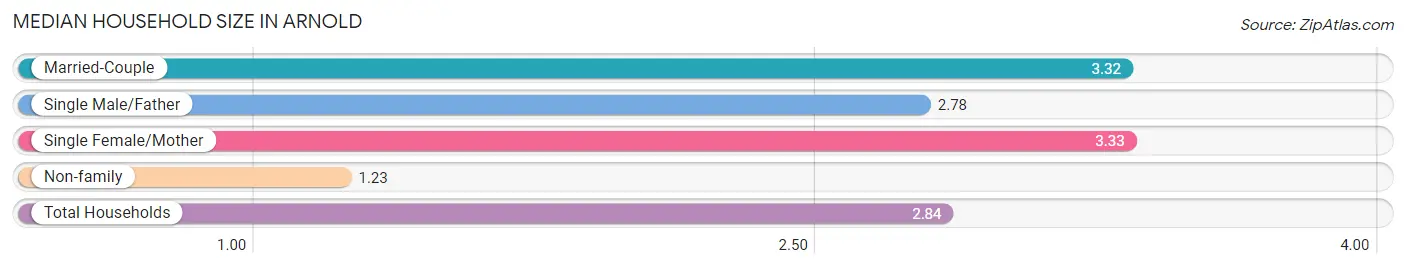
Median Household Size in Arnold
The median household size in Arnold is 2.84 persons per household, with single female/mother households (960 | 11.1%) accounting for the largest median household size of 3.33 persons per household. non-family households (1,911 | 22.0%) represent the smallest median household size with 1.23 persons per household.
| Household Type | # Households | Household Size |
| Married-Couple | 5,520 (63.7%) | 3.32 |
| Single Male/Father | 278 (3.2%) | 2.78 |
| Single Female/Mother | 960 (11.1%) | 3.33 |
| Non-family | 1,911 (22.0%) | 1.23 |
| Total Households | 8,669 (100.0%) | 2.84 |
Household Size by Marriage Status in Arnold
Out of a total of 8,669 households in Arnold, 6,758 (78.0%) are family households, while 1,911 (22.0%) are nonfamily households. The most numerous type of family households are 2-person households, comprising 2,499, and the most common type of nonfamily households are 1-person households, comprising 1,509.
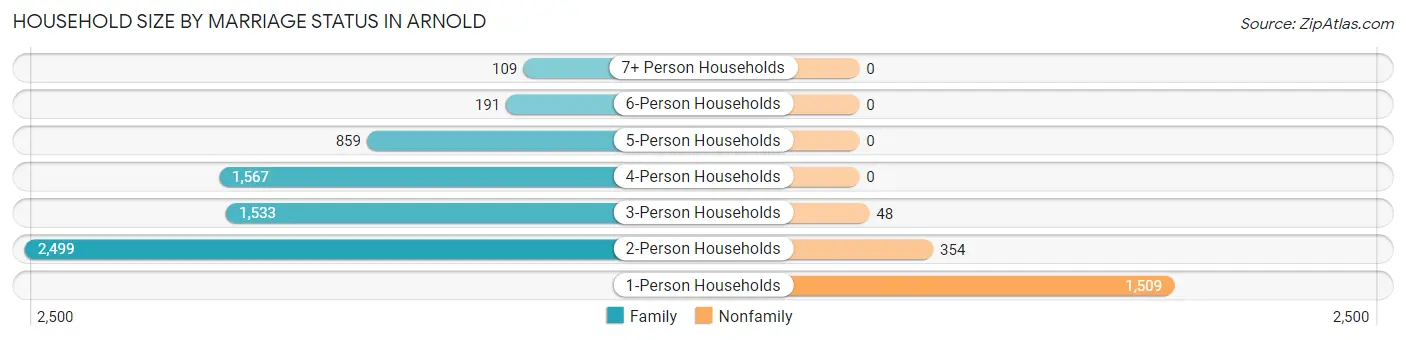
| Household Size | Family Households | Nonfamily Households |
| 1-Person Households | - | 1,509 (17.4%) |
| 2-Person Households | 2,499 (28.8%) | 354 (4.1%) |
| 3-Person Households | 1,533 (17.7%) | 48 (0.5%) |
| 4-Person Households | 1,567 (18.1%) | 0 (0.0%) |
| 5-Person Households | 859 (9.9%) | 0 (0.0%) |
| 6-Person Households | 191 (2.2%) | 0 (0.0%) |
| 7+ Person Households | 109 (1.3%) | 0 (0.0%) |
| Total | 6,758 (78.0%) | 1,911 (22.0%) |
Female Fertility in Arnold
Fertility by Age in Arnold
Average fertility rate in Arnold is 28.0 births per 1,000 women. Women in the age bracket of 20 to 34 years have the highest fertility rate with 46.0 births per 1,000 women. Women in the age bracket of 20 to 34 years acount for 50.0% of all women with births.
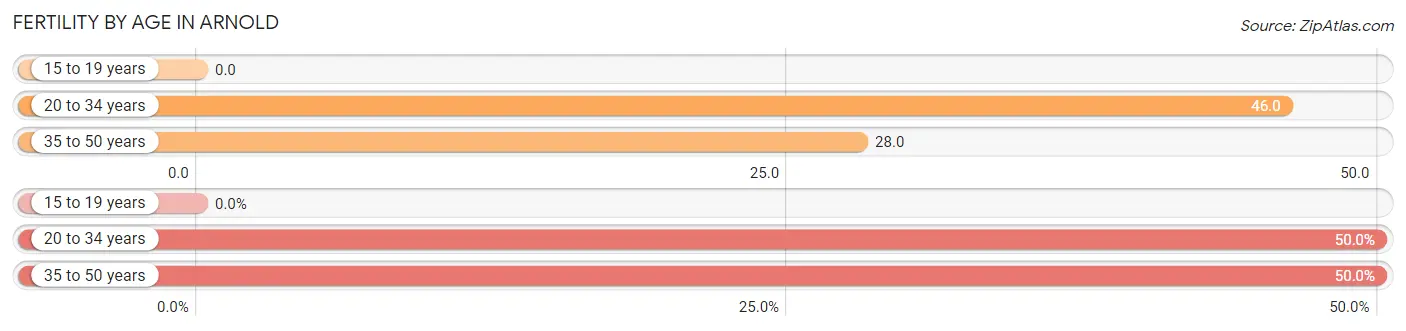
| Age Bracket | Women with Births | Births / 1,000 Women |
| 15 to 19 years | 0 (0.0%) | 0.0 |
| 20 to 34 years | 82 (50.0%) | 46.0 |
| 35 to 50 years | 82 (50.0%) | 28.0 |
| Total | 164 (100.0%) | 28.0 |
Fertility by Age by Marriage Status in Arnold
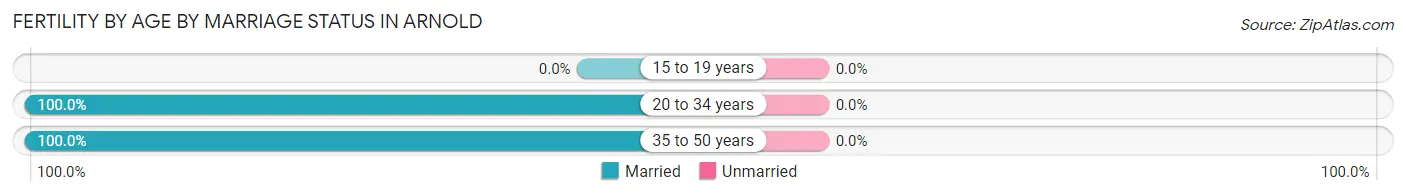
| Age Bracket | Married | Unmarried |
| 15 to 19 years | 0 (0.0%) | 0 (0.0%) |
| 20 to 34 years | 82 (100.0%) | 0 (0.0%) |
| 35 to 50 years | 82 (100.0%) | 0 (0.0%) |
| Total | 164 (100.0%) | 0 (0.0%) |
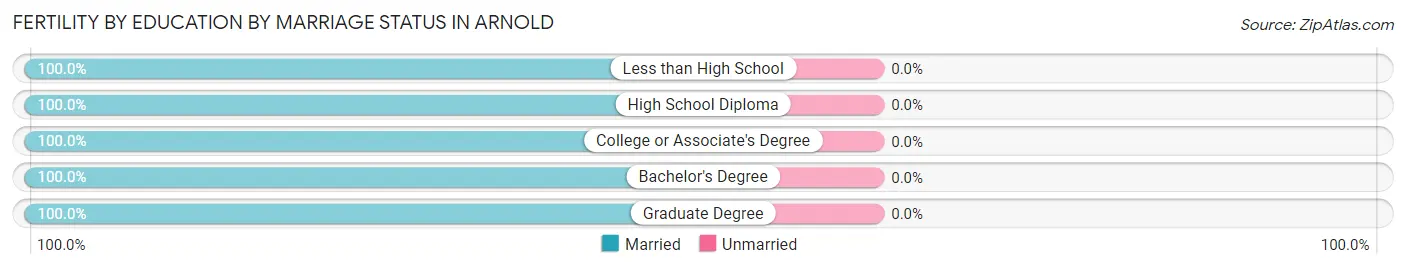
Fertility by Education in Arnold
Average fertility rate in Arnold is 28.0 births per 1,000 women. Women with the education attainment of high school diploma have the highest fertility rate of 61.0 births per 1,000 women, while women with the education attainment of college or associate's degree have the lowest fertility at 10.0 births per 1,000 women. Women with the education attainment of graduate degree represent 41.5% of all women with births.
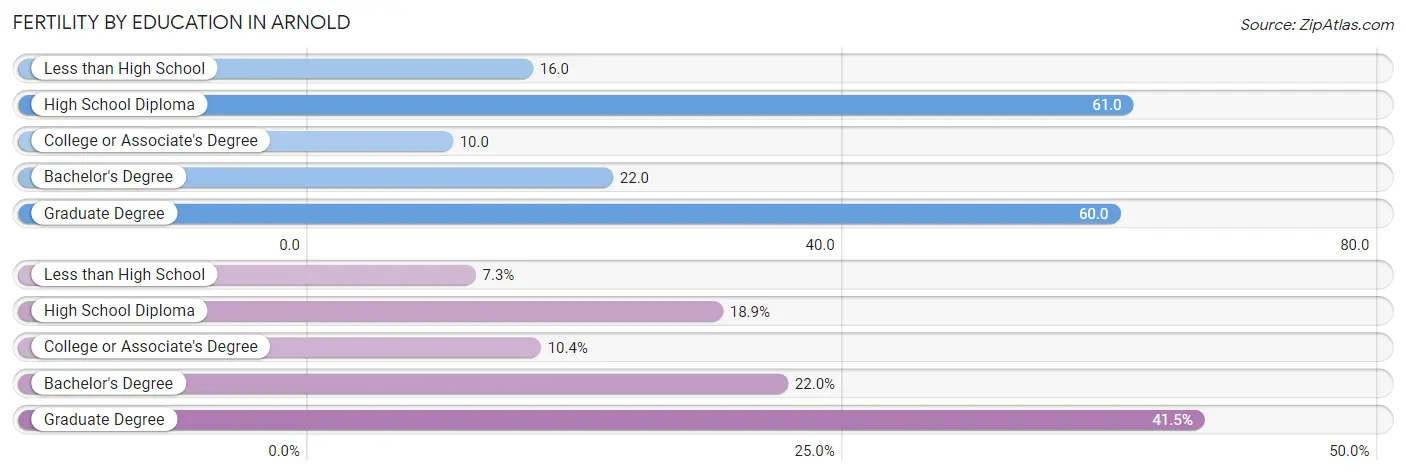
| Educational Attainment | Women with Births | Births / 1,000 Women |
| Less than High School | 12 (7.3%) | 16.0 |
| High School Diploma | 31 (18.9%) | 61.0 |
| College or Associate's Degree | 17 (10.4%) | 10.0 |
| Bachelor's Degree | 36 (22.0%) | 22.0 |
| Graduate Degree | 68 (41.5%) | 60.0 |
| Total | 164 (100.0%) | 28.0 |
Fertility by Education by Marriage Status in Arnold
| Educational Attainment | Married | Unmarried |
| Less than High School | 12 (100.0%) | 0 (0.0%) |
| High School Diploma | 31 (100.0%) | 0 (0.0%) |
| College or Associate's Degree | 17 (100.0%) | 0 (0.0%) |
| Bachelor's Degree | 36 (100.0%) | 0 (0.0%) |
| Graduate Degree | 68 (100.0%) | 0 (0.0%) |
| Total | 164 (100.0%) | 0 (0.0%) |
Employment Characteristics in Arnold
Employment by Class of Employer in Arnold
Among the 12,687 employed individuals in Arnold, private company employees (7,404 | 58.4%), federal government employees (1,663 | 13.1%), and local government employees (1,063 | 8.4%) make up the most common classes of employment.
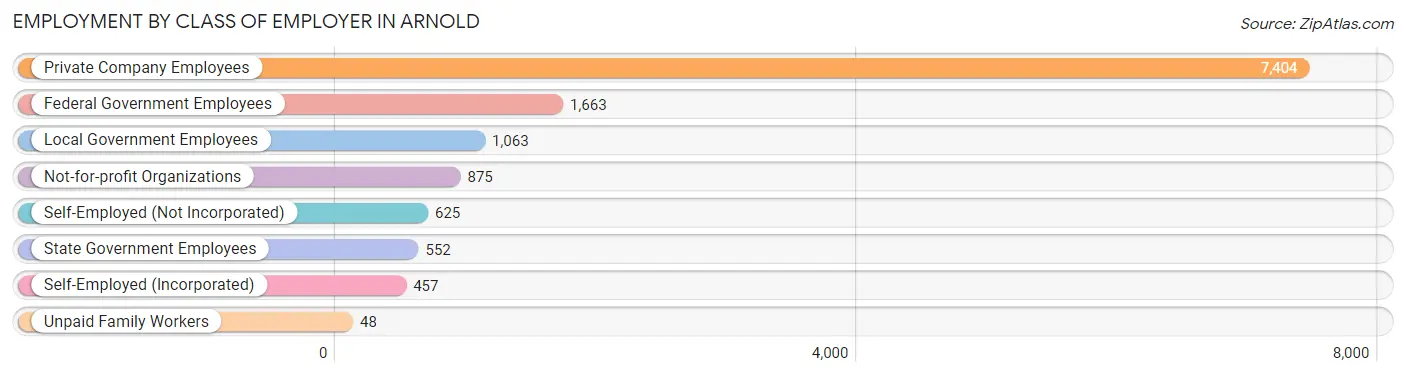
| Employer Class | # Employees | % Employees |
| Private Company Employees | 7,404 | 58.4% |
| Self-Employed (Incorporated) | 457 | 3.6% |
| Self-Employed (Not Incorporated) | 625 | 4.9% |
| Not-for-profit Organizations | 875 | 6.9% |
| Local Government Employees | 1,063 | 8.4% |
| State Government Employees | 552 | 4.3% |
| Federal Government Employees | 1,663 | 13.1% |
| Unpaid Family Workers | 48 | 0.4% |
| Total | 12,687 | 100.0% |
Employment Status by Age in Arnold
According to the labor force statistics for Arnold, out of the total population over 16 years of age (19,063), 70.1% or 13,363 individuals are in the labor force, with 3.4% or 454 of them unemployed. The age group with the highest labor force participation rate is 30 to 34 years, with 93.9% or 1,315 individuals in the labor force. Within the labor force, the 20 to 24 years age range has the highest percentage of unemployed individuals, with 15.1% or 151 of them being unemployed.
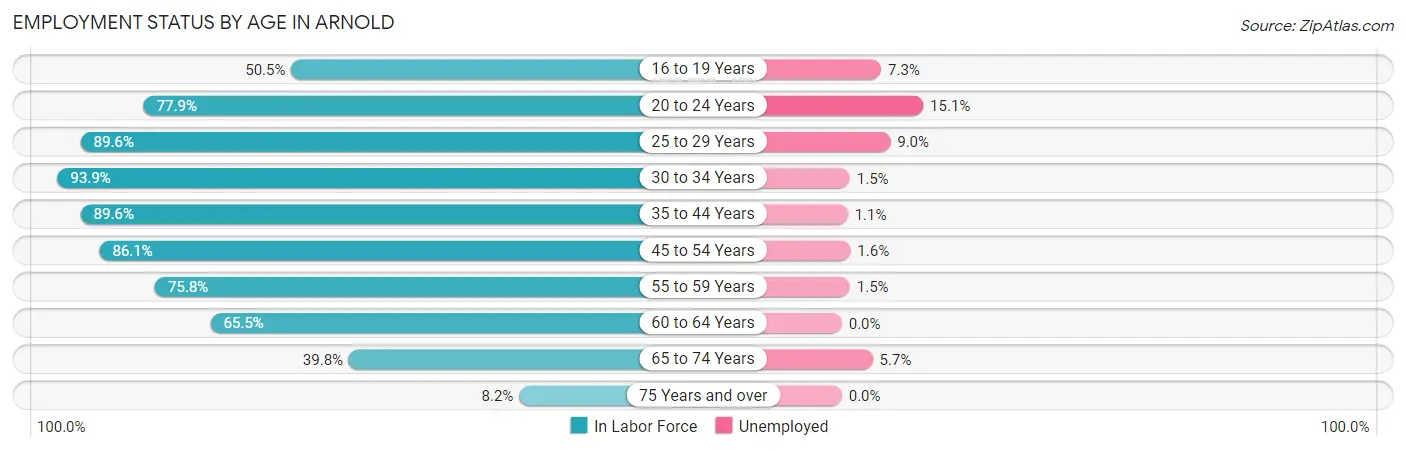
| Age Bracket | In Labor Force | Unemployed |
| 16 to 19 Years | 730 (50.5%) | 53 (7.3%) |
| 20 to 24 Years | 997 (77.9%) | 151 (15.1%) |
| 25 to 29 Years | 900 (89.6%) | 81 (9.0%) |
| 30 to 34 Years | 1,315 (93.9%) | 20 (1.5%) |
| 35 to 44 Years | 3,386 (89.6%) | 37 (1.1%) |
| 45 to 54 Years | 2,748 (86.1%) | 44 (1.6%) |
| 55 to 59 Years | 1,338 (75.8%) | 20 (1.5%) |
| 60 to 64 Years | 945 (65.5%) | 0 (0.0%) |
| 65 to 74 Years | 874 (39.8%) | 50 (5.7%) |
| 75 Years and over | 128 (8.2%) | 0 (0.0%) |
| Total | 13,363 (70.1%) | 454 (3.4%) |
Employment Status by Educational Attainment in Arnold
According to labor force statistics for Arnold, 84.5% of individuals (10,633) out of the total population between 25 and 64 years of age (12,583) are in the labor force, with 1.9% or 202 of them being unemployed. The group with the highest labor force participation rate are those with the educational attainment of bachelor's degree or higher, with 87.4% or 6,281 individuals in the labor force. Within the labor force, individuals with college / associate degree education have the highest percentage of unemployment, with 3.4% or 107 of them being unemployed.
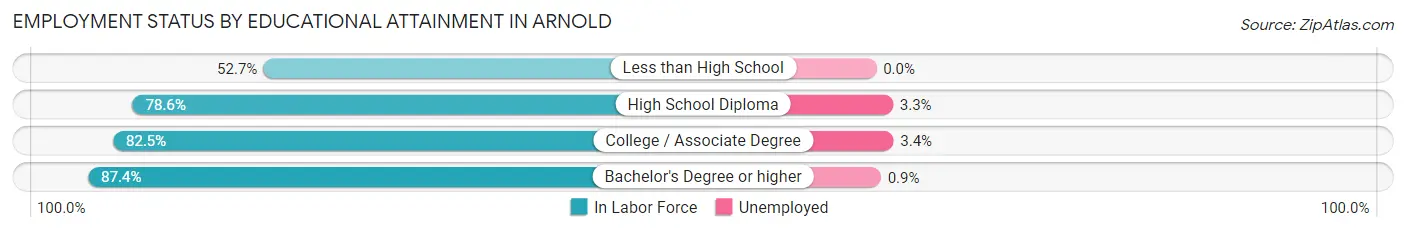
| Educational Attainment | In Labor Force | Unemployed |
| Less than High School | 89 (52.7%) | 0 (0.0%) |
| High School Diploma | 1,109 (78.6%) | 47 (3.3%) |
| College / Associate Degree | 3,149 (82.5%) | 130 (3.4%) |
| Bachelor's Degree or higher | 6,281 (87.4%) | 65 (0.9%) |
| Total | 10,633 (84.5%) | 239 (1.9%) |
Employment Occupations by Sex in Arnold
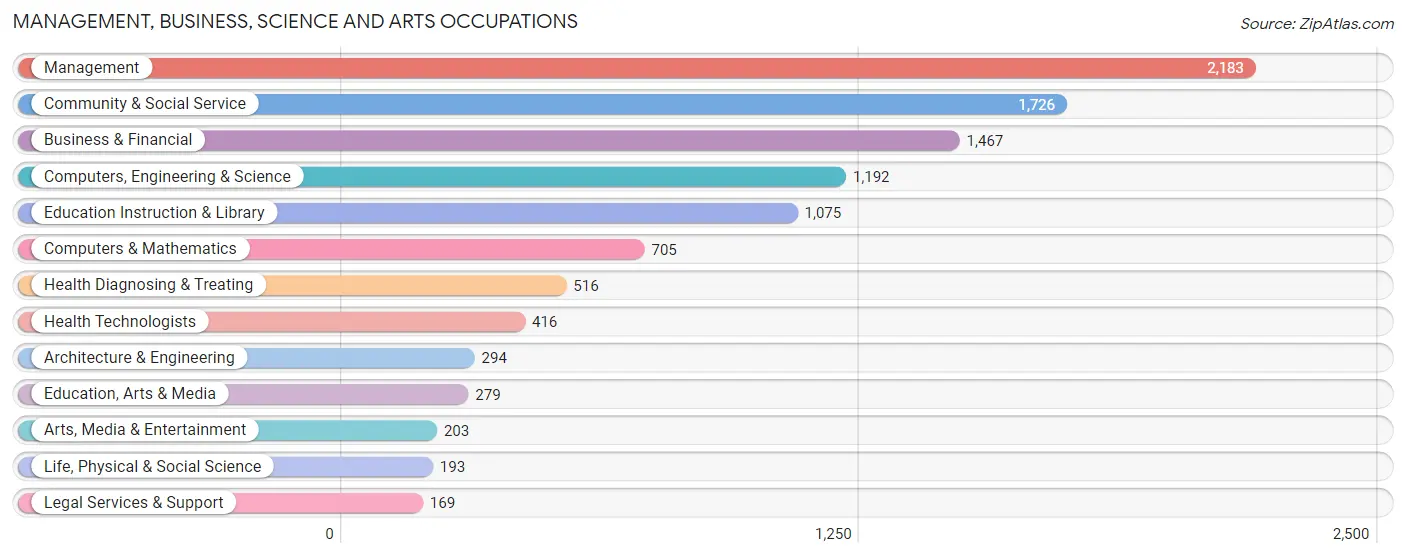
Management, Business, Science and Arts Occupations
The most common Management, Business, Science and Arts occupations in Arnold are Management (2,183 | 17.4%), Community & Social Service (1,726 | 13.7%), Business & Financial (1,467 | 11.7%), Computers, Engineering & Science (1,192 | 9.5%), and Education Instruction & Library (1,075 | 8.6%).
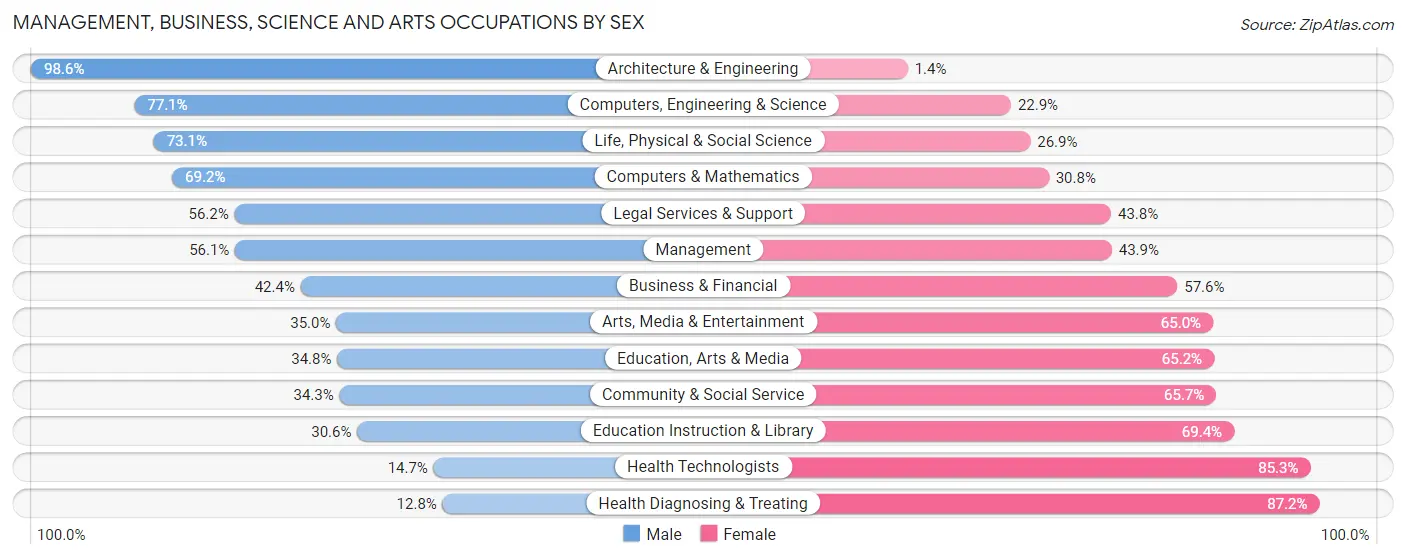
Management, Business, Science and Arts Occupations by Sex
Within the Management, Business, Science and Arts occupations in Arnold, the most male-oriented occupations are Architecture & Engineering (98.6%), Computers, Engineering & Science (77.1%), and Life, Physical & Social Science (73.1%), while the most female-oriented occupations are Health Diagnosing & Treating (87.2%), Health Technologists (85.3%), and Education Instruction & Library (69.4%).
| Occupation | Male | Female |
| Management | 1,224 (56.1%) | 959 (43.9%) |
| Business & Financial | 622 (42.4%) | 845 (57.6%) |
| Computers, Engineering & Science | 919 (77.1%) | 273 (22.9%) |
| Computers & Mathematics | 488 (69.2%) | 217 (30.8%) |
| Architecture & Engineering | 290 (98.6%) | 4 (1.4%) |
| Life, Physical & Social Science | 141 (73.1%) | 52 (26.9%) |
| Community & Social Service | 592 (34.3%) | 1,134 (65.7%) |
| Education, Arts & Media | 97 (34.8%) | 182 (65.2%) |
| Legal Services & Support | 95 (56.2%) | 74 (43.8%) |
| Education Instruction & Library | 329 (30.6%) | 746 (69.4%) |
| Arts, Media & Entertainment | 71 (35.0%) | 132 (65.0%) |
| Health Diagnosing & Treating | 66 (12.8%) | 450 (87.2%) |
| Health Technologists | 61 (14.7%) | 355 (85.3%) |
| Total (Category) | 3,423 (48.3%) | 3,661 (51.7%) |
| Total (Overall) | 6,568 (52.2%) | 6,008 (47.8%) |
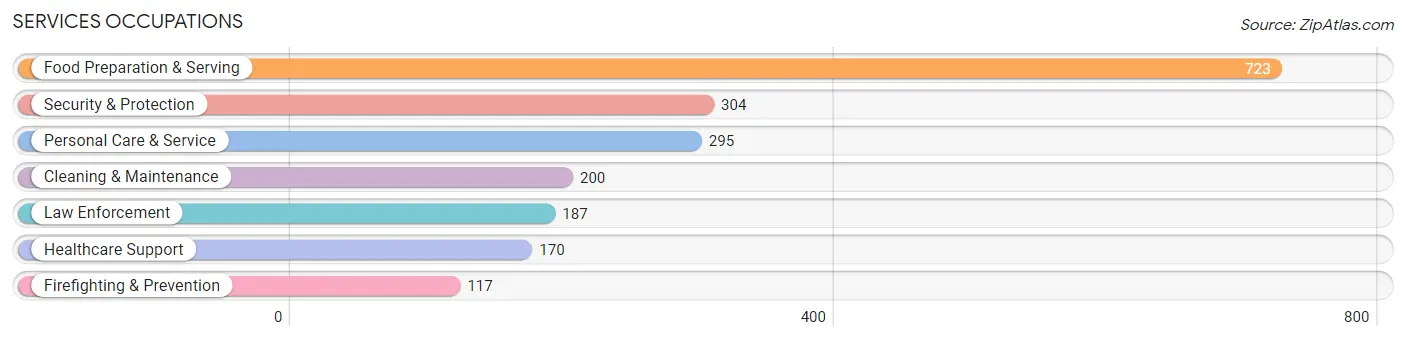
Services Occupations
The most common Services occupations in Arnold are Food Preparation & Serving (723 | 5.8%), Security & Protection (304 | 2.4%), Personal Care & Service (295 | 2.4%), Cleaning & Maintenance (200 | 1.6%), and Law Enforcement (187 | 1.5%).
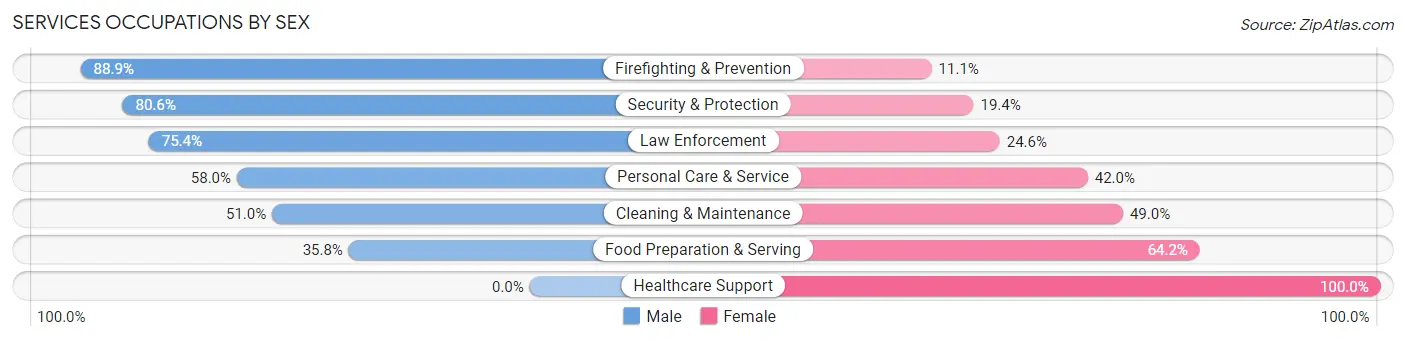
Services Occupations by Sex
Within the Services occupations in Arnold, the most male-oriented occupations are Firefighting & Prevention (88.9%), Security & Protection (80.6%), and Law Enforcement (75.4%), while the most female-oriented occupations are Healthcare Support (100.0%), Food Preparation & Serving (64.2%), and Cleaning & Maintenance (49.0%).
| Occupation | Male | Female |
| Healthcare Support | 0 (0.0%) | 170 (100.0%) |
| Security & Protection | 245 (80.6%) | 59 (19.4%) |
| Firefighting & Prevention | 104 (88.9%) | 13 (11.1%) |
| Law Enforcement | 141 (75.4%) | 46 (24.6%) |
| Food Preparation & Serving | 259 (35.8%) | 464 (64.2%) |
| Cleaning & Maintenance | 102 (51.0%) | 98 (49.0%) |
| Personal Care & Service | 171 (58.0%) | 124 (42.0%) |
| Total (Category) | 777 (45.9%) | 915 (54.1%) |
| Total (Overall) | 6,568 (52.2%) | 6,008 (47.8%) |
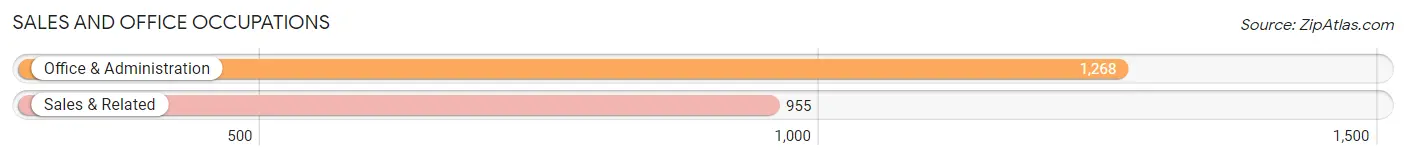
Sales and Office Occupations
The most common Sales and Office occupations in Arnold are Office & Administration (1,268 | 10.1%), and Sales & Related (955 | 7.6%).
Sales and Office Occupations by Sex
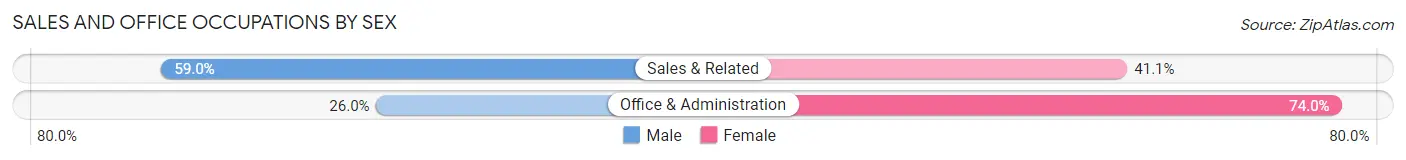
| Occupation | Male | Female |
| Sales & Related | 563 (59.0%) | 392 (41.0%) |
| Office & Administration | 330 (26.0%) | 938 (74.0%) |
| Total (Category) | 893 (40.2%) | 1,330 (59.8%) |
| Total (Overall) | 6,568 (52.2%) | 6,008 (47.8%) |
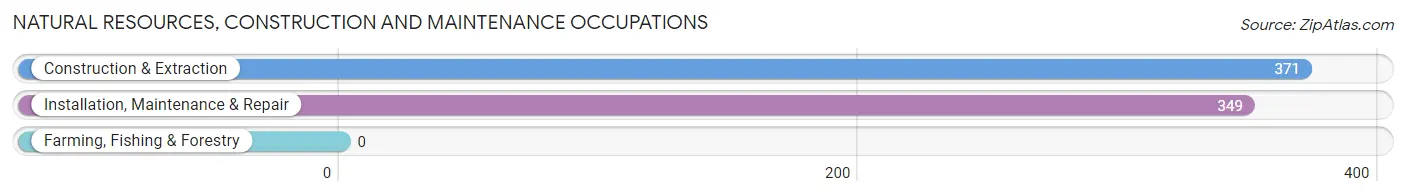
Natural Resources, Construction and Maintenance Occupations
The most common Natural Resources, Construction and Maintenance occupations in Arnold are Construction & Extraction (371 | 2.9%), and Installation, Maintenance & Repair (349 | 2.8%).
Natural Resources, Construction and Maintenance Occupations by Sex
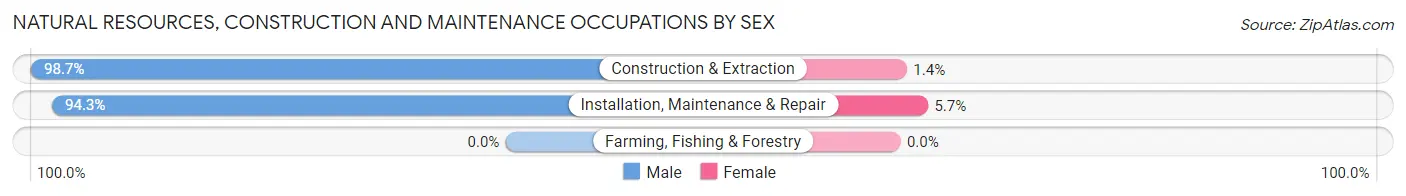
| Occupation | Male | Female |
| Farming, Fishing & Forestry | 0 (0.0%) | 0 (0.0%) |
| Construction & Extraction | 366 (98.7%) | 5 (1.3%) |
| Installation, Maintenance & Repair | 329 (94.3%) | 20 (5.7%) |
| Total (Category) | 695 (96.5%) | 25 (3.5%) |
| Total (Overall) | 6,568 (52.2%) | 6,008 (47.8%) |
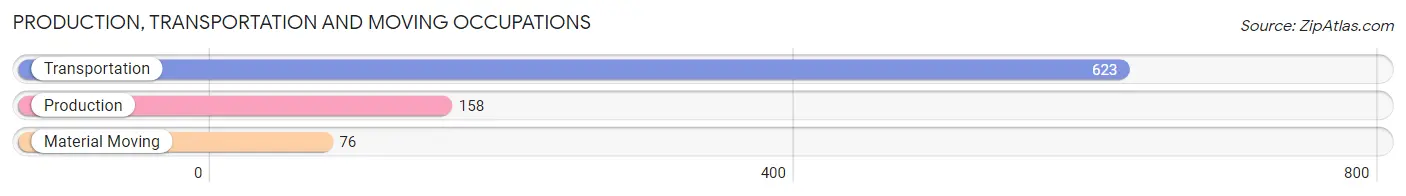
Production, Transportation and Moving Occupations
The most common Production, Transportation and Moving occupations in Arnold are Transportation (623 | 5.0%), Production (158 | 1.3%), and Material Moving (76 | 0.6%).
Production, Transportation and Moving Occupations by Sex
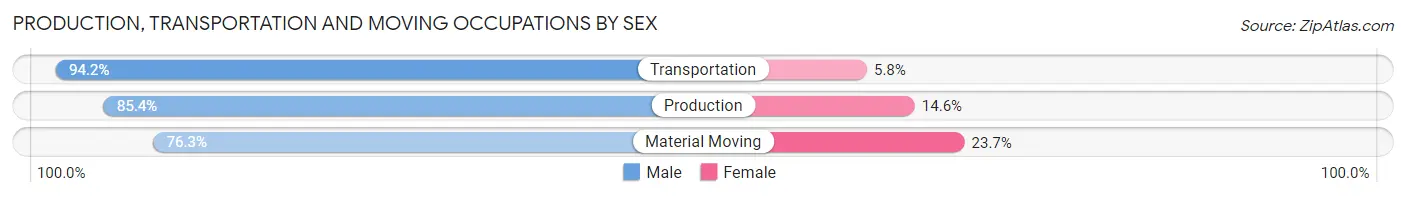
| Occupation | Male | Female |
| Production | 135 (85.4%) | 23 (14.6%) |
| Transportation | 587 (94.2%) | 36 (5.8%) |
| Material Moving | 58 (76.3%) | 18 (23.7%) |
| Total (Category) | 780 (91.0%) | 77 (9.0%) |
| Total (Overall) | 6,568 (52.2%) | 6,008 (47.8%) |
Employment Industries by Sex in Arnold
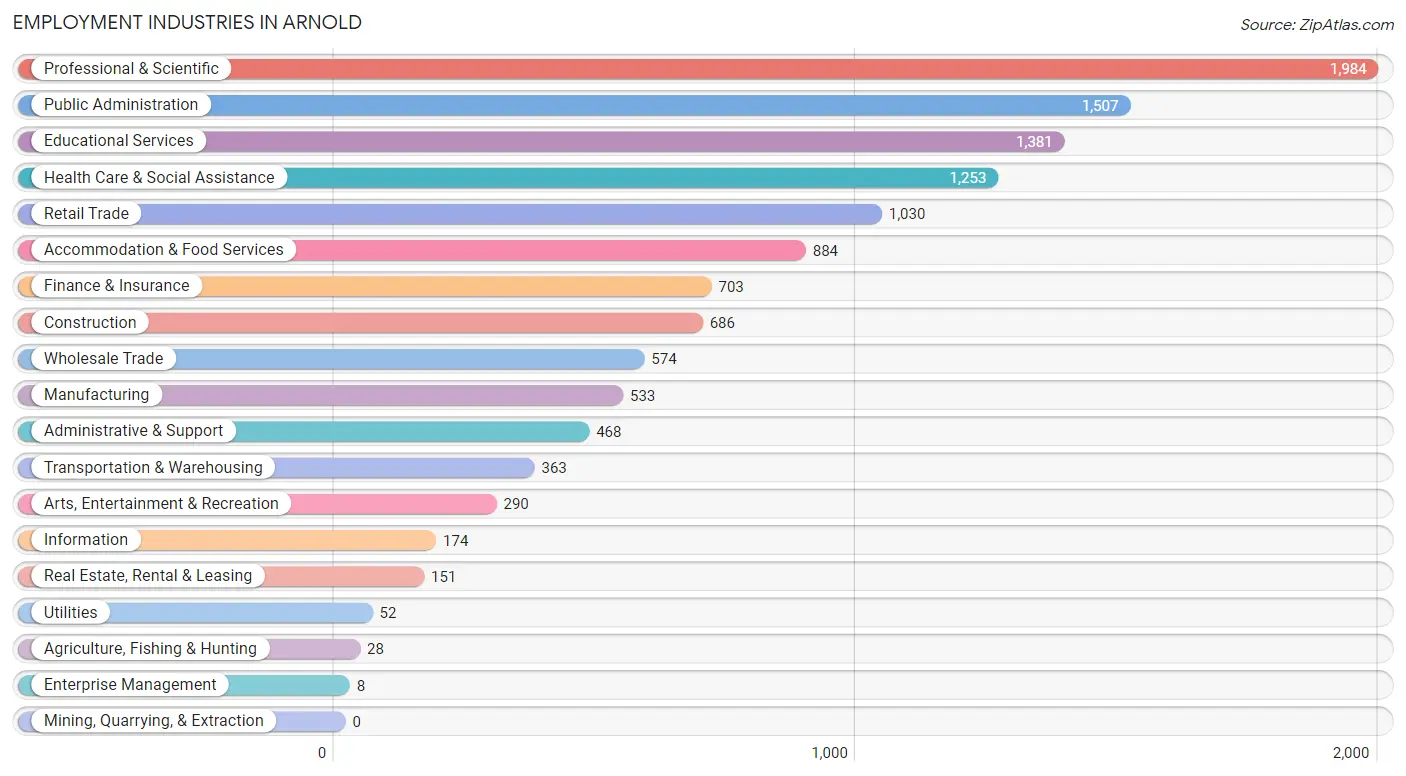
Employment Industries in Arnold
The major employment industries in Arnold include Professional & Scientific (1,984 | 15.8%), Public Administration (1,507 | 12.0%), Educational Services (1,381 | 11.0%), Health Care & Social Assistance (1,253 | 10.0%), and Retail Trade (1,030 | 8.2%).
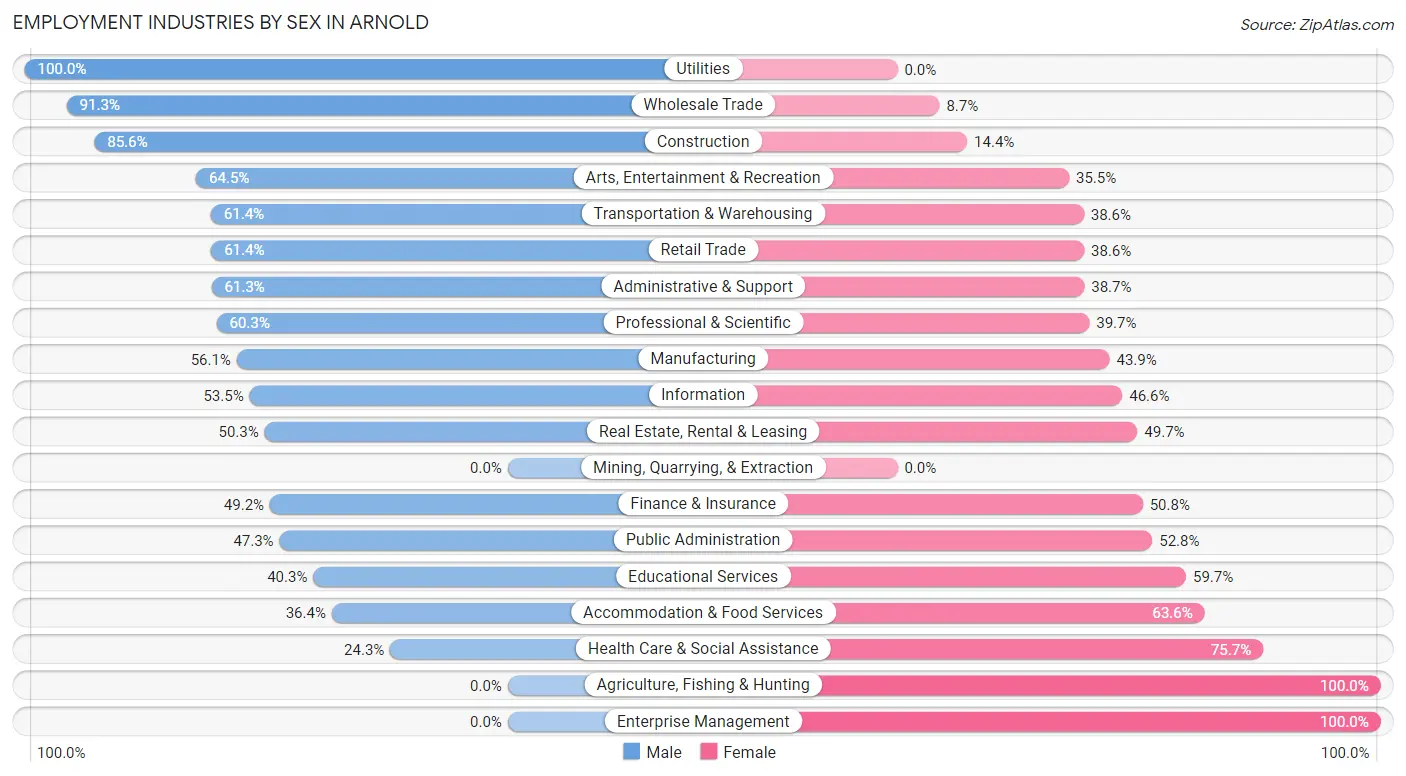
Employment Industries by Sex in Arnold
The Arnold industries that see more men than women are Utilities (100.0%), Wholesale Trade (91.3%), and Construction (85.6%), whereas the industries that tend to have a higher number of women are Agriculture, Fishing & Hunting (100.0%), Enterprise Management (100.0%), and Health Care & Social Assistance (75.7%).
| Industry | Male | Female |
| Agriculture, Fishing & Hunting | 0 (0.0%) | 28 (100.0%) |
| Mining, Quarrying, & Extraction | 0 (0.0%) | 0 (0.0%) |
| Construction | 587 (85.6%) | 99 (14.4%) |
| Manufacturing | 299 (56.1%) | 234 (43.9%) |
| Wholesale Trade | 524 (91.3%) | 50 (8.7%) |
| Retail Trade | 632 (61.4%) | 398 (38.6%) |
| Transportation & Warehousing | 223 (61.4%) | 140 (38.6%) |
| Utilities | 52 (100.0%) | 0 (0.0%) |
| Information | 93 (53.4%) | 81 (46.6%) |
| Finance & Insurance | 346 (49.2%) | 357 (50.8%) |
| Real Estate, Rental & Leasing | 76 (50.3%) | 75 (49.7%) |
| Professional & Scientific | 1,196 (60.3%) | 788 (39.7%) |
| Enterprise Management | 0 (0.0%) | 8 (100.0%) |
| Administrative & Support | 287 (61.3%) | 181 (38.7%) |
| Educational Services | 556 (40.3%) | 825 (59.7%) |
| Health Care & Social Assistance | 305 (24.3%) | 948 (75.7%) |
| Arts, Entertainment & Recreation | 187 (64.5%) | 103 (35.5%) |
| Accommodation & Food Services | 322 (36.4%) | 562 (63.6%) |
| Public Administration | 712 (47.2%) | 795 (52.7%) |
| Total | 6,568 (52.2%) | 6,008 (47.8%) |
Education in Arnold
School Enrollment in Arnold
The most common levels of schooling among the 7,450 students in Arnold are middle school (1,783 | 23.9%), high school (1,643 | 22.1%), and elementary school (1,512 | 20.3%).
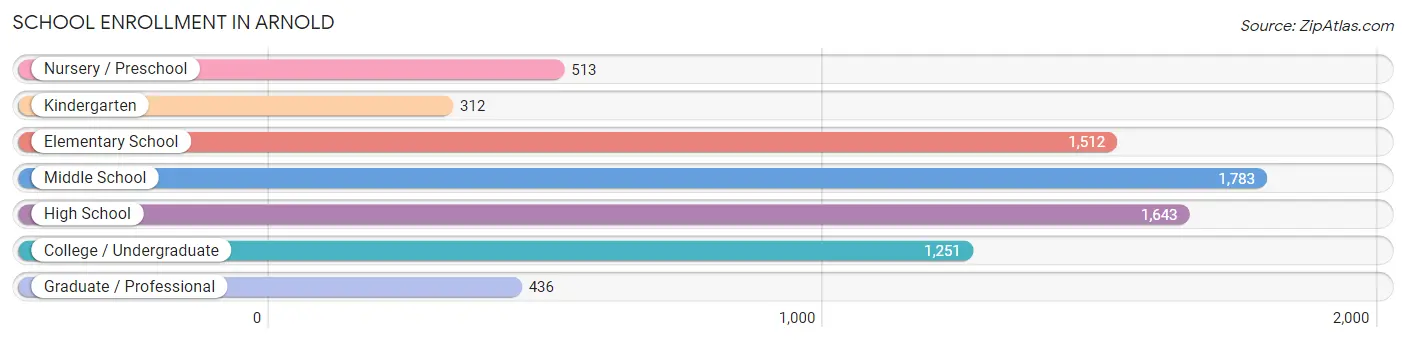
| School Level | # Students | % Students |
| Nursery / Preschool | 513 | 6.9% |
| Kindergarten | 312 | 4.2% |
| Elementary School | 1,512 | 20.3% |
| Middle School | 1,783 | 23.9% |
| High School | 1,643 | 22.1% |
| College / Undergraduate | 1,251 | 16.8% |
| Graduate / Professional | 436 | 5.9% |
| Total | 7,450 | 100.0% |
School Enrollment by Age by Funding Source in Arnold
Out of a total of 7,450 students who are enrolled in schools in Arnold, 1,542 (20.7%) attend a private institution, while the remaining 5,908 (79.3%) are enrolled in public schools. The age group of 3 to 4 year olds has the highest likelihood of being enrolled in private schools, with 389 (90.5% in the age bracket) enrolled. Conversely, the age group of 20 to 24 year olds has the lowest likelihood of being enrolled in a private school, with 576 (95.7% in the age bracket) attending a public institution.
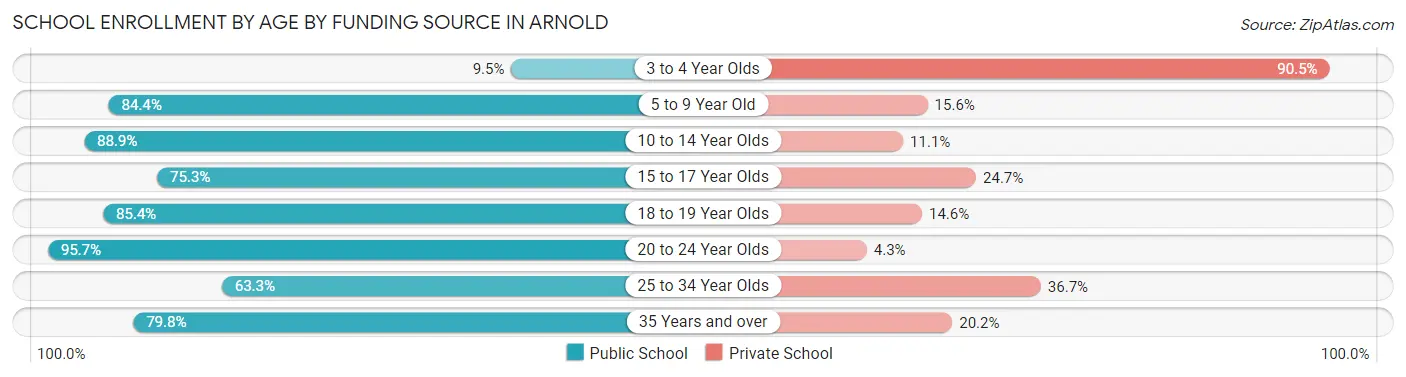
| Age Bracket | Public School | Private School |
| 3 to 4 Year Olds | 41 (9.5%) | 389 (90.5%) |
| 5 to 9 Year Old | 1,570 (84.4%) | 291 (15.6%) |
| 10 to 14 Year Olds | 1,726 (88.9%) | 215 (11.1%) |
| 15 to 17 Year Olds | 925 (75.3%) | 303 (24.7%) |
| 18 to 19 Year Olds | 468 (85.4%) | 80 (14.6%) |
| 20 to 24 Year Olds | 576 (95.7%) | 26 (4.3%) |
| 25 to 34 Year Olds | 272 (63.3%) | 158 (36.7%) |
| 35 Years and over | 327 (79.8%) | 83 (20.2%) |
| Total | 5,908 (79.3%) | 1,542 (20.7%) |
Educational Attainment by Field of Study in Arnold
Business (2,072 | 20.9%), social sciences (1,062 | 10.7%), engineering (829 | 8.4%), education (828 | 8.3%), and science & technology (710 | 7.1%) are the most common fields of study among 9,927 individuals in Arnold who have obtained a bachelor's degree or higher.
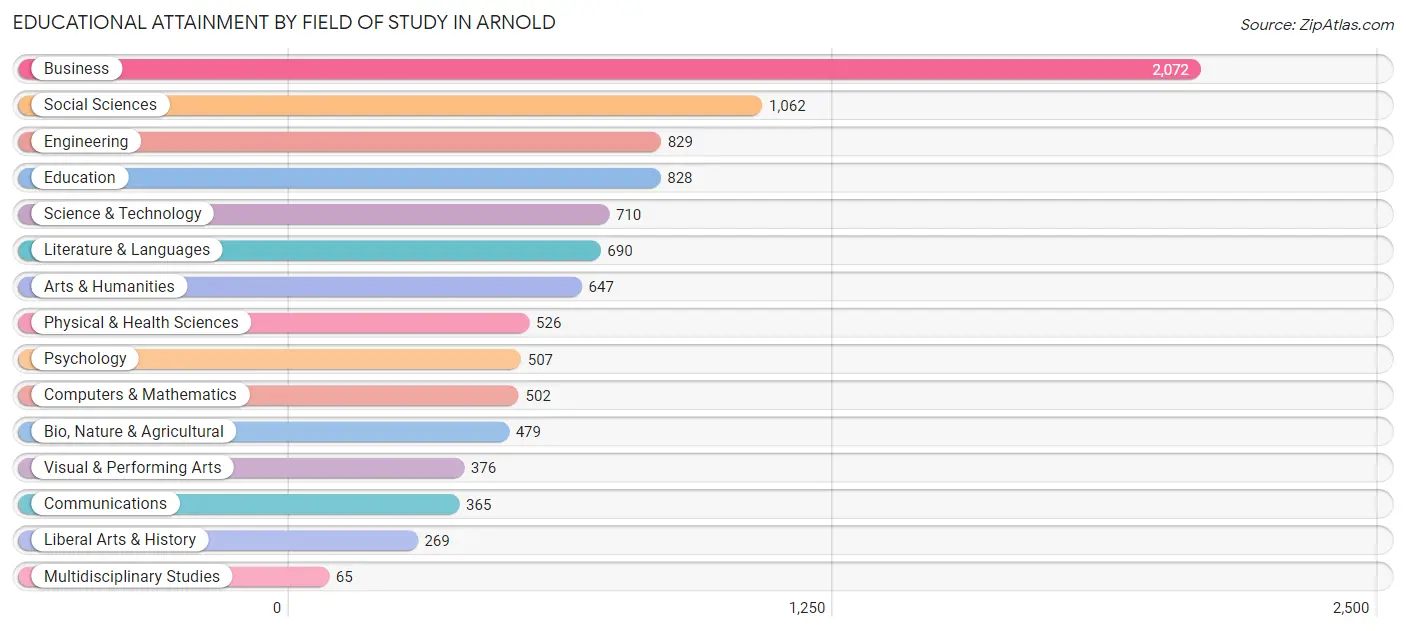
| Field of Study | # Graduates | % Graduates |
| Computers & Mathematics | 502 | 5.1% |
| Bio, Nature & Agricultural | 479 | 4.8% |
| Physical & Health Sciences | 526 | 5.3% |
| Psychology | 507 | 5.1% |
| Social Sciences | 1,062 | 10.7% |
| Engineering | 829 | 8.4% |
| Multidisciplinary Studies | 65 | 0.6% |
| Science & Technology | 710 | 7.1% |
| Business | 2,072 | 20.9% |
| Education | 828 | 8.3% |
| Literature & Languages | 690 | 7.0% |
| Liberal Arts & History | 269 | 2.7% |
| Visual & Performing Arts | 376 | 3.8% |
| Communications | 365 | 3.7% |
| Arts & Humanities | 647 | 6.5% |
| Total | 9,927 | 100.0% |
Transportation & Commute in Arnold
Vehicle Availability by Sex in Arnold
The most prevalent vehicle ownership categories in Arnold are males with 2 vehicles (2,956, accounting for 43.8%) and females with 2 vehicles (2,657, making up 49.8%).
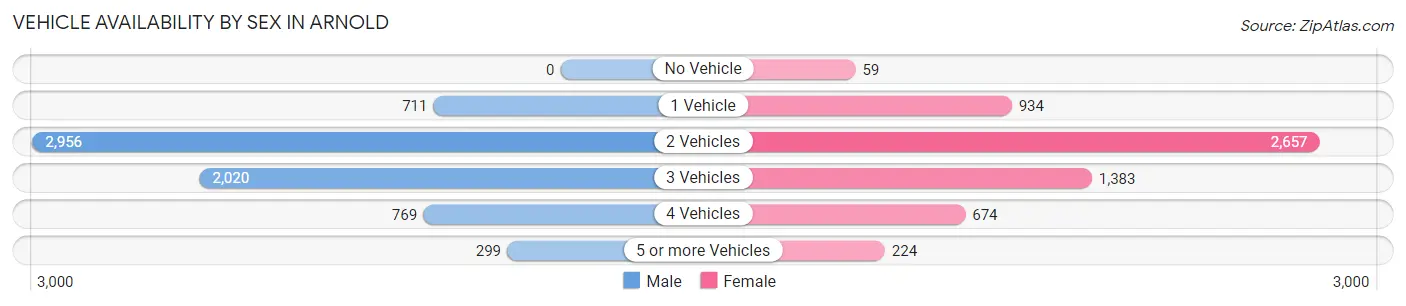
| Vehicles Available | Male | Female |
| No Vehicle | 0 (0.0%) | 59 (1.0%) |
| 1 Vehicle | 711 (10.5%) | 934 (15.8%) |
| 2 Vehicles | 2,956 (43.8%) | 2,657 (44.8%) |
| 3 Vehicles | 2,020 (29.9%) | 1,383 (23.3%) |
| 4 Vehicles | 769 (11.4%) | 674 (11.4%) |
| 5 or more Vehicles | 299 (4.4%) | 224 (3.8%) |
| Total | 6,755 (100.0%) | 5,931 (100.0%) |
Commute Time in Arnold
The most frequently occuring commute durations in Arnold are 15 to 19 minutes (1,666 commuters, 16.3%), 45 to 59 minutes (1,467 commuters, 14.3%), and 20 to 24 minutes (1,272 commuters, 12.4%).
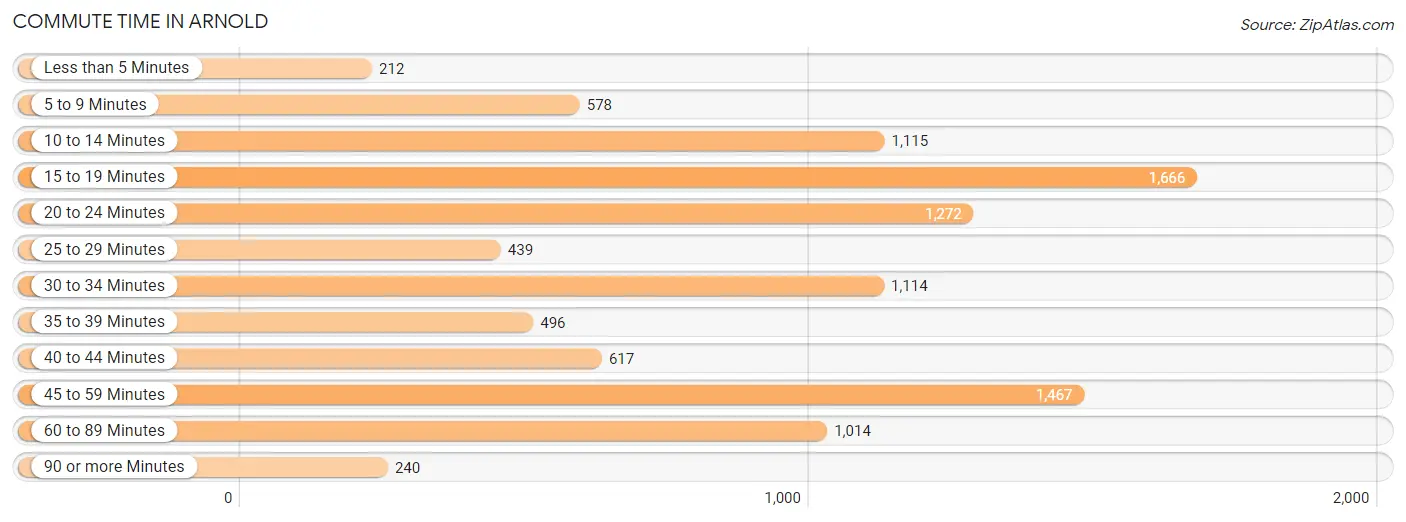
| Commute Time | # Commuters | % Commuters |
| Less than 5 Minutes | 212 | 2.1% |
| 5 to 9 Minutes | 578 | 5.7% |
| 10 to 14 Minutes | 1,115 | 10.9% |
| 15 to 19 Minutes | 1,666 | 16.3% |
| 20 to 24 Minutes | 1,272 | 12.4% |
| 25 to 29 Minutes | 439 | 4.3% |
| 30 to 34 Minutes | 1,114 | 10.9% |
| 35 to 39 Minutes | 496 | 4.9% |
| 40 to 44 Minutes | 617 | 6.0% |
| 45 to 59 Minutes | 1,467 | 14.3% |
| 60 to 89 Minutes | 1,014 | 9.9% |
| 90 or more Minutes | 240 | 2.4% |
Commute Time by Sex in Arnold
The most common commute times in Arnold are 45 to 59 minutes (937 commuters, 17.3%) for males and 15 to 19 minutes (991 commuters, 20.6%) for females.
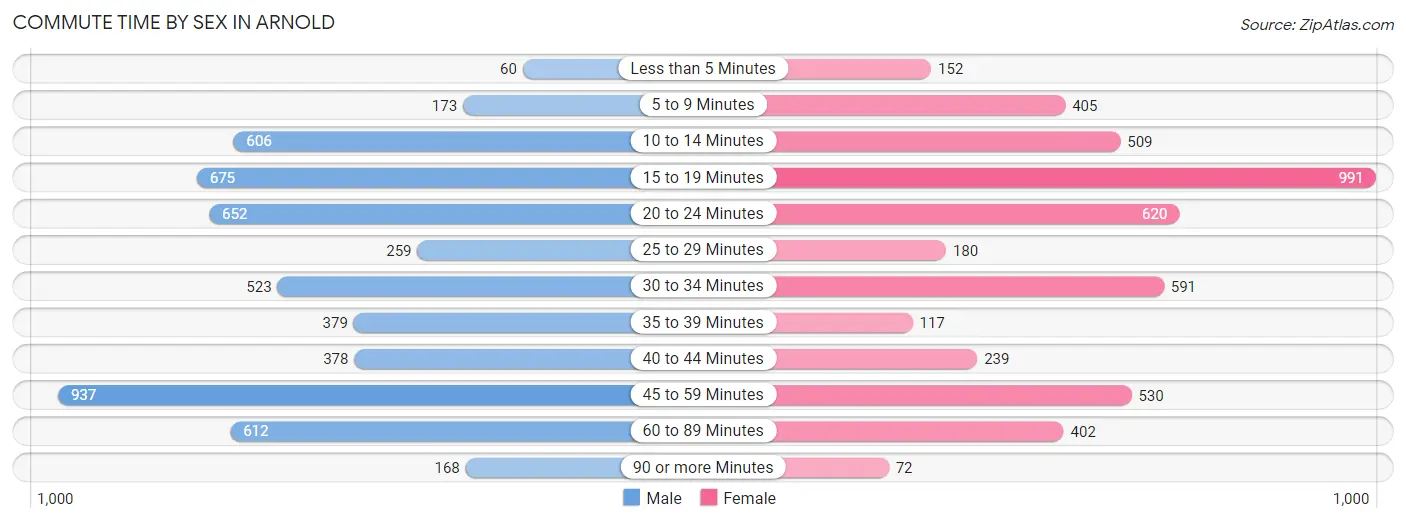
| Commute Time | Male | Female |
| Less than 5 Minutes | 60 (1.1%) | 152 (3.2%) |
| 5 to 9 Minutes | 173 (3.2%) | 405 (8.4%) |
| 10 to 14 Minutes | 606 (11.2%) | 509 (10.6%) |
| 15 to 19 Minutes | 675 (12.4%) | 991 (20.6%) |
| 20 to 24 Minutes | 652 (12.0%) | 620 (12.9%) |
| 25 to 29 Minutes | 259 (4.8%) | 180 (3.7%) |
| 30 to 34 Minutes | 523 (9.7%) | 591 (12.3%) |
| 35 to 39 Minutes | 379 (7.0%) | 117 (2.4%) |
| 40 to 44 Minutes | 378 (7.0%) | 239 (5.0%) |
| 45 to 59 Minutes | 937 (17.3%) | 530 (11.0%) |
| 60 to 89 Minutes | 612 (11.3%) | 402 (8.4%) |
| 90 or more Minutes | 168 (3.1%) | 72 (1.5%) |
Time of Departure to Work by Sex in Arnold
The most frequent times of departure to work in Arnold are 8:00 AM to 8:29 AM (632, 11.7%) for males and 8:00 AM to 8:29 AM (770, 16.0%) for females.
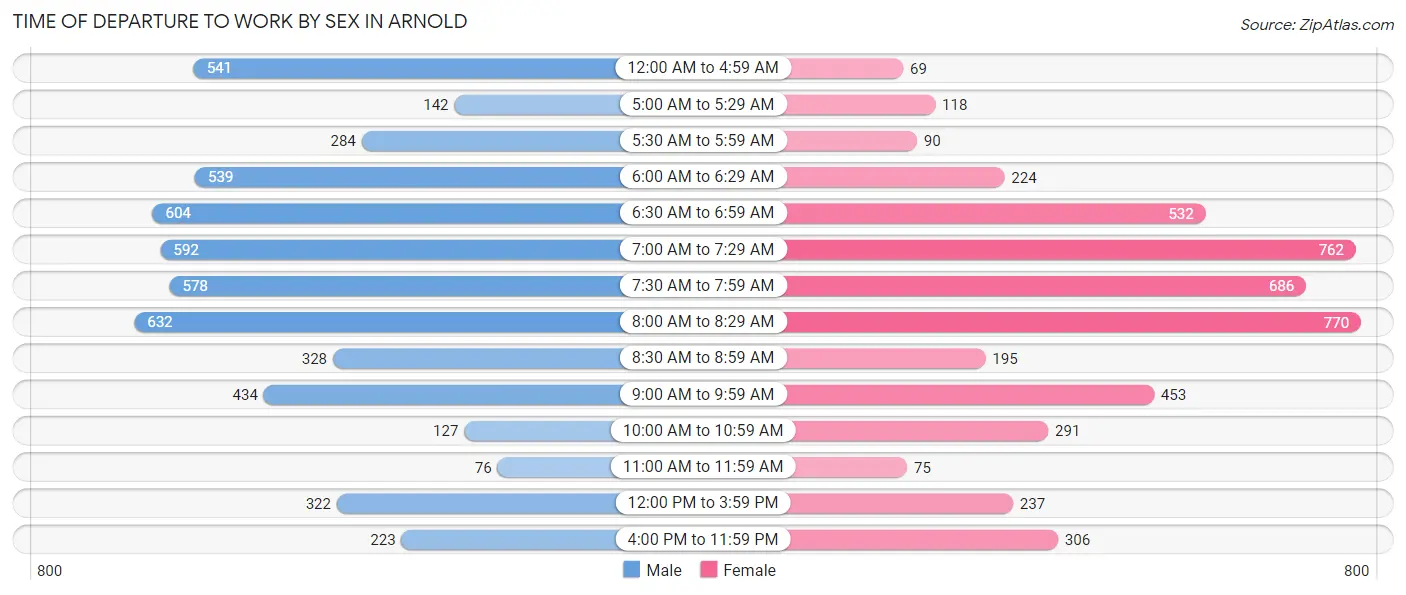
| Time of Departure | Male | Female |
| 12:00 AM to 4:59 AM | 541 (10.0%) | 69 (1.4%) |
| 5:00 AM to 5:29 AM | 142 (2.6%) | 118 (2.5%) |
| 5:30 AM to 5:59 AM | 284 (5.2%) | 90 (1.9%) |
| 6:00 AM to 6:29 AM | 539 (9.9%) | 224 (4.7%) |
| 6:30 AM to 6:59 AM | 604 (11.1%) | 532 (11.1%) |
| 7:00 AM to 7:29 AM | 592 (10.9%) | 762 (15.9%) |
| 7:30 AM to 7:59 AM | 578 (10.7%) | 686 (14.3%) |
| 8:00 AM to 8:29 AM | 632 (11.7%) | 770 (16.0%) |
| 8:30 AM to 8:59 AM | 328 (6.0%) | 195 (4.1%) |
| 9:00 AM to 9:59 AM | 434 (8.0%) | 453 (9.4%) |
| 10:00 AM to 10:59 AM | 127 (2.3%) | 291 (6.0%) |
| 11:00 AM to 11:59 AM | 76 (1.4%) | 75 (1.6%) |
| 12:00 PM to 3:59 PM | 322 (5.9%) | 237 (4.9%) |
| 4:00 PM to 11:59 PM | 223 (4.1%) | 306 (6.4%) |
| Total | 5,422 (100.0%) | 4,808 (100.0%) |
Housing Occupancy in Arnold
Occupancy by Ownership in Arnold
Of the total 8,669 dwellings in Arnold, owner-occupied units account for 7,413 (85.5%), while renter-occupied units make up 1,256 (14.5%).
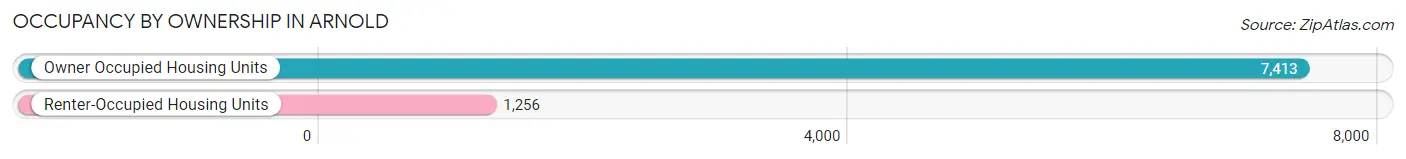
| Occupancy | # Housing Units | % Housing Units |
| Owner Occupied Housing Units | 7,413 | 85.5% |
| Renter-Occupied Housing Units | 1,256 | 14.5% |
| Total Occupied Housing Units | 8,669 | 100.0% |
Occupancy by Household Size in Arnold
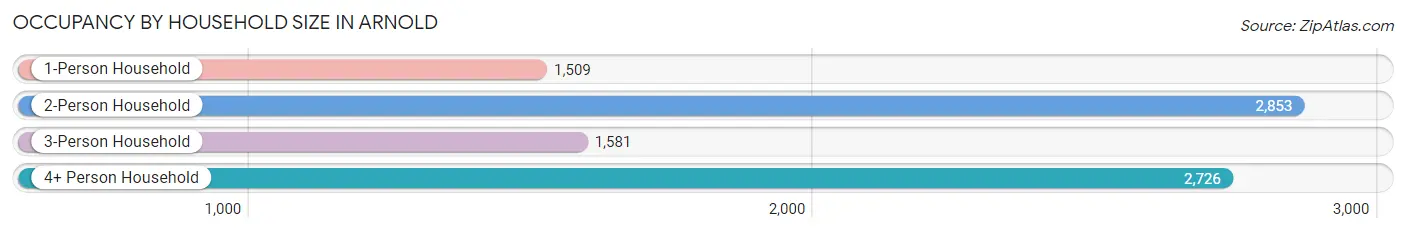
| Household Size | # Housing Units | % Housing Units |
| 1-Person Household | 1,509 | 17.4% |
| 2-Person Household | 2,853 | 32.9% |
| 3-Person Household | 1,581 | 18.2% |
| 4+ Person Household | 2,726 | 31.5% |
| Total Housing Units | 8,669 | 100.0% |
Occupancy by Ownership by Household Size in Arnold
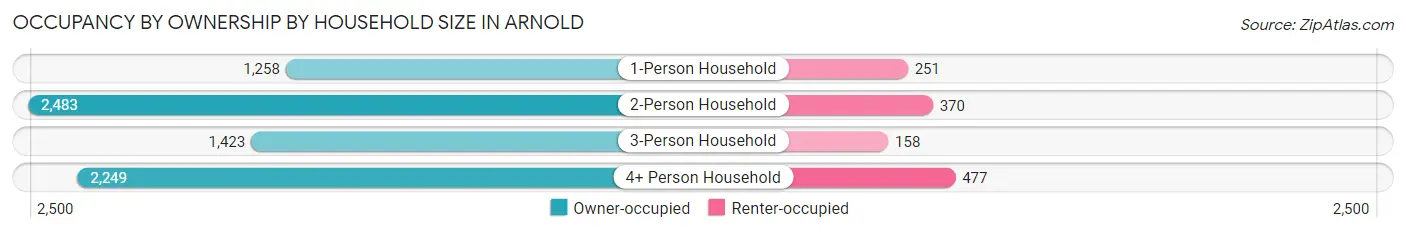
| Household Size | Owner-occupied | Renter-occupied |
| 1-Person Household | 1,258 (83.4%) | 251 (16.6%) |
| 2-Person Household | 2,483 (87.0%) | 370 (13.0%) |
| 3-Person Household | 1,423 (90.0%) | 158 (10.0%) |
| 4+ Person Household | 2,249 (82.5%) | 477 (17.5%) |
| Total Housing Units | 7,413 (85.5%) | 1,256 (14.5%) |
Occupancy by Educational Attainment in Arnold
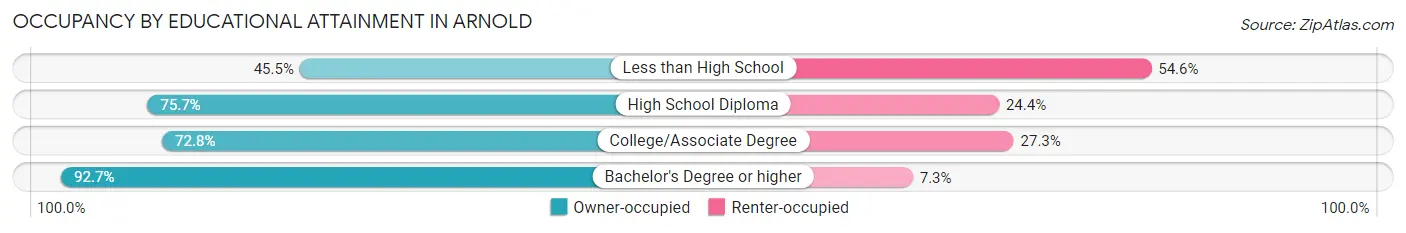
| Household Size | Owner-occupied | Renter-occupied |
| Less than High School | 40 (45.5%) | 48 (54.5%) |
| High School Diploma | 665 (75.6%) | 214 (24.3%) |
| College/Associate Degree | 1,583 (72.8%) | 593 (27.3%) |
| Bachelor's Degree or higher | 5,125 (92.7%) | 401 (7.3%) |
Occupancy by Age of Householder in Arnold
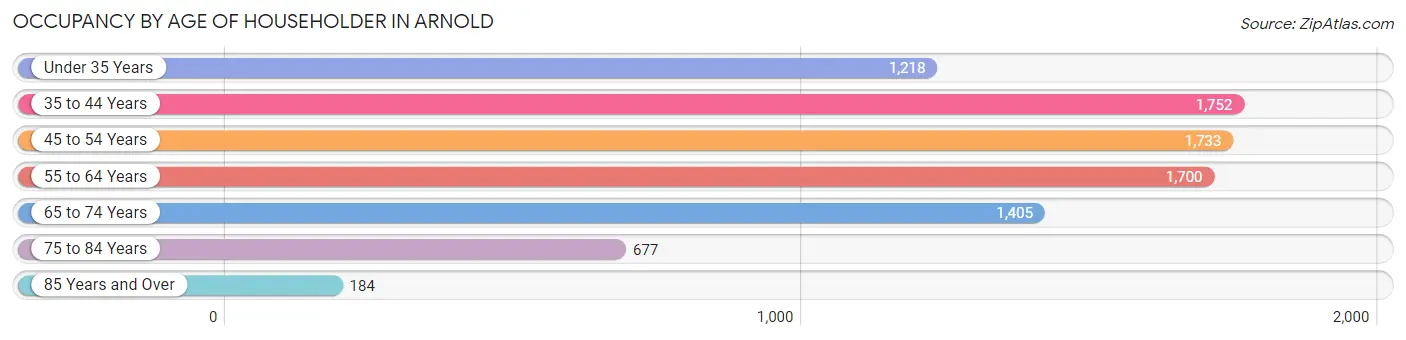
| Age Bracket | # Households | % Households |
| Under 35 Years | 1,218 | 14.1% |
| 35 to 44 Years | 1,752 | 20.2% |
| 45 to 54 Years | 1,733 | 20.0% |
| 55 to 64 Years | 1,700 | 19.6% |
| 65 to 74 Years | 1,405 | 16.2% |
| 75 to 84 Years | 677 | 7.8% |
| 85 Years and Over | 184 | 2.1% |
| Total | 8,669 | 100.0% |
Housing Finances in Arnold
Median Income by Occupancy in Arnold
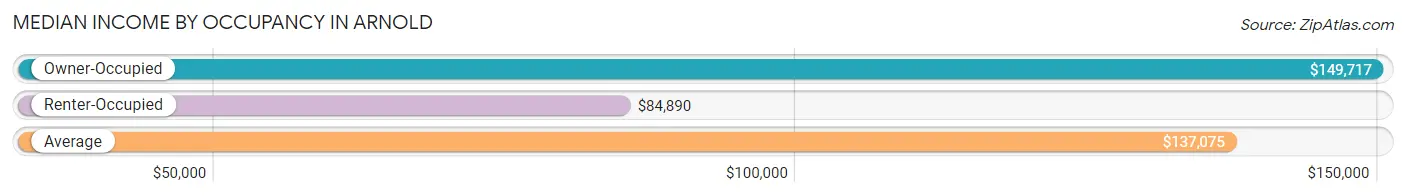
| Occupancy Type | # Households | Median Income |
| Owner-Occupied | 7,413 (85.5%) | $149,717 |
| Renter-Occupied | 1,256 (14.5%) | $84,890 |
| Average | 8,669 (100.0%) | $137,075 |
Occupancy by Householder Income Bracket in Arnold
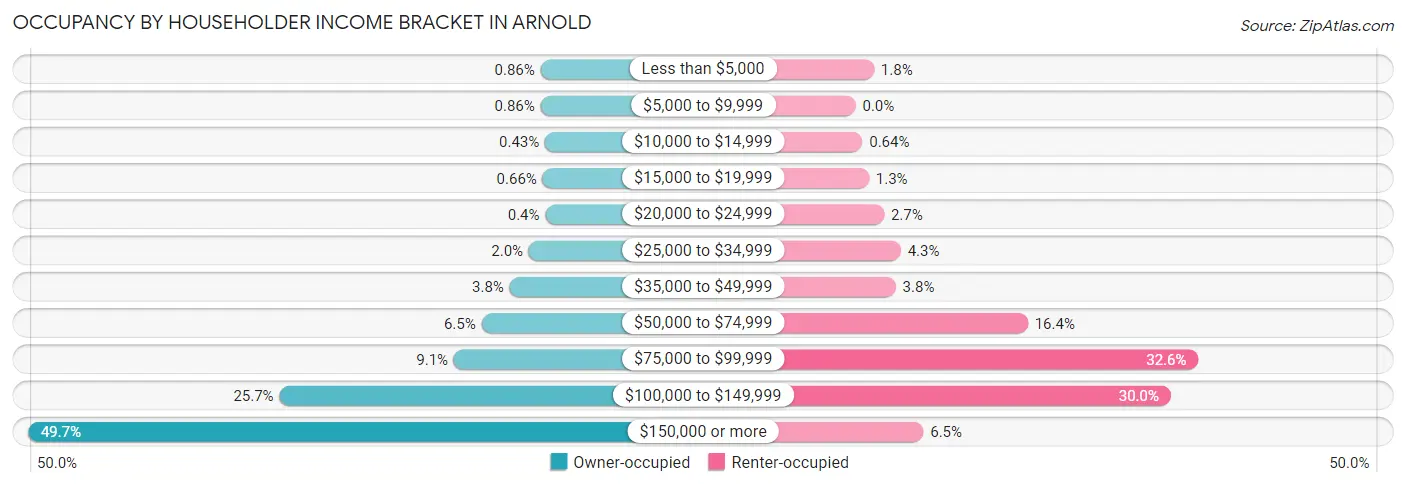
| Income Bracket | Owner-occupied | Renter-occupied |
| Less than $5,000 | 64 (0.9%) | 22 (1.8%) |
| $5,000 to $9,999 | 64 (0.9%) | 0 (0.0%) |
| $10,000 to $14,999 | 32 (0.4%) | 8 (0.6%) |
| $15,000 to $19,999 | 49 (0.7%) | 16 (1.3%) |
| $20,000 to $24,999 | 30 (0.4%) | 34 (2.7%) |
| $25,000 to $34,999 | 146 (2.0%) | 54 (4.3%) |
| $35,000 to $49,999 | 282 (3.8%) | 48 (3.8%) |
| $50,000 to $74,999 | 480 (6.5%) | 206 (16.4%) |
| $75,000 to $99,999 | 675 (9.1%) | 410 (32.6%) |
| $100,000 to $149,999 | 1,907 (25.7%) | 377 (30.0%) |
| $150,000 or more | 3,684 (49.7%) | 81 (6.5%) |
| Total | 7,413 (100.0%) | 1,256 (100.0%) |
Monthly Housing Cost Tiers in Arnold
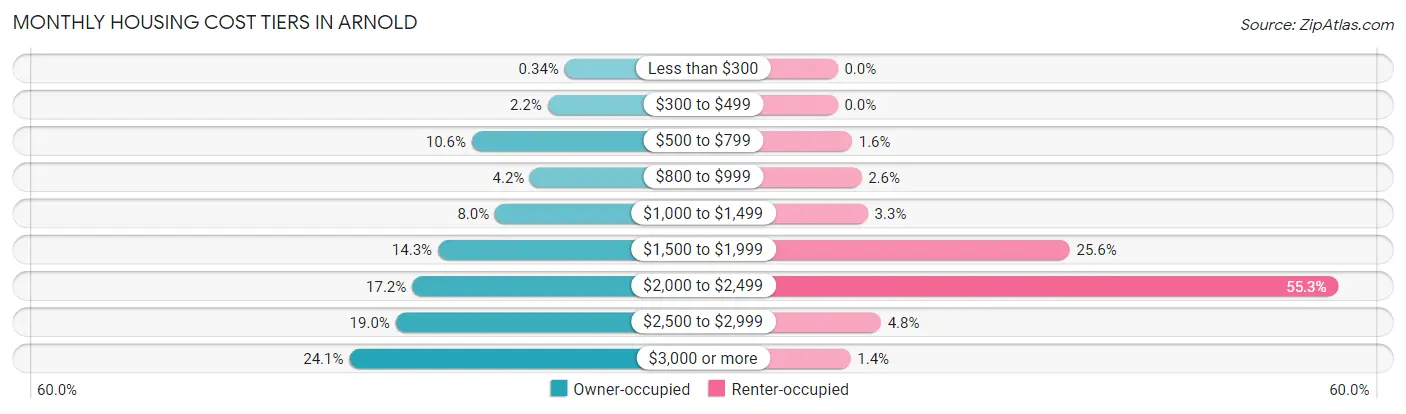
| Monthly Cost | Owner-occupied | Renter-occupied |
| Less than $300 | 25 (0.3%) | 0 (0.0%) |
| $300 to $499 | 164 (2.2%) | 0 (0.0%) |
| $500 to $799 | 786 (10.6%) | 20 (1.6%) |
| $800 to $999 | 308 (4.2%) | 33 (2.6%) |
| $1,000 to $1,499 | 595 (8.0%) | 42 (3.3%) |
| $1,500 to $1,999 | 1,063 (14.3%) | 322 (25.6%) |
| $2,000 to $2,499 | 1,274 (17.2%) | 695 (55.3%) |
| $2,500 to $2,999 | 1,409 (19.0%) | 60 (4.8%) |
| $3,000 or more | 1,789 (24.1%) | 18 (1.4%) |
| Total | 7,413 (100.0%) | 1,256 (100.0%) |
Physical Housing Characteristics in Arnold
Housing Structures in Arnold
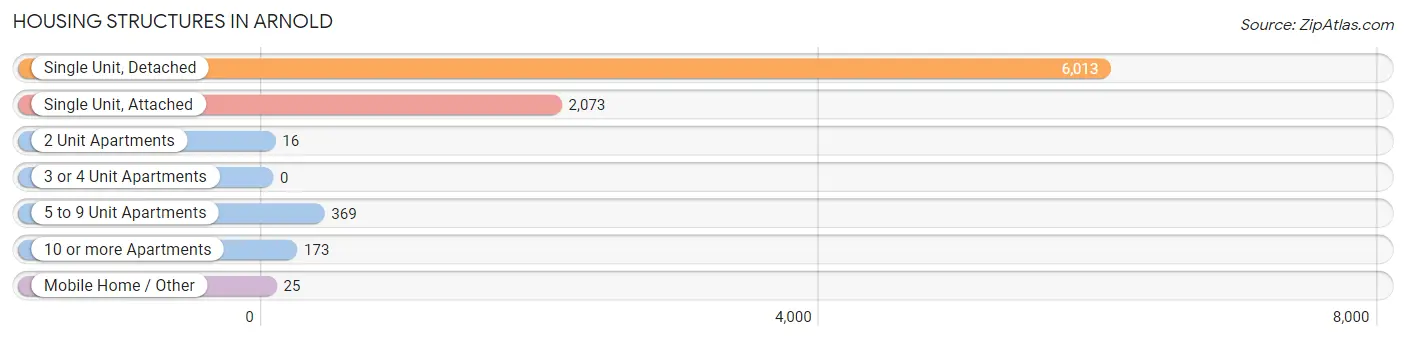
| Structure Type | # Housing Units | % Housing Units |
| Single Unit, Detached | 6,013 | 69.4% |
| Single Unit, Attached | 2,073 | 23.9% |
| 2 Unit Apartments | 16 | 0.2% |
| 3 or 4 Unit Apartments | 0 | 0.0% |
| 5 to 9 Unit Apartments | 369 | 4.3% |
| 10 or more Apartments | 173 | 2.0% |
| Mobile Home / Other | 25 | 0.3% |
| Total | 8,669 | 100.0% |
Housing Structures by Occupancy in Arnold
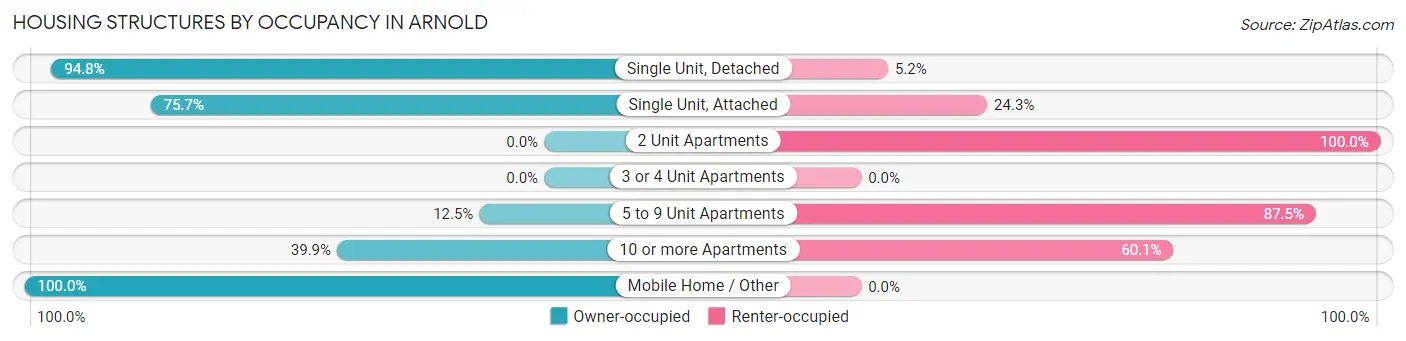
| Structure Type | Owner-occupied | Renter-occupied |
| Single Unit, Detached | 5,703 (94.8%) | 310 (5.2%) |
| Single Unit, Attached | 1,570 (75.7%) | 503 (24.3%) |
| 2 Unit Apartments | 0 (0.0%) | 16 (100.0%) |
| 3 or 4 Unit Apartments | 0 (0.0%) | 0 (0.0%) |
| 5 to 9 Unit Apartments | 46 (12.5%) | 323 (87.5%) |
| 10 or more Apartments | 69 (39.9%) | 104 (60.1%) |
| Mobile Home / Other | 25 (100.0%) | 0 (0.0%) |
| Total | 7,413 (85.5%) | 1,256 (14.5%) |
Housing Structures by Number of Rooms in Arnold
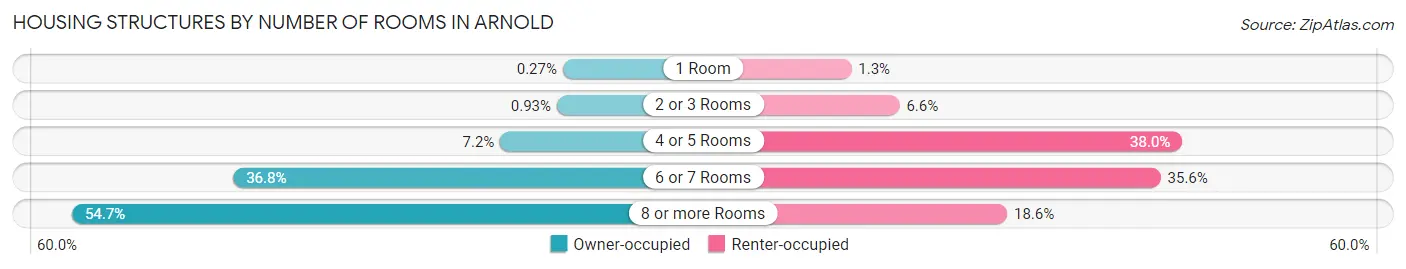
| Number of Rooms | Owner-occupied | Renter-occupied |
| 1 Room | 20 (0.3%) | 16 (1.3%) |
| 2 or 3 Rooms | 69 (0.9%) | 83 (6.6%) |
| 4 or 5 Rooms | 535 (7.2%) | 477 (38.0%) |
| 6 or 7 Rooms | 2,731 (36.8%) | 447 (35.6%) |
| 8 or more Rooms | 4,058 (54.7%) | 233 (18.5%) |
| Total | 7,413 (100.0%) | 1,256 (100.0%) |
Housing Structure by Heating Type in Arnold
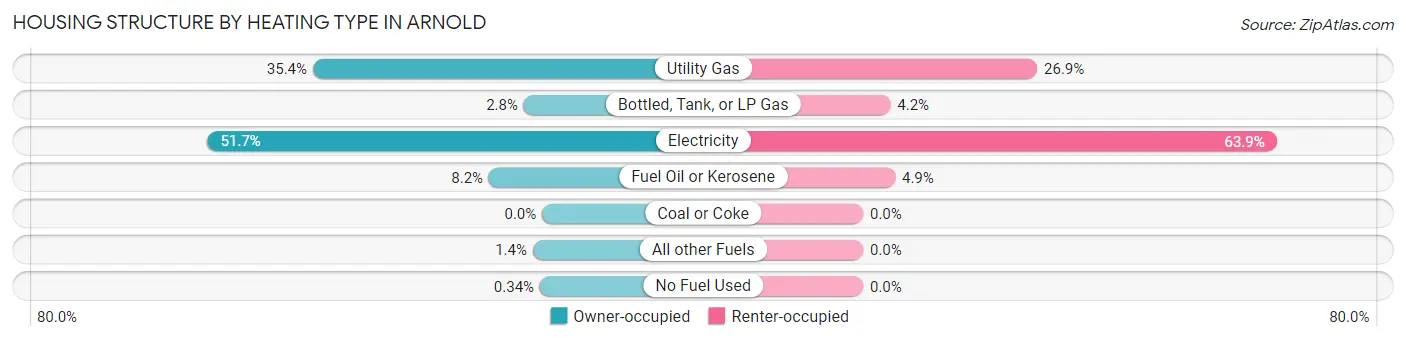
| Heating Type | Owner-occupied | Renter-occupied |
| Utility Gas | 2,627 (35.4%) | 338 (26.9%) |
| Bottled, Tank, or LP Gas | 210 (2.8%) | 53 (4.2%) |
| Electricity | 3,835 (51.7%) | 803 (63.9%) |
| Fuel Oil or Kerosene | 609 (8.2%) | 62 (4.9%) |
| Coal or Coke | 0 (0.0%) | 0 (0.0%) |
| All other Fuels | 107 (1.4%) | 0 (0.0%) |
| No Fuel Used | 25 (0.3%) | 0 (0.0%) |
| Total | 7,413 (100.0%) | 1,256 (100.0%) |
Household Vehicle Usage in Arnold
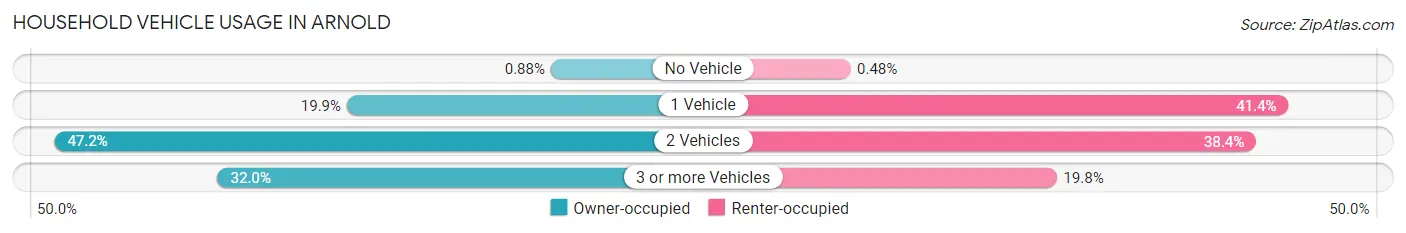
| Vehicles per Household | Owner-occupied | Renter-occupied |
| No Vehicle | 65 (0.9%) | 6 (0.5%) |
| 1 Vehicle | 1,477 (19.9%) | 520 (41.4%) |
| 2 Vehicles | 3,500 (47.2%) | 482 (38.4%) |
| 3 or more Vehicles | 2,371 (32.0%) | 248 (19.8%) |
| Total | 7,413 (100.0%) | 1,256 (100.0%) |
Real Estate & Mortgages in Arnold
Real Estate and Mortgage Overview in Arnold
| Characteristic | Without Mortgage | With Mortgage |
| Housing Units | 1,653 | 5,760 |
| Median Property Value | $519,500 | $510,000 |
| Median Household Income | $99,627 | $3,072 |
| Monthly Housing Costs | $748 | $1,782 |
| Real Estate Taxes | $3,912 | $74 |
Property Value by Mortgage Status in Arnold
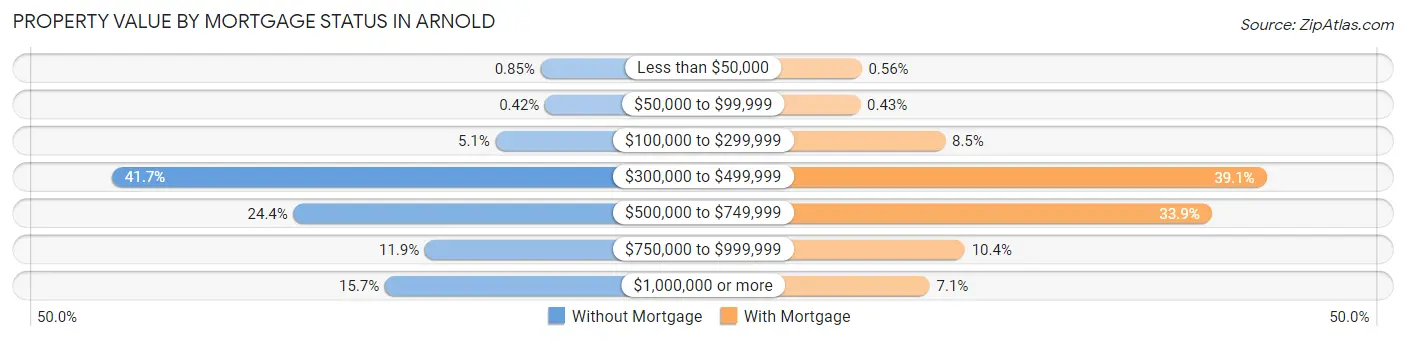
| Property Value | Without Mortgage | With Mortgage |
| Less than $50,000 | 14 (0.9%) | 32 (0.6%) |
| $50,000 to $99,999 | 7 (0.4%) | 25 (0.4%) |
| $100,000 to $299,999 | 85 (5.1%) | 491 (8.5%) |
| $300,000 to $499,999 | 689 (41.7%) | 2,254 (39.1%) |
| $500,000 to $749,999 | 403 (24.4%) | 1,953 (33.9%) |
| $750,000 to $999,999 | 196 (11.9%) | 599 (10.4%) |
| $1,000,000 or more | 259 (15.7%) | 406 (7.0%) |
| Total | 1,653 (100.0%) | 5,760 (100.0%) |
Household Income by Mortgage Status in Arnold
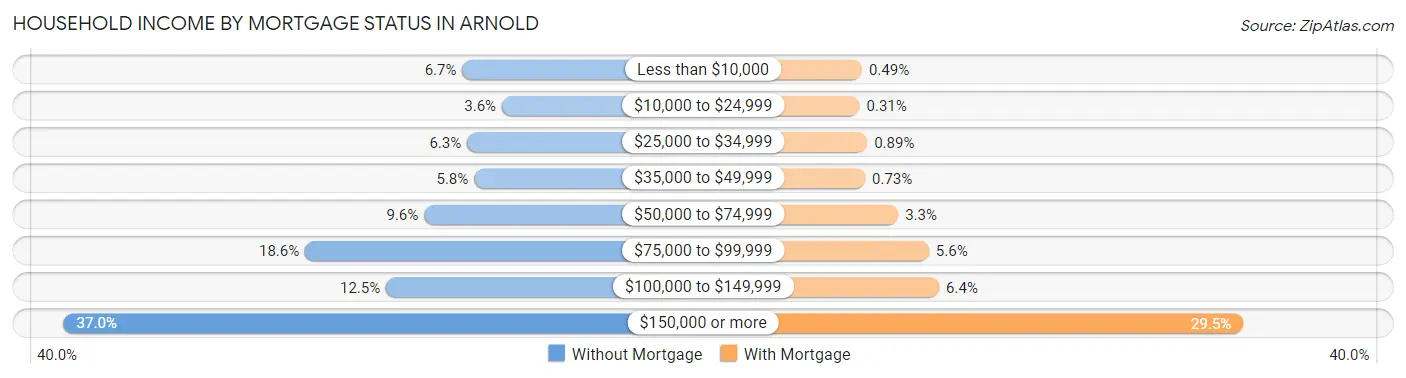
| Household Income | Without Mortgage | With Mortgage |
| Less than $10,000 | 110 (6.7%) | 28 (0.5%) |
| $10,000 to $24,999 | 60 (3.6%) | 18 (0.3%) |
| $25,000 to $34,999 | 104 (6.3%) | 51 (0.9%) |
| $35,000 to $49,999 | 95 (5.8%) | 42 (0.7%) |
| $50,000 to $74,999 | 158 (9.6%) | 187 (3.3%) |
| $75,000 to $99,999 | 308 (18.6%) | 322 (5.6%) |
| $100,000 to $149,999 | 206 (12.5%) | 367 (6.4%) |
| $150,000 or more | 612 (37.0%) | 1,701 (29.5%) |
| Total | 1,653 (100.0%) | 5,760 (100.0%) |
Property Value to Household Income Ratio in Arnold
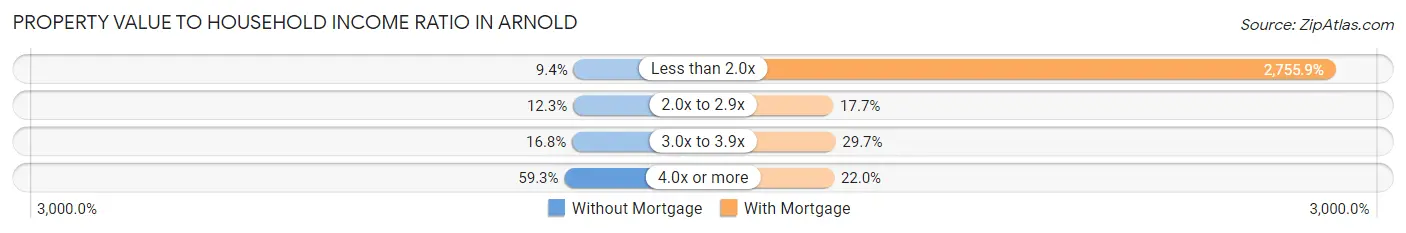
| Value-to-Income Ratio | Without Mortgage | With Mortgage |
| Less than 2.0x | 155 (9.4%) | 158,737 (2,755.8%) |
| 2.0x to 2.9x | 203 (12.3%) | 1,021 (17.7%) |
| 3.0x to 3.9x | 278 (16.8%) | 1,713 (29.7%) |
| 4.0x or more | 980 (59.3%) | 1,267 (22.0%) |
| Total | 1,653 (100.0%) | 5,760 (100.0%) |
Real Estate Taxes by Mortgage Status in Arnold
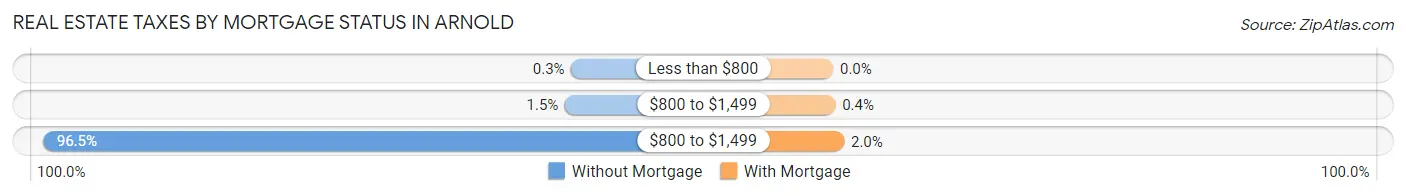
| Property Taxes | Without Mortgage | With Mortgage |
| Less than $800 | 5 (0.3%) | 0 (0.0%) |
| $800 to $1,499 | 24 (1.5%) | 23 (0.4%) |
| $800 to $1,499 | 1,595 (96.5%) | 116 (2.0%) |
| Total | 1,653 (100.0%) | 5,760 (100.0%) |
Health & Disability in Arnold
Health Insurance Coverage by Age in Arnold
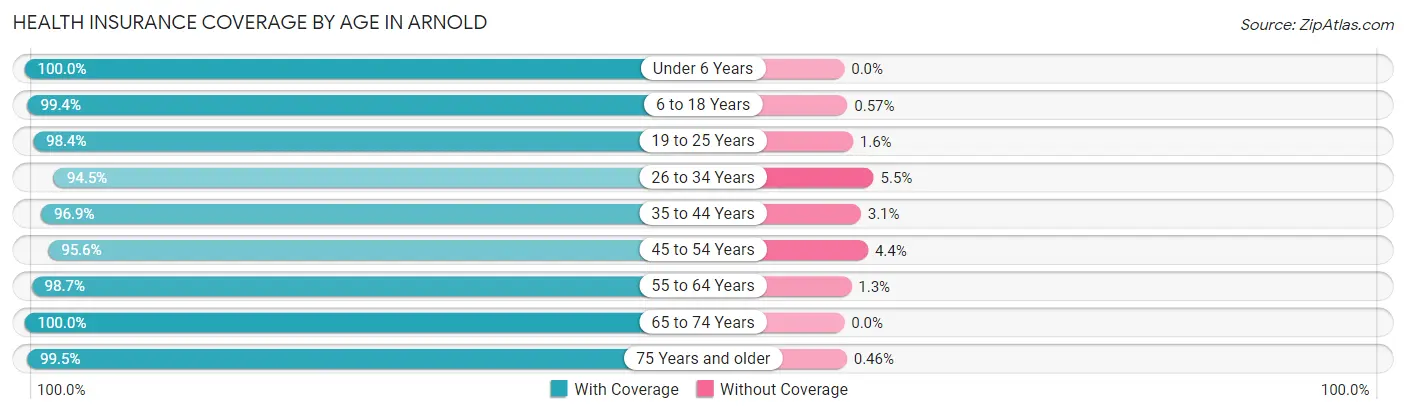
| Age Bracket | With Coverage | Without Coverage |
| Under 6 Years | 1,711 (100.0%) | 0 (0.0%) |
| 6 to 18 Years | 5,228 (99.4%) | 30 (0.6%) |
| 19 to 25 Years | 1,549 (98.4%) | 25 (1.6%) |
| 26 to 34 Years | 2,090 (94.5%) | 121 (5.5%) |
| 35 to 44 Years | 3,489 (96.9%) | 111 (3.1%) |
| 45 to 54 Years | 3,026 (95.6%) | 140 (4.4%) |
| 55 to 64 Years | 3,154 (98.7%) | 42 (1.3%) |
| 65 to 74 Years | 2,173 (100.0%) | 0 (0.0%) |
| 75 Years and older | 1,531 (99.5%) | 7 (0.5%) |
| Total | 23,951 (98.1%) | 476 (1.9%) |
Health Insurance Coverage by Citizenship Status in Arnold
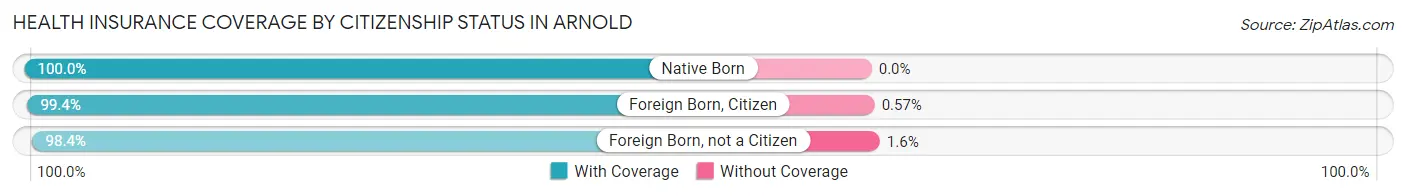
| Citizenship Status | With Coverage | Without Coverage |
| Native Born | 1,711 (100.0%) | 0 (0.0%) |
| Foreign Born, Citizen | 5,228 (99.4%) | 30 (0.6%) |
| Foreign Born, not a Citizen | 1,549 (98.4%) | 25 (1.6%) |
Health Insurance Coverage by Household Income in Arnold
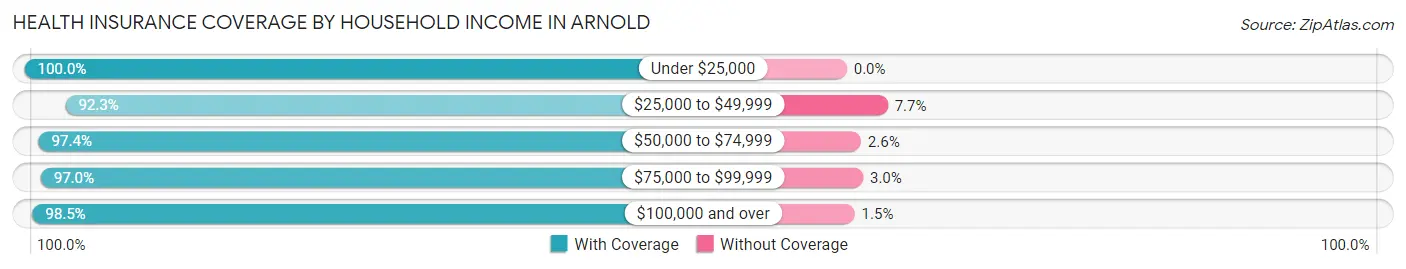
| Household Income | With Coverage | Without Coverage |
| Under $25,000 | 603 (100.0%) | 0 (0.0%) |
| $25,000 to $49,999 | 965 (92.3%) | 80 (7.7%) |
| $50,000 to $74,999 | 1,293 (97.4%) | 35 (2.6%) |
| $75,000 to $99,999 | 2,870 (97.0%) | 90 (3.0%) |
| $100,000 and over | 18,112 (98.5%) | 271 (1.5%) |
Public vs Private Health Insurance Coverage by Age in Arnold
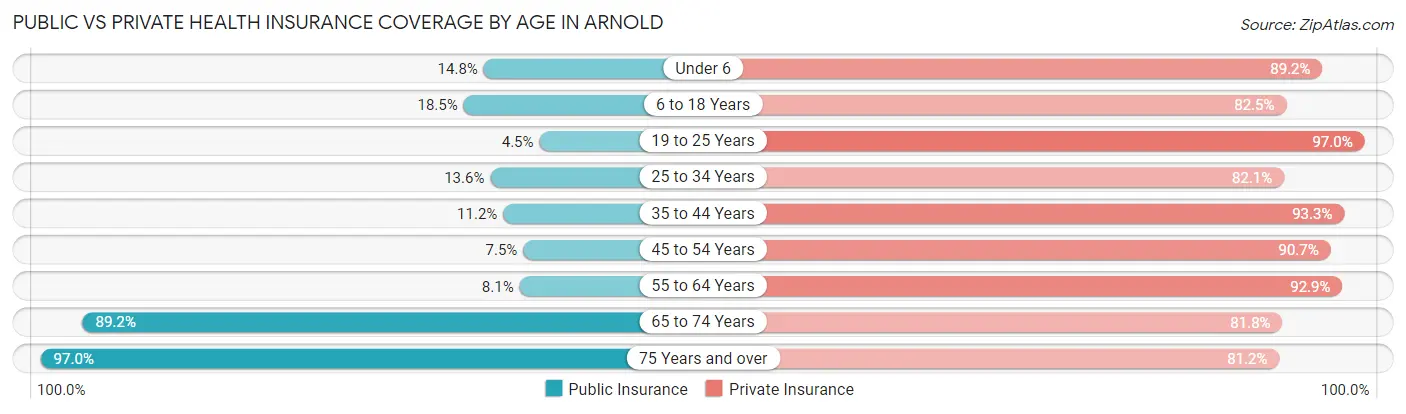
| Age Bracket | Public Insurance | Private Insurance |
| Under 6 | 253 (14.8%) | 1,526 (89.2%) |
| 6 to 18 Years | 974 (18.5%) | 4,338 (82.5%) |
| 19 to 25 Years | 70 (4.4%) | 1,527 (97.0%) |
| 25 to 34 Years | 300 (13.6%) | 1,815 (82.1%) |
| 35 to 44 Years | 402 (11.2%) | 3,357 (93.2%) |
| 45 to 54 Years | 236 (7.4%) | 2,872 (90.7%) |
| 55 to 64 Years | 260 (8.1%) | 2,969 (92.9%) |
| 65 to 74 Years | 1,939 (89.2%) | 1,777 (81.8%) |
| 75 Years and over | 1,492 (97.0%) | 1,249 (81.2%) |
| Total | 5,926 (24.3%) | 21,430 (87.7%) |
Disability Status by Sex by Age in Arnold
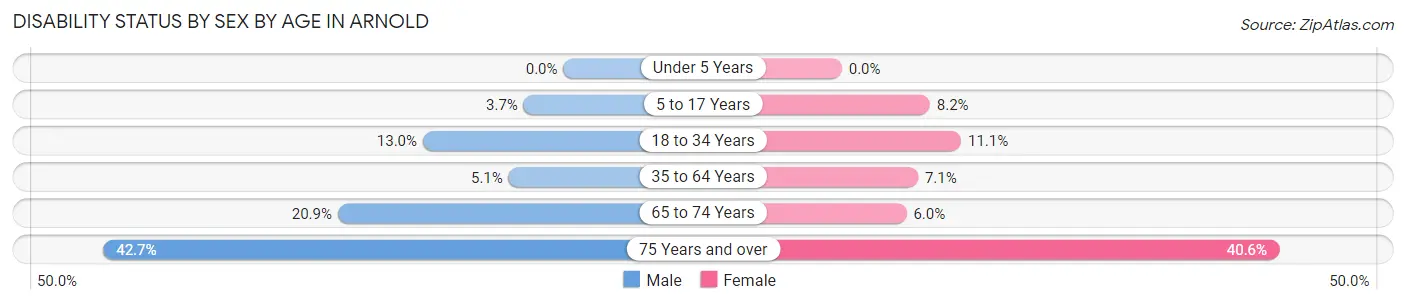
| Age Bracket | Male | Female |
| Under 5 Years | 0 (0.0%) | 0 (0.0%) |
| 5 to 17 Years | 94 (3.7%) | 212 (8.2%) |
| 18 to 34 Years | 270 (13.0%) | 238 (11.1%) |
| 35 to 64 Years | 242 (5.1%) | 367 (7.1%) |
| 65 to 74 Years | 235 (20.9%) | 63 (6.0%) |
| 75 Years and over | 324 (42.7%) | 316 (40.6%) |
Disability Class by Sex by Age in Arnold
Disability Class: Hearing Difficulty
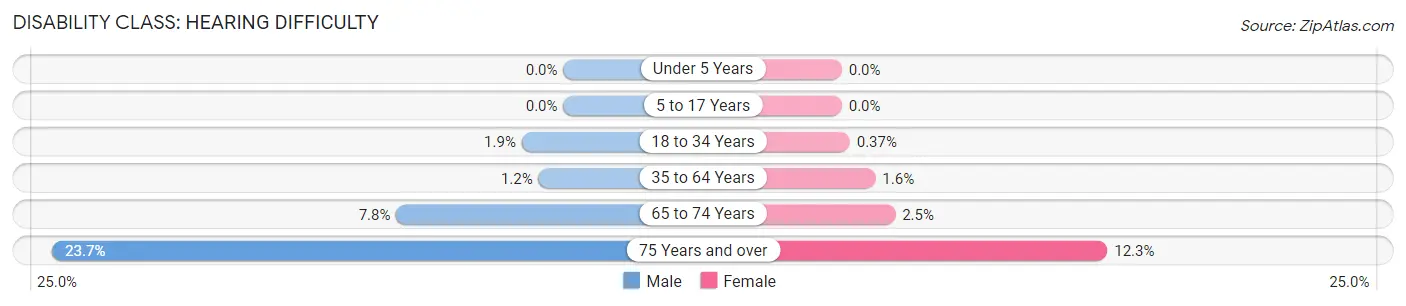
| Age Bracket | Male | Female |
| Under 5 Years | 0 (0.0%) | 0 (0.0%) |
| 5 to 17 Years | 0 (0.0%) | 0 (0.0%) |
| 18 to 34 Years | 40 (1.9%) | 8 (0.4%) |
| 35 to 64 Years | 55 (1.1%) | 81 (1.6%) |
| 65 to 74 Years | 87 (7.7%) | 26 (2.5%) |
| 75 Years and over | 180 (23.7%) | 96 (12.3%) |
Disability Class: Vision Difficulty
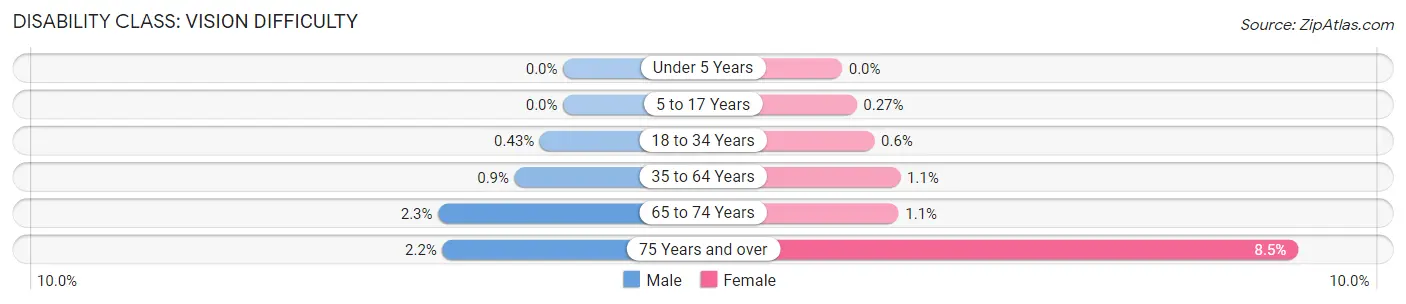
| Age Bracket | Male | Female |
| Under 5 Years | 0 (0.0%) | 0 (0.0%) |
| 5 to 17 Years | 0 (0.0%) | 7 (0.3%) |
| 18 to 34 Years | 9 (0.4%) | 13 (0.6%) |
| 35 to 64 Years | 43 (0.9%) | 56 (1.1%) |
| 65 to 74 Years | 26 (2.3%) | 11 (1.1%) |
| 75 Years and over | 17 (2.2%) | 66 (8.5%) |
Disability Class: Cognitive Difficulty
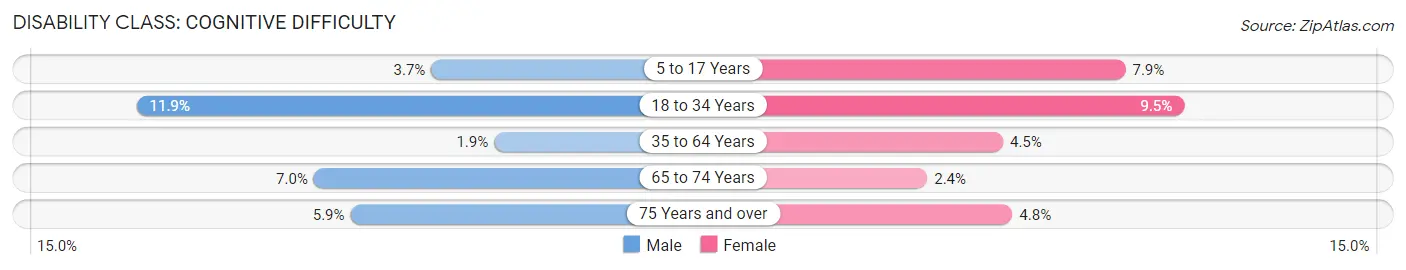
| Age Bracket | Male | Female |
| 5 to 17 Years | 94 (3.7%) | 205 (7.9%) |
| 18 to 34 Years | 246 (11.9%) | 205 (9.5%) |
| 35 to 64 Years | 92 (1.9%) | 233 (4.5%) |
| 65 to 74 Years | 78 (7.0%) | 25 (2.4%) |
| 75 Years and over | 45 (5.9%) | 37 (4.8%) |
Disability Class: Ambulatory Difficulty
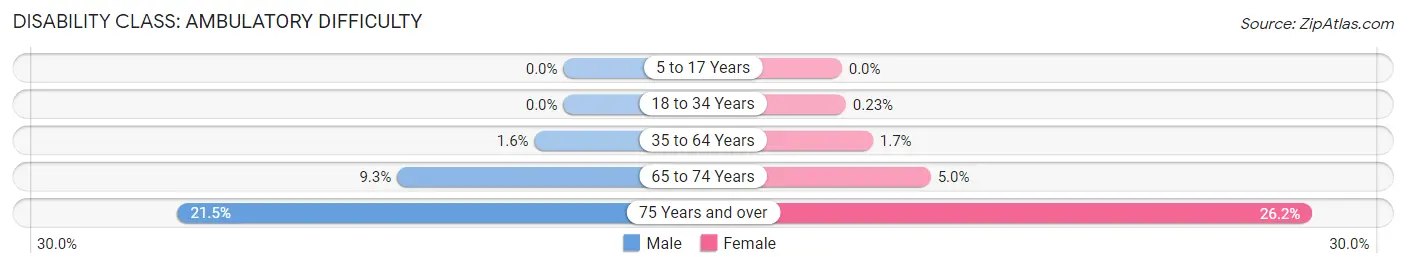
| Age Bracket | Male | Female |
| 5 to 17 Years | 0 (0.0%) | 0 (0.0%) |
| 18 to 34 Years | 0 (0.0%) | 5 (0.2%) |
| 35 to 64 Years | 77 (1.6%) | 90 (1.7%) |
| 65 to 74 Years | 104 (9.3%) | 52 (5.0%) |
| 75 Years and over | 163 (21.5%) | 204 (26.2%) |
Disability Class: Self-Care Difficulty
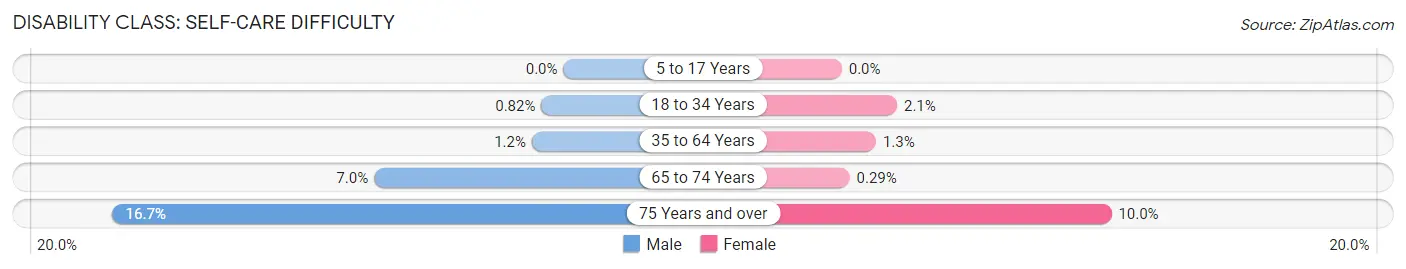
| Age Bracket | Male | Female |
| 5 to 17 Years | 0 (0.0%) | 0 (0.0%) |
| 18 to 34 Years | 17 (0.8%) | 44 (2.1%) |
| 35 to 64 Years | 56 (1.2%) | 66 (1.3%) |
| 65 to 74 Years | 79 (7.0%) | 3 (0.3%) |
| 75 Years and over | 127 (16.7%) | 78 (10.0%) |
Technology Access in Arnold
Computing Device Access in Arnold
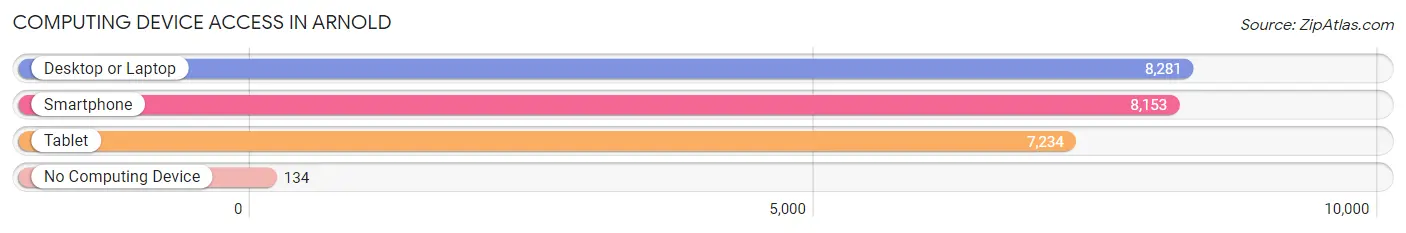
| Device Type | # Households | % Households |
| Desktop or Laptop | 8,281 | 95.5% |
| Smartphone | 8,153 | 94.1% |
| Tablet | 7,234 | 83.5% |
| No Computing Device | 134 | 1.5% |
| Total | 8,669 | 100.0% |
Internet Access in Arnold
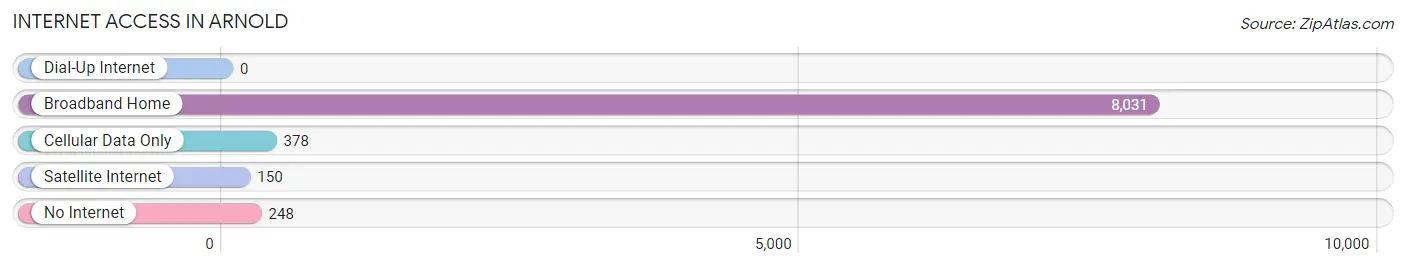
| Internet Type | # Households | % Households |
| Dial-Up Internet | 0 | 0.0% |
| Broadband Home | 8,031 | 92.6% |
| Cellular Data Only | 378 | 4.4% |
| Satellite Internet | 150 | 1.7% |
| No Internet | 248 | 2.9% |
| Total | 8,669 | 100.0% |
Arnold Summary
Arnold, Maryland is a small city located in Anne Arundel County, Maryland. It is situated on the banks of the Severn River, just south of Annapolis. The city has a population of 23,106, according to the 2019 U.S. Census. Arnold is a suburban community that is part of the Baltimore-Washington metropolitan area.
History
Arnold was founded in 1856 by William Arnold, a wealthy landowner and businessman. He purchased the land from the local Native Americans and named the area after himself. The city was incorporated in 1872 and has since grown to become a thriving community.
Arnold was a popular summer resort destination in the late 19th and early 20th centuries. It was known for its beautiful beaches and resorts. The city was also home to a number of amusement parks, including the Severn Park, which opened in 1895.
Geography
Arnold is located in Anne Arundel County, Maryland. It is situated on the banks of the Severn River, just south of Annapolis. The city has a total area of 8.3 square miles, of which 8.2 square miles is land and 0.1 square miles is water.
The city is bordered by Severna Park to the north, Millersville to the east, and Annapolis to the south. The city is also close to the Chesapeake Bay and the Baltimore-Washington metropolitan area.
Economy
Arnold is a suburban community with a strong economy. The city is home to a number of businesses, including retail stores, restaurants, and professional services. The city is also home to a number of government offices, including the Anne Arundel County Courthouse and the Maryland State Police Barracks.
The city is also home to a number of educational institutions, including Anne Arundel Community College and the University of Maryland, Baltimore County.
Demographics
According to the 2019 U.S. Census, Arnold has a population of 23,106. The city has a median household income of $90,845 and a median age of 42. The city is predominantly white (83.3%), followed by African American (7.7%), Asian (4.2%), and Hispanic or Latino (2.7%).
Arnold is a diverse community with a variety of cultures and backgrounds. The city is home to a number of churches, including the Arnold United Methodist Church, the Arnold Presbyterian Church, and the Arnold Baptist Church.
Conclusion
Arnold, Maryland is a small city located in Anne Arundel County, Maryland. It is situated on the banks of the Severn River, just south of Annapolis. The city has a population of 23,106, according to the 2019 U.S. Census. Arnold is a suburban community that is part of the Baltimore-Washington metropolitan area. The city has a strong economy and is home to a number of businesses, educational institutions, and government offices. Arnold is a diverse community with a variety of cultures and backgrounds.
Common Questions
What is Per Capita Income in Arnold?
Per Capita income in Arnold is $59,231.
What is the Median Family Income in Arnold?
Median Family Income in Arnold is $149,865.
What is the Median Household income in Arnold?
Median Household Income in Arnold is $137,075.
What is Income or Wage Gap in Arnold?
Income or Wage Gap in Arnold is 29.0%.
Women in Arnold earn 71.0 cents for every dollar earned by a man.
What is Family Income Deficit in Arnold?
Family Income Deficit in Arnold is $13,845.
Families that are below poverty line in Arnold earn $13,845 less on average than the poverty threshold level.
What is Inequality or Gini Index in Arnold?
Inequality or Gini Index in Arnold is 0.38.
What is the Total Population of Arnold?
Total Population of Arnold is 24,825.
What is the Total Male Population of Arnold?
Total Male Population of Arnold is 12,149.
What is the Total Female Population of Arnold?
Total Female Population of Arnold is 12,676.
What is the Ratio of Males per 100 Females in Arnold?
There are 95.84 Males per 100 Females in Arnold.
What is the Ratio of Females per 100 Males in Arnold?
There are 104.34 Females per 100 Males in Arnold.
What is the Median Population Age in Arnold?
Median Population Age in Arnold is 38.0 Years.
What is the Average Family Size in Arnold
Average Family Size in Arnold is 3.2 People.
What is the Average Household Size in Arnold
Average Household Size in Arnold is 2.8 People.
How Large is the Labor Force in Arnold?
There are 13,363 People in the Labor Forcein in Arnold.
What is the Percentage of People in the Labor Force in Arnold?
70.1% of People are in the Labor Force in Arnold.
What is the Unemployment Rate in Arnold?
Unemployment Rate in Arnold is 3.4%.