White Marsh, MD Map & Demographics
White Marsh Map
White Marsh Overview
$46,661
PER CAPITA INCOME
$133,010
AVG FAMILY INCOME
$109,435
AVG HOUSEHOLD INCOME
11.5%
WAGE / INCOME GAP [ % ]
88.5¢/ $1
WAGE / INCOME GAP [ $ ]
0.38
INEQUALITY / GINI INDEX
10,337
TOTAL POPULATION
5,062
MALE POPULATION
5,275
FEMALE POPULATION
95.96
MALES / 100 FEMALES
104.21
FEMALES / 100 MALES
39.8
MEDIAN AGE
3.2
AVG FAMILY SIZE
2.7
AVG HOUSEHOLD SIZE
5,631
LABOR FORCE [ PEOPLE ]
69.3%
PERCENT IN LABOR FORCE
2.2%
UNEMPLOYMENT RATE
White Marsh Zip Codes
Income in White Marsh
Income Overview in White Marsh
Per Capita Income in White Marsh is $46,661, while median incomes of families and households are $133,010 and $109,435 respectively.
| Characteristic | Number | Measure |
| Per Capita Income | 10,337 | $46,661 |
| Median Family Income | 2,770 | $133,010 |
| Mean Family Income | 2,770 | $139,780 |
| Median Household Income | 3,801 | $109,435 |
| Mean Household Income | 3,801 | $124,601 |
| Income Deficit | 2,770 | $0 |
| Wage / Income Gap (%) | 10,337 | 11.49% |
| Wage / Income Gap ($) | 10,337 | 88.51¢ per $1 |
| Gini / Inequality Index | 10,337 | 0.38 |
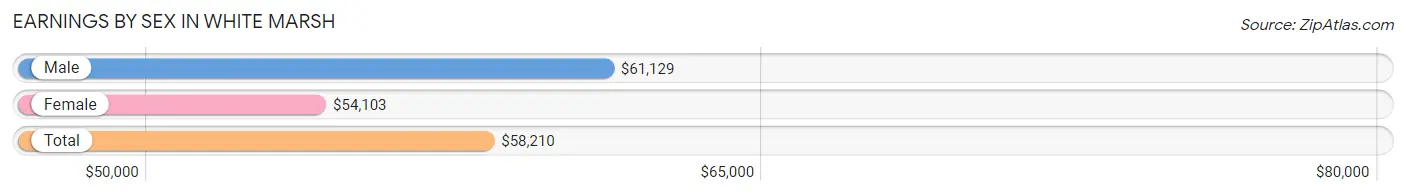
Earnings by Sex in White Marsh
Average Earnings in White Marsh are $58,210, $61,129 for men and $54,103 for women, a difference of 11.5%.
| Sex | Number | Average Earnings |
| Male | 2,934 (50.6%) | $61,129 |
| Female | 2,866 (49.4%) | $54,103 |
| Total | 5,800 (100.0%) | $58,210 |
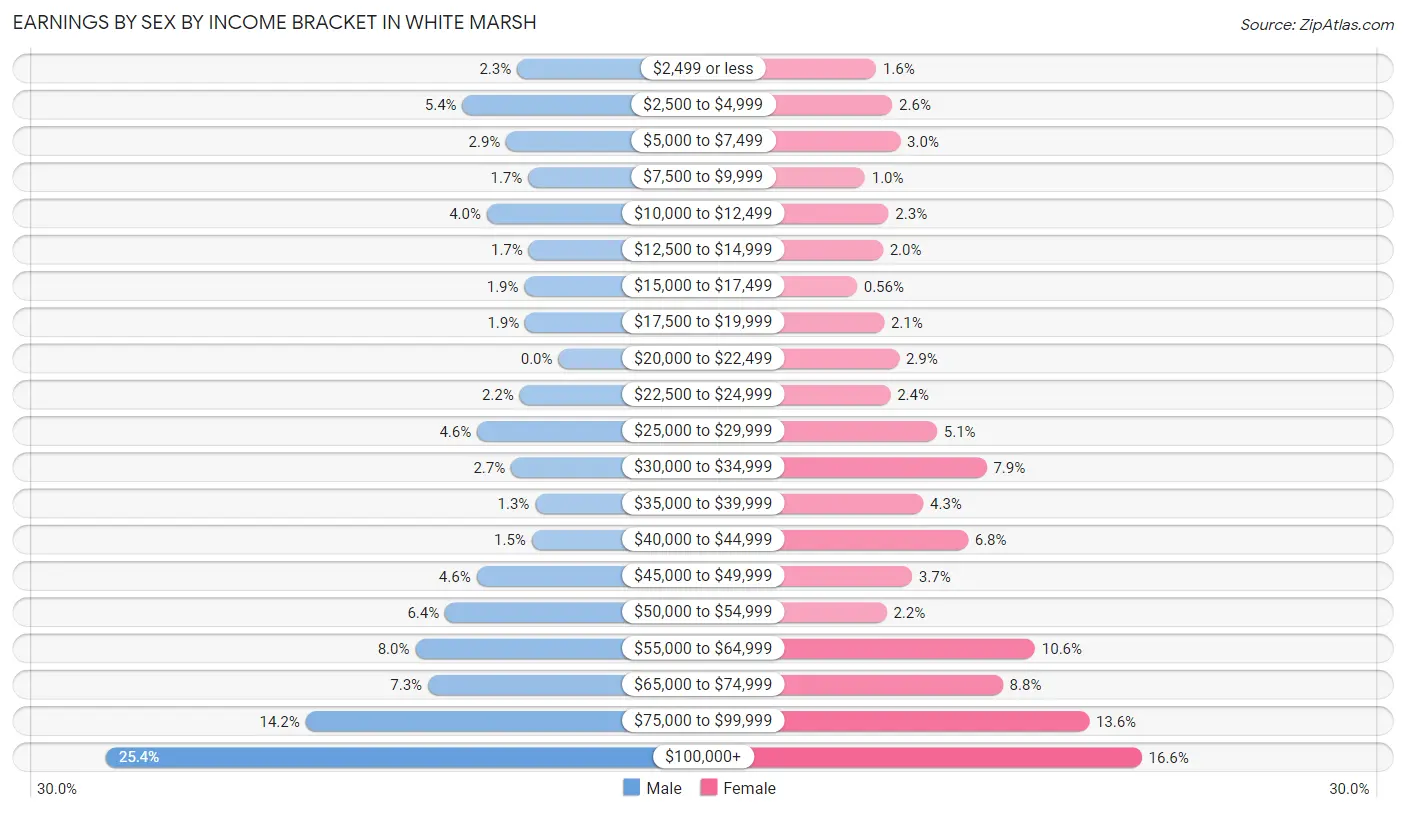
Earnings by Sex by Income Bracket in White Marsh
The most common earnings brackets in White Marsh are $100,000+ for men (746 | 25.4%) and $100,000+ for women (475 | 16.6%).
| Income | Male | Female |
| $2,499 or less | 68 (2.3%) | 47 (1.6%) |
| $2,500 to $4,999 | 158 (5.4%) | 73 (2.5%) |
| $5,000 to $7,499 | 86 (2.9%) | 86 (3.0%) |
| $7,500 to $9,999 | 50 (1.7%) | 29 (1.0%) |
| $10,000 to $12,499 | 118 (4.0%) | 67 (2.3%) |
| $12,500 to $14,999 | 49 (1.7%) | 58 (2.0%) |
| $15,000 to $17,499 | 56 (1.9%) | 16 (0.6%) |
| $17,500 to $19,999 | 55 (1.9%) | 60 (2.1%) |
| $20,000 to $22,499 | 0 (0.0%) | 84 (2.9%) |
| $22,500 to $24,999 | 64 (2.2%) | 70 (2.4%) |
| $25,000 to $29,999 | 134 (4.6%) | 145 (5.1%) |
| $30,000 to $34,999 | 78 (2.7%) | 225 (7.9%) |
| $35,000 to $39,999 | 38 (1.3%) | 123 (4.3%) |
| $40,000 to $44,999 | 44 (1.5%) | 195 (6.8%) |
| $45,000 to $49,999 | 135 (4.6%) | 105 (3.7%) |
| $50,000 to $54,999 | 187 (6.4%) | 64 (2.2%) |
| $55,000 to $64,999 | 236 (8.0%) | 303 (10.6%) |
| $65,000 to $74,999 | 215 (7.3%) | 251 (8.8%) |
| $75,000 to $99,999 | 417 (14.2%) | 390 (13.6%) |
| $100,000+ | 746 (25.4%) | 475 (16.6%) |
| Total | 2,934 (100.0%) | 2,866 (100.0%) |
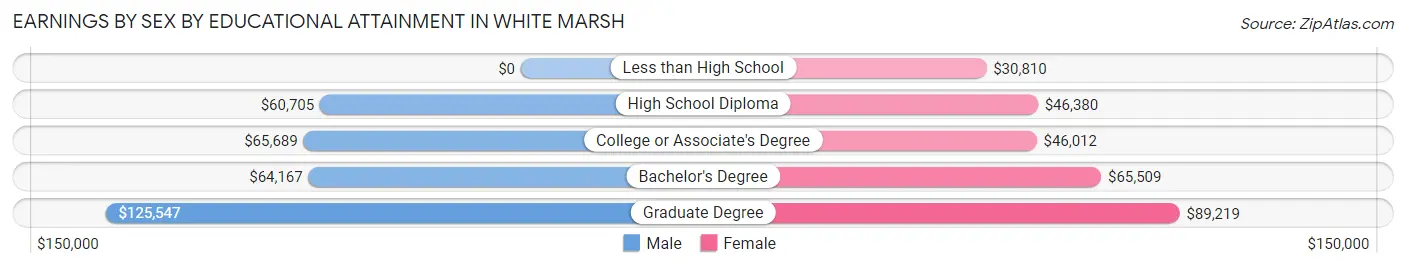
Earnings by Sex by Educational Attainment in White Marsh
Average earnings in White Marsh are $66,379 for men and $59,286 for women, a difference of 10.7%. Men with an educational attainment of graduate degree enjoy the highest average annual earnings of $125,547, while those with high school diploma education earn the least with $60,705. Women with an educational attainment of graduate degree earn the most with the average annual earnings of $89,219, while those with less than high school education have the smallest earnings of $30,810.
| Educational Attainment | Male Income | Female Income |
| Less than High School | - | - |
| High School Diploma | $60,705 | $46,380 |
| College or Associate's Degree | $65,689 | $46,012 |
| Bachelor's Degree | $64,167 | $65,509 |
| Graduate Degree | $125,547 | $89,219 |
| Total | $66,379 | $59,286 |
Family Income in White Marsh
Family Income Brackets in White Marsh
According to the White Marsh family income data, there are 745 families falling into the $100,000 to $149,999 income range, which is the most common income bracket and makes up 26.9% of all families. Conversely, the $10,000 to $14,999 income bracket is the least frequent group with only 22 families (0.8%) belonging to this category.
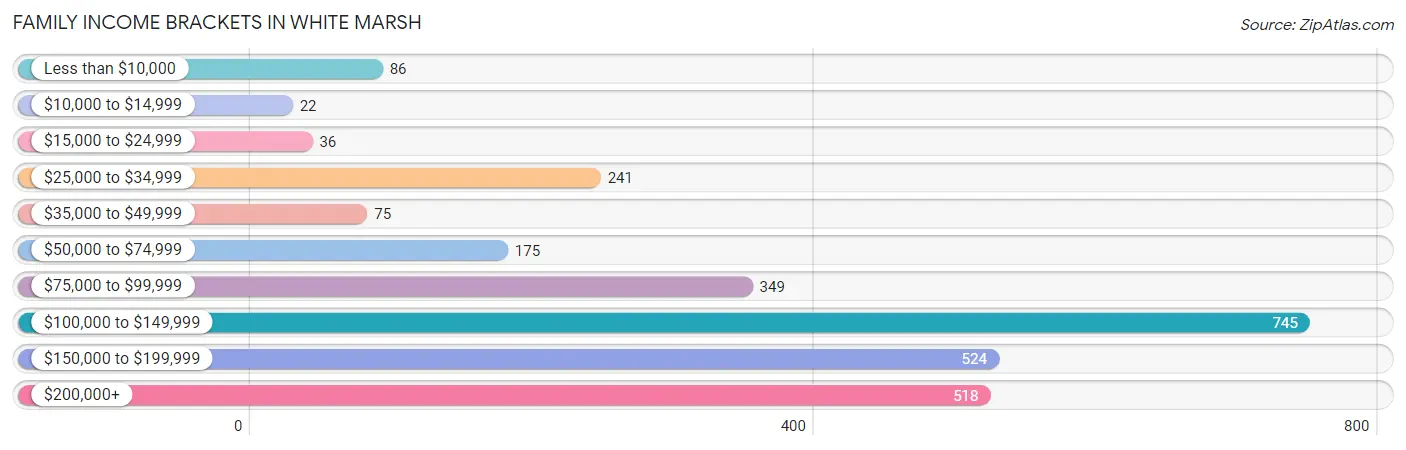
| Income Bracket | # Families | % Families |
| Less than $10,000 | 86 | 3.1% |
| $10,000 to $14,999 | 22 | 0.8% |
| $15,000 to $24,999 | 36 | 1.3% |
| $25,000 to $34,999 | 241 | 8.7% |
| $35,000 to $49,999 | 75 | 2.7% |
| $50,000 to $74,999 | 175 | 6.3% |
| $75,000 to $99,999 | 349 | 12.6% |
| $100,000 to $149,999 | 745 | 26.9% |
| $150,000 to $199,999 | 524 | 18.9% |
| $200,000+ | 518 | 18.7% |
Family Income by Famaliy Size in White Marsh
4-person families (484 | 17.5%) account for the highest median family income in White Marsh with $177,778 per family, while 2-person families (1,178 | 42.5%) have the highest median income of $52,366 per family member.
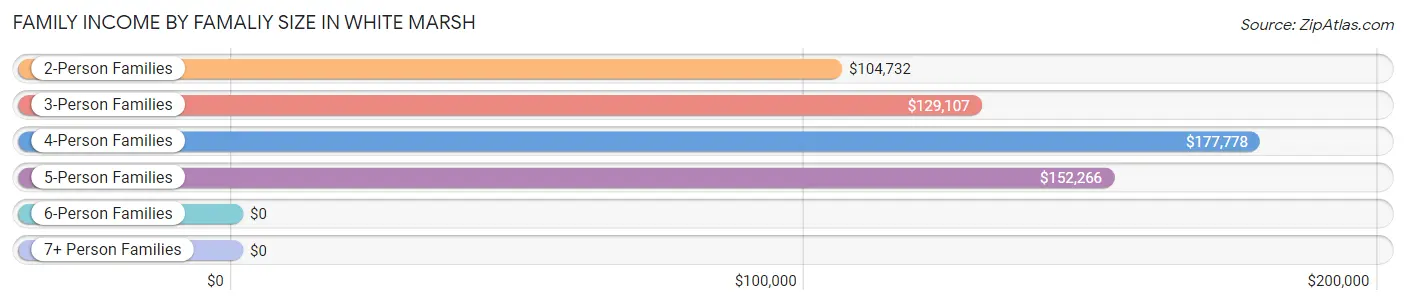
| Income Bracket | # Families | Median Income |
| 2-Person Families | 1,178 (42.5%) | $104,732 |
| 3-Person Families | 732 (26.4%) | $129,107 |
| 4-Person Families | 484 (17.5%) | $177,778 |
| 5-Person Families | 276 (10.0%) | $152,266 |
| 6-Person Families | 20 (0.7%) | $0 |
| 7+ Person Families | 80 (2.9%) | $0 |
| Total | 2,770 (100.0%) | $133,010 |
Family Income by Number of Earners in White Marsh
The median family income in White Marsh is $133,010, with families comprising 3+ earners (408) having the highest median family income of $152,344, while families with no earners (301) have the lowest median family income of $50,903, accounting for 14.7% and 10.9% of families, respectively.
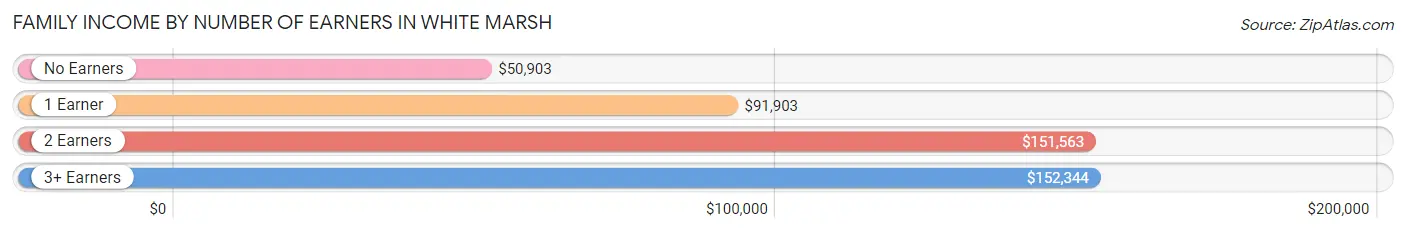
| Number of Earners | # Families | Median Income |
| No Earners | 301 (10.9%) | $50,903 |
| 1 Earner | 827 (29.9%) | $91,903 |
| 2 Earners | 1,234 (44.6%) | $151,563 |
| 3+ Earners | 408 (14.7%) | $152,344 |
| Total | 2,770 (100.0%) | $133,010 |
Household Income in White Marsh
Household Income Brackets in White Marsh
With 905 households falling in the category, the $100,000 to $149,999 income range is the most frequent in White Marsh, accounting for 23.8% of all households. In contrast, only 84 households (2.2%) fall into the $15,000 to $24,999 income bracket, making it the least populous group.
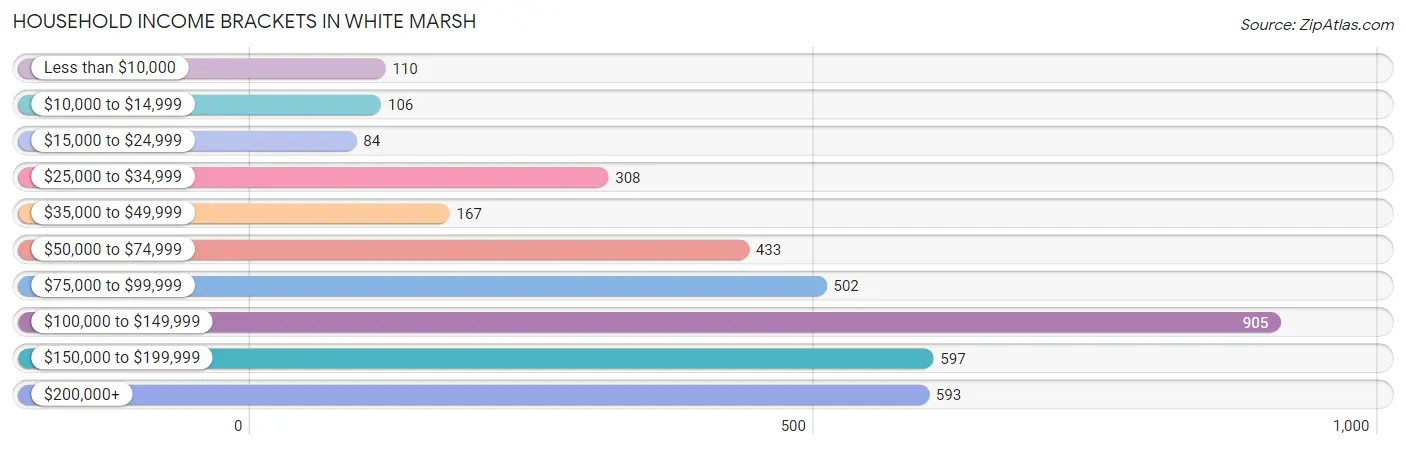
| Income Bracket | # Households | % Households |
| Less than $10,000 | 110 | 2.9% |
| $10,000 to $14,999 | 106 | 2.8% |
| $15,000 to $24,999 | 84 | 2.2% |
| $25,000 to $34,999 | 308 | 8.1% |
| $35,000 to $49,999 | 167 | 4.4% |
| $50,000 to $74,999 | 433 | 11.4% |
| $75,000 to $99,999 | 502 | 13.2% |
| $100,000 to $149,999 | 905 | 23.8% |
| $150,000 to $199,999 | 597 | 15.7% |
| $200,000+ | 593 | 15.6% |
Household Income by Householder Age in White Marsh
The median household income in White Marsh is $109,435, with the highest median household income of $128,158 found in the 45 to 64 years age bracket for the primary householder. A total of 1,474 households (38.8%) fall into this category. Meanwhile, the 65+ years age bracket for the primary householder has the lowest median household income of $78,235, with 1,014 households (26.7%) in this group.
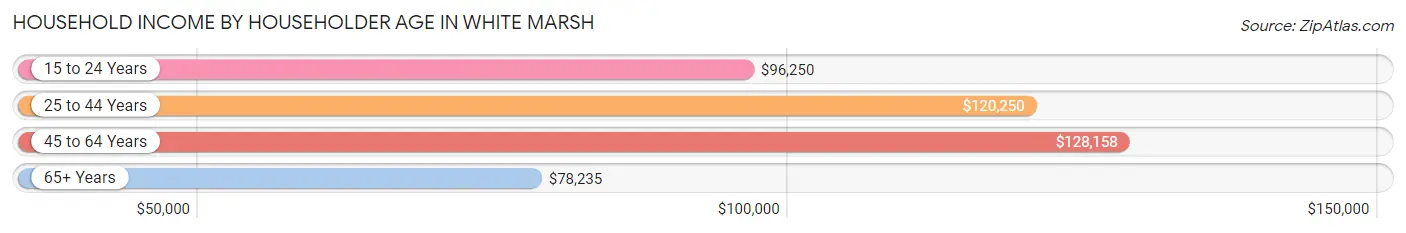
| Income Bracket | # Households | Median Income |
| 15 to 24 Years | 111 (2.9%) | $96,250 |
| 25 to 44 Years | 1,202 (31.6%) | $120,250 |
| 45 to 64 Years | 1,474 (38.8%) | $128,158 |
| 65+ Years | 1,014 (26.7%) | $78,235 |
| Total | 3,801 (100.0%) | $109,435 |
Poverty in White Marsh
Income Below Poverty by Sex and Age in White Marsh
With 5.3% poverty level for males and 7.0% for females among the residents of White Marsh, 15 year old males and 16 and 17 year old females are the most vulnerable to poverty, with 69 males (56.1%) and 57 females (34.8%) in their respective age groups living below the poverty level.
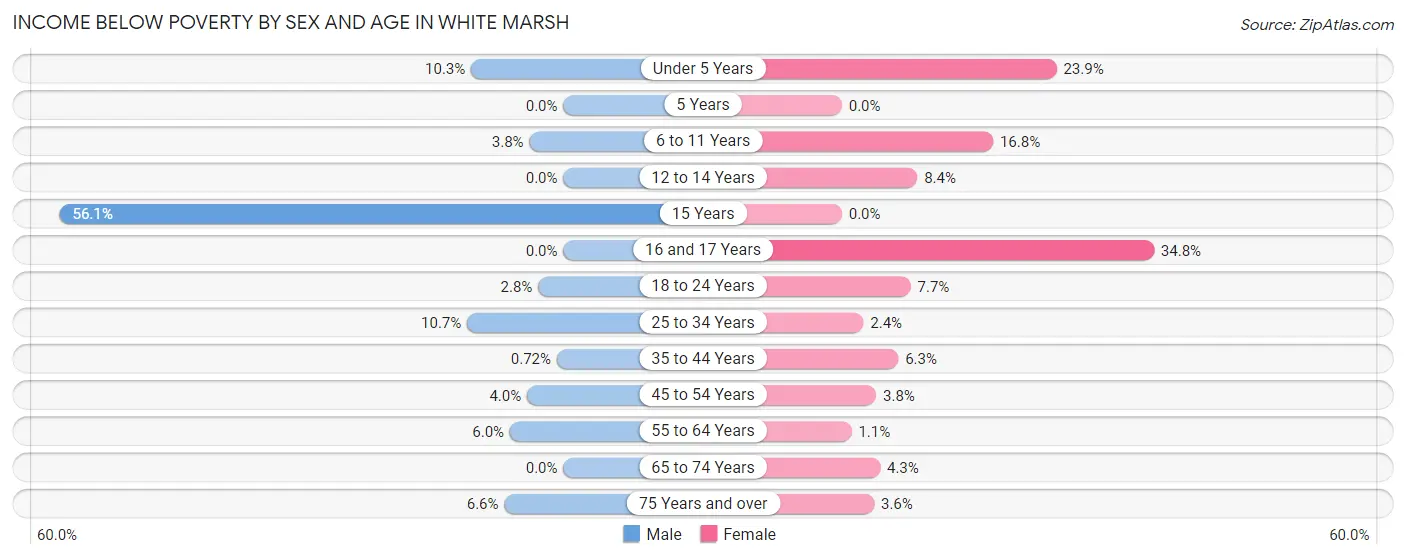
| Age Bracket | Male | Female |
| Under 5 Years | 15 (10.3%) | 44 (23.9%) |
| 5 Years | 0 (0.0%) | 0 (0.0%) |
| 6 to 11 Years | 20 (3.8%) | 81 (16.8%) |
| 12 to 14 Years | 0 (0.0%) | 21 (8.4%) |
| 15 Years | 69 (56.1%) | 0 (0.0%) |
| 16 and 17 Years | 0 (0.0%) | 57 (34.8%) |
| 18 to 24 Years | 9 (2.8%) | 32 (7.7%) |
| 25 to 34 Years | 70 (10.7%) | 12 (2.4%) |
| 35 to 44 Years | 6 (0.7%) | 55 (6.3%) |
| 45 to 54 Years | 23 (4.0%) | 20 (3.8%) |
| 55 to 64 Years | 36 (5.9%) | 8 (1.1%) |
| 65 to 74 Years | 0 (0.0%) | 24 (4.3%) |
| 75 Years and over | 19 (6.6%) | 14 (3.6%) |
| Total | 267 (5.3%) | 368 (7.0%) |
Income Above Poverty by Sex and Age in White Marsh
According to the poverty statistics in White Marsh, males aged 5 years and females aged 5 years are the age groups that are most secure financially, with 100.0% of males and 100.0% of females in these age groups living above the poverty line.
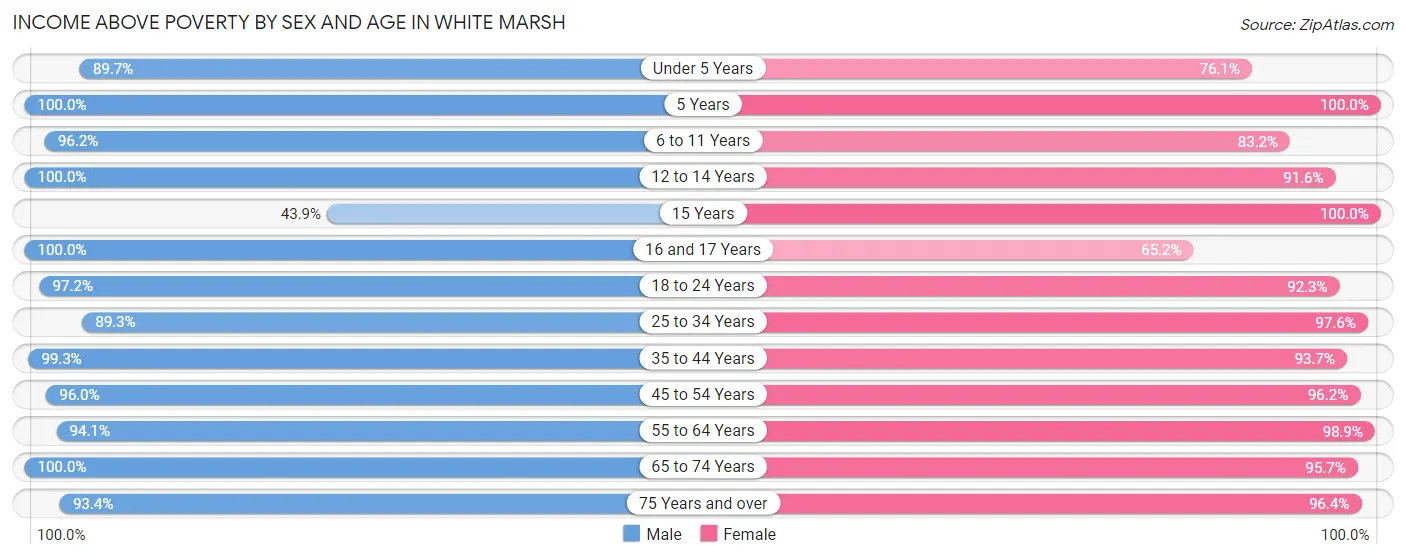
| Age Bracket | Male | Female |
| Under 5 Years | 131 (89.7%) | 140 (76.1%) |
| 5 Years | 49 (100.0%) | 61 (100.0%) |
| 6 to 11 Years | 509 (96.2%) | 400 (83.2%) |
| 12 to 14 Years | 260 (100.0%) | 229 (91.6%) |
| 15 Years | 54 (43.9%) | 120 (100.0%) |
| 16 and 17 Years | 184 (100.0%) | 107 (65.2%) |
| 18 to 24 Years | 312 (97.2%) | 386 (92.3%) |
| 25 to 34 Years | 583 (89.3%) | 489 (97.6%) |
| 35 to 44 Years | 826 (99.3%) | 821 (93.7%) |
| 45 to 54 Years | 546 (96.0%) | 503 (96.2%) |
| 55 to 64 Years | 569 (94.1%) | 736 (98.9%) |
| 65 to 74 Years | 494 (100.0%) | 539 (95.7%) |
| 75 Years and over | 270 (93.4%) | 376 (96.4%) |
| Total | 4,787 (94.7%) | 4,907 (93.0%) |
Income Below Poverty Among Married-Couple Families in White Marsh
The poverty statistics for married-couple families in White Marsh show that 2.3% or 46 of the total 2,038 families live below the poverty line. Families with no children have the highest poverty rate of 3.1%, comprising of 37 families. On the other hand, families with 3 or 4 children have the lowest poverty rate of 0.0%, which includes 0 families.
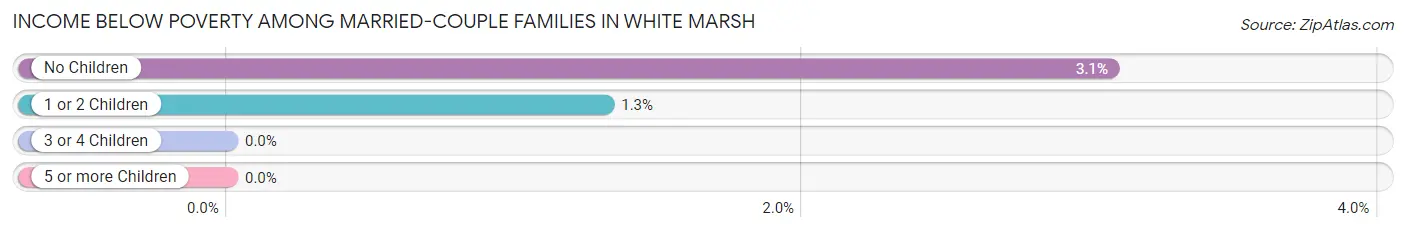
| Children | Above Poverty | Below Poverty |
| No Children | 1,168 (96.9%) | 37 (3.1%) |
| 1 or 2 Children | 678 (98.7%) | 9 (1.3%) |
| 3 or 4 Children | 66 (100.0%) | 0 (0.0%) |
| 5 or more Children | 80 (100.0%) | 0 (0.0%) |
| Total | 1,992 (97.7%) | 46 (2.3%) |
Income Below Poverty Among Single-Parent Households in White Marsh
According to the poverty data in White Marsh, 12.0% or 23 single-father households and 12.2% or 66 single-mother households are living below the poverty line. Among single-father households, those with 3 or 4 children have the highest poverty rate, with 23 households (100.0%) experiencing poverty. Likewise, among single-mother households, those with 3 or 4 children have the highest poverty rate, with 27 households (100.0%) falling below the poverty line.
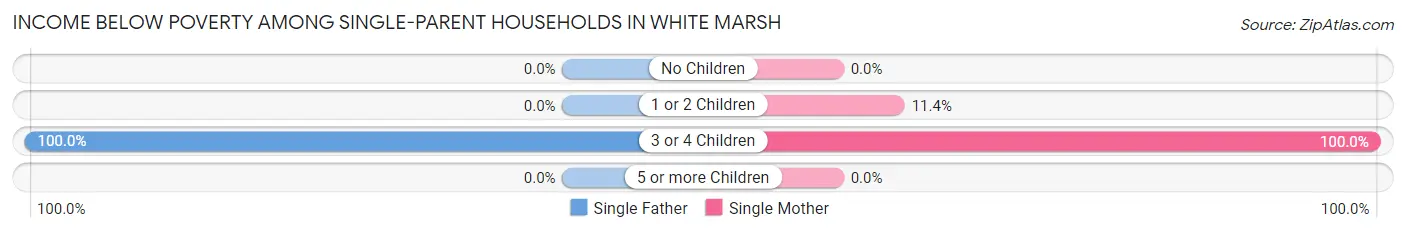
| Children | Single Father | Single Mother |
| No Children | 0 (0.0%) | 0 (0.0%) |
| 1 or 2 Children | 0 (0.0%) | 39 (11.4%) |
| 3 or 4 Children | 23 (100.0%) | 27 (100.0%) |
| 5 or more Children | 0 (0.0%) | 0 (0.0%) |
| Total | 23 (12.0%) | 66 (12.2%) |
Income Below Poverty Among Married-Couple vs Single-Parent Households in White Marsh
The poverty data for White Marsh shows that 46 of the married-couple family households (2.3%) and 89 of the single-parent households (12.2%) are living below the poverty level. Within the married-couple family households, those with no children have the highest poverty rate, with 37 households (3.1%) falling below the poverty line. Among the single-parent households, those with 3 or 4 children have the highest poverty rate, with 50 household (100.0%) living below poverty.
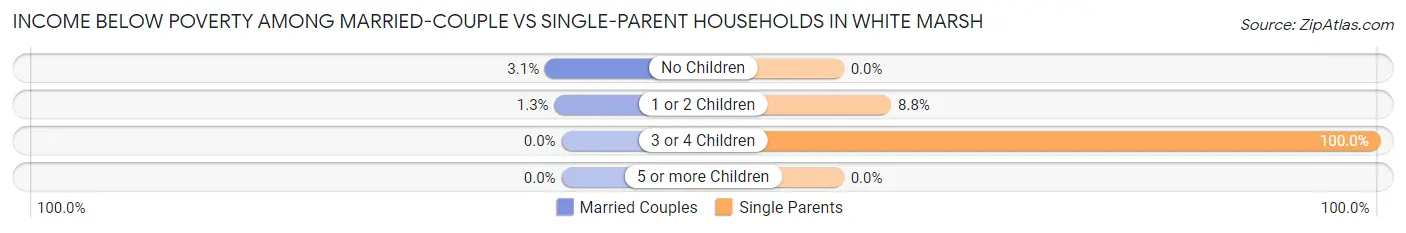
| Children | Married-Couple Families | Single-Parent Households |
| No Children | 37 (3.1%) | 0 (0.0%) |
| 1 or 2 Children | 9 (1.3%) | 39 (8.8%) |
| 3 or 4 Children | 0 (0.0%) | 50 (100.0%) |
| 5 or more Children | 0 (0.0%) | 0 (0.0%) |
| Total | 46 (2.3%) | 89 (12.2%) |
Race in White Marsh
The most populous races in White Marsh are White / Caucasian (6,301 | 61.0%), Black / African American (2,143 | 20.7%), and Asian (976 | 9.4%).
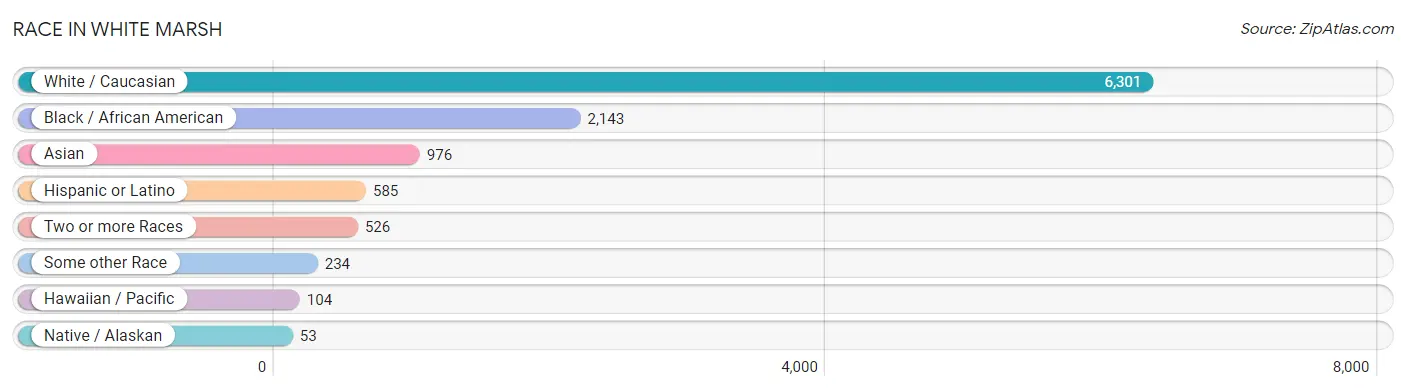
| Race | # Population | % Population |
| Asian | 976 | 9.4% |
| Black / African American | 2,143 | 20.7% |
| Hawaiian / Pacific | 104 | 1.0% |
| Hispanic or Latino | 585 | 5.7% |
| Native / Alaskan | 53 | 0.5% |
| White / Caucasian | 6,301 | 61.0% |
| Two or more Races | 526 | 5.1% |
| Some other Race | 234 | 2.3% |
| Total | 10,337 | 100.0% |
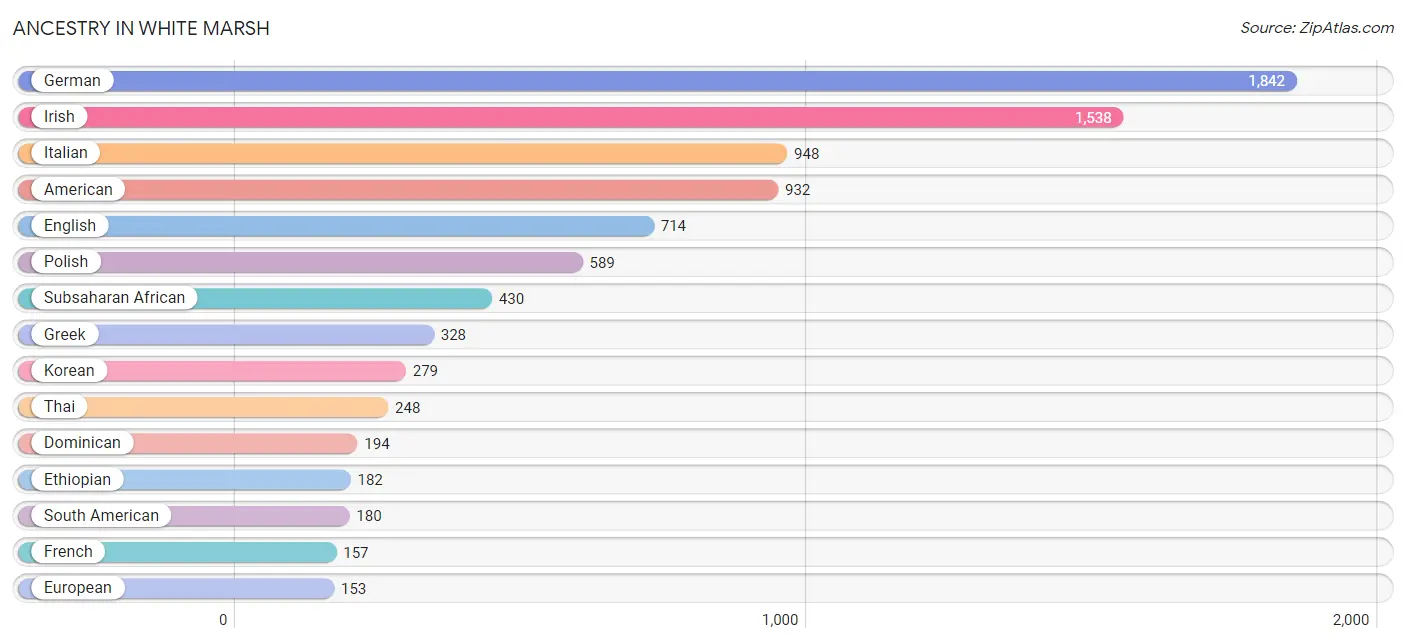
Ancestry in White Marsh
The most populous ancestries reported in White Marsh are German (1,842 | 17.8%), Irish (1,538 | 14.9%), Italian (948 | 9.2%), American (932 | 9.0%), and English (714 | 6.9%), together accounting for 57.8% of all White Marsh residents.
| Ancestry | # Population | % Population |
| African | 77 | 0.7% |
| Albanian | 6 | 0.1% |
| American | 932 | 9.0% |
| Arab | 118 | 1.1% |
| Austrian | 32 | 0.3% |
| Bhutanese | 2 | 0.0% |
| Brazilian | 6 | 0.1% |
| British | 45 | 0.4% |
| Bulgarian | 9 | 0.1% |
| Burmese | 84 | 0.8% |
| Canadian | 3 | 0.0% |
| Central American | 61 | 0.6% |
| Cherokee | 126 | 1.2% |
| Colombian | 151 | 1.5% |
| Cuban | 18 | 0.2% |
| Czech | 15 | 0.2% |
| Czechoslovakian | 6 | 0.1% |
| Danish | 7 | 0.1% |
| Dominican | 194 | 1.9% |
| Dutch | 56 | 0.5% |
| Eastern European | 38 | 0.4% |
| Egyptian | 13 | 0.1% |
| English | 714 | 6.9% |
| Ethiopian | 182 | 1.8% |
| European | 153 | 1.5% |
| Finnish | 5 | 0.1% |
| French | 157 | 1.5% |
| German | 1,842 | 17.8% |
| Ghanaian | 105 | 1.0% |
| Greek | 328 | 3.2% |
| Hungarian | 7 | 0.1% |
| Indian (Asian) | 62 | 0.6% |
| Irish | 1,538 | 14.9% |
| Italian | 948 | 9.2% |
| Jamaican | 68 | 0.7% |
| Kenyan | 38 | 0.4% |
| Korean | 279 | 2.7% |
| Lebanese | 45 | 0.4% |
| Lithuanian | 25 | 0.2% |
| Mexican | 120 | 1.2% |
| Native Hawaiian | 106 | 1.0% |
| Nigerian | 28 | 0.3% |
| Norwegian | 55 | 0.5% |
| Palestinian | 29 | 0.3% |
| Panamanian | 37 | 0.4% |
| Peruvian | 29 | 0.3% |
| Polish | 589 | 5.7% |
| Portuguese | 6 | 0.1% |
| Puerto Rican | 12 | 0.1% |
| Russian | 80 | 0.8% |
| Salvadoran | 24 | 0.2% |
| Scandinavian | 67 | 0.6% |
| Scotch-Irish | 31 | 0.3% |
| Scottish | 54 | 0.5% |
| Sioux | 17 | 0.2% |
| South American | 180 | 1.7% |
| Sri Lankan | 92 | 0.9% |
| Subsaharan African | 430 | 4.2% |
| Swedish | 17 | 0.2% |
| Swiss | 17 | 0.2% |
| Thai | 248 | 2.4% |
| Turkish | 18 | 0.2% |
| Ukrainian | 67 | 0.6% |
| Welsh | 142 | 1.4% |
| West Indian | 93 | 0.9% | View All 65 Rows |
Immigrants in White Marsh
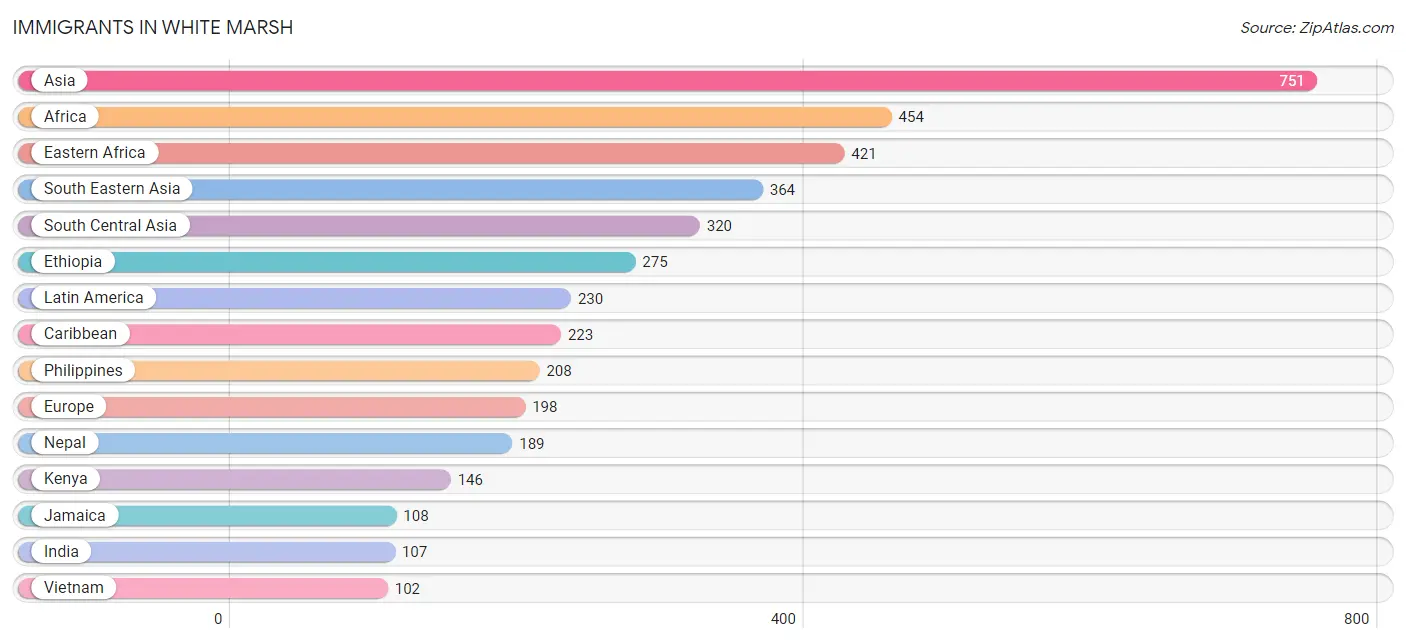
The most numerous immigrant groups reported in White Marsh came from Asia (751 | 7.3%), Africa (454 | 4.4%), Eastern Africa (421 | 4.1%), South Eastern Asia (364 | 3.5%), and South Central Asia (320 | 3.1%), together accounting for 22.4% of all White Marsh residents.
| Immigration Origin | # Population | % Population |
| Africa | 454 | 4.4% |
| Asia | 751 | 7.3% |
| Bulgaria | 9 | 0.1% |
| Canada | 3 | 0.0% |
| Caribbean | 223 | 2.2% |
| Chile | 7 | 0.1% |
| China | 25 | 0.2% |
| Dominican Republic | 82 | 0.8% |
| Eastern Africa | 421 | 4.1% |
| Eastern Asia | 49 | 0.5% |
| Eastern Europe | 60 | 0.6% |
| Ethiopia | 275 | 2.7% |
| Europe | 198 | 1.9% |
| Germany | 10 | 0.1% |
| Ghana | 23 | 0.2% |
| Greece | 87 | 0.8% |
| India | 107 | 1.0% |
| Italy | 13 | 0.1% |
| Jamaica | 108 | 1.0% |
| Kenya | 146 | 1.4% |
| Korea | 24 | 0.2% |
| Latin America | 230 | 2.2% |
| Nepal | 189 | 1.8% |
| Nigeria | 10 | 0.1% |
| Northern Europe | 28 | 0.3% |
| Pakistan | 24 | 0.2% |
| Philippines | 208 | 2.0% |
| Poland | 3 | 0.0% |
| Russia | 34 | 0.3% |
| Scotland | 28 | 0.3% |
| Singapore | 18 | 0.2% |
| South America | 7 | 0.1% |
| South Central Asia | 320 | 3.1% |
| South Eastern Asia | 364 | 3.5% |
| Southern Europe | 100 | 1.0% |
| Thailand | 36 | 0.4% |
| Turkey | 4 | 0.0% |
| Ukraine | 14 | 0.1% |
| Vietnam | 102 | 1.0% |
| West Indies | 33 | 0.3% |
| Western Africa | 33 | 0.3% |
| Western Asia | 4 | 0.0% |
| Western Europe | 10 | 0.1% | View All 43 Rows |
Sex and Age in White Marsh
Sex and Age in White Marsh
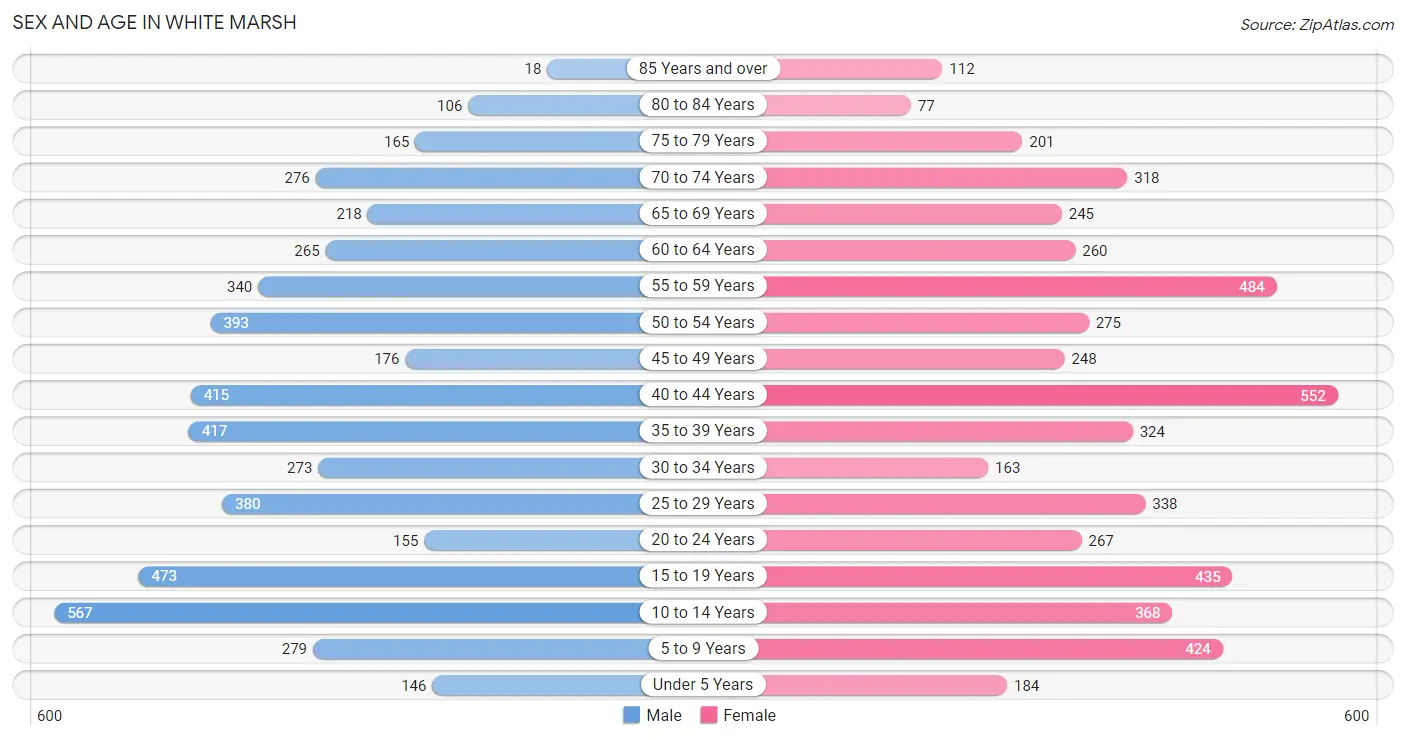
The most populous age groups in White Marsh are 10 to 14 Years (567 | 11.2%) for men and 40 to 44 Years (552 | 10.5%) for women.
| Age Bracket | Male | Female |
| Under 5 Years | 146 (2.9%) | 184 (3.5%) |
| 5 to 9 Years | 279 (5.5%) | 424 (8.0%) |
| 10 to 14 Years | 567 (11.2%) | 368 (7.0%) |
| 15 to 19 Years | 473 (9.3%) | 435 (8.3%) |
| 20 to 24 Years | 155 (3.1%) | 267 (5.1%) |
| 25 to 29 Years | 380 (7.5%) | 338 (6.4%) |
| 30 to 34 Years | 273 (5.4%) | 163 (3.1%) |
| 35 to 39 Years | 417 (8.2%) | 324 (6.1%) |
| 40 to 44 Years | 415 (8.2%) | 552 (10.5%) |
| 45 to 49 Years | 176 (3.5%) | 248 (4.7%) |
| 50 to 54 Years | 393 (7.8%) | 275 (5.2%) |
| 55 to 59 Years | 340 (6.7%) | 484 (9.2%) |
| 60 to 64 Years | 265 (5.2%) | 260 (4.9%) |
| 65 to 69 Years | 218 (4.3%) | 245 (4.6%) |
| 70 to 74 Years | 276 (5.4%) | 318 (6.0%) |
| 75 to 79 Years | 165 (3.3%) | 201 (3.8%) |
| 80 to 84 Years | 106 (2.1%) | 77 (1.5%) |
| 85 Years and over | 18 (0.4%) | 112 (2.1%) |
| Total | 5,062 (100.0%) | 5,275 (100.0%) |
Families and Households in White Marsh
Median Family Size in White Marsh
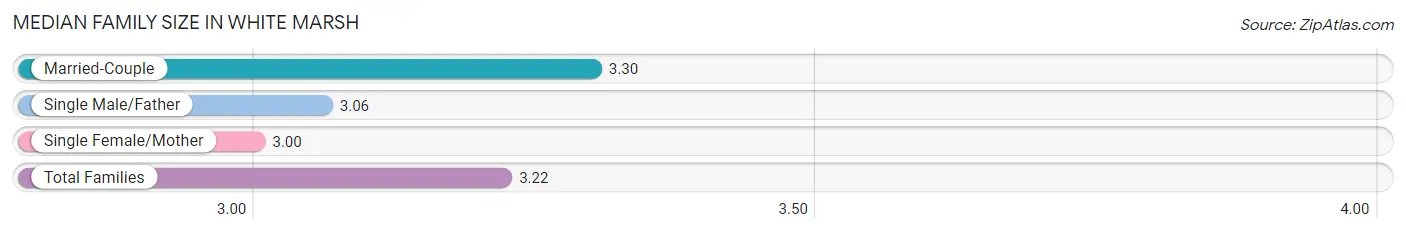
The median family size in White Marsh is 3.22 persons per family, with married-couple families (2,038 | 73.6%) accounting for the largest median family size of 3.3 persons per family. On the other hand, single female/mother families (541 | 19.5%) represent the smallest median family size with 3.00 persons per family.
| Family Type | # Families | Family Size |
| Married-Couple | 2,038 (73.6%) | 3.30 |
| Single Male/Father | 191 (6.9%) | 3.06 |
| Single Female/Mother | 541 (19.5%) | 3.00 |
| Total Families | 2,770 (100.0%) | 3.22 |
Median Household Size in White Marsh
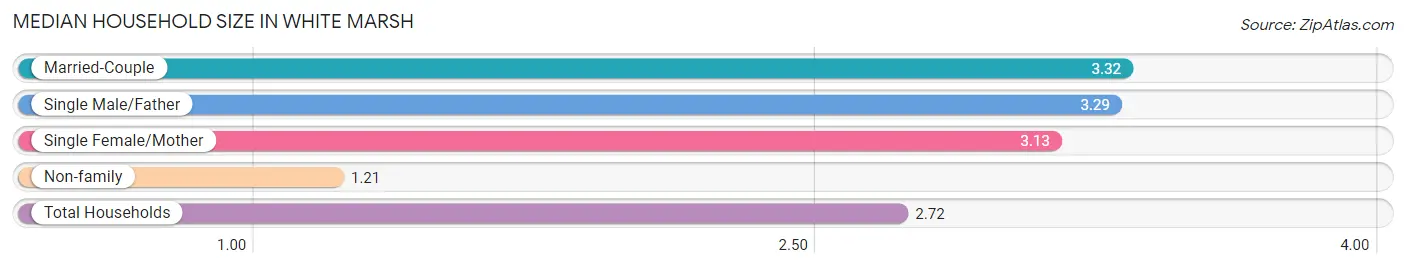
The median household size in White Marsh is 2.72 persons per household, with married-couple households (2,038 | 53.6%) accounting for the largest median household size of 3.32 persons per household. non-family households (1,031 | 27.1%) represent the smallest median household size with 1.21 persons per household.
| Household Type | # Households | Household Size |
| Married-Couple | 2,038 (53.6%) | 3.32 |
| Single Male/Father | 191 (5.0%) | 3.29 |
| Single Female/Mother | 541 (14.2%) | 3.13 |
| Non-family | 1,031 (27.1%) | 1.21 |
| Total Households | 3,801 (100.0%) | 2.72 |
Household Size by Marriage Status in White Marsh
Out of a total of 3,801 households in White Marsh, 2,770 (72.9%) are family households, while 1,031 (27.1%) are nonfamily households. The most numerous type of family households are 2-person households, comprising 1,048, and the most common type of nonfamily households are 1-person households, comprising 823.
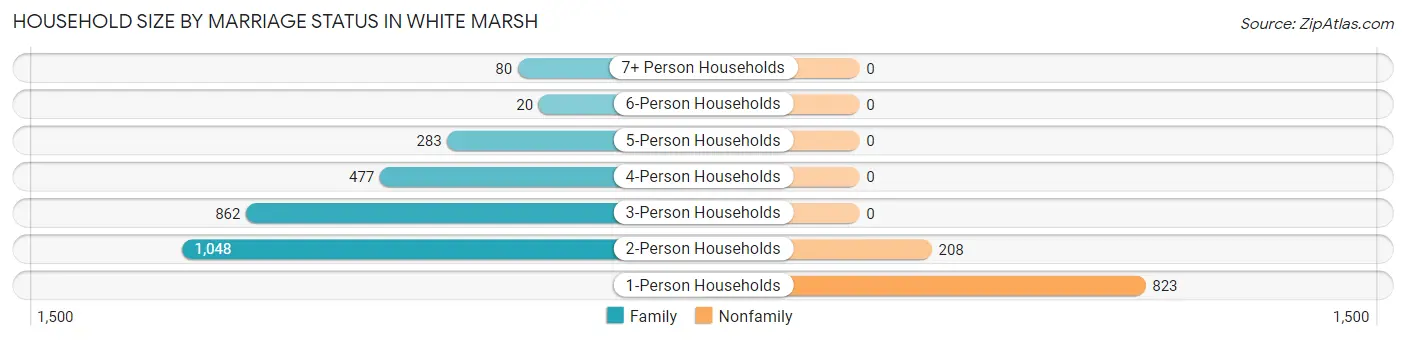
| Household Size | Family Households | Nonfamily Households |
| 1-Person Households | - | 823 (21.6%) |
| 2-Person Households | 1,048 (27.6%) | 208 (5.5%) |
| 3-Person Households | 862 (22.7%) | 0 (0.0%) |
| 4-Person Households | 477 (12.6%) | 0 (0.0%) |
| 5-Person Households | 283 (7.4%) | 0 (0.0%) |
| 6-Person Households | 20 (0.5%) | 0 (0.0%) |
| 7+ Person Households | 80 (2.1%) | 0 (0.0%) |
| Total | 2,770 (72.9%) | 1,031 (27.1%) |
Female Fertility in White Marsh
Fertility by Age in White Marsh
Average fertility rate in White Marsh is 40.0 births per 1,000 women. Women in the age bracket of 20 to 34 years have the highest fertility rate with 51.0 births per 1,000 women. Women in the age bracket of 35 to 50 years acount for 59.4% of all women with births.
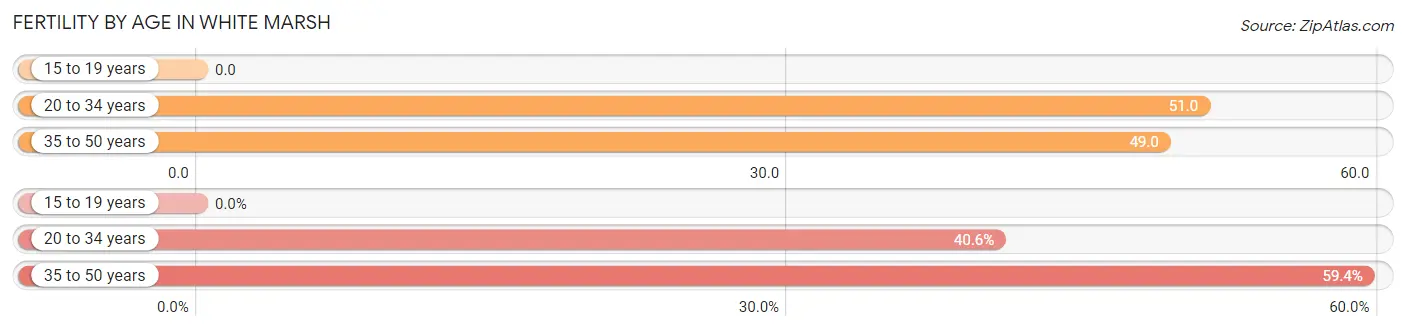
| Age Bracket | Women with Births | Births / 1,000 Women |
| 15 to 19 years | 0 (0.0%) | 0.0 |
| 20 to 34 years | 39 (40.6%) | 51.0 |
| 35 to 50 years | 57 (59.4%) | 49.0 |
| Total | 96 (100.0%) | 40.0 |
Fertility by Age by Marriage Status in White Marsh
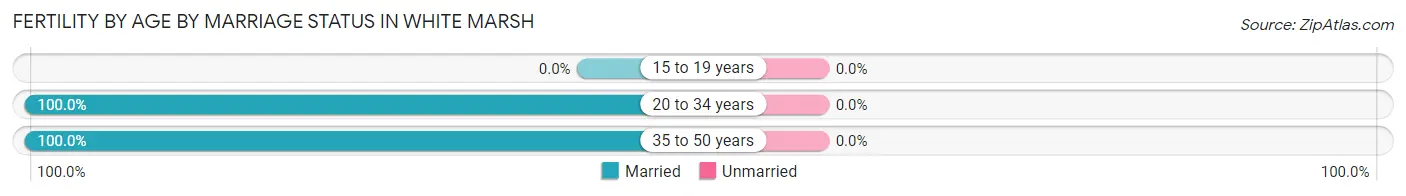
| Age Bracket | Married | Unmarried |
| 15 to 19 years | 0 (0.0%) | 0 (0.0%) |
| 20 to 34 years | 39 (100.0%) | 0 (0.0%) |
| 35 to 50 years | 57 (100.0%) | 0 (0.0%) |
| Total | 96 (100.0%) | 0 (0.0%) |
Fertility by Education in White Marsh
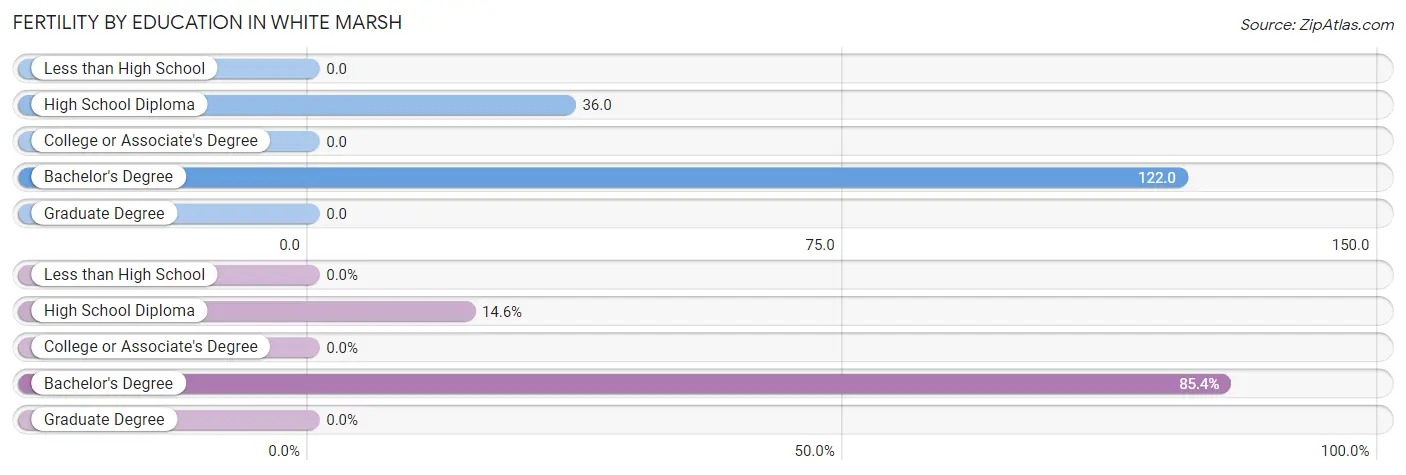
| Educational Attainment | Women with Births | Births / 1,000 Women |
| Less than High School | 0 (0.0%) | 0.0 |
| High School Diploma | 14 (14.6%) | 36.0 |
| College or Associate's Degree | 0 (0.0%) | 0.0 |
| Bachelor's Degree | 82 (85.4%) | 122.0 |
| Graduate Degree | 0 (0.0%) | 0.0 |
| Total | 96 (100.0%) | 40.0 |
Fertility by Education by Marriage Status in White Marsh
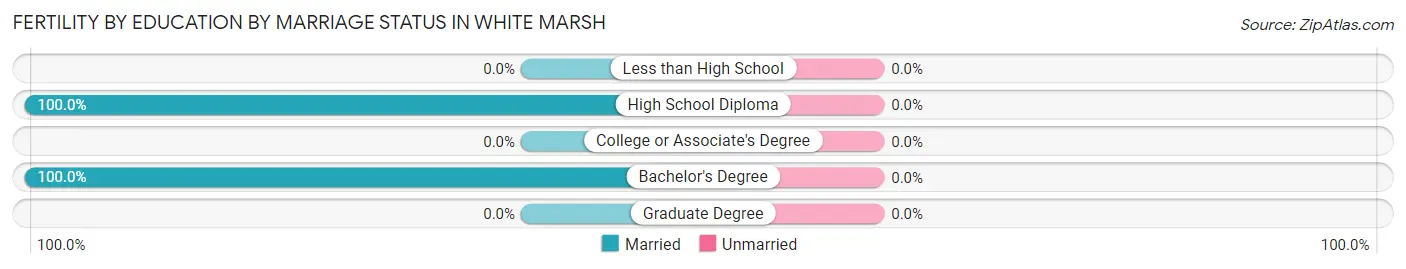
| Educational Attainment | Married | Unmarried |
| Less than High School | 0 (0.0%) | 0 (0.0%) |
| High School Diploma | 14 (100.0%) | 0 (0.0%) |
| College or Associate's Degree | 0 (0.0%) | 0 (0.0%) |
| Bachelor's Degree | 82 (100.0%) | 0 (0.0%) |
| Graduate Degree | 0 (0.0%) | 0 (0.0%) |
| Total | 96 (100.0%) | 0 (0.0%) |
Employment Characteristics in White Marsh
Employment by Class of Employer in White Marsh
Among the 5,398 employed individuals in White Marsh, private company employees (3,160 | 58.5%), not-for-profit organizations (624 | 11.6%), and federal government employees (410 | 7.6%) make up the most common classes of employment.
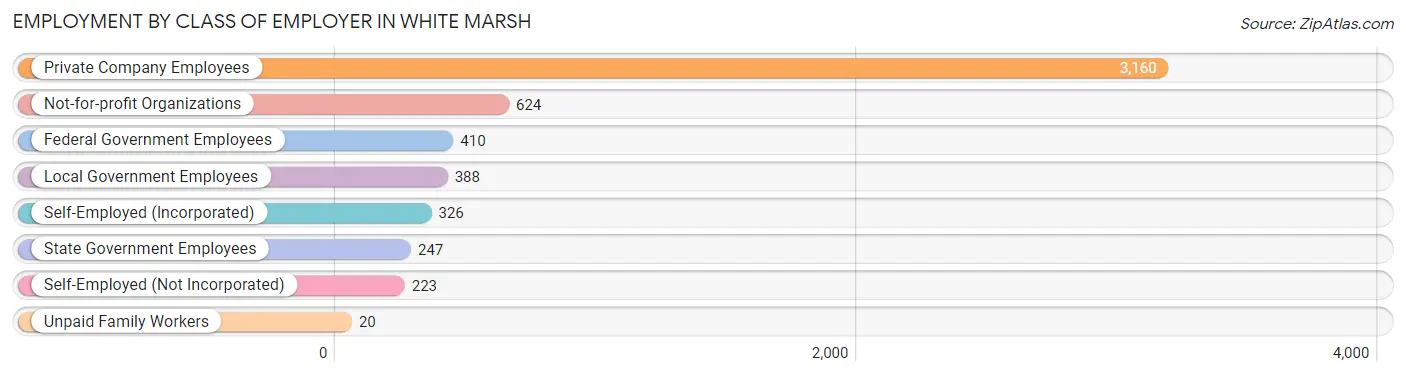
| Employer Class | # Employees | % Employees |
| Private Company Employees | 3,160 | 58.5% |
| Self-Employed (Incorporated) | 326 | 6.0% |
| Self-Employed (Not Incorporated) | 223 | 4.1% |
| Not-for-profit Organizations | 624 | 11.6% |
| Local Government Employees | 388 | 7.2% |
| State Government Employees | 247 | 4.6% |
| Federal Government Employees | 410 | 7.6% |
| Unpaid Family Workers | 20 | 0.4% |
| Total | 5,398 | 100.0% |
Employment Status by Age in White Marsh
According to the labor force statistics for White Marsh, out of the total population over 16 years of age (8,126), 69.3% or 5,631 individuals are in the labor force, with 2.2% or 124 of them unemployed. The age group with the highest labor force participation rate is 45 to 54 years, with 95.0% or 1,037 individuals in the labor force. Within the labor force, the 75 years and over age range has the highest percentage of unemployed individuals, with 25.6% or 11 of them being unemployed.
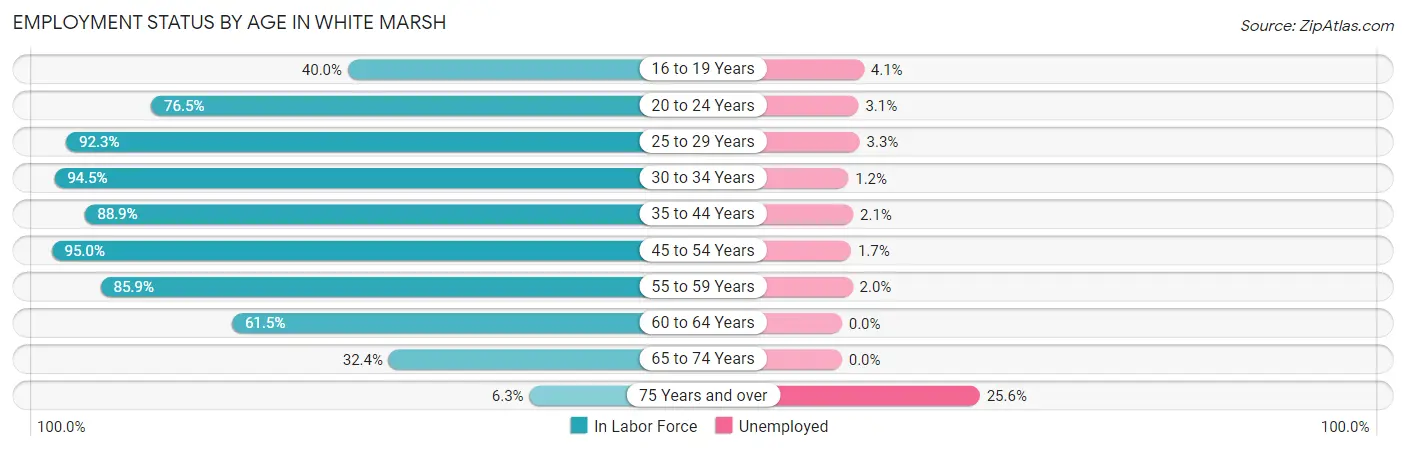
| Age Bracket | In Labor Force | Unemployed |
| 16 to 19 Years | 266 (40.0%) | 11 (4.1%) |
| 20 to 24 Years | 323 (76.5%) | 10 (3.1%) |
| 25 to 29 Years | 663 (92.3%) | 22 (3.3%) |
| 30 to 34 Years | 412 (94.5%) | 5 (1.2%) |
| 35 to 44 Years | 1,518 (88.9%) | 32 (2.1%) |
| 45 to 54 Years | 1,037 (95.0%) | 18 (1.7%) |
| 55 to 59 Years | 708 (85.9%) | 14 (2.0%) |
| 60 to 64 Years | 323 (61.5%) | 0 (0.0%) |
| 65 to 74 Years | 342 (32.4%) | 0 (0.0%) |
| 75 Years and over | 43 (6.3%) | 11 (25.6%) |
| Total | 5,631 (69.3%) | 124 (2.2%) |
Employment Status by Educational Attainment in White Marsh
According to labor force statistics for White Marsh, 87.9% of individuals (4,661) out of the total population between 25 and 64 years of age (5,303) are in the labor force, with 1.9% or 89 of them being unemployed. The group with the highest labor force participation rate are those with the educational attainment of bachelor's degree or higher, with 91.8% or 2,331 individuals in the labor force. Within the labor force, individuals with high school diploma education have the highest percentage of unemployment, with 5.8% or 48 of them being unemployed.
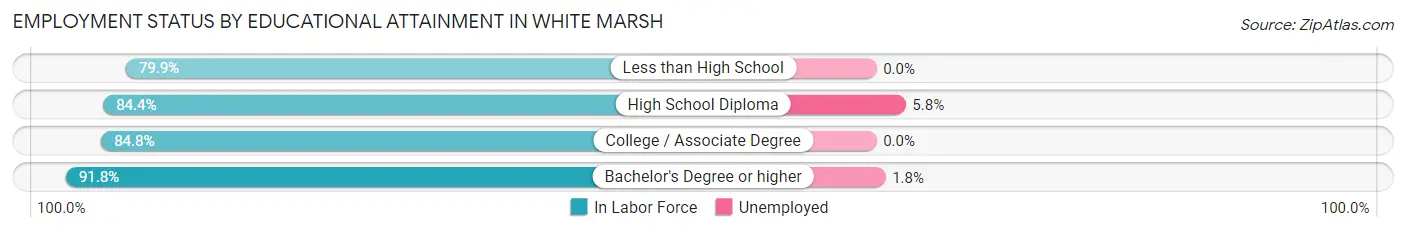
| Educational Attainment | In Labor Force | Unemployed |
| Less than High School | 139 (79.9%) | 0 (0.0%) |
| High School Diploma | 824 (84.4%) | 57 (5.8%) |
| College / Associate Degree | 1,369 (84.8%) | 0 (0.0%) |
| Bachelor's Degree or higher | 2,331 (91.8%) | 46 (1.8%) |
| Total | 4,661 (87.9%) | 101 (1.9%) |
Employment Occupations by Sex in White Marsh
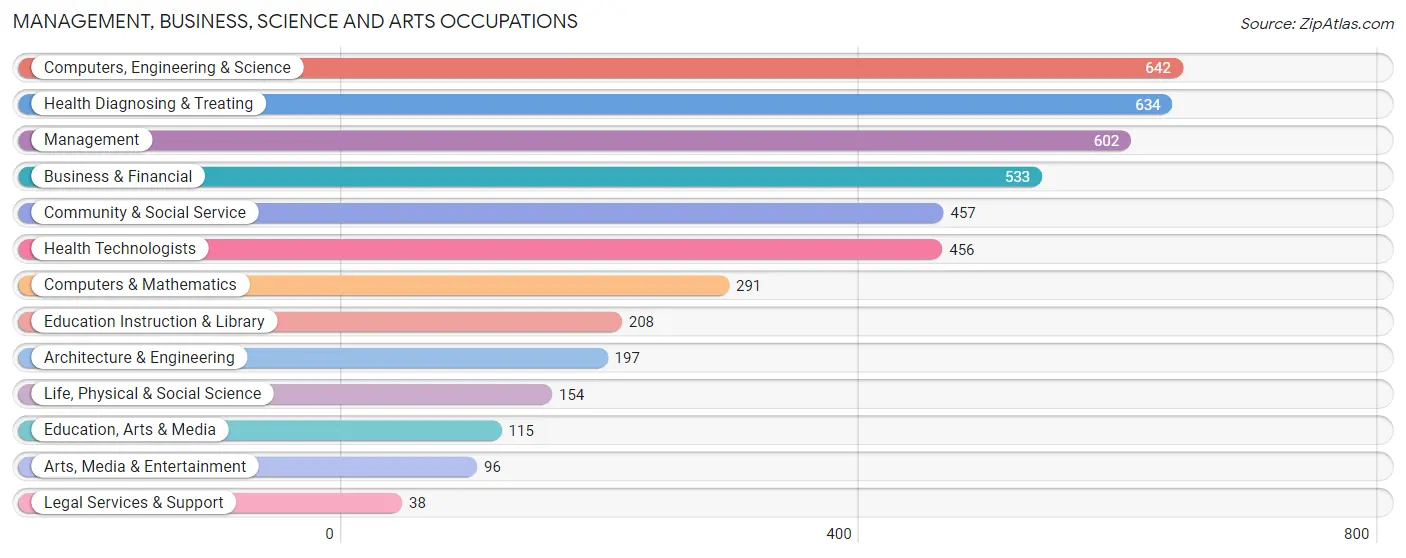
Management, Business, Science and Arts Occupations
The most common Management, Business, Science and Arts occupations in White Marsh are Computers, Engineering & Science (642 | 11.8%), Health Diagnosing & Treating (634 | 11.6%), Management (602 | 11.0%), Business & Financial (533 | 9.8%), and Community & Social Service (457 | 8.4%).
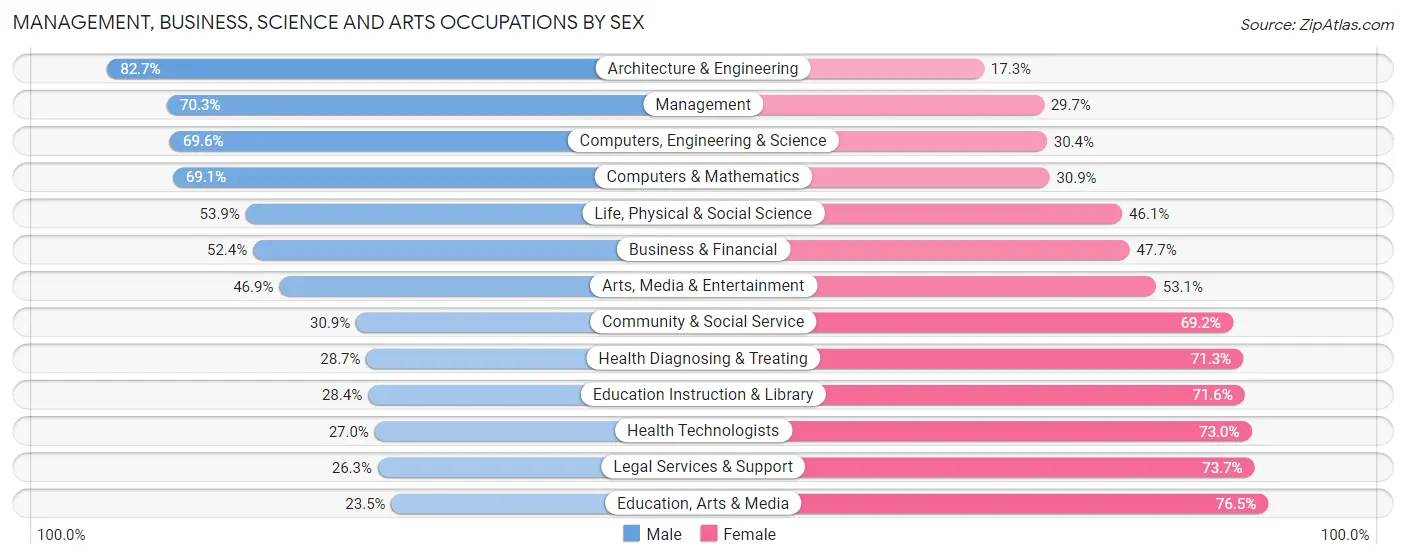
Management, Business, Science and Arts Occupations by Sex
Within the Management, Business, Science and Arts occupations in White Marsh, the most male-oriented occupations are Architecture & Engineering (82.7%), Management (70.3%), and Computers, Engineering & Science (69.6%), while the most female-oriented occupations are Education, Arts & Media (76.5%), Legal Services & Support (73.7%), and Health Technologists (73.0%).
| Occupation | Male | Female |
| Management | 423 (70.3%) | 179 (29.7%) |
| Business & Financial | 279 (52.3%) | 254 (47.6%) |
| Computers, Engineering & Science | 447 (69.6%) | 195 (30.4%) |
| Computers & Mathematics | 201 (69.1%) | 90 (30.9%) |
| Architecture & Engineering | 163 (82.7%) | 34 (17.3%) |
| Life, Physical & Social Science | 83 (53.9%) | 71 (46.1%) |
| Community & Social Service | 141 (30.8%) | 316 (69.2%) |
| Education, Arts & Media | 27 (23.5%) | 88 (76.5%) |
| Legal Services & Support | 10 (26.3%) | 28 (73.7%) |
| Education Instruction & Library | 59 (28.4%) | 149 (71.6%) |
| Arts, Media & Entertainment | 45 (46.9%) | 51 (53.1%) |
| Health Diagnosing & Treating | 182 (28.7%) | 452 (71.3%) |
| Health Technologists | 123 (27.0%) | 333 (73.0%) |
| Total (Category) | 1,472 (51.3%) | 1,396 (48.7%) |
| Total (Overall) | 2,737 (50.1%) | 2,722 (49.9%) |
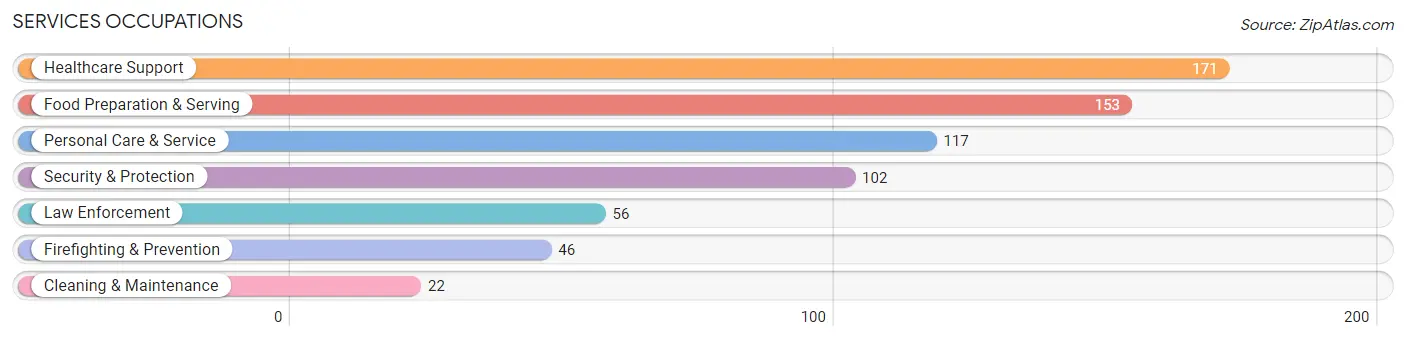
Services Occupations
The most common Services occupations in White Marsh are Healthcare Support (171 | 3.1%), Food Preparation & Serving (153 | 2.8%), Personal Care & Service (117 | 2.1%), Security & Protection (102 | 1.9%), and Law Enforcement (56 | 1.0%).
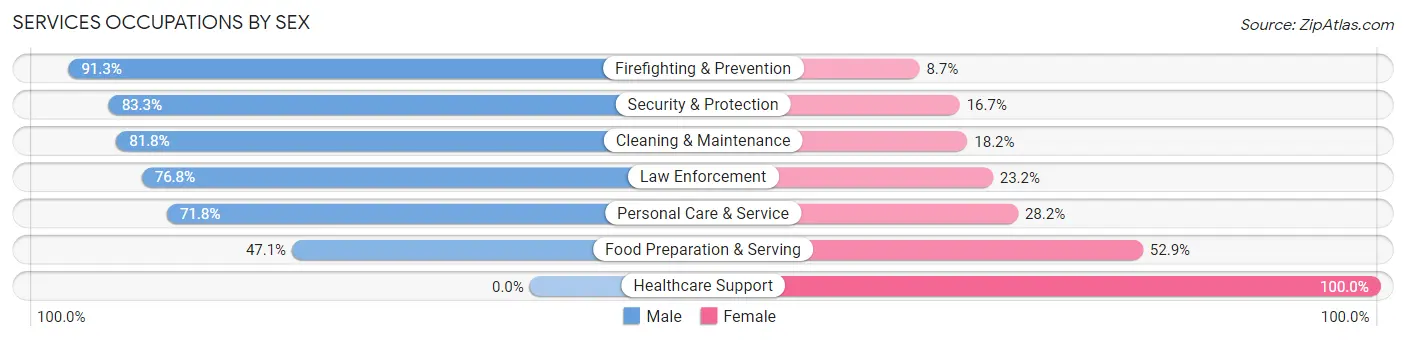
Services Occupations by Sex
Within the Services occupations in White Marsh, the most male-oriented occupations are Firefighting & Prevention (91.3%), Security & Protection (83.3%), and Cleaning & Maintenance (81.8%), while the most female-oriented occupations are Healthcare Support (100.0%), Food Preparation & Serving (52.9%), and Personal Care & Service (28.2%).
| Occupation | Male | Female |
| Healthcare Support | 0 (0.0%) | 171 (100.0%) |
| Security & Protection | 85 (83.3%) | 17 (16.7%) |
| Firefighting & Prevention | 42 (91.3%) | 4 (8.7%) |
| Law Enforcement | 43 (76.8%) | 13 (23.2%) |
| Food Preparation & Serving | 72 (47.1%) | 81 (52.9%) |
| Cleaning & Maintenance | 18 (81.8%) | 4 (18.2%) |
| Personal Care & Service | 84 (71.8%) | 33 (28.2%) |
| Total (Category) | 259 (45.8%) | 306 (54.2%) |
| Total (Overall) | 2,737 (50.1%) | 2,722 (49.9%) |
Sales and Office Occupations
The most common Sales and Office occupations in White Marsh are Office & Administration (843 | 15.4%), and Sales & Related (642 | 11.8%).
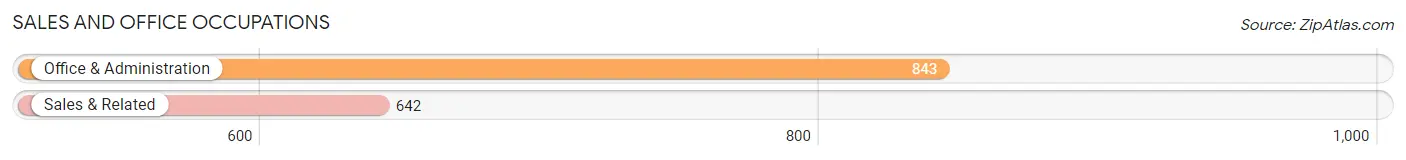
Sales and Office Occupations by Sex
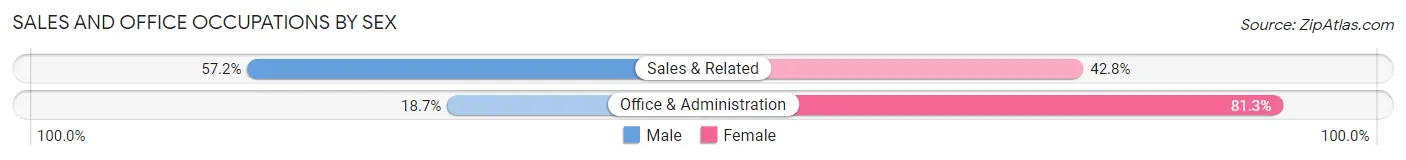
| Occupation | Male | Female |
| Sales & Related | 367 (57.2%) | 275 (42.8%) |
| Office & Administration | 158 (18.7%) | 685 (81.3%) |
| Total (Category) | 525 (35.3%) | 960 (64.6%) |
| Total (Overall) | 2,737 (50.1%) | 2,722 (49.9%) |
Natural Resources, Construction and Maintenance Occupations
The most common Natural Resources, Construction and Maintenance occupations in White Marsh are Construction & Extraction (98 | 1.8%), Installation, Maintenance & Repair (92 | 1.7%), and Farming, Fishing & Forestry (4 | 0.1%).
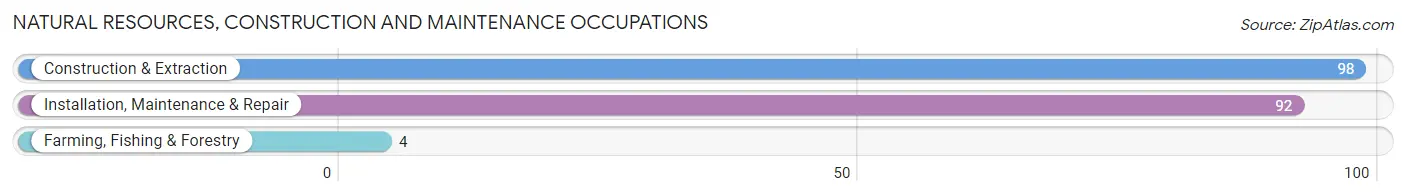
Natural Resources, Construction and Maintenance Occupations by Sex
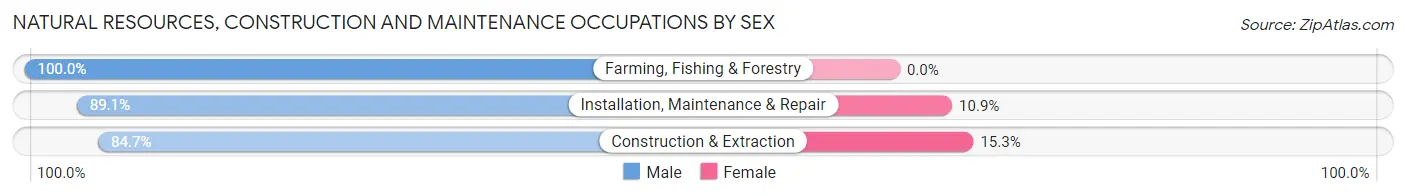
| Occupation | Male | Female |
| Farming, Fishing & Forestry | 4 (100.0%) | 0 (0.0%) |
| Construction & Extraction | 83 (84.7%) | 15 (15.3%) |
| Installation, Maintenance & Repair | 82 (89.1%) | 10 (10.9%) |
| Total (Category) | 169 (87.1%) | 25 (12.9%) |
| Total (Overall) | 2,737 (50.1%) | 2,722 (49.9%) |
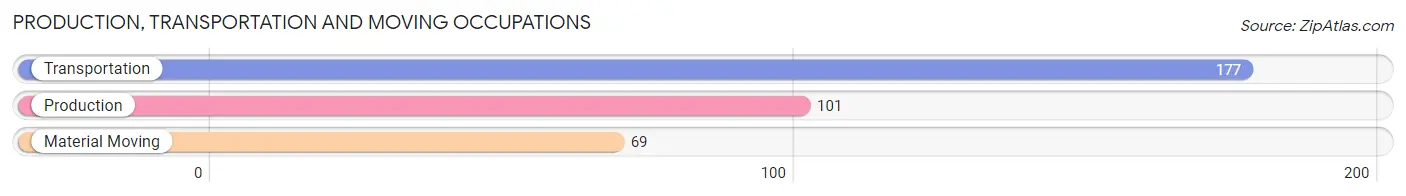
Production, Transportation and Moving Occupations
The most common Production, Transportation and Moving occupations in White Marsh are Transportation (177 | 3.2%), Production (101 | 1.8%), and Material Moving (69 | 1.3%).
Production, Transportation and Moving Occupations by Sex
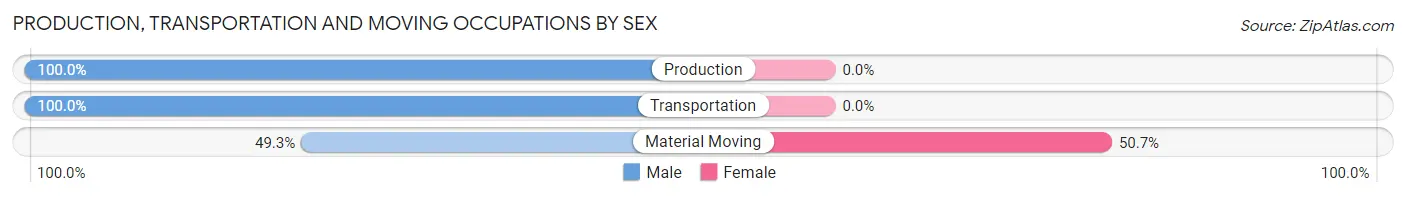
| Occupation | Male | Female |
| Production | 101 (100.0%) | 0 (0.0%) |
| Transportation | 177 (100.0%) | 0 (0.0%) |
| Material Moving | 34 (49.3%) | 35 (50.7%) |
| Total (Category) | 312 (89.9%) | 35 (10.1%) |
| Total (Overall) | 2,737 (50.1%) | 2,722 (49.9%) |
Employment Industries by Sex in White Marsh
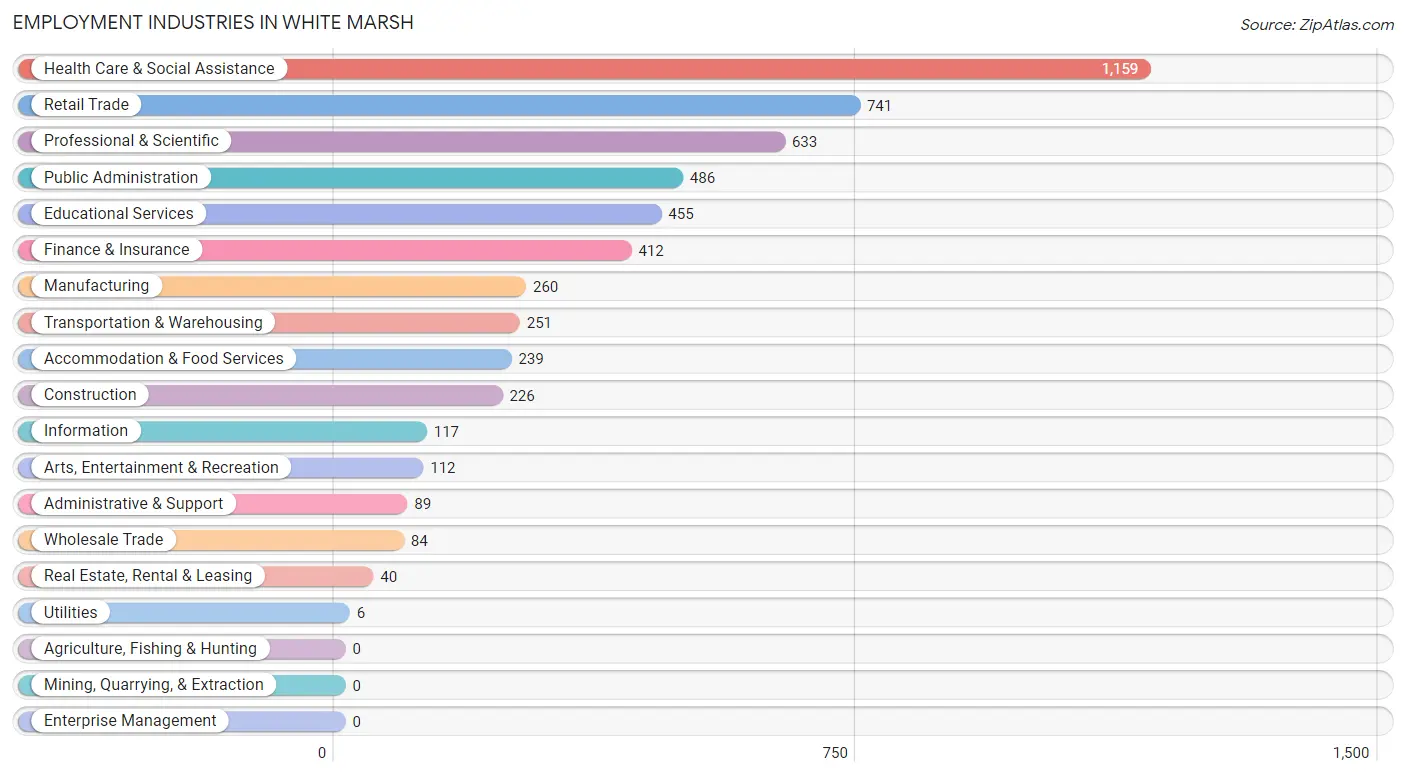
Employment Industries in White Marsh
The major employment industries in White Marsh include Health Care & Social Assistance (1,159 | 21.2%), Retail Trade (741 | 13.6%), Professional & Scientific (633 | 11.6%), Public Administration (486 | 8.9%), and Educational Services (455 | 8.3%).
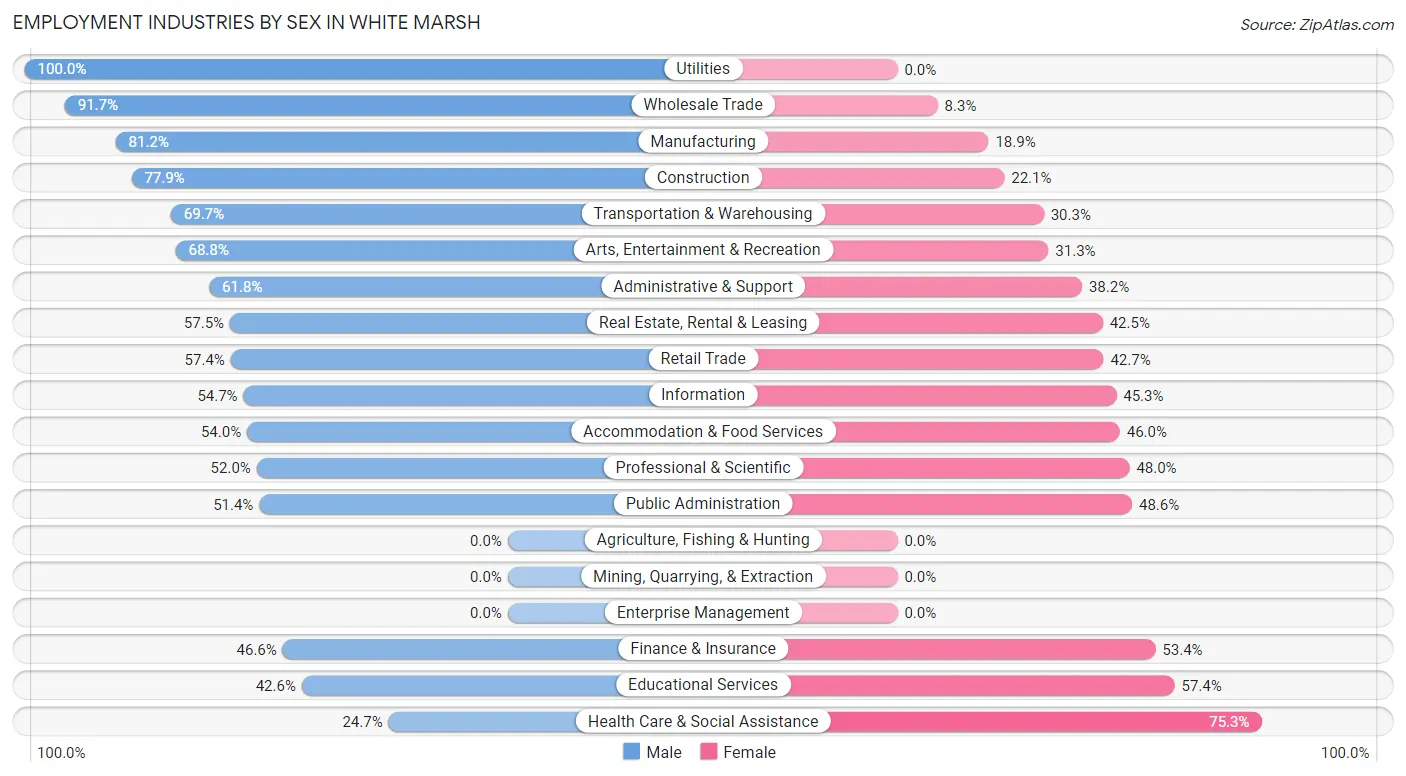
Employment Industries by Sex in White Marsh
The White Marsh industries that see more men than women are Utilities (100.0%), Wholesale Trade (91.7%), and Manufacturing (81.1%), whereas the industries that tend to have a higher number of women are Health Care & Social Assistance (75.3%), Educational Services (57.4%), and Finance & Insurance (53.4%).
| Industry | Male | Female |
| Agriculture, Fishing & Hunting | 0 (0.0%) | 0 (0.0%) |
| Mining, Quarrying, & Extraction | 0 (0.0%) | 0 (0.0%) |
| Construction | 176 (77.9%) | 50 (22.1%) |
| Manufacturing | 211 (81.1%) | 49 (18.9%) |
| Wholesale Trade | 77 (91.7%) | 7 (8.3%) |
| Retail Trade | 425 (57.4%) | 316 (42.6%) |
| Transportation & Warehousing | 175 (69.7%) | 76 (30.3%) |
| Utilities | 6 (100.0%) | 0 (0.0%) |
| Information | 64 (54.7%) | 53 (45.3%) |
| Finance & Insurance | 192 (46.6%) | 220 (53.4%) |
| Real Estate, Rental & Leasing | 23 (57.5%) | 17 (42.5%) |
| Professional & Scientific | 329 (52.0%) | 304 (48.0%) |
| Enterprise Management | 0 (0.0%) | 0 (0.0%) |
| Administrative & Support | 55 (61.8%) | 34 (38.2%) |
| Educational Services | 194 (42.6%) | 261 (57.4%) |
| Health Care & Social Assistance | 286 (24.7%) | 873 (75.3%) |
| Arts, Entertainment & Recreation | 77 (68.8%) | 35 (31.2%) |
| Accommodation & Food Services | 129 (54.0%) | 110 (46.0%) |
| Public Administration | 250 (51.4%) | 236 (48.6%) |
| Total | 2,737 (50.1%) | 2,722 (49.9%) |
Education in White Marsh
School Enrollment in White Marsh
The most common levels of schooling among the 3,077 students in White Marsh are middle school (860 | 28.0%), high school (677 | 22.0%), and college / undergraduate (571 | 18.6%).
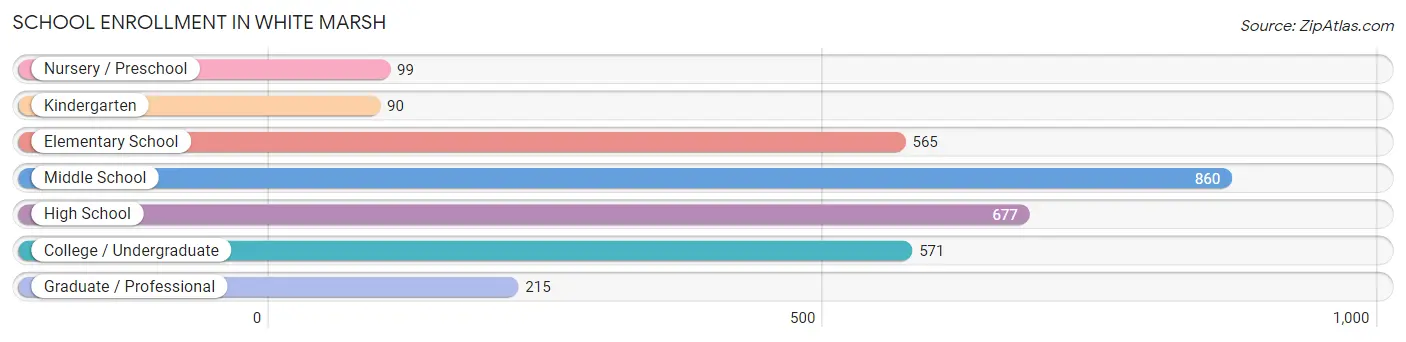
| School Level | # Students | % Students |
| Nursery / Preschool | 99 | 3.2% |
| Kindergarten | 90 | 2.9% |
| Elementary School | 565 | 18.4% |
| Middle School | 860 | 28.0% |
| High School | 677 | 22.0% |
| College / Undergraduate | 571 | 18.6% |
| Graduate / Professional | 215 | 7.0% |
| Total | 3,077 | 100.0% |
School Enrollment by Age by Funding Source in White Marsh
Out of a total of 3,077 students who are enrolled in schools in White Marsh, 671 (21.8%) attend a private institution, while the remaining 2,406 (78.2%) are enrolled in public schools. The age group of 3 to 4 year olds has the highest likelihood of being enrolled in private schools, with 23 (63.9% in the age bracket) enrolled. Conversely, the age group of 20 to 24 year olds has the lowest likelihood of being enrolled in a private school, with 170 (91.4% in the age bracket) attending a public institution.
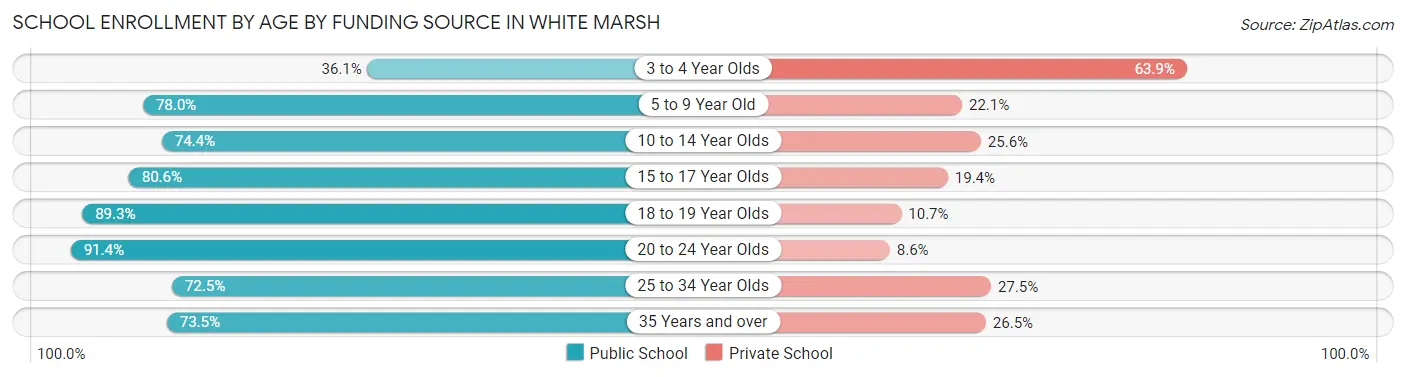
| Age Bracket | Public School | Private School |
| 3 to 4 Year Olds | 13 (36.1%) | 23 (63.9%) |
| 5 to 9 Year Old | 548 (77.9%) | 155 (22.1%) |
| 10 to 14 Year Olds | 696 (74.4%) | 239 (25.6%) |
| 15 to 17 Year Olds | 436 (80.6%) | 105 (19.4%) |
| 18 to 19 Year Olds | 266 (89.3%) | 32 (10.7%) |
| 20 to 24 Year Olds | 170 (91.4%) | 16 (8.6%) |
| 25 to 34 Year Olds | 140 (72.5%) | 53 (27.5%) |
| 35 Years and over | 136 (73.5%) | 49 (26.5%) |
| Total | 2,406 (78.2%) | 671 (21.8%) |
Educational Attainment by Field of Study in White Marsh
Business (696 | 20.8%), science & technology (633 | 18.9%), computers & mathematics (350 | 10.4%), education (303 | 9.0%), and social sciences (249 | 7.4%) are the most common fields of study among 3,350 individuals in White Marsh who have obtained a bachelor's degree or higher.
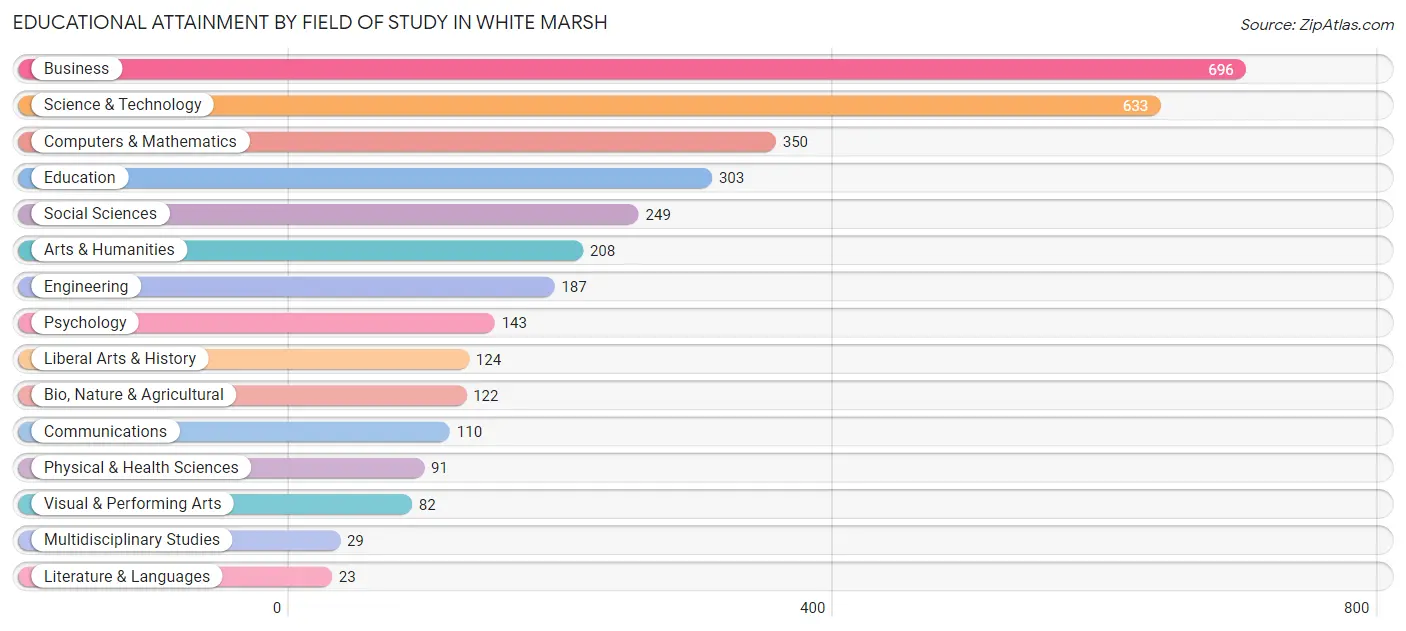
| Field of Study | # Graduates | % Graduates |
| Computers & Mathematics | 350 | 10.4% |
| Bio, Nature & Agricultural | 122 | 3.6% |
| Physical & Health Sciences | 91 | 2.7% |
| Psychology | 143 | 4.3% |
| Social Sciences | 249 | 7.4% |
| Engineering | 187 | 5.6% |
| Multidisciplinary Studies | 29 | 0.9% |
| Science & Technology | 633 | 18.9% |
| Business | 696 | 20.8% |
| Education | 303 | 9.0% |
| Literature & Languages | 23 | 0.7% |
| Liberal Arts & History | 124 | 3.7% |
| Visual & Performing Arts | 82 | 2.5% |
| Communications | 110 | 3.3% |
| Arts & Humanities | 208 | 6.2% |
| Total | 3,350 | 100.0% |
Transportation & Commute in White Marsh
Vehicle Availability by Sex in White Marsh
The most prevalent vehicle ownership categories in White Marsh are males with 2 vehicles (1,242, accounting for 46.0%) and females with 2 vehicles (1,263, making up 46.0%).
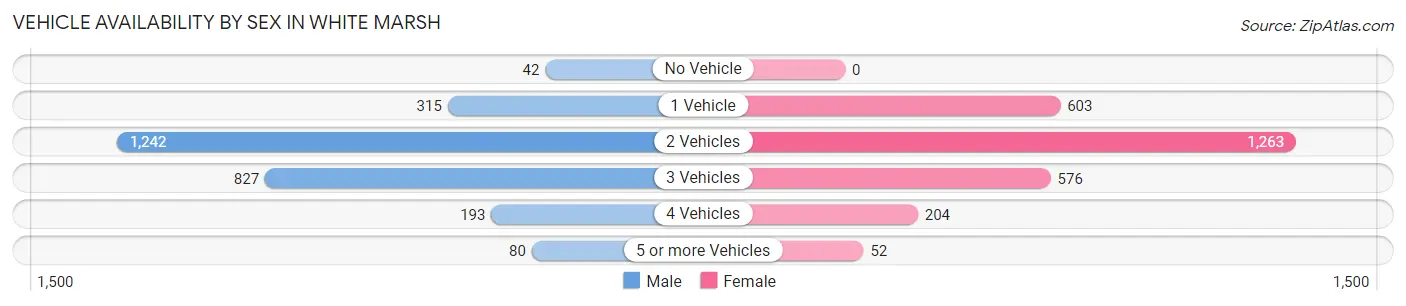
| Vehicles Available | Male | Female |
| No Vehicle | 42 (1.6%) | 0 (0.0%) |
| 1 Vehicle | 315 (11.7%) | 603 (22.4%) |
| 2 Vehicles | 1,242 (46.0%) | 1,263 (46.8%) |
| 3 Vehicles | 827 (30.6%) | 576 (21.3%) |
| 4 Vehicles | 193 (7.1%) | 204 (7.6%) |
| 5 or more Vehicles | 80 (3.0%) | 52 (1.9%) |
| Total | 2,699 (100.0%) | 2,698 (100.0%) |
Commute Time in White Marsh
The most frequently occuring commute durations in White Marsh are 20 to 24 minutes (868 commuters, 19.1%), 30 to 34 minutes (743 commuters, 16.3%), and 25 to 29 minutes (670 commuters, 14.7%).
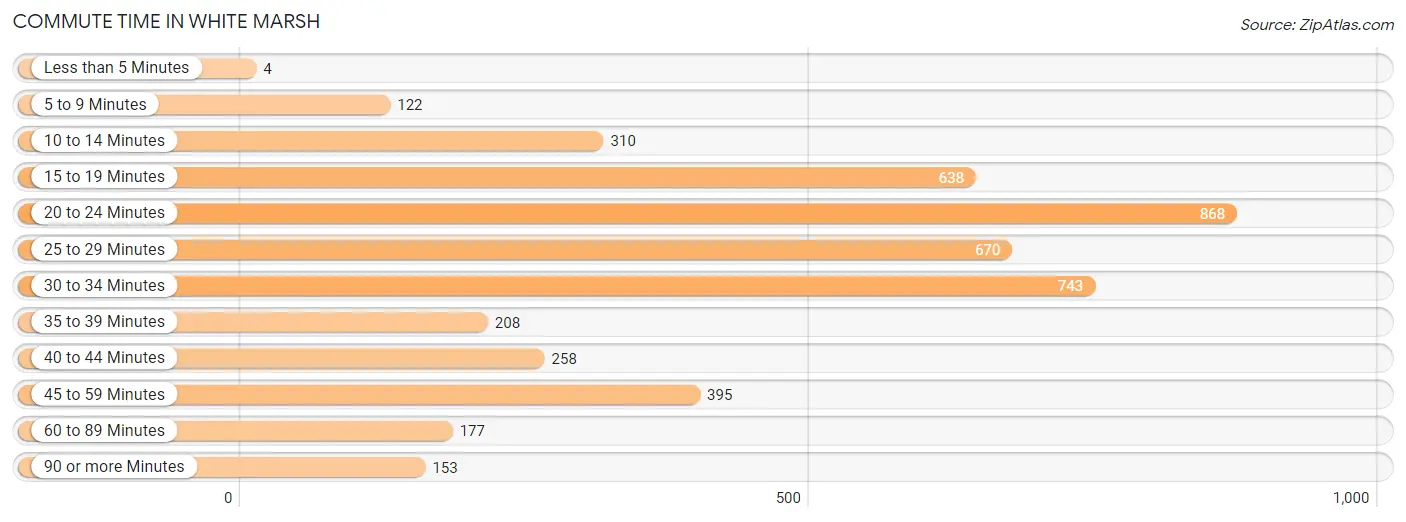
| Commute Time | # Commuters | % Commuters |
| Less than 5 Minutes | 4 | 0.1% |
| 5 to 9 Minutes | 122 | 2.7% |
| 10 to 14 Minutes | 310 | 6.8% |
| 15 to 19 Minutes | 638 | 14.0% |
| 20 to 24 Minutes | 868 | 19.1% |
| 25 to 29 Minutes | 670 | 14.7% |
| 30 to 34 Minutes | 743 | 16.3% |
| 35 to 39 Minutes | 208 | 4.6% |
| 40 to 44 Minutes | 258 | 5.7% |
| 45 to 59 Minutes | 395 | 8.7% |
| 60 to 89 Minutes | 177 | 3.9% |
| 90 or more Minutes | 153 | 3.4% |
Commute Time by Sex in White Marsh
The most common commute times in White Marsh are 20 to 24 minutes (426 commuters, 18.8%) for males and 20 to 24 minutes (442 commuters, 19.4%) for females.
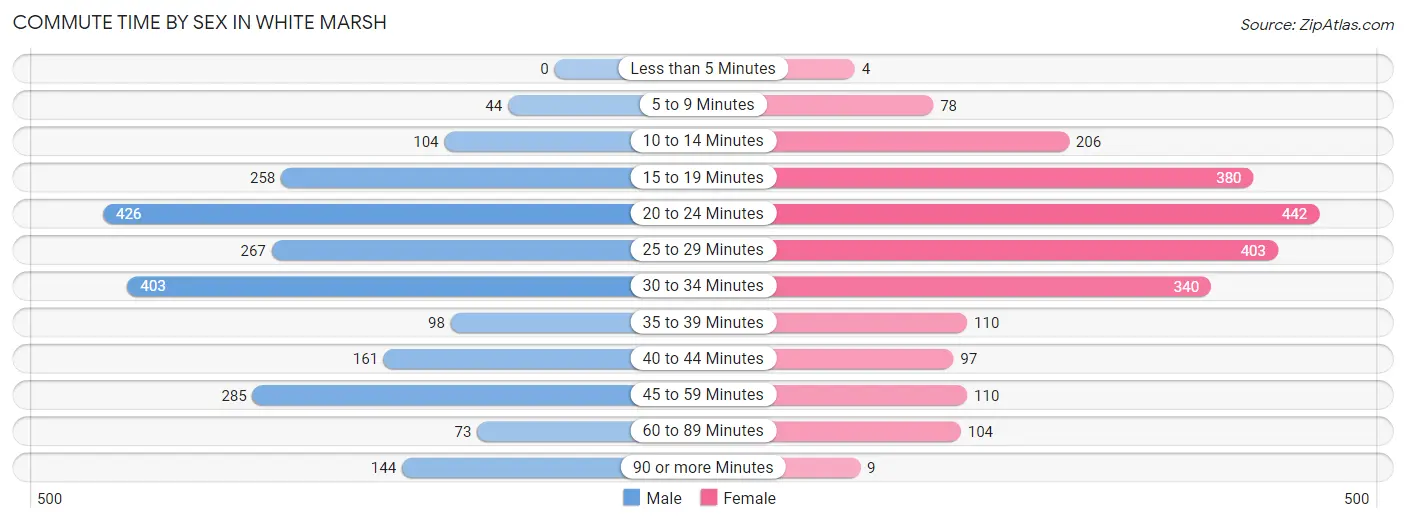
| Commute Time | Male | Female |
| Less than 5 Minutes | 0 (0.0%) | 4 (0.2%) |
| 5 to 9 Minutes | 44 (1.9%) | 78 (3.4%) |
| 10 to 14 Minutes | 104 (4.6%) | 206 (9.0%) |
| 15 to 19 Minutes | 258 (11.4%) | 380 (16.6%) |
| 20 to 24 Minutes | 426 (18.8%) | 442 (19.4%) |
| 25 to 29 Minutes | 267 (11.8%) | 403 (17.6%) |
| 30 to 34 Minutes | 403 (17.8%) | 340 (14.9%) |
| 35 to 39 Minutes | 98 (4.3%) | 110 (4.8%) |
| 40 to 44 Minutes | 161 (7.1%) | 97 (4.3%) |
| 45 to 59 Minutes | 285 (12.6%) | 110 (4.8%) |
| 60 to 89 Minutes | 73 (3.2%) | 104 (4.6%) |
| 90 or more Minutes | 144 (6.4%) | 9 (0.4%) |
Time of Departure to Work by Sex in White Marsh
The most frequent times of departure to work in White Marsh are 7:30 AM to 7:59 AM (370, 16.4%) for males and 7:30 AM to 7:59 AM (492, 21.5%) for females.
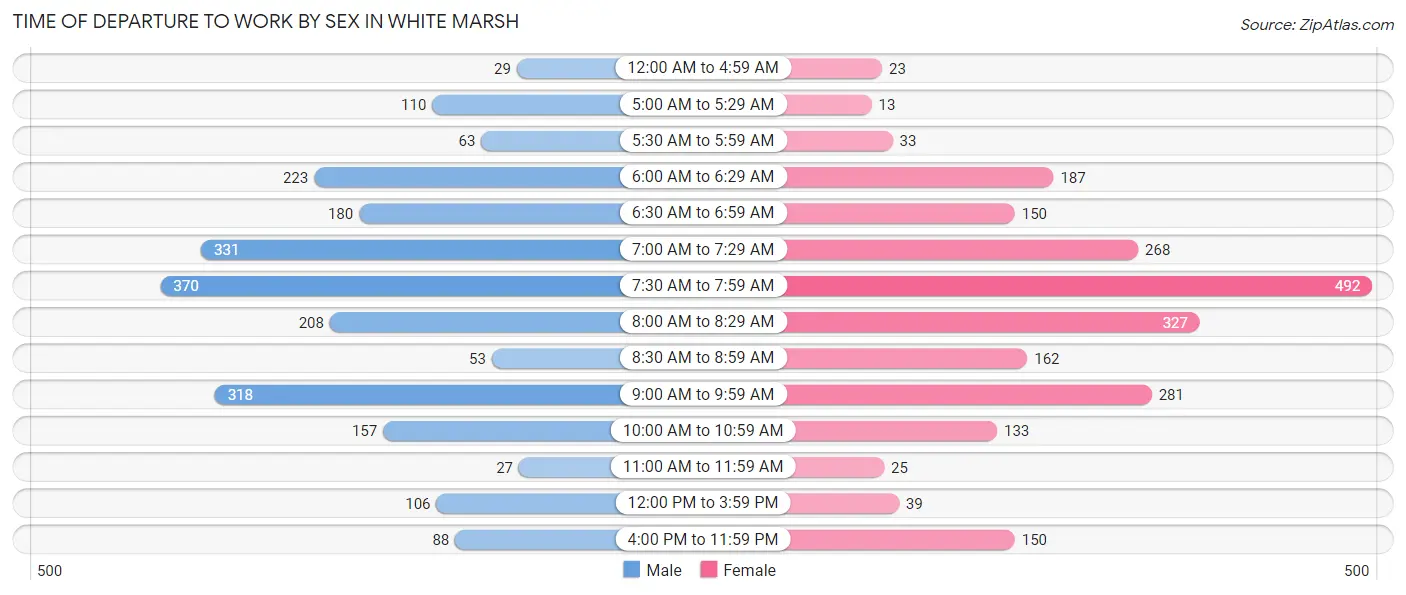
| Time of Departure | Male | Female |
| 12:00 AM to 4:59 AM | 29 (1.3%) | 23 (1.0%) |
| 5:00 AM to 5:29 AM | 110 (4.9%) | 13 (0.6%) |
| 5:30 AM to 5:59 AM | 63 (2.8%) | 33 (1.5%) |
| 6:00 AM to 6:29 AM | 223 (9.9%) | 187 (8.2%) |
| 6:30 AM to 6:59 AM | 180 (8.0%) | 150 (6.6%) |
| 7:00 AM to 7:29 AM | 331 (14.6%) | 268 (11.7%) |
| 7:30 AM to 7:59 AM | 370 (16.4%) | 492 (21.5%) |
| 8:00 AM to 8:29 AM | 208 (9.2%) | 327 (14.3%) |
| 8:30 AM to 8:59 AM | 53 (2.3%) | 162 (7.1%) |
| 9:00 AM to 9:59 AM | 318 (14.1%) | 281 (12.3%) |
| 10:00 AM to 10:59 AM | 157 (6.9%) | 133 (5.8%) |
| 11:00 AM to 11:59 AM | 27 (1.2%) | 25 (1.1%) |
| 12:00 PM to 3:59 PM | 106 (4.7%) | 39 (1.7%) |
| 4:00 PM to 11:59 PM | 88 (3.9%) | 150 (6.6%) |
| Total | 2,263 (100.0%) | 2,283 (100.0%) |
Housing Occupancy in White Marsh
Occupancy by Ownership in White Marsh
Of the total 3,801 dwellings in White Marsh, owner-occupied units account for 2,856 (75.1%), while renter-occupied units make up 945 (24.9%).
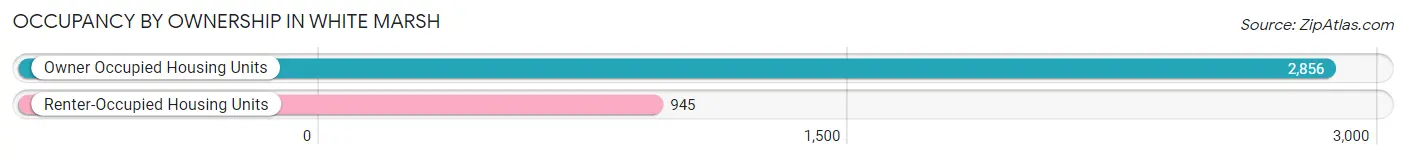
| Occupancy | # Housing Units | % Housing Units |
| Owner Occupied Housing Units | 2,856 | 75.1% |
| Renter-Occupied Housing Units | 945 | 24.9% |
| Total Occupied Housing Units | 3,801 | 100.0% |
Occupancy by Household Size in White Marsh
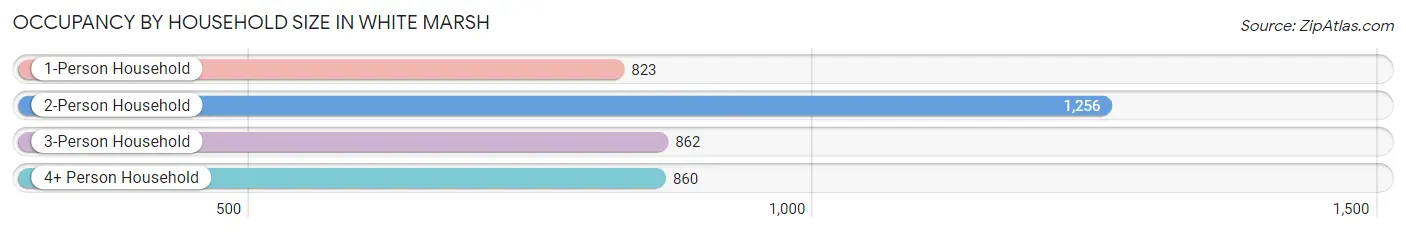
| Household Size | # Housing Units | % Housing Units |
| 1-Person Household | 823 | 21.6% |
| 2-Person Household | 1,256 | 33.0% |
| 3-Person Household | 862 | 22.7% |
| 4+ Person Household | 860 | 22.6% |
| Total Housing Units | 3,801 | 100.0% |
Occupancy by Ownership by Household Size in White Marsh
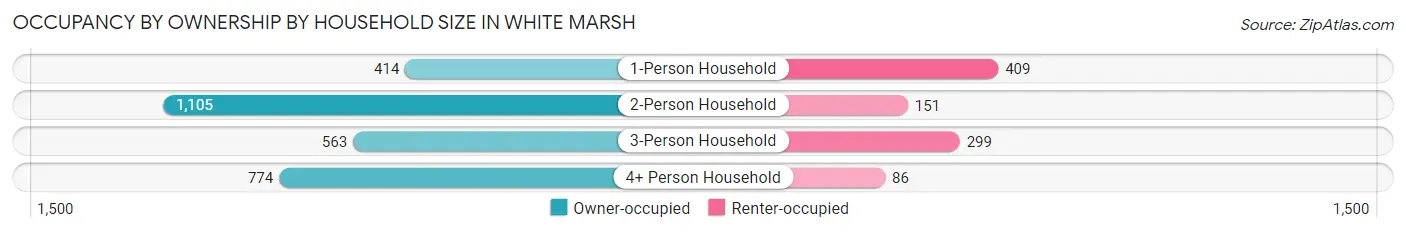
| Household Size | Owner-occupied | Renter-occupied |
| 1-Person Household | 414 (50.3%) | 409 (49.7%) |
| 2-Person Household | 1,105 (88.0%) | 151 (12.0%) |
| 3-Person Household | 563 (65.3%) | 299 (34.7%) |
| 4+ Person Household | 774 (90.0%) | 86 (10.0%) |
| Total Housing Units | 2,856 (75.1%) | 945 (24.9%) |
Occupancy by Educational Attainment in White Marsh
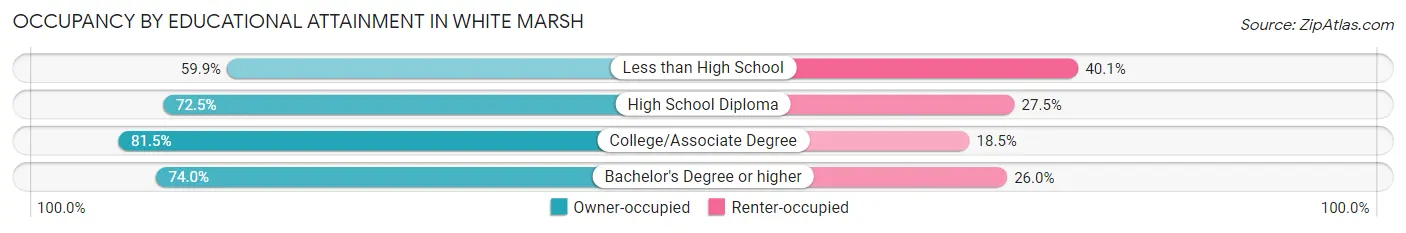
| Household Size | Owner-occupied | Renter-occupied |
| Less than High School | 106 (59.9%) | 71 (40.1%) |
| High School Diploma | 449 (72.5%) | 170 (27.5%) |
| College/Associate Degree | 840 (81.5%) | 191 (18.5%) |
| Bachelor's Degree or higher | 1,461 (74.0%) | 513 (26.0%) |
Occupancy by Age of Householder in White Marsh
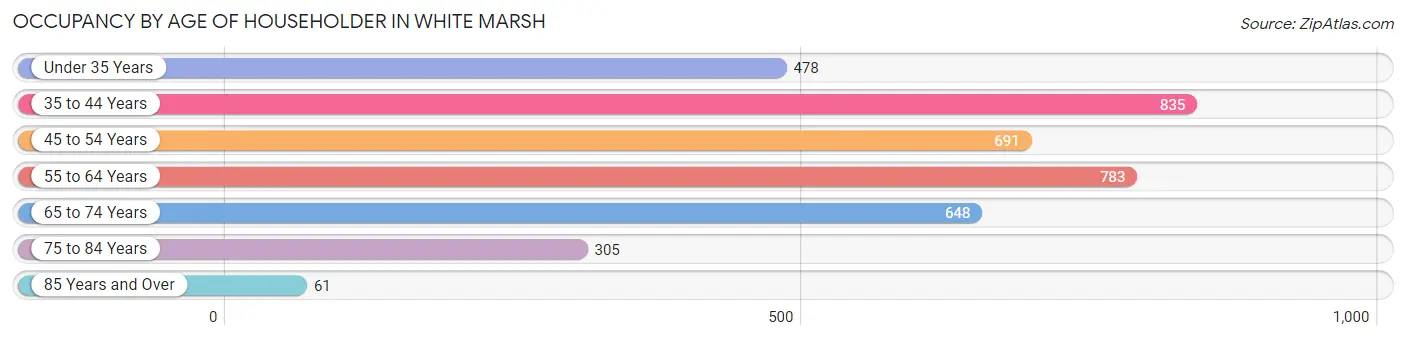
| Age Bracket | # Households | % Households |
| Under 35 Years | 478 | 12.6% |
| 35 to 44 Years | 835 | 22.0% |
| 45 to 54 Years | 691 | 18.2% |
| 55 to 64 Years | 783 | 20.6% |
| 65 to 74 Years | 648 | 17.1% |
| 75 to 84 Years | 305 | 8.0% |
| 85 Years and Over | 61 | 1.6% |
| Total | 3,801 | 100.0% |
Housing Finances in White Marsh
Median Income by Occupancy in White Marsh
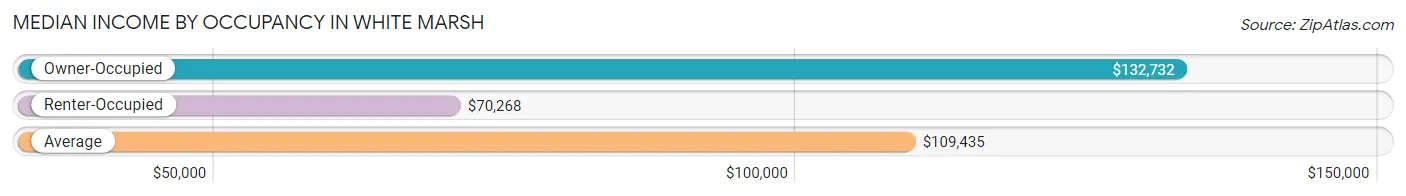
| Occupancy Type | # Households | Median Income |
| Owner-Occupied | 2,856 (75.1%) | $132,732 |
| Renter-Occupied | 945 (24.9%) | $70,268 |
| Average | 3,801 (100.0%) | $109,435 |
Occupancy by Householder Income Bracket in White Marsh
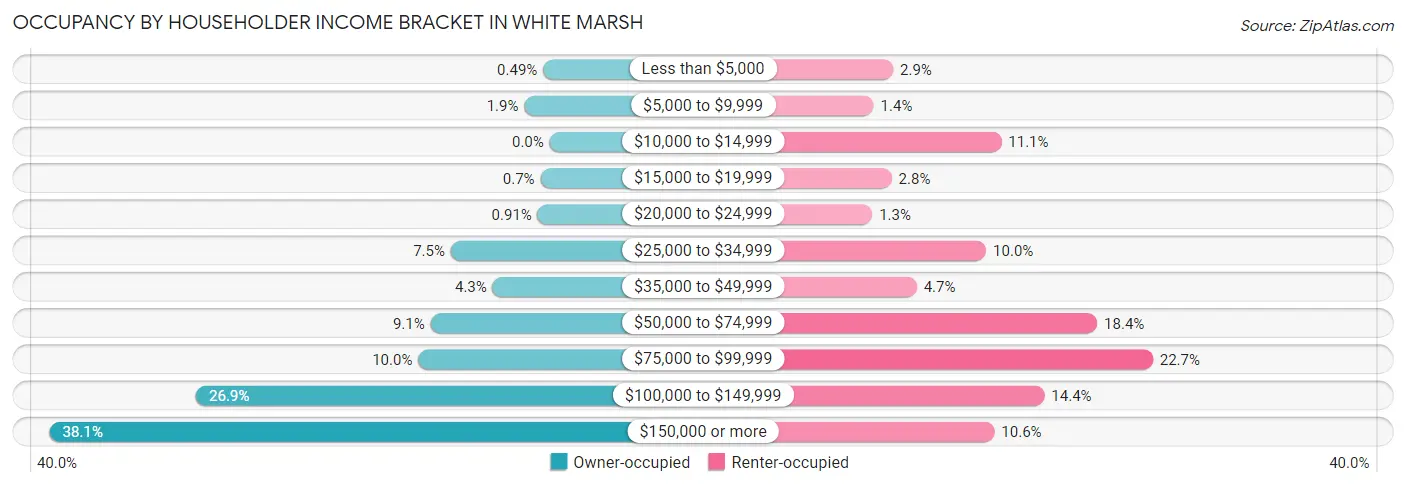
| Income Bracket | Owner-occupied | Renter-occupied |
| Less than $5,000 | 14 (0.5%) | 27 (2.9%) |
| $5,000 to $9,999 | 55 (1.9%) | 13 (1.4%) |
| $10,000 to $14,999 | 0 (0.0%) | 105 (11.1%) |
| $15,000 to $19,999 | 20 (0.7%) | 26 (2.8%) |
| $20,000 to $24,999 | 26 (0.9%) | 12 (1.3%) |
| $25,000 to $34,999 | 215 (7.5%) | 94 (10.0%) |
| $35,000 to $49,999 | 124 (4.3%) | 44 (4.7%) |
| $50,000 to $74,999 | 259 (9.1%) | 174 (18.4%) |
| $75,000 to $99,999 | 286 (10.0%) | 214 (22.7%) |
| $100,000 to $149,999 | 769 (26.9%) | 136 (14.4%) |
| $150,000 or more | 1,088 (38.1%) | 100 (10.6%) |
| Total | 2,856 (100.0%) | 945 (100.0%) |
Monthly Housing Cost Tiers in White Marsh
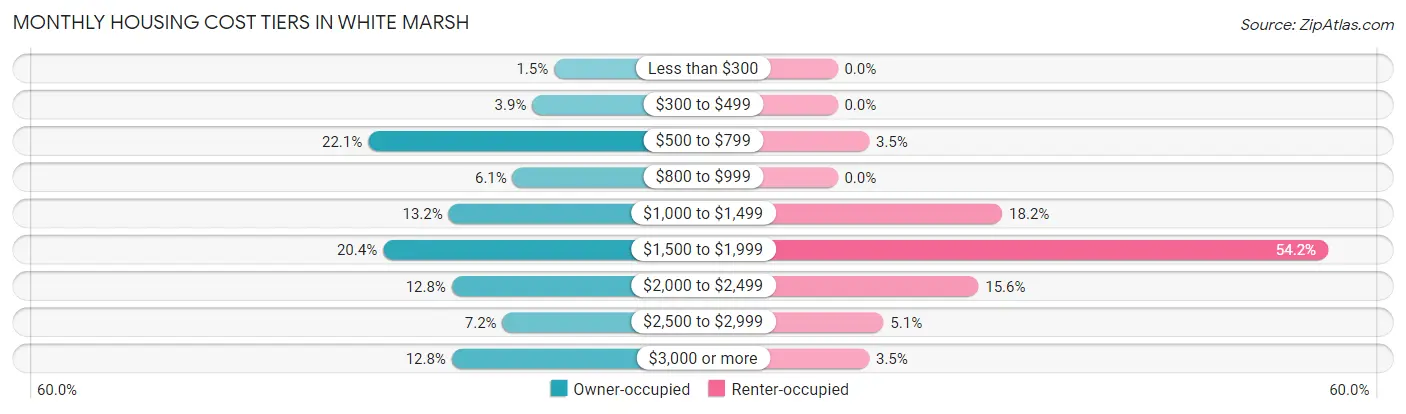
| Monthly Cost | Owner-occupied | Renter-occupied |
| Less than $300 | 43 (1.5%) | 0 (0.0%) |
| $300 to $499 | 112 (3.9%) | 0 (0.0%) |
| $500 to $799 | 630 (22.1%) | 33 (3.5%) |
| $800 to $999 | 174 (6.1%) | 0 (0.0%) |
| $1,000 to $1,499 | 376 (13.2%) | 172 (18.2%) |
| $1,500 to $1,999 | 583 (20.4%) | 512 (54.2%) |
| $2,000 to $2,499 | 366 (12.8%) | 147 (15.6%) |
| $2,500 to $2,999 | 206 (7.2%) | 48 (5.1%) |
| $3,000 or more | 366 (12.8%) | 33 (3.5%) |
| Total | 2,856 (100.0%) | 945 (100.0%) |
Physical Housing Characteristics in White Marsh
Housing Structures in White Marsh
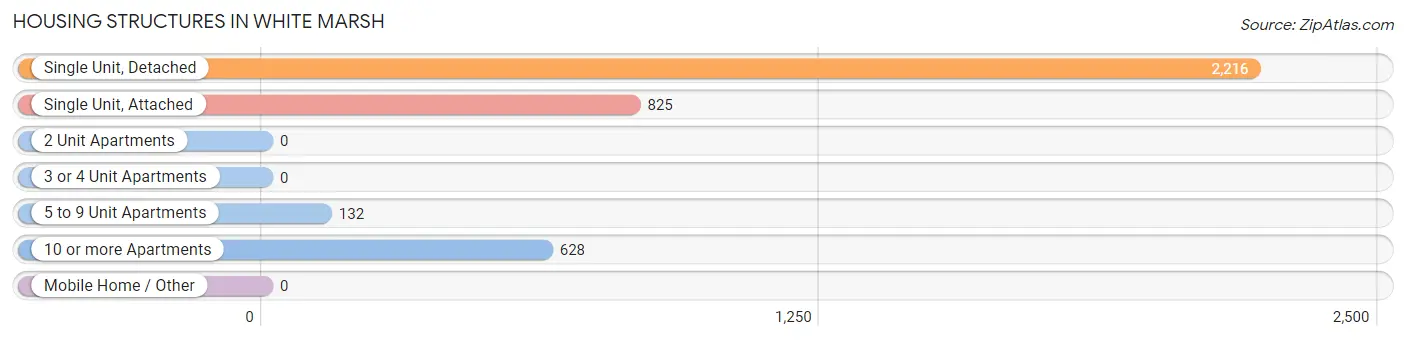
| Structure Type | # Housing Units | % Housing Units |
| Single Unit, Detached | 2,216 | 58.3% |
| Single Unit, Attached | 825 | 21.7% |
| 2 Unit Apartments | 0 | 0.0% |
| 3 or 4 Unit Apartments | 0 | 0.0% |
| 5 to 9 Unit Apartments | 132 | 3.5% |
| 10 or more Apartments | 628 | 16.5% |
| Mobile Home / Other | 0 | 0.0% |
| Total | 3,801 | 100.0% |
Housing Structures by Occupancy in White Marsh
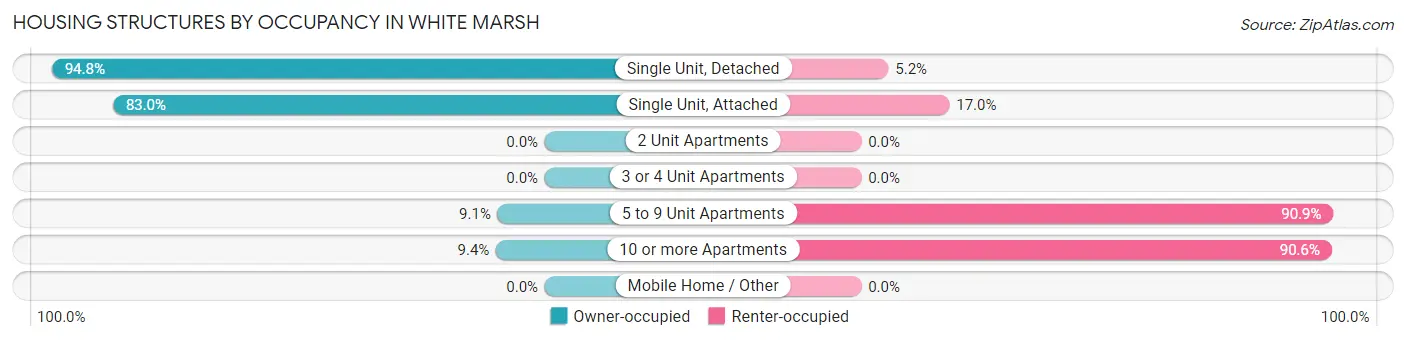
| Structure Type | Owner-occupied | Renter-occupied |
| Single Unit, Detached | 2,100 (94.8%) | 116 (5.2%) |
| Single Unit, Attached | 685 (83.0%) | 140 (17.0%) |
| 2 Unit Apartments | 0 (0.0%) | 0 (0.0%) |
| 3 or 4 Unit Apartments | 0 (0.0%) | 0 (0.0%) |
| 5 to 9 Unit Apartments | 12 (9.1%) | 120 (90.9%) |
| 10 or more Apartments | 59 (9.4%) | 569 (90.6%) |
| Mobile Home / Other | 0 (0.0%) | 0 (0.0%) |
| Total | 2,856 (75.1%) | 945 (24.9%) |
Housing Structures by Number of Rooms in White Marsh
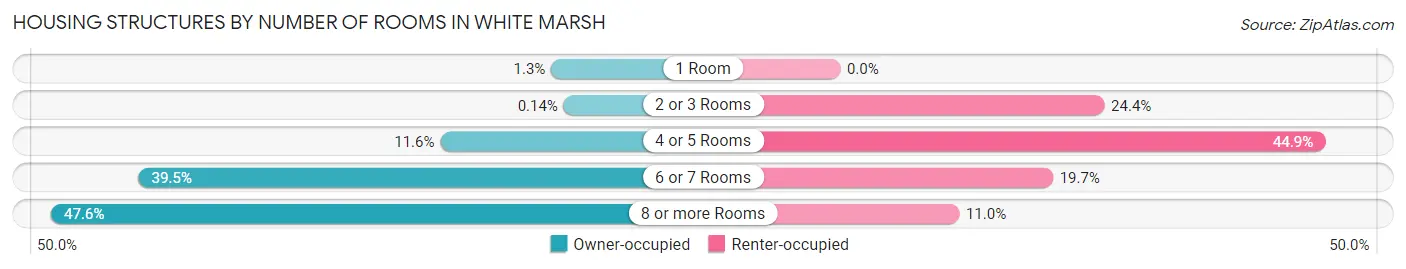
| Number of Rooms | Owner-occupied | Renter-occupied |
| 1 Room | 37 (1.3%) | 0 (0.0%) |
| 2 or 3 Rooms | 4 (0.1%) | 231 (24.4%) |
| 4 or 5 Rooms | 330 (11.6%) | 424 (44.9%) |
| 6 or 7 Rooms | 1,127 (39.5%) | 186 (19.7%) |
| 8 or more Rooms | 1,358 (47.5%) | 104 (11.0%) |
| Total | 2,856 (100.0%) | 945 (100.0%) |
Housing Structure by Heating Type in White Marsh
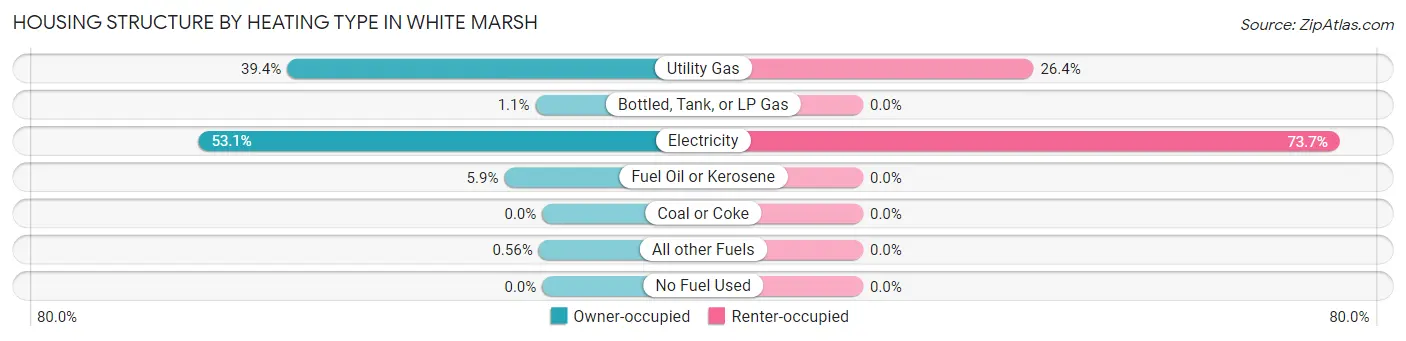
| Heating Type | Owner-occupied | Renter-occupied |
| Utility Gas | 1,126 (39.4%) | 249 (26.4%) |
| Bottled, Tank, or LP Gas | 30 (1.1%) | 0 (0.0%) |
| Electricity | 1,517 (53.1%) | 696 (73.7%) |
| Fuel Oil or Kerosene | 167 (5.9%) | 0 (0.0%) |
| Coal or Coke | 0 (0.0%) | 0 (0.0%) |
| All other Fuels | 16 (0.6%) | 0 (0.0%) |
| No Fuel Used | 0 (0.0%) | 0 (0.0%) |
| Total | 2,856 (100.0%) | 945 (100.0%) |
Household Vehicle Usage in White Marsh
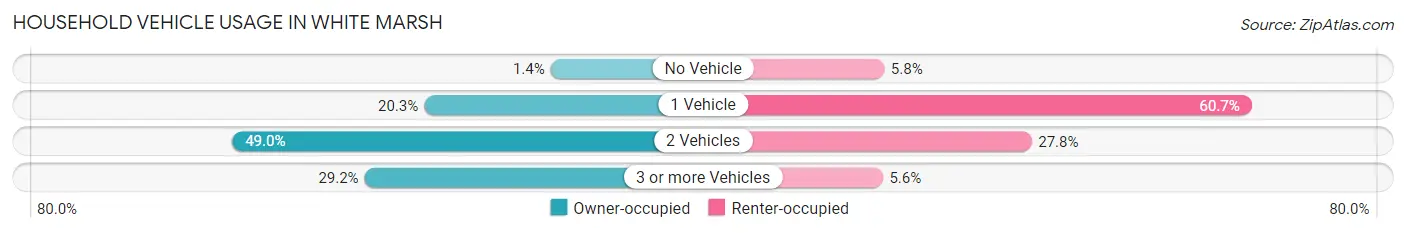
| Vehicles per Household | Owner-occupied | Renter-occupied |
| No Vehicle | 41 (1.4%) | 55 (5.8%) |
| 1 Vehicle | 581 (20.3%) | 574 (60.7%) |
| 2 Vehicles | 1,399 (49.0%) | 263 (27.8%) |
| 3 or more Vehicles | 835 (29.2%) | 53 (5.6%) |
| Total | 2,856 (100.0%) | 945 (100.0%) |
Real Estate & Mortgages in White Marsh
Real Estate and Mortgage Overview in White Marsh
| Characteristic | Without Mortgage | With Mortgage |
| Housing Units | 973 | 1,883 |
| Median Property Value | $365,200 | $365,600 |
| Median Household Income | $108,806 | $807 |
| Monthly Housing Costs | $674 | $366 |
| Real Estate Taxes | $4,308 | $38 |
Property Value by Mortgage Status in White Marsh
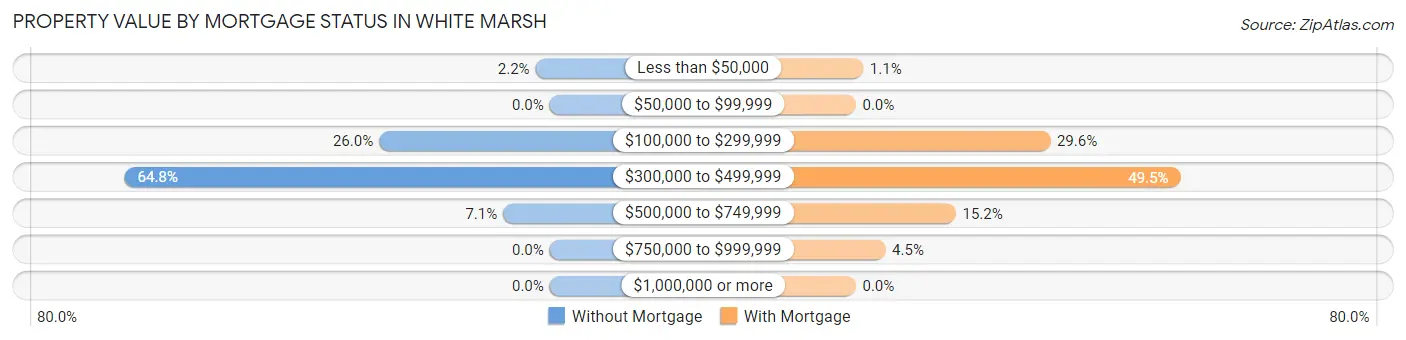
| Property Value | Without Mortgage | With Mortgage |
| Less than $50,000 | 21 (2.2%) | 21 (1.1%) |
| $50,000 to $99,999 | 0 (0.0%) | 0 (0.0%) |
| $100,000 to $299,999 | 253 (26.0%) | 558 (29.6%) |
| $300,000 to $499,999 | 630 (64.7%) | 932 (49.5%) |
| $500,000 to $749,999 | 69 (7.1%) | 287 (15.2%) |
| $750,000 to $999,999 | 0 (0.0%) | 85 (4.5%) |
| $1,000,000 or more | 0 (0.0%) | 0 (0.0%) |
| Total | 973 (100.0%) | 1,883 (100.0%) |
Household Income by Mortgage Status in White Marsh
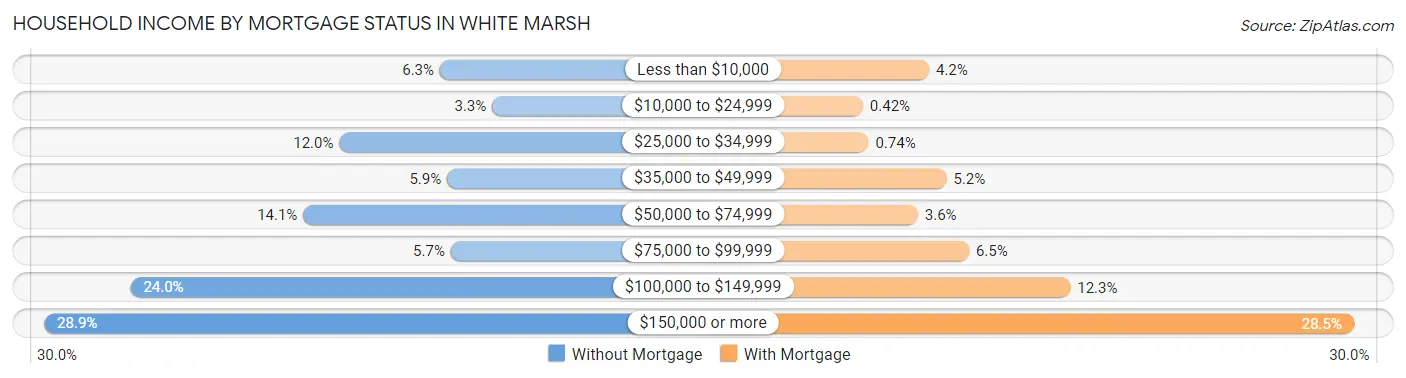
| Household Income | Without Mortgage | With Mortgage |
| Less than $10,000 | 61 (6.3%) | 79 (4.2%) |
| $10,000 to $24,999 | 32 (3.3%) | 8 (0.4%) |
| $25,000 to $34,999 | 117 (12.0%) | 14 (0.7%) |
| $35,000 to $49,999 | 57 (5.9%) | 98 (5.2%) |
| $50,000 to $74,999 | 137 (14.1%) | 67 (3.6%) |
| $75,000 to $99,999 | 55 (5.7%) | 122 (6.5%) |
| $100,000 to $149,999 | 233 (23.9%) | 231 (12.3%) |
| $150,000 or more | 281 (28.9%) | 536 (28.5%) |
| Total | 973 (100.0%) | 1,883 (100.0%) |
Property Value to Household Income Ratio in White Marsh
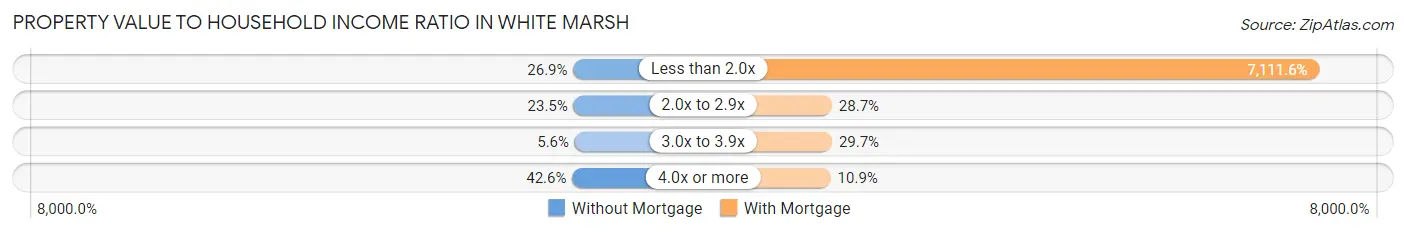
| Value-to-Income Ratio | Without Mortgage | With Mortgage |
| Less than 2.0x | 262 (26.9%) | 133,911 (7,111.6%) |
| 2.0x to 2.9x | 229 (23.5%) | 541 (28.7%) |
| 3.0x to 3.9x | 54 (5.6%) | 560 (29.7%) |
| 4.0x or more | 414 (42.5%) | 205 (10.9%) |
| Total | 973 (100.0%) | 1,883 (100.0%) |
Real Estate Taxes by Mortgage Status in White Marsh
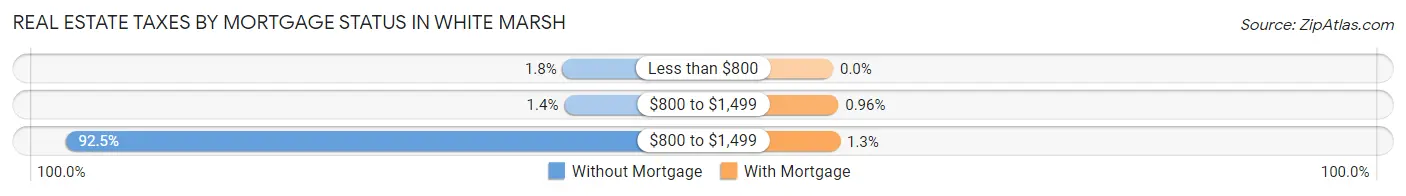
| Property Taxes | Without Mortgage | With Mortgage |
| Less than $800 | 17 (1.8%) | 0 (0.0%) |
| $800 to $1,499 | 14 (1.4%) | 18 (1.0%) |
| $800 to $1,499 | 900 (92.5%) | 24 (1.3%) |
| Total | 973 (100.0%) | 1,883 (100.0%) |
Health & Disability in White Marsh
Health Insurance Coverage by Age in White Marsh
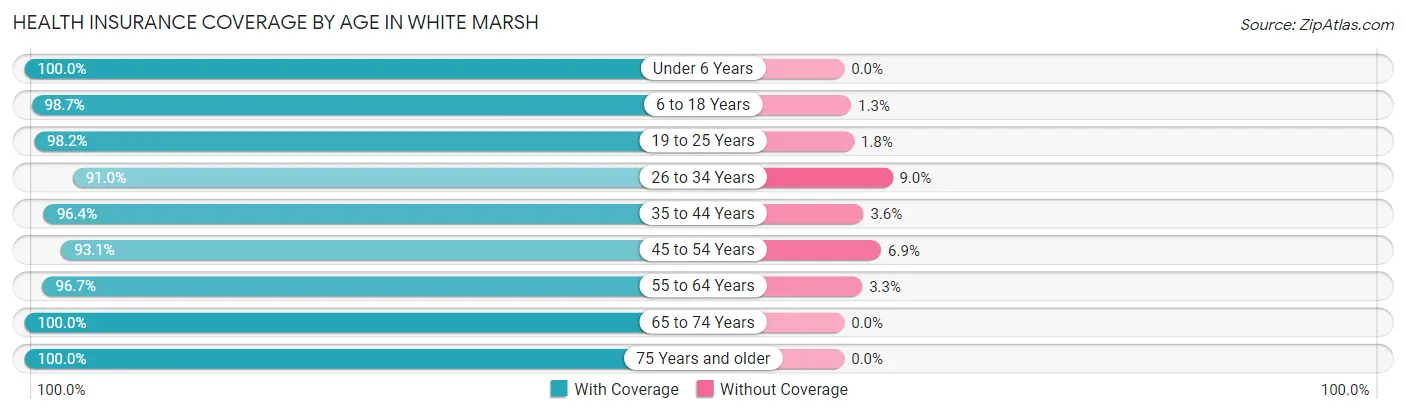
| Age Bracket | With Coverage | Without Coverage |
| Under 6 Years | 440 (100.0%) | 0 (0.0%) |
| 6 to 18 Years | 2,231 (98.7%) | 29 (1.3%) |
| 19 to 25 Years | 715 (98.2%) | 13 (1.8%) |
| 26 to 34 Years | 882 (91.0%) | 87 (9.0%) |
| 35 to 44 Years | 1,647 (96.4%) | 61 (3.6%) |
| 45 to 54 Years | 1,017 (93.1%) | 75 (6.9%) |
| 55 to 64 Years | 1,304 (96.7%) | 45 (3.3%) |
| 65 to 74 Years | 1,057 (100.0%) | 0 (0.0%) |
| 75 Years and older | 679 (100.0%) | 0 (0.0%) |
| Total | 9,972 (97.0%) | 310 (3.0%) |
Health Insurance Coverage by Citizenship Status in White Marsh
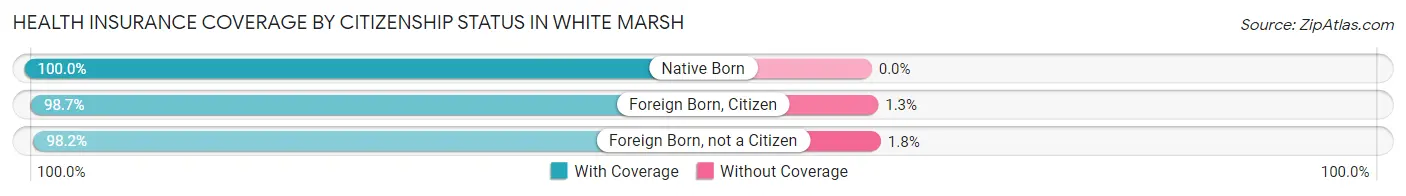
| Citizenship Status | With Coverage | Without Coverage |
| Native Born | 440 (100.0%) | 0 (0.0%) |
| Foreign Born, Citizen | 2,231 (98.7%) | 29 (1.3%) |
| Foreign Born, not a Citizen | 715 (98.2%) | 13 (1.8%) |
Health Insurance Coverage by Household Income in White Marsh
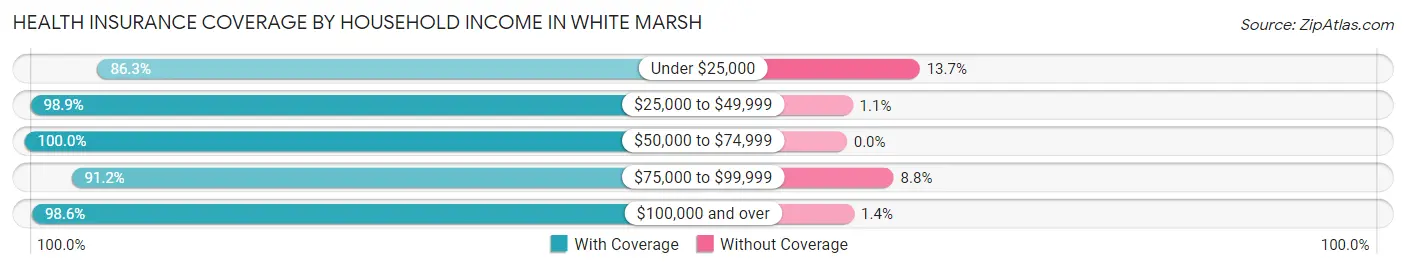
| Household Income | With Coverage | Without Coverage |
| Under $25,000 | 594 (86.3%) | 94 (13.7%) |
| $25,000 to $49,999 | 901 (98.9%) | 10 (1.1%) |
| $50,000 to $74,999 | 663 (100.0%) | 0 (0.0%) |
| $75,000 to $99,999 | 1,163 (91.2%) | 112 (8.8%) |
| $100,000 and over | 6,645 (98.6%) | 93 (1.4%) |
Public vs Private Health Insurance Coverage by Age in White Marsh
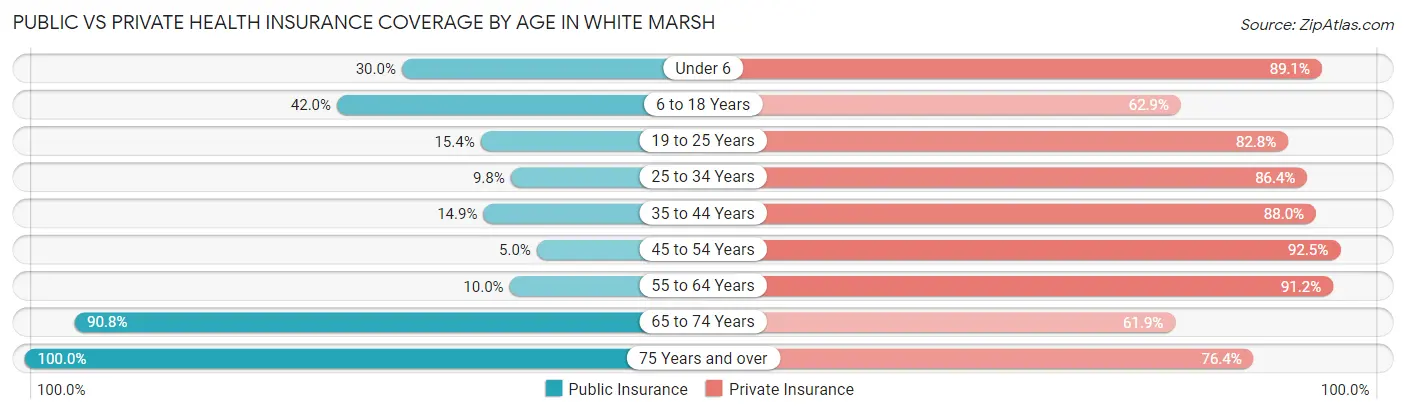
| Age Bracket | Public Insurance | Private Insurance |
| Under 6 | 132 (30.0%) | 392 (89.1%) |
| 6 to 18 Years | 950 (42.0%) | 1,422 (62.9%) |
| 19 to 25 Years | 112 (15.4%) | 603 (82.8%) |
| 25 to 34 Years | 95 (9.8%) | 837 (86.4%) |
| 35 to 44 Years | 254 (14.9%) | 1,503 (88.0%) |
| 45 to 54 Years | 54 (5.0%) | 1,010 (92.5%) |
| 55 to 64 Years | 135 (10.0%) | 1,230 (91.2%) |
| 65 to 74 Years | 960 (90.8%) | 654 (61.9%) |
| 75 Years and over | 679 (100.0%) | 519 (76.4%) |
| Total | 3,371 (32.8%) | 8,170 (79.5%) |
Disability Status by Sex by Age in White Marsh
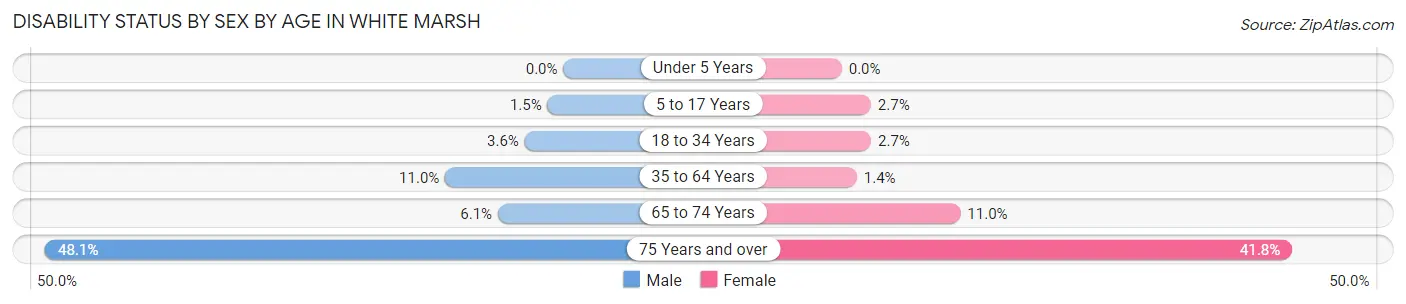
| Age Bracket | Male | Female |
| Under 5 Years | 0 (0.0%) | 0 (0.0%) |
| 5 to 17 Years | 17 (1.5%) | 29 (2.7%) |
| 18 to 34 Years | 33 (3.6%) | 25 (2.7%) |
| 35 to 64 Years | 220 (11.0%) | 30 (1.4%) |
| 65 to 74 Years | 30 (6.1%) | 62 (11.0%) |
| 75 Years and over | 139 (48.1%) | 163 (41.8%) |
Disability Class by Sex by Age in White Marsh
Disability Class: Hearing Difficulty
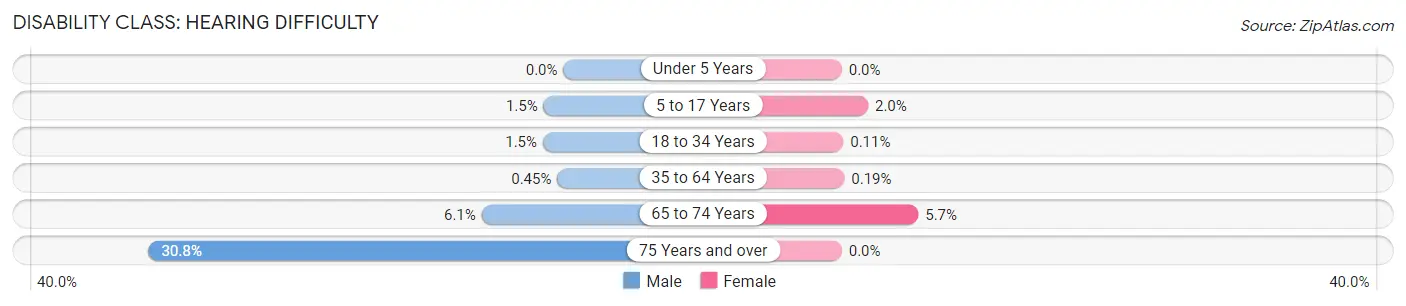
| Age Bracket | Male | Female |
| Under 5 Years | 0 (0.0%) | 0 (0.0%) |
| 5 to 17 Years | 17 (1.5%) | 21 (1.9%) |
| 18 to 34 Years | 14 (1.5%) | 1 (0.1%) |
| 35 to 64 Years | 9 (0.4%) | 4 (0.2%) |
| 65 to 74 Years | 30 (6.1%) | 32 (5.7%) |
| 75 Years and over | 89 (30.8%) | 0 (0.0%) |
Disability Class: Vision Difficulty
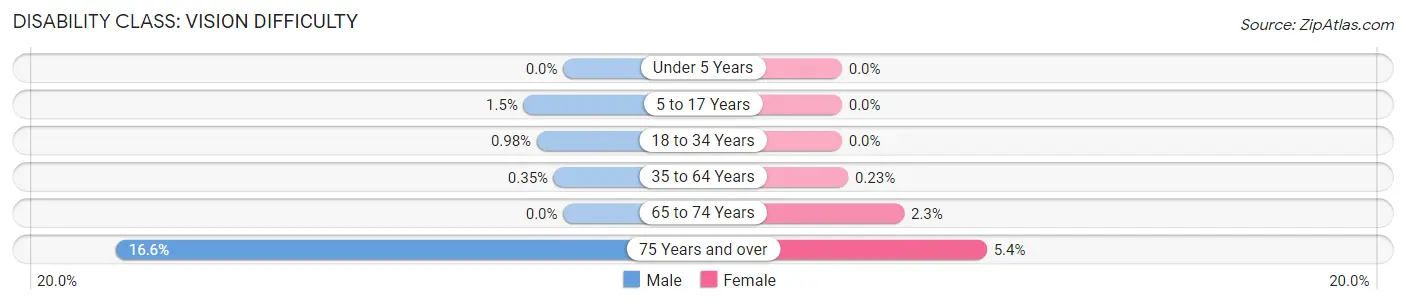
| Age Bracket | Male | Female |
| Under 5 Years | 0 (0.0%) | 0 (0.0%) |
| 5 to 17 Years | 17 (1.5%) | 0 (0.0%) |
| 18 to 34 Years | 9 (1.0%) | 0 (0.0%) |
| 35 to 64 Years | 7 (0.4%) | 5 (0.2%) |
| 65 to 74 Years | 0 (0.0%) | 13 (2.3%) |
| 75 Years and over | 48 (16.6%) | 21 (5.4%) |
Disability Class: Cognitive Difficulty
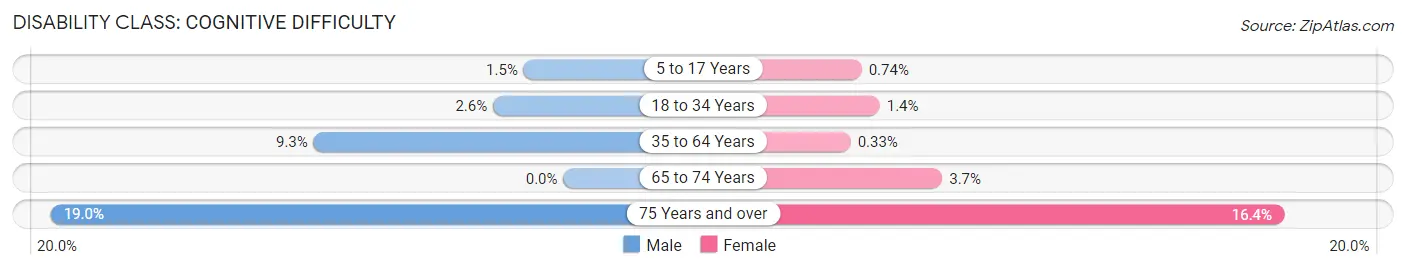
| Age Bracket | Male | Female |
| 5 to 17 Years | 17 (1.5%) | 8 (0.7%) |
| 18 to 34 Years | 24 (2.6%) | 13 (1.4%) |
| 35 to 64 Years | 186 (9.3%) | 7 (0.3%) |
| 65 to 74 Years | 0 (0.0%) | 21 (3.7%) |
| 75 Years and over | 55 (19.0%) | 64 (16.4%) |
Disability Class: Ambulatory Difficulty
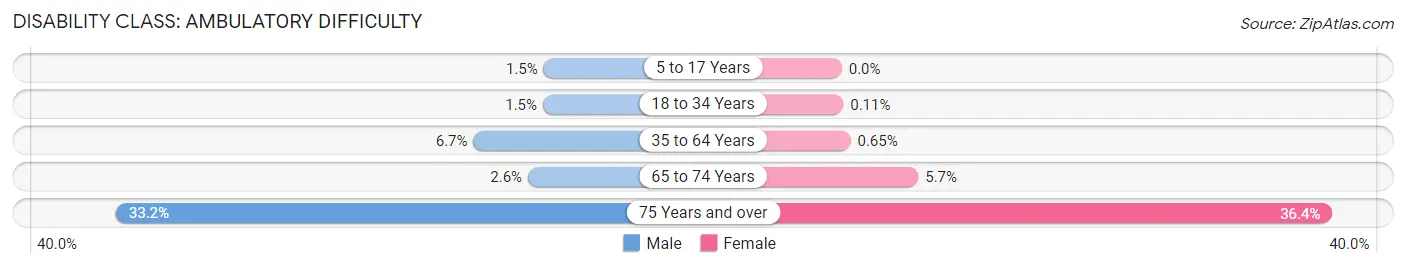
| Age Bracket | Male | Female |
| 5 to 17 Years | 17 (1.5%) | 0 (0.0%) |
| 18 to 34 Years | 14 (1.5%) | 1 (0.1%) |
| 35 to 64 Years | 134 (6.7%) | 14 (0.6%) |
| 65 to 74 Years | 13 (2.6%) | 32 (5.7%) |
| 75 Years and over | 96 (33.2%) | 142 (36.4%) |
Disability Class: Self-Care Difficulty
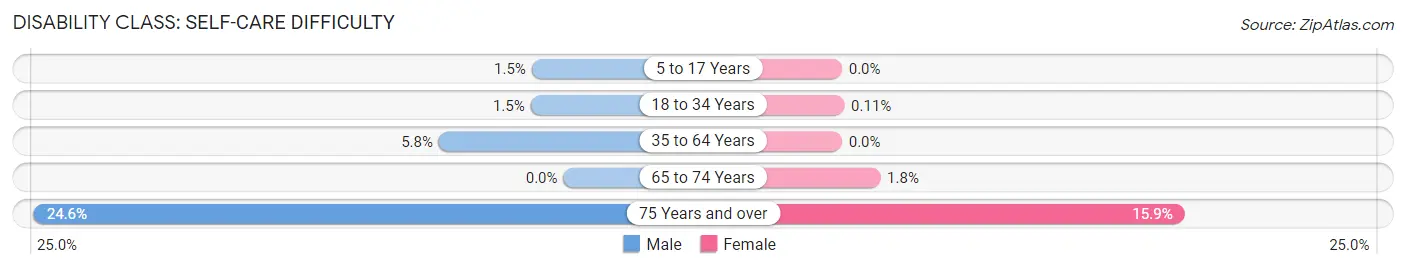
| Age Bracket | Male | Female |
| 5 to 17 Years | 17 (1.5%) | 0 (0.0%) |
| 18 to 34 Years | 14 (1.5%) | 1 (0.1%) |
| 35 to 64 Years | 116 (5.8%) | 0 (0.0%) |
| 65 to 74 Years | 0 (0.0%) | 10 (1.8%) |
| 75 Years and over | 71 (24.6%) | 62 (15.9%) |
Technology Access in White Marsh
Computing Device Access in White Marsh
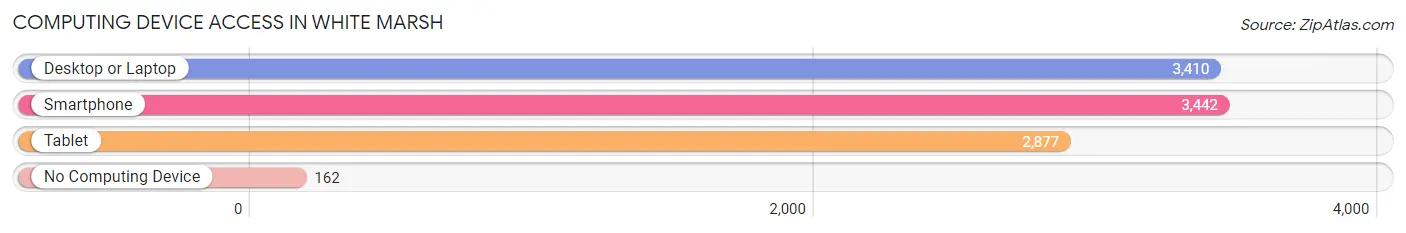
| Device Type | # Households | % Households |
| Desktop or Laptop | 3,410 | 89.7% |
| Smartphone | 3,442 | 90.6% |
| Tablet | 2,877 | 75.7% |
| No Computing Device | 162 | 4.3% |
| Total | 3,801 | 100.0% |
Internet Access in White Marsh
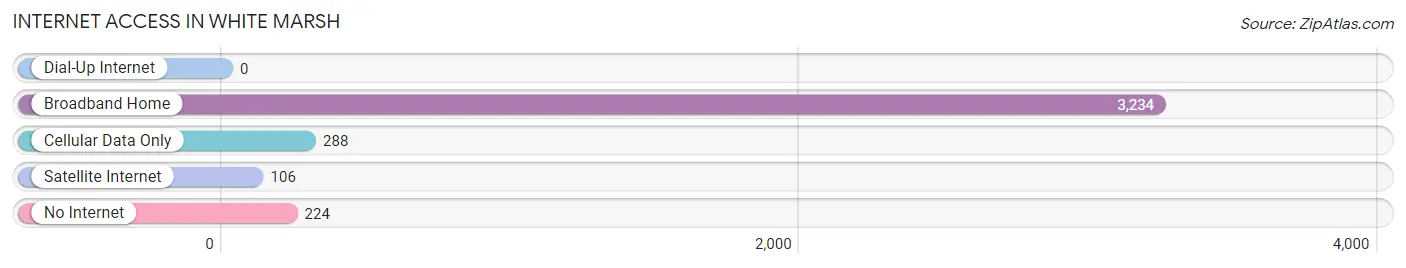
| Internet Type | # Households | % Households |
| Dial-Up Internet | 0 | 0.0% |
| Broadband Home | 3,234 | 85.1% |
| Cellular Data Only | 288 | 7.6% |
| Satellite Internet | 106 | 2.8% |
| No Internet | 224 | 5.9% |
| Total | 3,801 | 100.0% |
White Marsh Summary
History
White Marsh is an unincorporated community located in Baltimore County, Maryland. It is located approximately 15 miles northeast of downtown Baltimore and is part of the greater Baltimore metropolitan area. The area was first settled in the late 1700s by German and English immigrants, and the community was officially established in 1812.
The area was originally known as White Marsh Crossroads, and the name was changed to White Marsh in 1868. The name is derived from the white marsh marigolds that grew in the area. The area was primarily agricultural until the 1950s, when the construction of the White Marsh Mall and the nearby Interstate 95 corridor spurred development.
Geography
White Marsh is located in Baltimore County, Maryland, approximately 15 miles northeast of downtown Baltimore. It is part of the greater Baltimore metropolitan area. The area is bordered by the Gunpowder River to the north, the Back River to the east, and the Middle River to the south. The area is mostly flat, with some rolling hills.
The climate in White Marsh is humid subtropical, with hot, humid summers and mild winters. The average annual temperature is around 60 degrees Fahrenheit, with an average high of around 80 degrees in the summer and an average low of around 40 degrees in the winter.
Economy
White Marsh is primarily a residential community, but it is also home to a number of businesses and industries. The White Marsh Mall is the largest shopping center in the area, and it is home to a variety of stores, restaurants, and entertainment venues. The area is also home to a number of corporate offices, including those of Verizon, T. Rowe Price, and McCormick & Company.
The area is also home to a number of manufacturing and industrial businesses, including the White Marsh Industrial Park. The park is home to a variety of businesses, including a Coca-Cola bottling plant, a UPS distribution center, and a number of other businesses.
Demographics
As of the 2010 census, the population of White Marsh was 28,811. The population is primarily white (83.3%), with smaller percentages of African Americans (7.7%), Asians (4.2%), and Hispanics (3.2%). The median household income is $77,845, and the median home value is $310,000.
White Marsh is served by the Baltimore County Public Schools system. The area is home to a number of public schools, including White Marsh Elementary School, Perry Hall Middle School, and Perry Hall High School. The area is also home to a number of private schools, including St. Joseph's Catholic School and St. Paul's Lutheran School.
Conclusion
White Marsh is an unincorporated community located in Baltimore County, Maryland. It is located approximately 15 miles northeast of downtown Baltimore and is part of the greater Baltimore metropolitan area. The area was first settled in the late 1700s by German and English immigrants, and the community was officially established in 1812. The area is primarily residential, but it is also home to a number of businesses and industries, including the White Marsh Mall and the White Marsh Industrial Park. The population of White Marsh is primarily white, with smaller percentages of African Americans, Asians, and Hispanics. The area is served by the Baltimore County Public Schools system, as well as a number of private schools.
Common Questions
What is Per Capita Income in White Marsh?
Per Capita income in White Marsh is $46,661.
What is the Median Family Income in White Marsh?
Median Family Income in White Marsh is $133,010.
What is the Median Household income in White Marsh?
Median Household Income in White Marsh is $109,435.
What is Income or Wage Gap in White Marsh?
Income or Wage Gap in White Marsh is 11.5%.
Women in White Marsh earn 88.5 cents for every dollar earned by a man.
What is Inequality or Gini Index in White Marsh?
Inequality or Gini Index in White Marsh is 0.38.
What is the Total Population of White Marsh?
Total Population of White Marsh is 10,337.
What is the Total Male Population of White Marsh?
Total Male Population of White Marsh is 5,062.
What is the Total Female Population of White Marsh?
Total Female Population of White Marsh is 5,275.
What is the Ratio of Males per 100 Females in White Marsh?
There are 95.96 Males per 100 Females in White Marsh.
What is the Ratio of Females per 100 Males in White Marsh?
There are 104.21 Females per 100 Males in White Marsh.
What is the Median Population Age in White Marsh?
Median Population Age in White Marsh is 39.8 Years.
What is the Average Family Size in White Marsh
Average Family Size in White Marsh is 3.2 People.
What is the Average Household Size in White Marsh
Average Household Size in White Marsh is 2.7 People.
How Large is the Labor Force in White Marsh?
There are 5,631 People in the Labor Forcein in White Marsh.
What is the Percentage of People in the Labor Force in White Marsh?
69.3% of People are in the Labor Force in White Marsh.
What is the Unemployment Rate in White Marsh?
Unemployment Rate in White Marsh is 2.2%.