Taneytown, MD Map & Demographics
Taneytown Map
Taneytown Overview
$36,589
PER CAPITA INCOME
$101,823
AVG FAMILY INCOME
$78,333
AVG HOUSEHOLD INCOME
23.7%
WAGE / INCOME GAP [ % ]
76.3¢/ $1
WAGE / INCOME GAP [ $ ]
$17,848
FAMILY INCOME DEFICIT
0.41
INEQUALITY / GINI INDEX
7,234
TOTAL POPULATION
3,447
MALE POPULATION
3,787
FEMALE POPULATION
91.02
MALES / 100 FEMALES
109.86
FEMALES / 100 MALES
38.7
MEDIAN AGE
3.2
AVG FAMILY SIZE
2.6
AVG HOUSEHOLD SIZE
3,278
LABOR FORCE [ PEOPLE ]
59.5%
PERCENT IN LABOR FORCE
4.2%
UNEMPLOYMENT RATE
Taneytown Zip Codes
Income in Taneytown
Income Overview in Taneytown
Per Capita Income in Taneytown is $36,589, while median incomes of families and households are $101,823 and $78,333 respectively.
| Characteristic | Number | Measure |
| Per Capita Income | 7,234 | $36,589 |
| Median Family Income | 1,870 | $101,823 |
| Mean Family Income | 1,870 | $113,157 |
| Median Household Income | 2,792 | $78,333 |
| Mean Household Income | 2,792 | $93,745 |
| Income Deficit | 1,870 | $17,848 |
| Wage / Income Gap (%) | 7,234 | 23.74% |
| Wage / Income Gap ($) | 7,234 | 76.26¢ per $1 |
| Gini / Inequality Index | 7,234 | 0.41 |
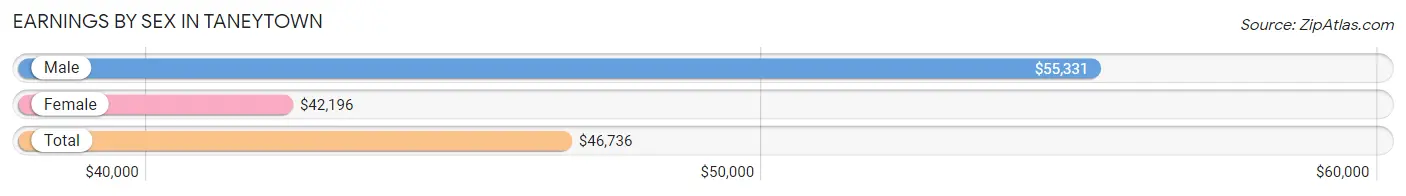
Earnings by Sex in Taneytown
Average Earnings in Taneytown are $46,736, $55,331 for men and $42,196 for women, a difference of 23.7%.
| Sex | Number | Average Earnings |
| Male | 1,809 (54.9%) | $55,331 |
| Female | 1,485 (45.1%) | $42,196 |
| Total | 3,294 (100.0%) | $46,736 |
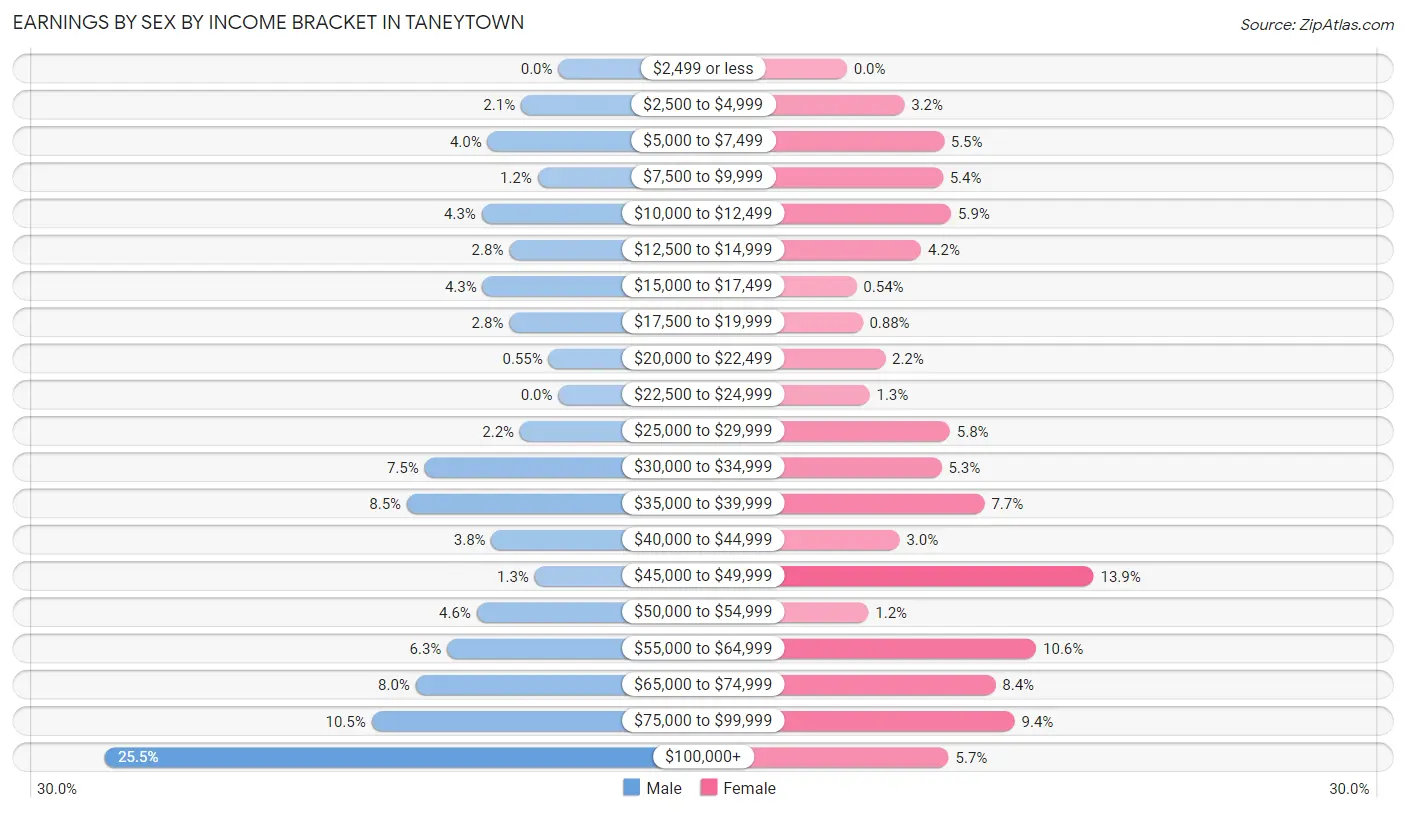
Earnings by Sex by Income Bracket in Taneytown
The most common earnings brackets in Taneytown are $100,000+ for men (461 | 25.5%) and $45,000 to $49,999 for women (206 | 13.9%).
| Income | Male | Female |
| $2,499 or less | 0 (0.0%) | 0 (0.0%) |
| $2,500 to $4,999 | 38 (2.1%) | 48 (3.2%) |
| $5,000 to $7,499 | 72 (4.0%) | 81 (5.4%) |
| $7,500 to $9,999 | 21 (1.2%) | 80 (5.4%) |
| $10,000 to $12,499 | 78 (4.3%) | 87 (5.9%) |
| $12,500 to $14,999 | 50 (2.8%) | 62 (4.2%) |
| $15,000 to $17,499 | 77 (4.3%) | 8 (0.5%) |
| $17,500 to $19,999 | 50 (2.8%) | 13 (0.9%) |
| $20,000 to $22,499 | 10 (0.5%) | 32 (2.1%) |
| $22,500 to $24,999 | 0 (0.0%) | 19 (1.3%) |
| $25,000 to $29,999 | 39 (2.2%) | 86 (5.8%) |
| $30,000 to $34,999 | 136 (7.5%) | 79 (5.3%) |
| $35,000 to $39,999 | 154 (8.5%) | 115 (7.7%) |
| $40,000 to $44,999 | 68 (3.8%) | 44 (3.0%) |
| $45,000 to $49,999 | 24 (1.3%) | 206 (13.9%) |
| $50,000 to $54,999 | 83 (4.6%) | 18 (1.2%) |
| $55,000 to $64,999 | 113 (6.2%) | 158 (10.6%) |
| $65,000 to $74,999 | 145 (8.0%) | 124 (8.4%) |
| $75,000 to $99,999 | 190 (10.5%) | 140 (9.4%) |
| $100,000+ | 461 (25.5%) | 85 (5.7%) |
| Total | 1,809 (100.0%) | 1,485 (100.0%) |
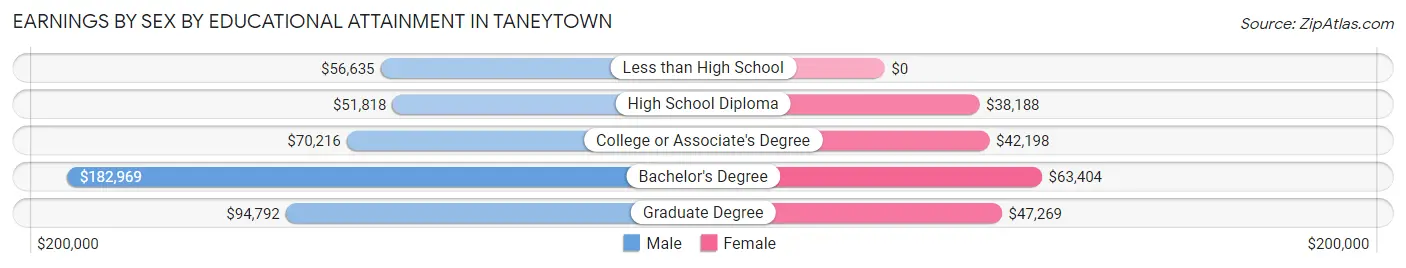
Earnings by Sex by Educational Attainment in Taneytown
Average earnings in Taneytown are $68,487 for men and $46,537 for women, a difference of 32.1%. Men with an educational attainment of bachelor's degree enjoy the highest average annual earnings of $182,969, while those with high school diploma education earn the least with $51,818. Women with an educational attainment of bachelor's degree earn the most with the average annual earnings of $63,404, while those with high school diploma education have the smallest earnings of $38,188.
| Educational Attainment | Male Income | Female Income |
| Less than High School | $56,635 | $0 |
| High School Diploma | $51,818 | $38,188 |
| College or Associate's Degree | $70,216 | $42,198 |
| Bachelor's Degree | $182,969 | $63,404 |
| Graduate Degree | $94,792 | $47,269 |
| Total | $68,487 | $46,537 |
Family Income in Taneytown
Family Income Brackets in Taneytown
According to the Taneytown family income data, there are 525 families falling into the $100,000 to $149,999 income range, which is the most common income bracket and makes up 28.1% of all families.
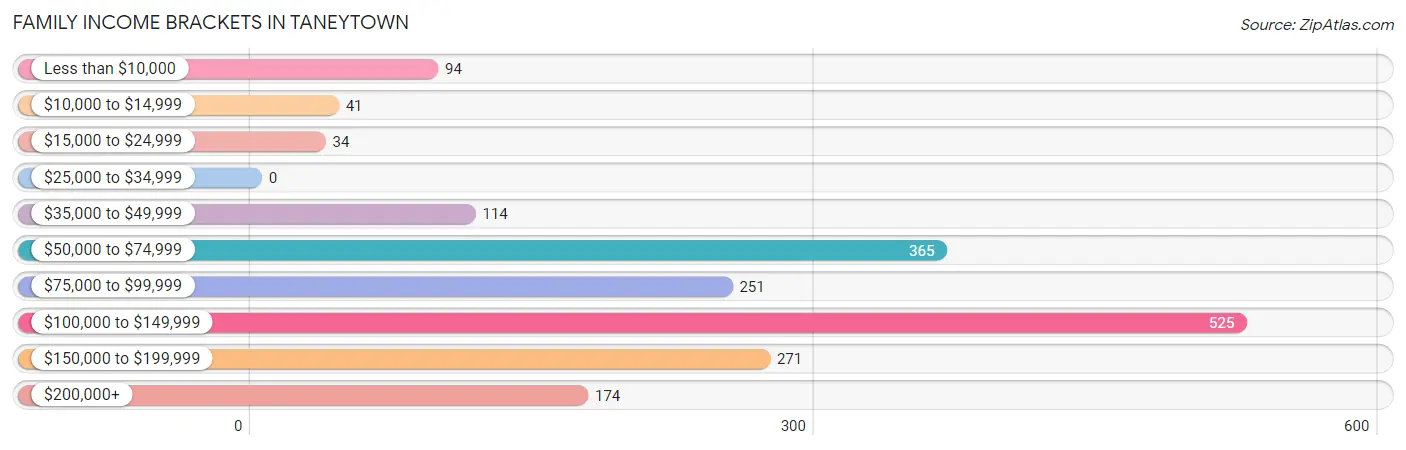
| Income Bracket | # Families | % Families |
| Less than $10,000 | 94 | 5.0% |
| $10,000 to $14,999 | 41 | 2.2% |
| $15,000 to $24,999 | 34 | 1.8% |
| $25,000 to $34,999 | 0 | 0.0% |
| $35,000 to $49,999 | 114 | 6.1% |
| $50,000 to $74,999 | 365 | 19.5% |
| $75,000 to $99,999 | 251 | 13.4% |
| $100,000 to $149,999 | 525 | 28.1% |
| $150,000 to $199,999 | 271 | 14.5% |
| $200,000+ | 174 | 9.3% |
Family Income by Famaliy Size in Taneytown
3-person families (461 | 24.6%) account for the highest median family income in Taneytown with $132,981 per family, while 2-person families (798 | 42.7%) have the highest median income of $45,990 per family member.
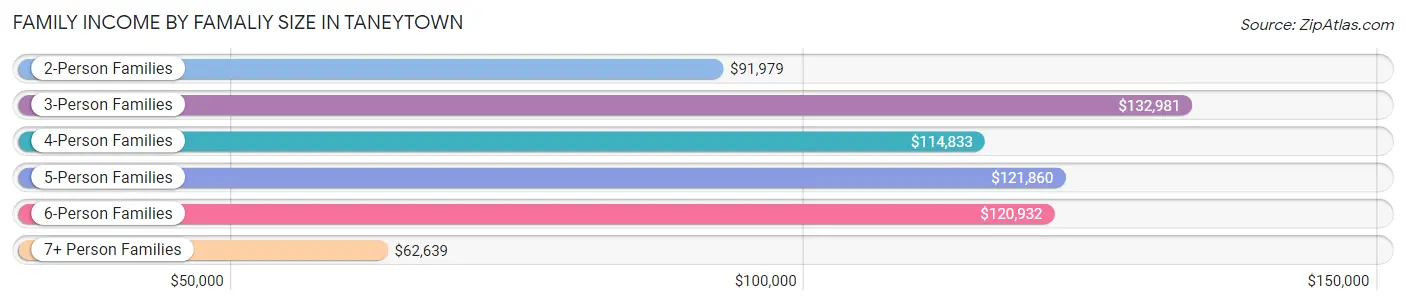
| Income Bracket | # Families | Median Income |
| 2-Person Families | 798 (42.7%) | $91,979 |
| 3-Person Families | 461 (24.6%) | $132,981 |
| 4-Person Families | 314 (16.8%) | $114,833 |
| 5-Person Families | 133 (7.1%) | $121,860 |
| 6-Person Families | 105 (5.6%) | $120,932 |
| 7+ Person Families | 59 (3.2%) | $62,639 |
| Total | 1,870 (100.0%) | $101,823 |
Family Income by Number of Earners in Taneytown
The median family income in Taneytown is $101,823, with families comprising 3+ earners (132) having the highest median family income of $250,001, while families with 1 earner (752) have the lowest median family income of $69,500, accounting for 7.1% and 40.2% of families, respectively.
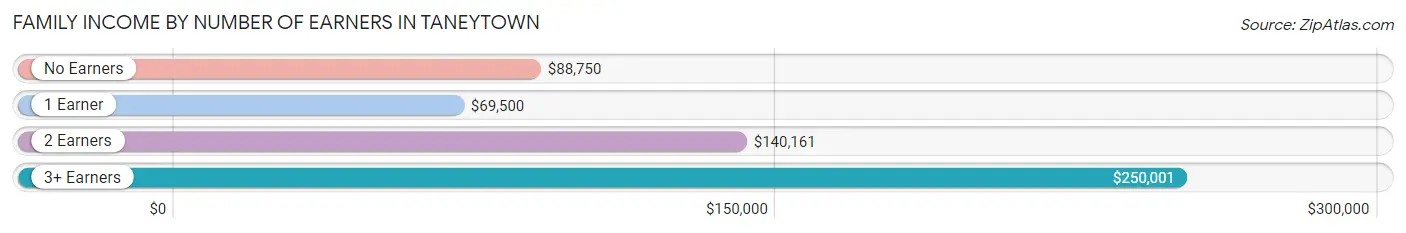
| Number of Earners | # Families | Median Income |
| No Earners | 264 (14.1%) | $88,750 |
| 1 Earner | 752 (40.2%) | $69,500 |
| 2 Earners | 722 (38.6%) | $140,161 |
| 3+ Earners | 132 (7.1%) | $250,001 |
| Total | 1,870 (100.0%) | $101,823 |
Household Income in Taneytown
Household Income Brackets in Taneytown
With 606 households falling in the category, the $100,000 to $149,999 income range is the most frequent in Taneytown, accounting for 21.7% of all households. In contrast, only 39 households (1.4%) fall into the $10,000 to $14,999 income bracket, making it the least populous group.
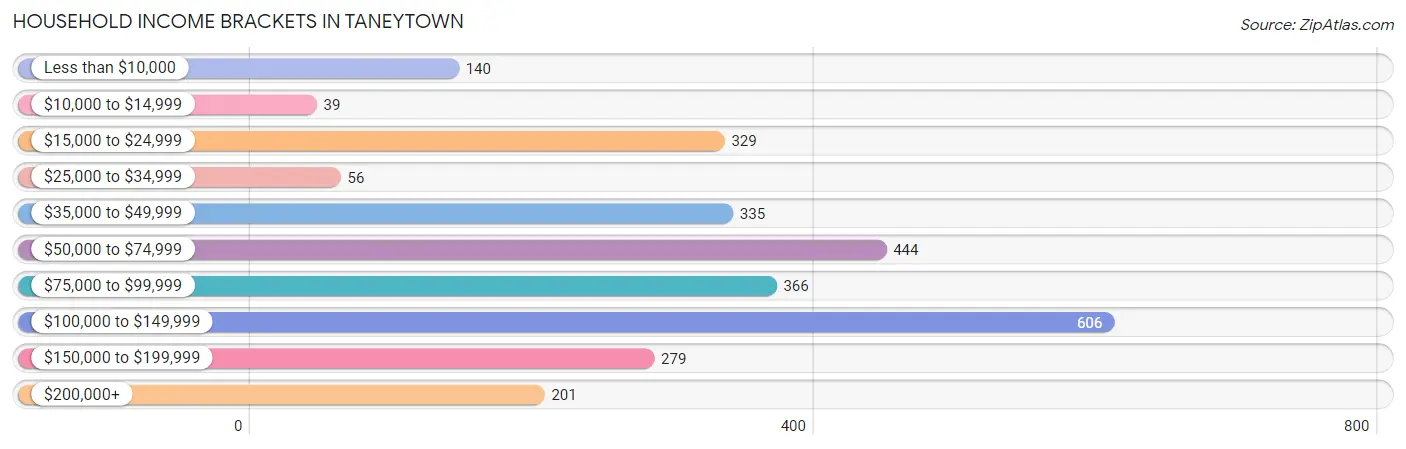
| Income Bracket | # Households | % Households |
| Less than $10,000 | 140 | 5.0% |
| $10,000 to $14,999 | 39 | 1.4% |
| $15,000 to $24,999 | 329 | 11.8% |
| $25,000 to $34,999 | 56 | 2.0% |
| $35,000 to $49,999 | 335 | 12.0% |
| $50,000 to $74,999 | 444 | 15.9% |
| $75,000 to $99,999 | 366 | 13.1% |
| $100,000 to $149,999 | 606 | 21.7% |
| $150,000 to $199,999 | 279 | 10.0% |
| $200,000+ | 201 | 7.2% |
Household Income by Householder Age in Taneytown
The median household income in Taneytown is $78,333, with the highest median household income of $103,333 found in the 45 to 64 years age bracket for the primary householder. A total of 990 households (35.5%) fall into this category. Meanwhile, the 65+ years age bracket for the primary householder has the lowest median household income of $46,683, with 946 households (33.9%) in this group.
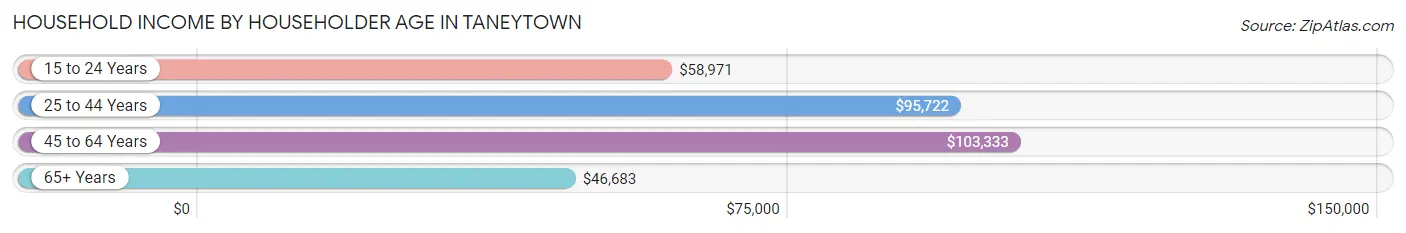
| Income Bracket | # Households | Median Income |
| 15 to 24 Years | 138 (4.9%) | $58,971 |
| 25 to 44 Years | 718 (25.7%) | $95,722 |
| 45 to 64 Years | 990 (35.5%) | $103,333 |
| 65+ Years | 946 (33.9%) | $46,683 |
| Total | 2,792 (100.0%) | $78,333 |
Poverty in Taneytown
Income Below Poverty by Sex and Age in Taneytown
With 6.2% poverty level for males and 14.7% for females among the residents of Taneytown, 18 to 24 year old males and 6 to 11 year old females are the most vulnerable to poverty, with 69 males (21.0%) and 154 females (38.3%) in their respective age groups living below the poverty level.
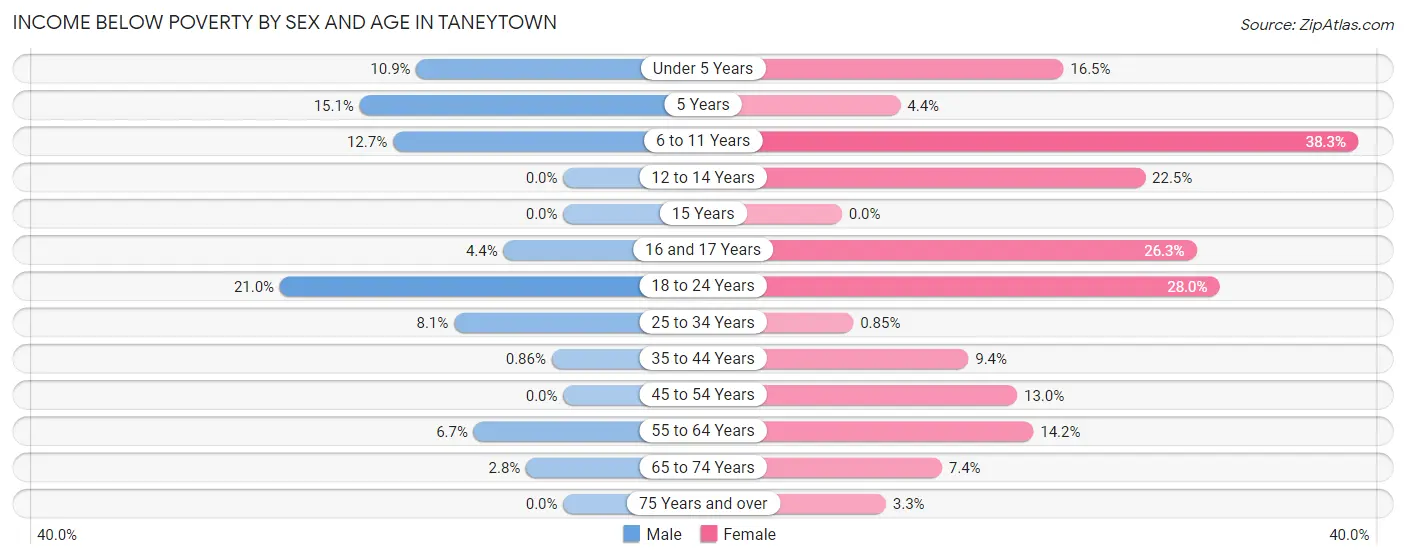
| Age Bracket | Male | Female |
| Under 5 Years | 24 (10.9%) | 38 (16.5%) |
| 5 Years | 13 (15.1%) | 3 (4.3%) |
| 6 to 11 Years | 32 (12.7%) | 154 (38.3%) |
| 12 to 14 Years | 0 (0.0%) | 34 (22.5%) |
| 15 Years | 0 (0.0%) | 0 (0.0%) |
| 16 and 17 Years | 2 (4.4%) | 30 (26.3%) |
| 18 to 24 Years | 69 (21.0%) | 81 (28.0%) |
| 25 to 34 Years | 33 (8.1%) | 3 (0.9%) |
| 35 to 44 Years | 3 (0.9%) | 37 (9.4%) |
| 45 to 54 Years | 0 (0.0%) | 61 (13.0%) |
| 55 to 64 Years | 24 (6.7%) | 66 (14.2%) |
| 65 to 74 Years | 14 (2.8%) | 33 (7.4%) |
| 75 Years and over | 0 (0.0%) | 9 (3.3%) |
| Total | 214 (6.2%) | 549 (14.7%) |
Income Above Poverty by Sex and Age in Taneytown
According to the poverty statistics in Taneytown, males aged 12 to 14 years and females aged 15 years are the age groups that are most secure financially, with 100.0% of males and 100.0% of females in these age groups living above the poverty line.
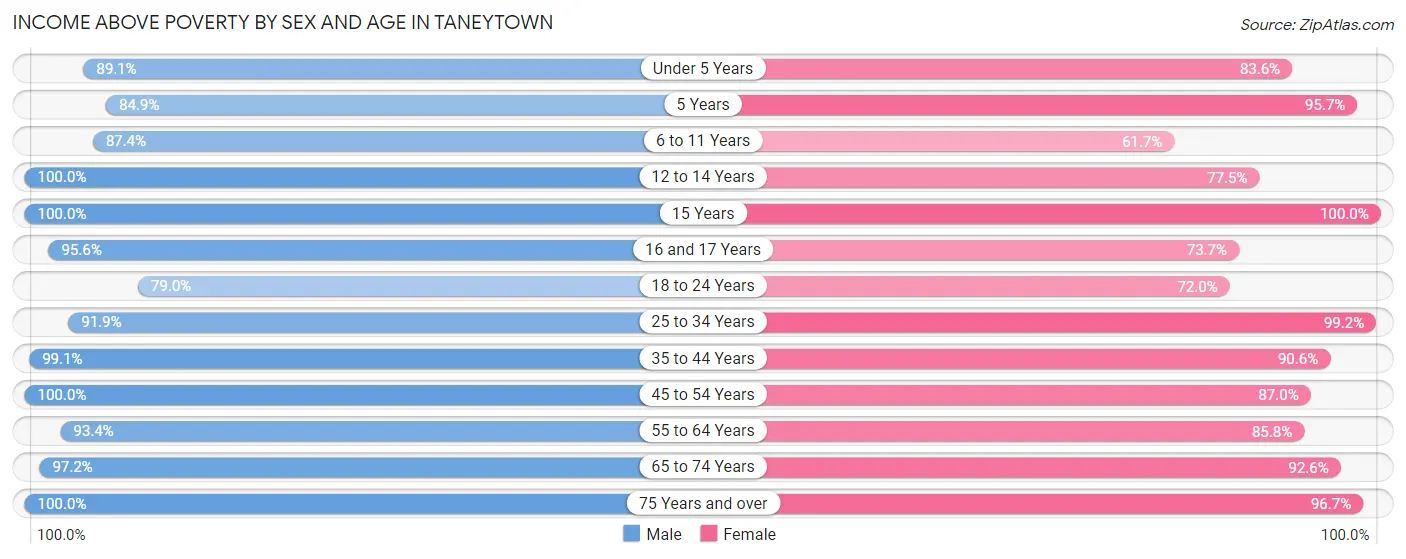
| Age Bracket | Male | Female |
| Under 5 Years | 196 (89.1%) | 193 (83.6%) |
| 5 Years | 73 (84.9%) | 66 (95.7%) |
| 6 to 11 Years | 221 (87.4%) | 248 (61.7%) |
| 12 to 14 Years | 130 (100.0%) | 117 (77.5%) |
| 15 Years | 93 (100.0%) | 80 (100.0%) |
| 16 and 17 Years | 43 (95.6%) | 84 (73.7%) |
| 18 to 24 Years | 259 (79.0%) | 208 (72.0%) |
| 25 to 34 Years | 374 (91.9%) | 350 (99.2%) |
| 35 to 44 Years | 347 (99.1%) | 357 (90.6%) |
| 45 to 54 Years | 376 (100.0%) | 408 (87.0%) |
| 55 to 64 Years | 337 (93.3%) | 398 (85.8%) |
| 65 to 74 Years | 494 (97.2%) | 411 (92.6%) |
| 75 Years and over | 265 (100.0%) | 266 (96.7%) |
| Total | 3,208 (93.8%) | 3,186 (85.3%) |
Income Below Poverty Among Married-Couple Families in Taneytown
The poverty statistics for married-couple families in Taneytown show that 2.5% or 36 of the total 1,429 families live below the poverty line. Families with 3 or 4 children have the highest poverty rate of 6.1%, comprising of 10 families. On the other hand, families with 1 or 2 children have the lowest poverty rate of 0.0%, which includes 0 families.
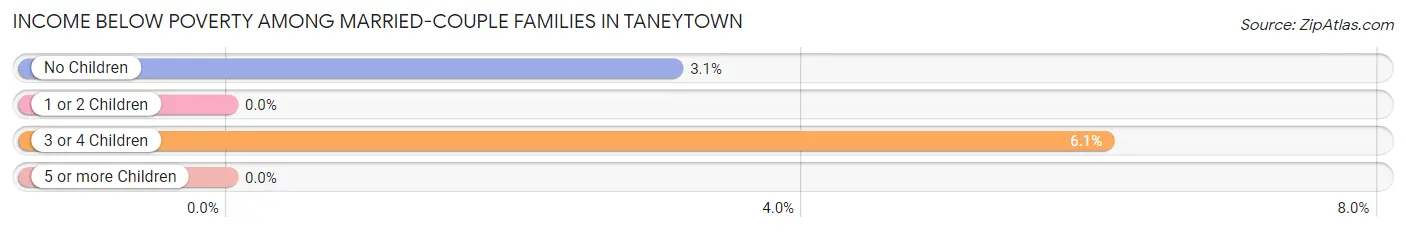
| Children | Above Poverty | Below Poverty |
| No Children | 813 (96.9%) | 26 (3.1%) |
| 1 or 2 Children | 380 (100.0%) | 0 (0.0%) |
| 3 or 4 Children | 154 (93.9%) | 10 (6.1%) |
| 5 or more Children | 46 (100.0%) | 0 (0.0%) |
| Total | 1,393 (97.5%) | 36 (2.5%) |
Income Below Poverty Among Single-Parent Households in Taneytown
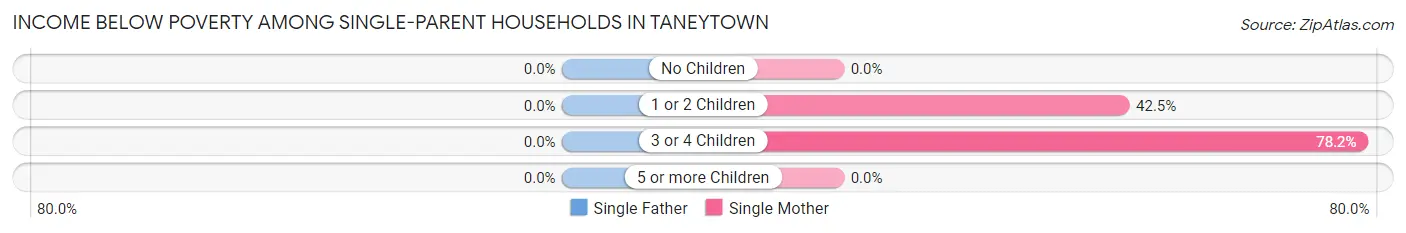
| Children | Single Father | Single Mother |
| No Children | 0 (0.0%) | 0 (0.0%) |
| 1 or 2 Children | 0 (0.0%) | 74 (42.5%) |
| 3 or 4 Children | 0 (0.0%) | 43 (78.2%) |
| 5 or more Children | 0 (0.0%) | 0 (0.0%) |
| Total | 0 (0.0%) | 117 (34.2%) |
Income Below Poverty Among Married-Couple vs Single-Parent Households in Taneytown
The poverty data for Taneytown shows that 36 of the married-couple family households (2.5%) and 117 of the single-parent households (26.5%) are living below the poverty level. Within the married-couple family households, those with 3 or 4 children have the highest poverty rate, with 10 households (6.1%) falling below the poverty line. Among the single-parent households, those with 3 or 4 children have the highest poverty rate, with 43 household (78.2%) living below poverty.
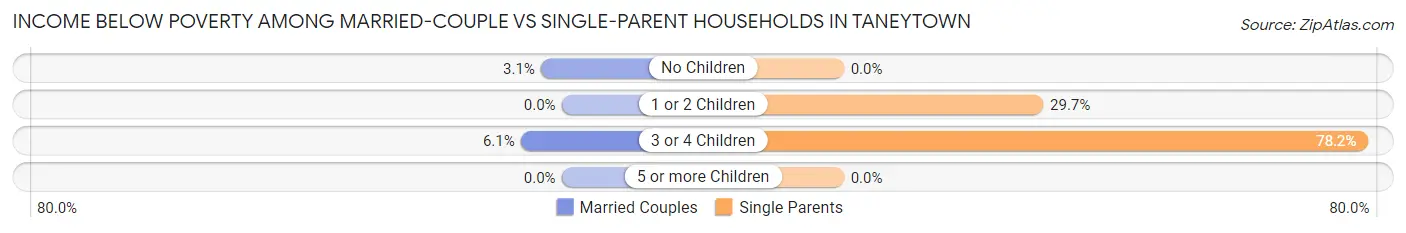
| Children | Married-Couple Families | Single-Parent Households |
| No Children | 26 (3.1%) | 0 (0.0%) |
| 1 or 2 Children | 0 (0.0%) | 74 (29.7%) |
| 3 or 4 Children | 10 (6.1%) | 43 (78.2%) |
| 5 or more Children | 0 (0.0%) | 0 (0.0%) |
| Total | 36 (2.5%) | 117 (26.5%) |
Race in Taneytown
The most populous races in Taneytown are White / Caucasian (6,262 | 86.6%), Black / African American (712 | 9.8%), and Hispanic or Latino (197 | 2.7%).
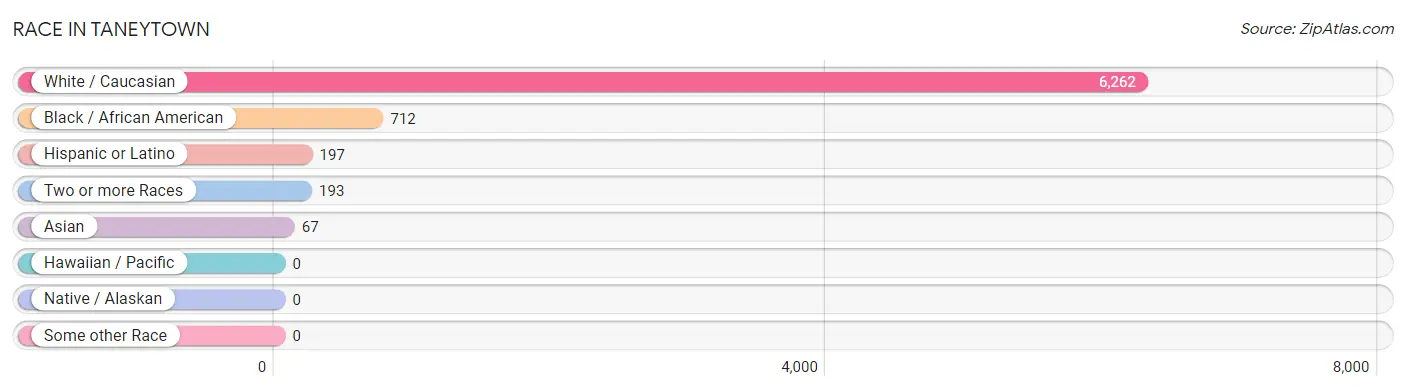
| Race | # Population | % Population |
| Asian | 67 | 0.9% |
| Black / African American | 712 | 9.8% |
| Hawaiian / Pacific | 0 | 0.0% |
| Hispanic or Latino | 197 | 2.7% |
| Native / Alaskan | 0 | 0.0% |
| White / Caucasian | 6,262 | 86.6% |
| Two or more Races | 193 | 2.7% |
| Some other Race | 0 | 0.0% |
| Total | 7,234 | 100.0% |
Ancestry in Taneytown
The most populous ancestries reported in Taneytown are American (1,298 | 17.9%), German (1,241 | 17.2%), Irish (1,075 | 14.9%), English (794 | 11.0%), and Italian (205 | 2.8%), together accounting for 63.8% of all Taneytown residents.
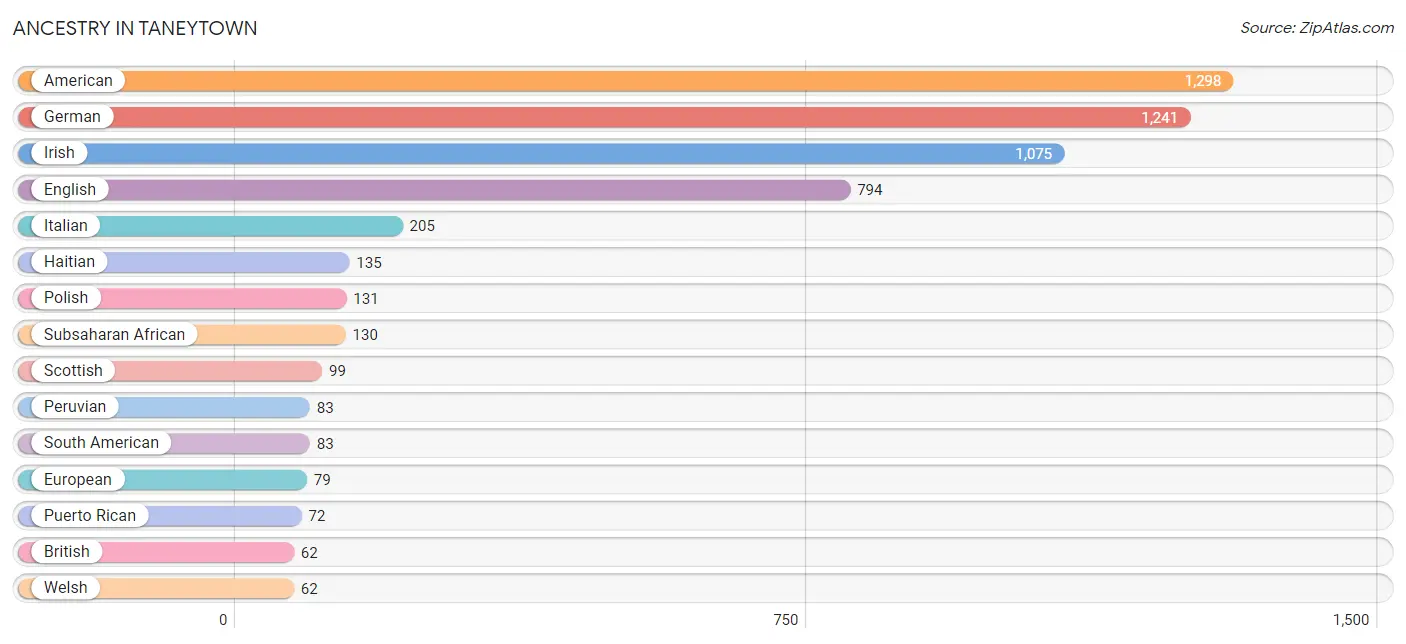
| Ancestry | # Population | % Population |
| African | 41 | 0.6% |
| American | 1,298 | 17.9% |
| Australian | 11 | 0.2% |
| Austrian | 11 | 0.2% |
| British | 62 | 0.9% |
| Burmese | 27 | 0.4% |
| Canadian | 11 | 0.2% |
| Croatian | 13 | 0.2% |
| Danish | 60 | 0.8% |
| Dominican | 42 | 0.6% |
| Dutch | 41 | 0.6% |
| English | 794 | 11.0% |
| European | 79 | 1.1% |
| French | 37 | 0.5% |
| French Canadian | 17 | 0.2% |
| German | 1,241 | 17.2% |
| Haitian | 135 | 1.9% |
| Indian (Asian) | 18 | 0.3% |
| Irish | 1,075 | 14.9% |
| Italian | 205 | 2.8% |
| Jamaican | 45 | 0.6% |
| Korean | 22 | 0.3% |
| Norwegian | 24 | 0.3% |
| Peruvian | 83 | 1.1% |
| Polish | 131 | 1.8% |
| Puerto Rican | 72 | 1.0% |
| Russian | 54 | 0.7% |
| Scandinavian | 15 | 0.2% |
| Scotch-Irish | 7 | 0.1% |
| Scottish | 99 | 1.4% |
| South American | 83 | 1.1% |
| Subsaharan African | 130 | 1.8% |
| Swedish | 14 | 0.2% |
| Ukrainian | 16 | 0.2% |
| Welsh | 62 | 0.9% | View All 35 Rows |
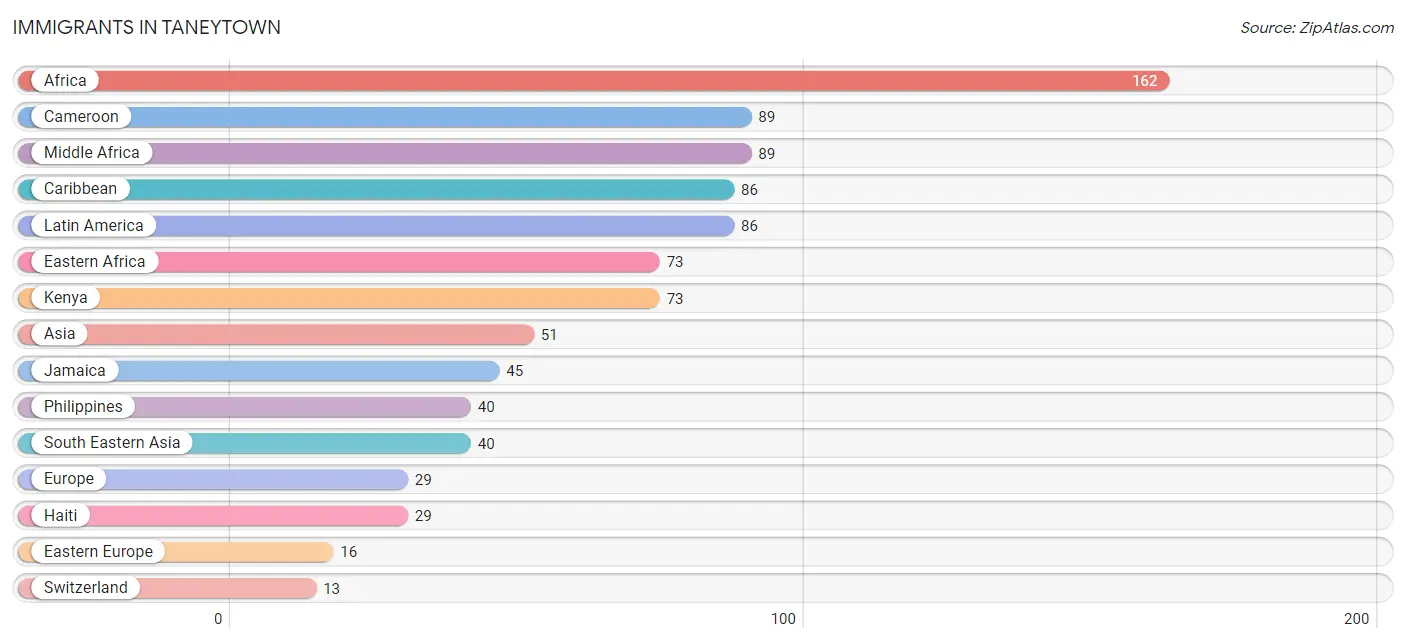
Immigrants in Taneytown
The most numerous immigrant groups reported in Taneytown came from Africa (162 | 2.2%), Cameroon (89 | 1.2%), Middle Africa (89 | 1.2%), Caribbean (86 | 1.2%), and Latin America (86 | 1.2%), together accounting for 7.1% of all Taneytown residents.
| Immigration Origin | # Population | % Population |
| Africa | 162 | 2.2% |
| Asia | 51 | 0.7% |
| Cameroon | 89 | 1.2% |
| Caribbean | 86 | 1.2% |
| Dominican Republic | 12 | 0.2% |
| Eastern Africa | 73 | 1.0% |
| Eastern Asia | 11 | 0.2% |
| Eastern Europe | 16 | 0.2% |
| Europe | 29 | 0.4% |
| Haiti | 29 | 0.4% |
| Jamaica | 45 | 0.6% |
| Kenya | 73 | 1.0% |
| Korea | 11 | 0.2% |
| Latin America | 86 | 1.2% |
| Middle Africa | 89 | 1.2% |
| Philippines | 40 | 0.5% |
| Russia | 8 | 0.1% |
| South Eastern Asia | 40 | 0.5% |
| Switzerland | 13 | 0.2% |
| Ukraine | 8 | 0.1% |
| Western Europe | 13 | 0.2% | View All 21 Rows |
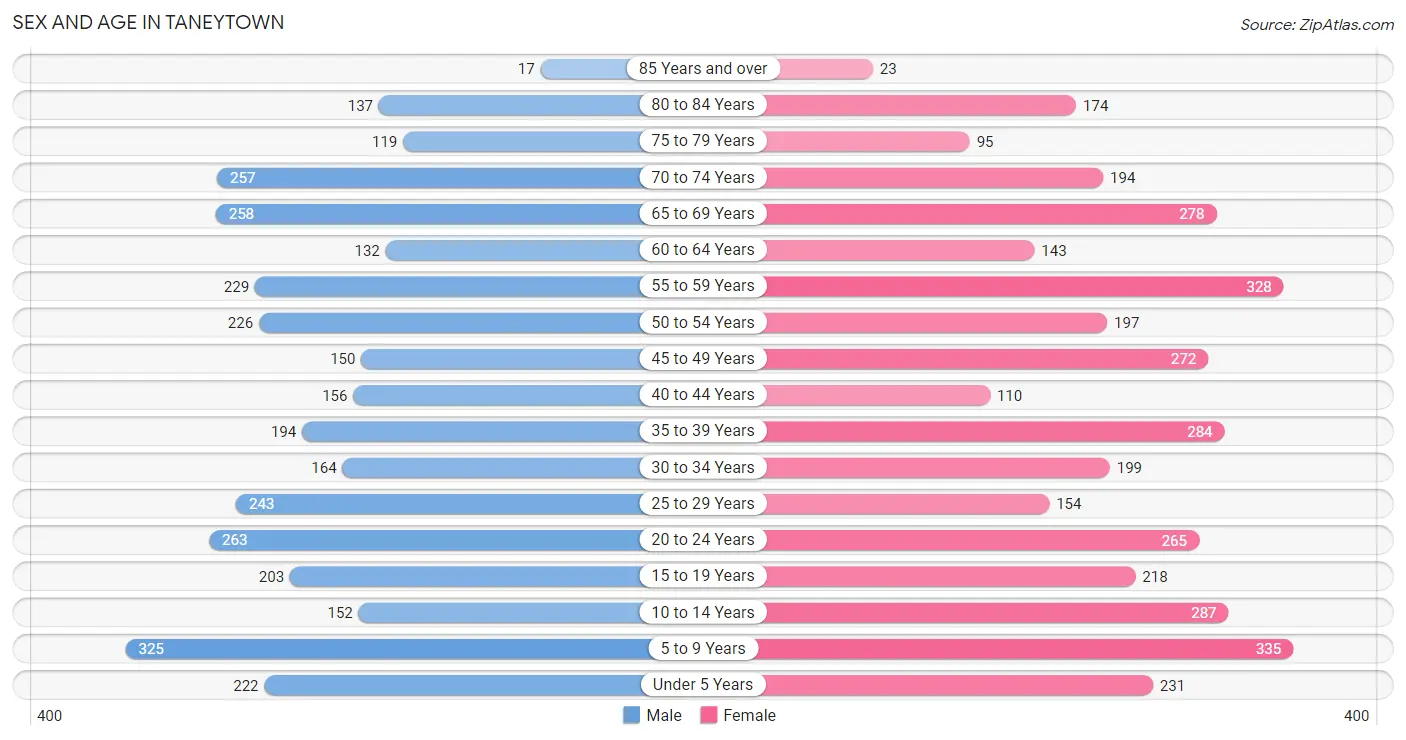
Sex and Age in Taneytown
Sex and Age in Taneytown
The most populous age groups in Taneytown are 5 to 9 Years (325 | 9.4%) for men and 5 to 9 Years (335 | 8.8%) for women.
| Age Bracket | Male | Female |
| Under 5 Years | 222 (6.4%) | 231 (6.1%) |
| 5 to 9 Years | 325 (9.4%) | 335 (8.8%) |
| 10 to 14 Years | 152 (4.4%) | 287 (7.6%) |
| 15 to 19 Years | 203 (5.9%) | 218 (5.8%) |
| 20 to 24 Years | 263 (7.6%) | 265 (7.0%) |
| 25 to 29 Years | 243 (7.0%) | 154 (4.1%) |
| 30 to 34 Years | 164 (4.8%) | 199 (5.2%) |
| 35 to 39 Years | 194 (5.6%) | 284 (7.5%) |
| 40 to 44 Years | 156 (4.5%) | 110 (2.9%) |
| 45 to 49 Years | 150 (4.3%) | 272 (7.2%) |
| 50 to 54 Years | 226 (6.6%) | 197 (5.2%) |
| 55 to 59 Years | 229 (6.6%) | 328 (8.7%) |
| 60 to 64 Years | 132 (3.8%) | 143 (3.8%) |
| 65 to 69 Years | 258 (7.5%) | 278 (7.3%) |
| 70 to 74 Years | 257 (7.5%) | 194 (5.1%) |
| 75 to 79 Years | 119 (3.5%) | 95 (2.5%) |
| 80 to 84 Years | 137 (4.0%) | 174 (4.6%) |
| 85 Years and over | 17 (0.5%) | 23 (0.6%) |
| Total | 3,447 (100.0%) | 3,787 (100.0%) |
Families and Households in Taneytown
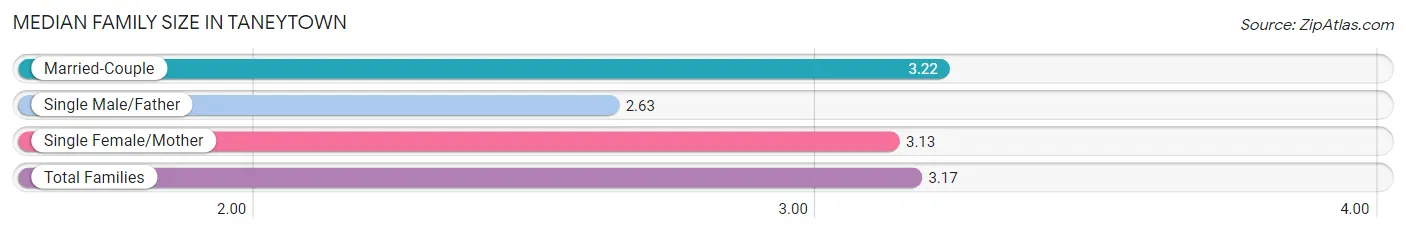
Median Family Size in Taneytown
The median family size in Taneytown is 3.17 persons per family, with married-couple families (1,429 | 76.4%) accounting for the largest median family size of 3.22 persons per family. On the other hand, single male/father families (99 | 5.3%) represent the smallest median family size with 2.63 persons per family.
| Family Type | # Families | Family Size |
| Married-Couple | 1,429 (76.4%) | 3.22 |
| Single Male/Father | 99 (5.3%) | 2.63 |
| Single Female/Mother | 342 (18.3%) | 3.13 |
| Total Families | 1,870 (100.0%) | 3.17 |
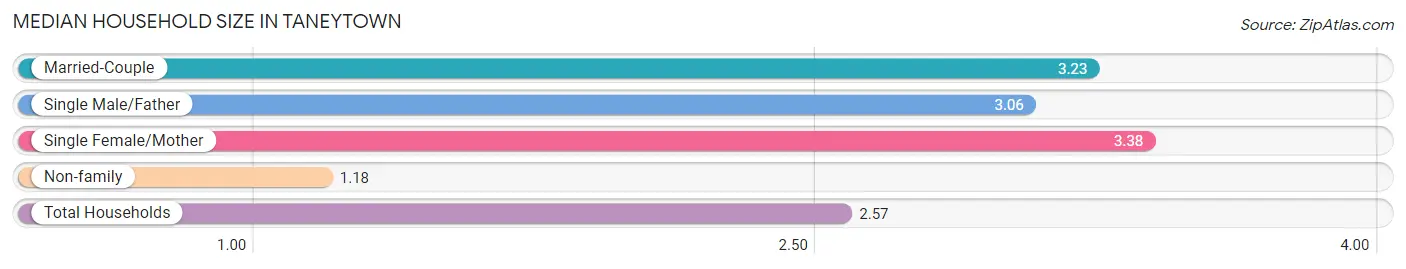
Median Household Size in Taneytown
The median household size in Taneytown is 2.57 persons per household, with single female/mother households (342 | 12.2%) accounting for the largest median household size of 3.38 persons per household. non-family households (922 | 33.0%) represent the smallest median household size with 1.18 persons per household.
| Household Type | # Households | Household Size |
| Married-Couple | 1,429 (51.2%) | 3.23 |
| Single Male/Father | 99 (3.5%) | 3.06 |
| Single Female/Mother | 342 (12.2%) | 3.38 |
| Non-family | 922 (33.0%) | 1.18 |
| Total Households | 2,792 (100.0%) | 2.57 |
Household Size by Marriage Status in Taneytown
Out of a total of 2,792 households in Taneytown, 1,870 (67.0%) are family households, while 922 (33.0%) are nonfamily households. The most numerous type of family households are 2-person households, comprising 738, and the most common type of nonfamily households are 1-person households, comprising 767.
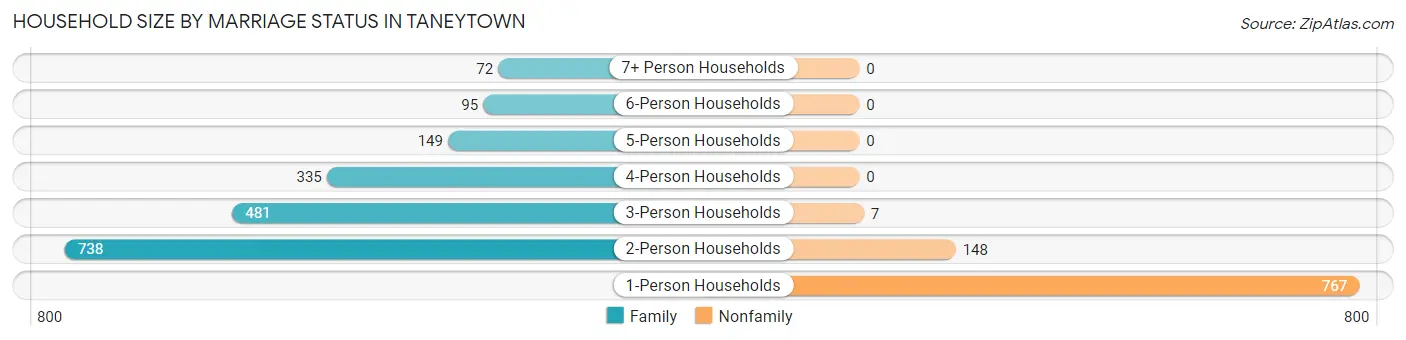
| Household Size | Family Households | Nonfamily Households |
| 1-Person Households | - | 767 (27.5%) |
| 2-Person Households | 738 (26.4%) | 148 (5.3%) |
| 3-Person Households | 481 (17.2%) | 7 (0.3%) |
| 4-Person Households | 335 (12.0%) | 0 (0.0%) |
| 5-Person Households | 149 (5.3%) | 0 (0.0%) |
| 6-Person Households | 95 (3.4%) | 0 (0.0%) |
| 7+ Person Households | 72 (2.6%) | 0 (0.0%) |
| Total | 1,870 (67.0%) | 922 (33.0%) |
Female Fertility in Taneytown
Fertility by Age in Taneytown
Average fertility rate in Taneytown is 82.0 births per 1,000 women. Women in the age bracket of 20 to 34 years have the highest fertility rate with 120.0 births per 1,000 women. Women in the age bracket of 20 to 34 years acount for 59.7% of all women with births.
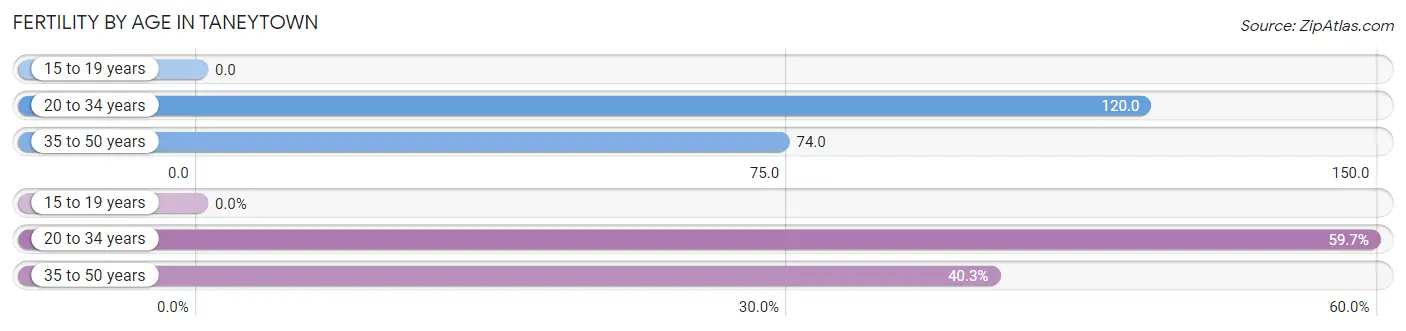
| Age Bracket | Women with Births | Births / 1,000 Women |
| 15 to 19 years | 0 (0.0%) | 0.0 |
| 20 to 34 years | 74 (59.7%) | 120.0 |
| 35 to 50 years | 50 (40.3%) | 74.0 |
| Total | 124 (100.0%) | 82.0 |
Fertility by Age by Marriage Status in Taneytown
82.3% of women with births (124) in Taneytown are married. The highest percentage of unmarried women with births falls into 20 to 34 years age bracket with 29.7% of them unmarried at the time of birth, while the lowest percentage of unmarried women with births belong to 35 to 50 years age bracket with 0.0% of them unmarried.
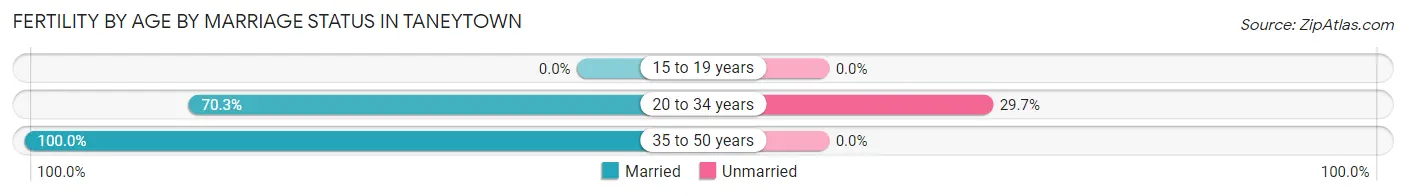
| Age Bracket | Married | Unmarried |
| 15 to 19 years | 0 (0.0%) | 0 (0.0%) |
| 20 to 34 years | 52 (70.3%) | 22 (29.7%) |
| 35 to 50 years | 50 (100.0%) | 0 (0.0%) |
| Total | 102 (82.3%) | 22 (17.7%) |
Fertility by Education in Taneytown
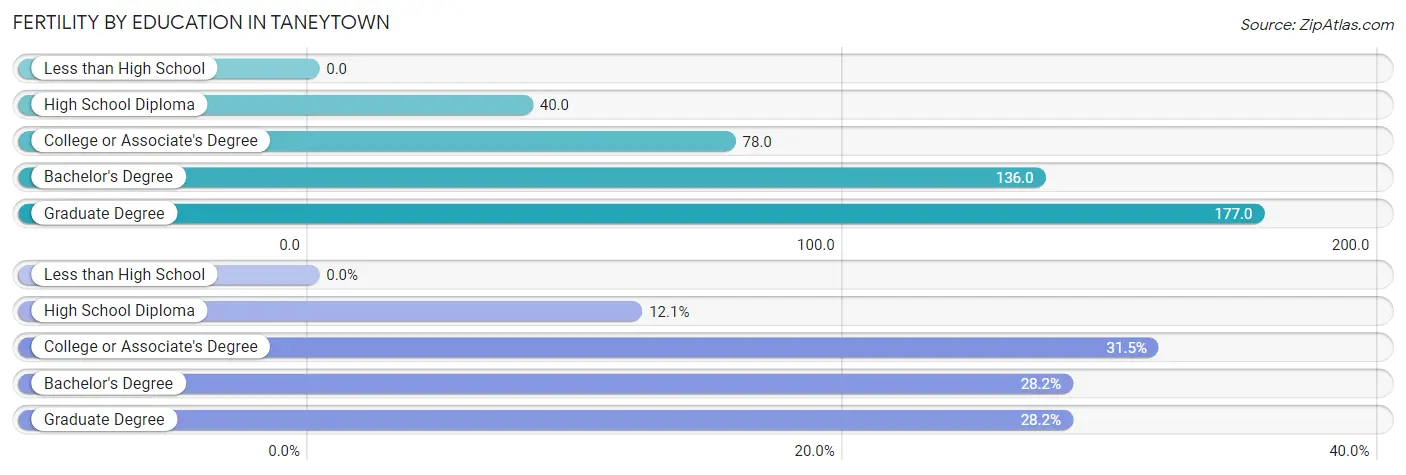
| Educational Attainment | Women with Births | Births / 1,000 Women |
| Less than High School | 0 (0.0%) | 0.0 |
| High School Diploma | 15 (12.1%) | 40.0 |
| College or Associate's Degree | 39 (31.5%) | 78.0 |
| Bachelor's Degree | 35 (28.2%) | 136.0 |
| Graduate Degree | 35 (28.2%) | 177.0 |
| Total | 124 (100.0%) | 82.0 |
Fertility by Education by Marriage Status in Taneytown
17.7% of women with births in Taneytown are unmarried. Women with the educational attainment of high school diploma are most likely to be married with 100.0% of them married at childbirth, while women with the educational attainment of college or associate's degree are least likely to be married with 56.4% of them unmarried at childbirth.
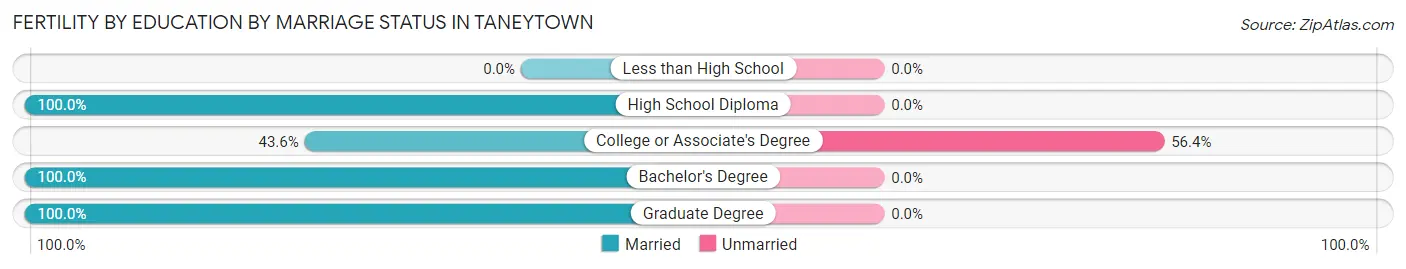
| Educational Attainment | Married | Unmarried |
| Less than High School | 0 (0.0%) | 0 (0.0%) |
| High School Diploma | 15 (100.0%) | 0 (0.0%) |
| College or Associate's Degree | 17 (43.6%) | 22 (56.4%) |
| Bachelor's Degree | 35 (100.0%) | 0 (0.0%) |
| Graduate Degree | 35 (100.0%) | 0 (0.0%) |
| Total | 102 (82.3%) | 22 (17.7%) |
Employment Characteristics in Taneytown
Employment by Class of Employer in Taneytown
Among the 3,044 employed individuals in Taneytown, private company employees (2,093 | 68.8%), local government employees (376 | 12.3%), and not-for-profit organizations (161 | 5.3%) make up the most common classes of employment.
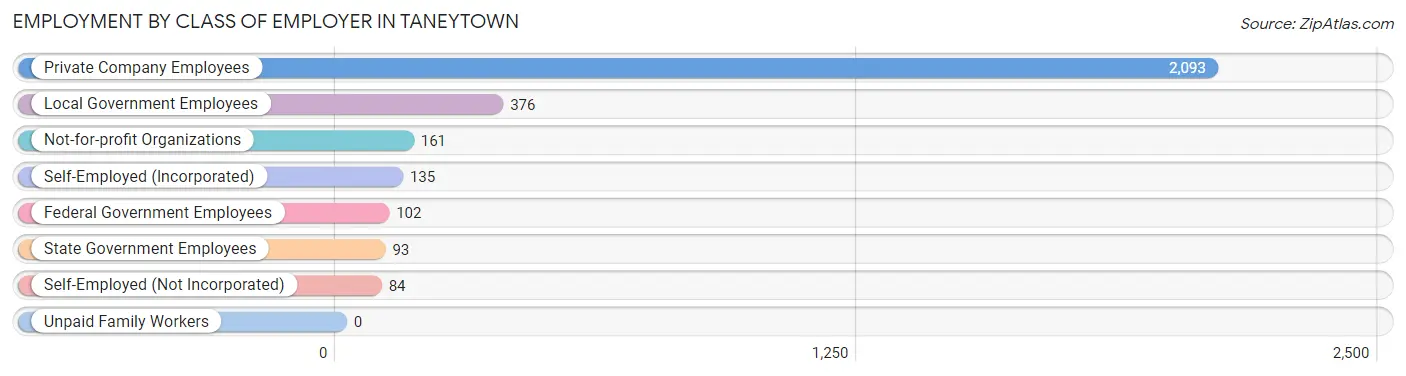
| Employer Class | # Employees | % Employees |
| Private Company Employees | 2,093 | 68.8% |
| Self-Employed (Incorporated) | 135 | 4.4% |
| Self-Employed (Not Incorporated) | 84 | 2.8% |
| Not-for-profit Organizations | 161 | 5.3% |
| Local Government Employees | 376 | 12.3% |
| State Government Employees | 93 | 3.1% |
| Federal Government Employees | 102 | 3.4% |
| Unpaid Family Workers | 0 | 0.0% |
| Total | 3,044 | 100.0% |
Employment Status by Age in Taneytown
According to the labor force statistics for Taneytown, out of the total population over 16 years of age (5,509), 59.5% or 3,278 individuals are in the labor force, with 4.2% or 138 of them unemployed. The age group with the highest labor force participation rate is 20 to 24 years, with 90.9% or 480 individuals in the labor force. Within the labor force, the 16 to 19 years age range has the highest percentage of unemployed individuals, with 48.2% or 54 of them being unemployed.
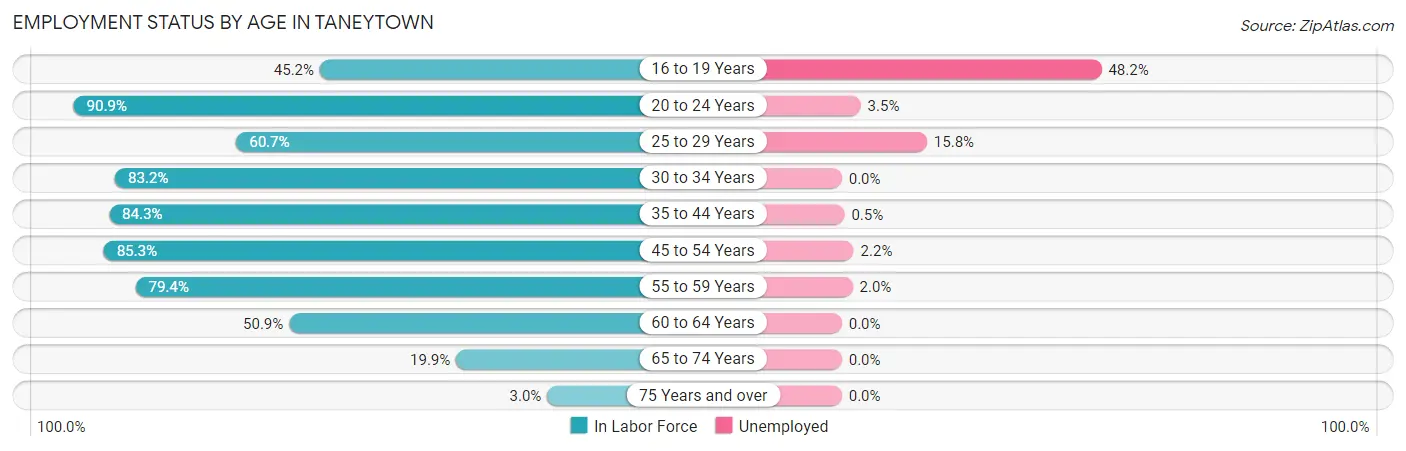
| Age Bracket | In Labor Force | Unemployed |
| 16 to 19 Years | 112 (45.2%) | 54 (48.2%) |
| 20 to 24 Years | 480 (90.9%) | 17 (3.5%) |
| 25 to 29 Years | 241 (60.7%) | 38 (15.8%) |
| 30 to 34 Years | 302 (83.2%) | 0 (0.0%) |
| 35 to 44 Years | 627 (84.3%) | 3 (0.5%) |
| 45 to 54 Years | 721 (85.3%) | 16 (2.2%) |
| 55 to 59 Years | 442 (79.4%) | 9 (2.0%) |
| 60 to 64 Years | 140 (50.9%) | 0 (0.0%) |
| 65 to 74 Years | 196 (19.9%) | 0 (0.0%) |
| 75 Years and over | 17 (3.0%) | 0 (0.0%) |
| Total | 3,278 (59.5%) | 138 (4.2%) |
Employment Status by Educational Attainment in Taneytown
According to labor force statistics for Taneytown, 77.7% of individuals (2,472) out of the total population between 25 and 64 years of age (3,181) are in the labor force, with 2.7% or 67 of them being unemployed. The group with the highest labor force participation rate are those with the educational attainment of bachelor's degree or higher, with 93.5% or 731 individuals in the labor force. Within the labor force, individuals with less than high school education have the highest percentage of unemployment, with 13.0% or 3 of them being unemployed.
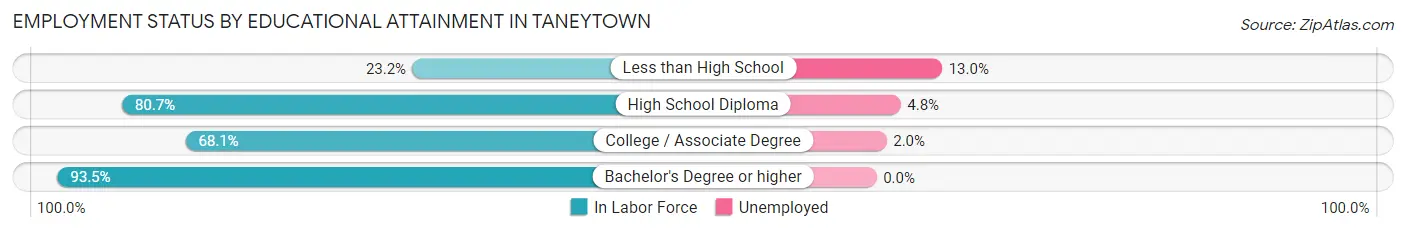
| Educational Attainment | In Labor Force | Unemployed |
| Less than High School | 23 (23.2%) | 13 (13.0%) |
| High School Diploma | 979 (80.7%) | 58 (4.8%) |
| College / Associate Degree | 740 (68.1%) | 22 (2.0%) |
| Bachelor's Degree or higher | 731 (93.5%) | 0 (0.0%) |
| Total | 2,472 (77.7%) | 86 (2.7%) |
Employment Occupations by Sex in Taneytown
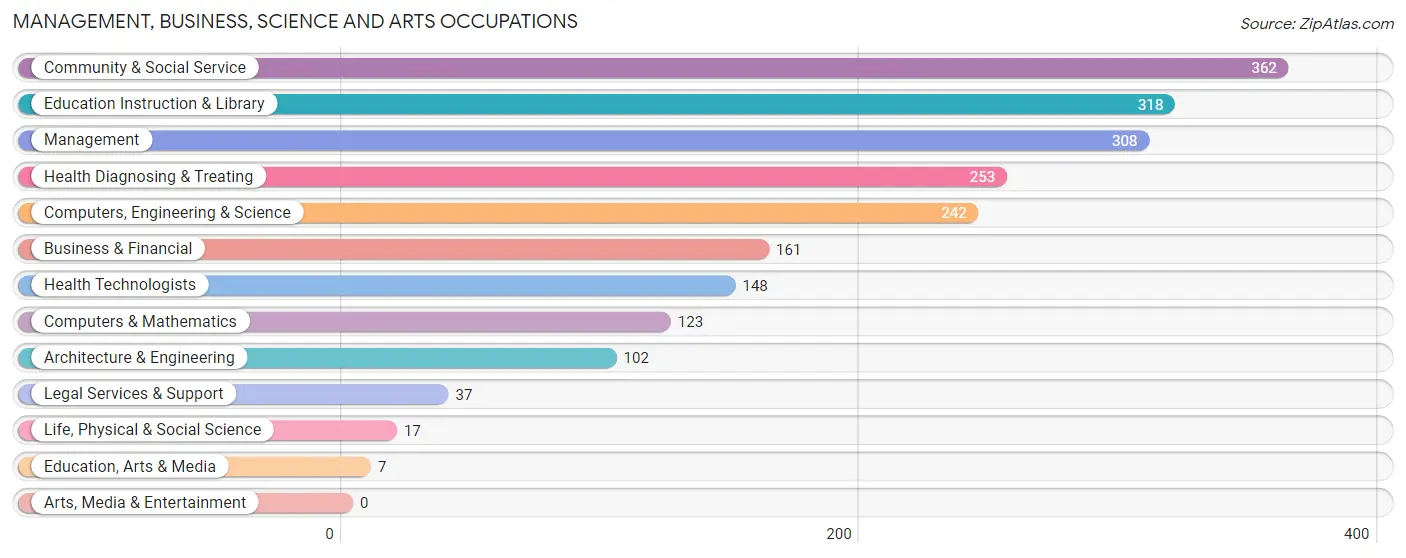
Management, Business, Science and Arts Occupations
The most common Management, Business, Science and Arts occupations in Taneytown are Community & Social Service (362 | 11.6%), Education Instruction & Library (318 | 10.2%), Management (308 | 9.9%), Health Diagnosing & Treating (253 | 8.1%), and Computers, Engineering & Science (242 | 7.8%).
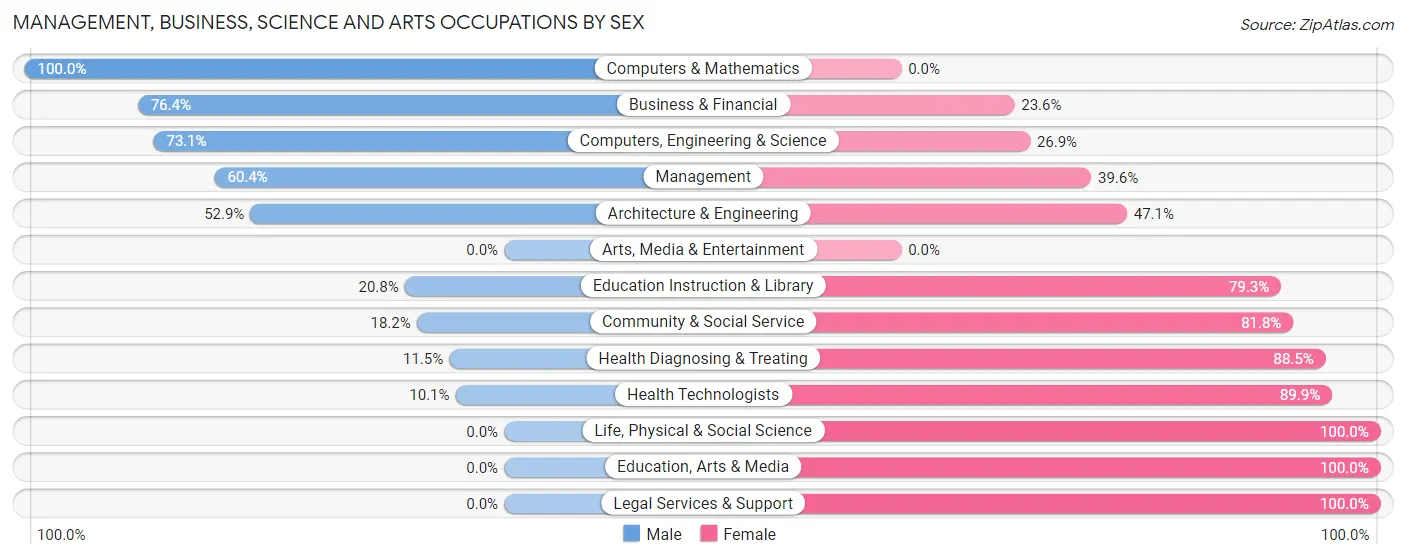
Management, Business, Science and Arts Occupations by Sex
Within the Management, Business, Science and Arts occupations in Taneytown, the most male-oriented occupations are Computers & Mathematics (100.0%), Business & Financial (76.4%), and Computers, Engineering & Science (73.1%), while the most female-oriented occupations are Life, Physical & Social Science (100.0%), Education, Arts & Media (100.0%), and Legal Services & Support (100.0%).
| Occupation | Male | Female |
| Management | 186 (60.4%) | 122 (39.6%) |
| Business & Financial | 123 (76.4%) | 38 (23.6%) |
| Computers, Engineering & Science | 177 (73.1%) | 65 (26.9%) |
| Computers & Mathematics | 123 (100.0%) | 0 (0.0%) |
| Architecture & Engineering | 54 (52.9%) | 48 (47.1%) |
| Life, Physical & Social Science | 0 (0.0%) | 17 (100.0%) |
| Community & Social Service | 66 (18.2%) | 296 (81.8%) |
| Education, Arts & Media | 0 (0.0%) | 7 (100.0%) |
| Legal Services & Support | 0 (0.0%) | 37 (100.0%) |
| Education Instruction & Library | 66 (20.7%) | 252 (79.2%) |
| Arts, Media & Entertainment | 0 (0.0%) | 0 (0.0%) |
| Health Diagnosing & Treating | 29 (11.5%) | 224 (88.5%) |
| Health Technologists | 15 (10.1%) | 133 (89.9%) |
| Total (Category) | 581 (43.8%) | 745 (56.2%) |
| Total (Overall) | 1,677 (53.8%) | 1,439 (46.2%) |
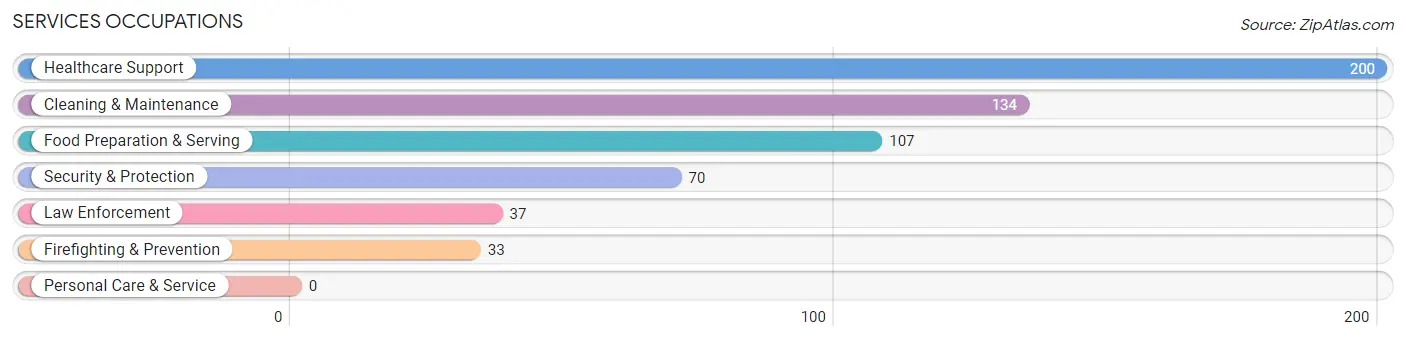
Services Occupations
The most common Services occupations in Taneytown are Healthcare Support (200 | 6.4%), Cleaning & Maintenance (134 | 4.3%), Food Preparation & Serving (107 | 3.4%), Security & Protection (70 | 2.2%), and Law Enforcement (37 | 1.2%).
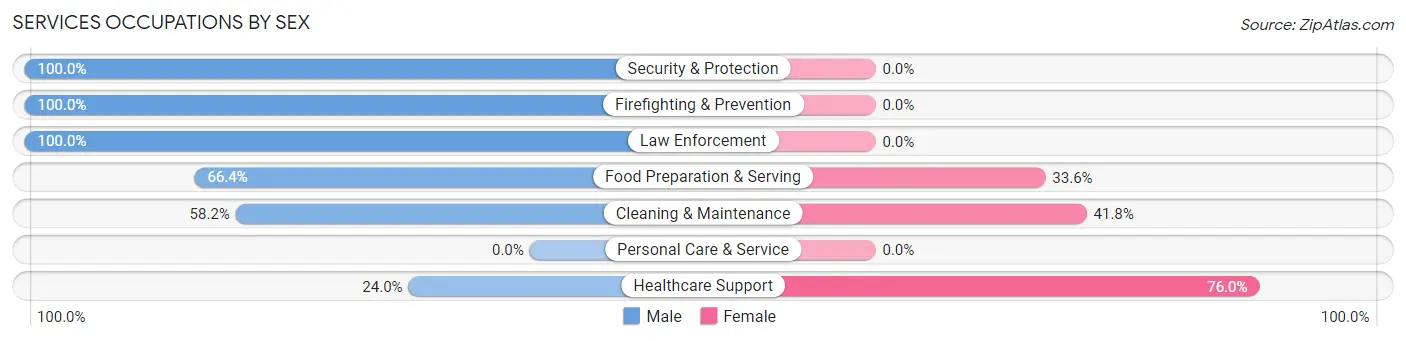
Services Occupations by Sex
Within the Services occupations in Taneytown, the most male-oriented occupations are Security & Protection (100.0%), Firefighting & Prevention (100.0%), and Law Enforcement (100.0%), while the most female-oriented occupations are Healthcare Support (76.0%), Cleaning & Maintenance (41.8%), and Food Preparation & Serving (33.6%).
| Occupation | Male | Female |
| Healthcare Support | 48 (24.0%) | 152 (76.0%) |
| Security & Protection | 70 (100.0%) | 0 (0.0%) |
| Firefighting & Prevention | 33 (100.0%) | 0 (0.0%) |
| Law Enforcement | 37 (100.0%) | 0 (0.0%) |
| Food Preparation & Serving | 71 (66.4%) | 36 (33.6%) |
| Cleaning & Maintenance | 78 (58.2%) | 56 (41.8%) |
| Personal Care & Service | 0 (0.0%) | 0 (0.0%) |
| Total (Category) | 267 (52.2%) | 244 (47.7%) |
| Total (Overall) | 1,677 (53.8%) | 1,439 (46.2%) |
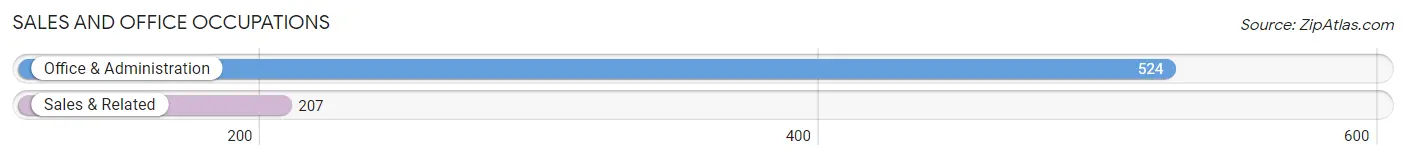
Sales and Office Occupations
The most common Sales and Office occupations in Taneytown are Office & Administration (524 | 16.8%), and Sales & Related (207 | 6.6%).
Sales and Office Occupations by Sex
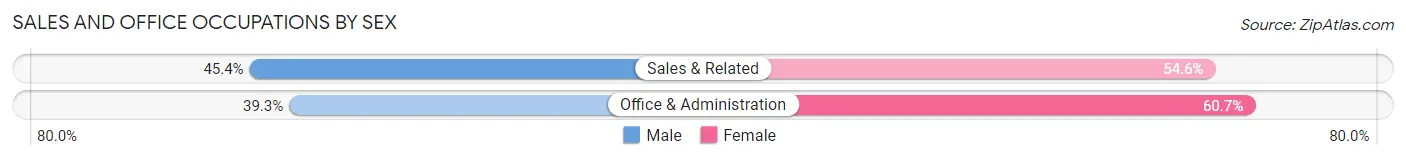
| Occupation | Male | Female |
| Sales & Related | 94 (45.4%) | 113 (54.6%) |
| Office & Administration | 206 (39.3%) | 318 (60.7%) |
| Total (Category) | 300 (41.0%) | 431 (59.0%) |
| Total (Overall) | 1,677 (53.8%) | 1,439 (46.2%) |
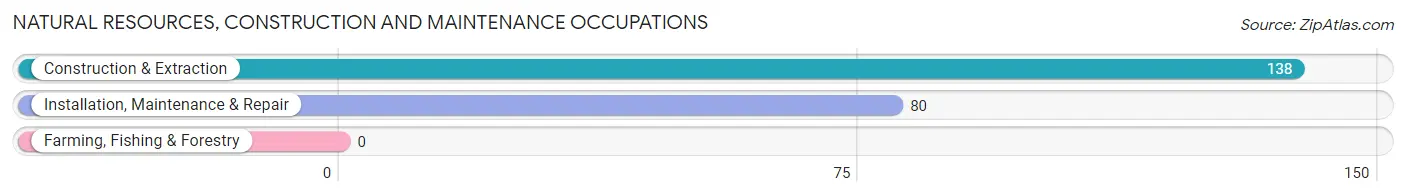
Natural Resources, Construction and Maintenance Occupations
The most common Natural Resources, Construction and Maintenance occupations in Taneytown are Construction & Extraction (138 | 4.4%), and Installation, Maintenance & Repair (80 | 2.6%).
Natural Resources, Construction and Maintenance Occupations by Sex
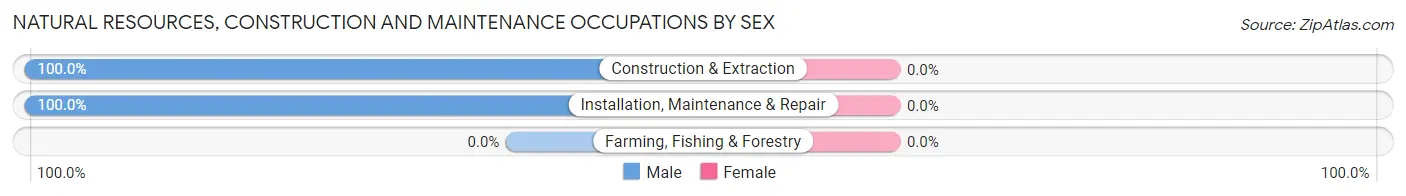
| Occupation | Male | Female |
| Farming, Fishing & Forestry | 0 (0.0%) | 0 (0.0%) |
| Construction & Extraction | 138 (100.0%) | 0 (0.0%) |
| Installation, Maintenance & Repair | 80 (100.0%) | 0 (0.0%) |
| Total (Category) | 218 (100.0%) | 0 (0.0%) |
| Total (Overall) | 1,677 (53.8%) | 1,439 (46.2%) |
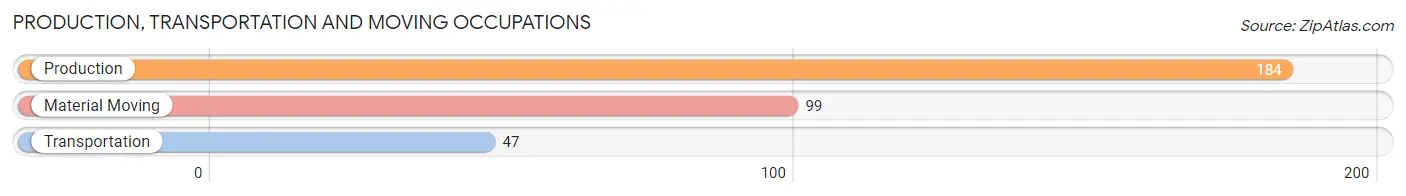
Production, Transportation and Moving Occupations
The most common Production, Transportation and Moving occupations in Taneytown are Production (184 | 5.9%), Material Moving (99 | 3.2%), and Transportation (47 | 1.5%).
Production, Transportation and Moving Occupations by Sex
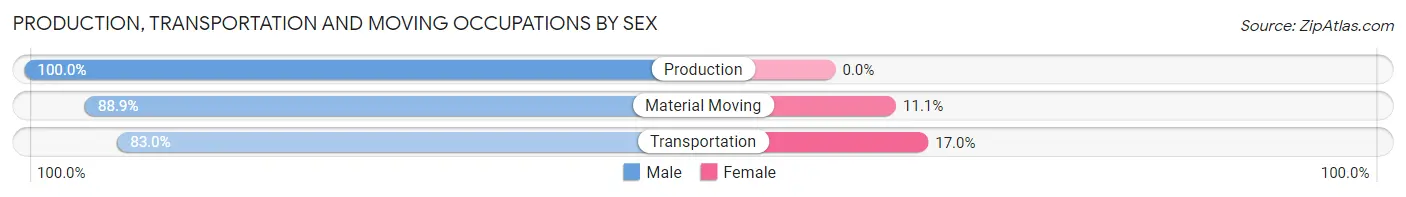
| Occupation | Male | Female |
| Production | 184 (100.0%) | 0 (0.0%) |
| Transportation | 39 (83.0%) | 8 (17.0%) |
| Material Moving | 88 (88.9%) | 11 (11.1%) |
| Total (Category) | 311 (94.2%) | 19 (5.8%) |
| Total (Overall) | 1,677 (53.8%) | 1,439 (46.2%) |
Employment Industries by Sex in Taneytown
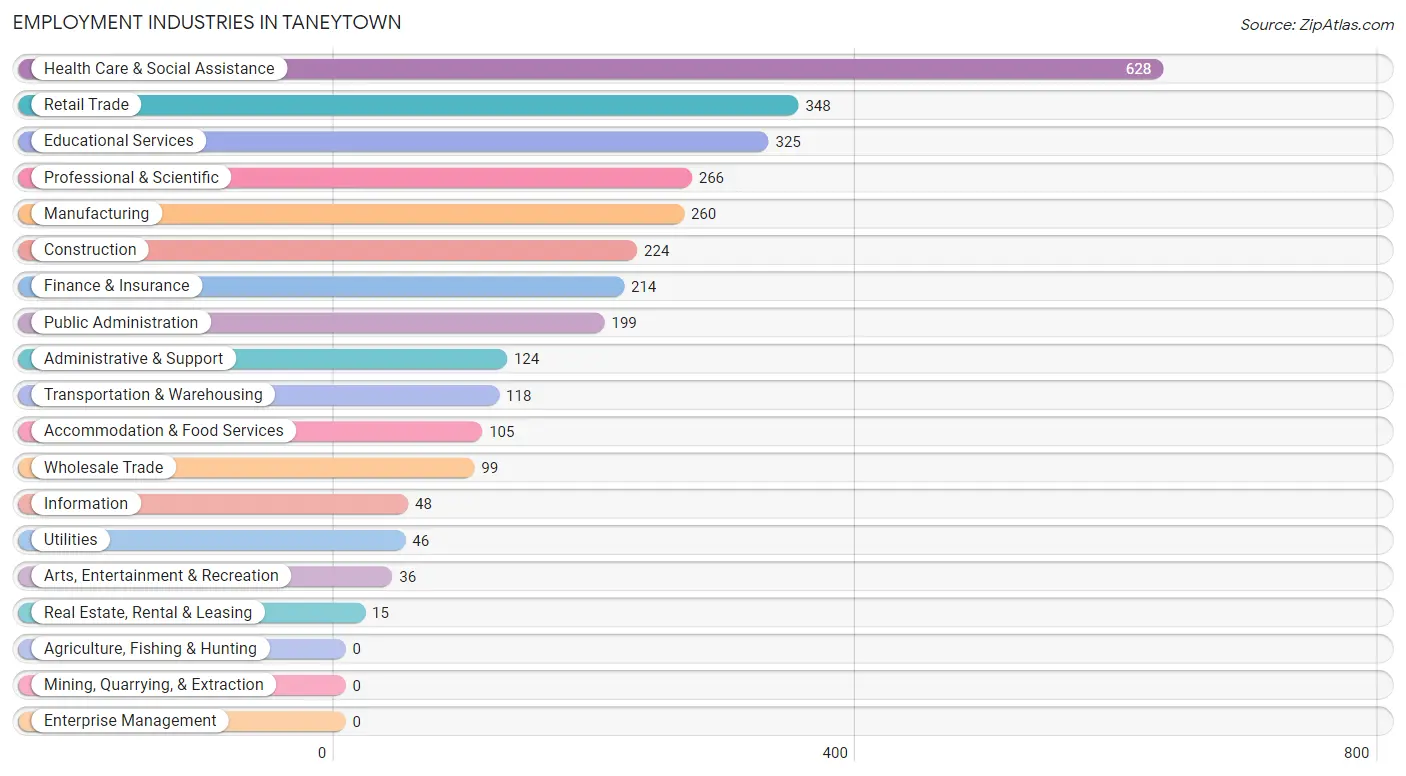
Employment Industries in Taneytown
The major employment industries in Taneytown include Health Care & Social Assistance (628 | 20.2%), Retail Trade (348 | 11.2%), Educational Services (325 | 10.4%), Professional & Scientific (266 | 8.5%), and Manufacturing (260 | 8.3%).
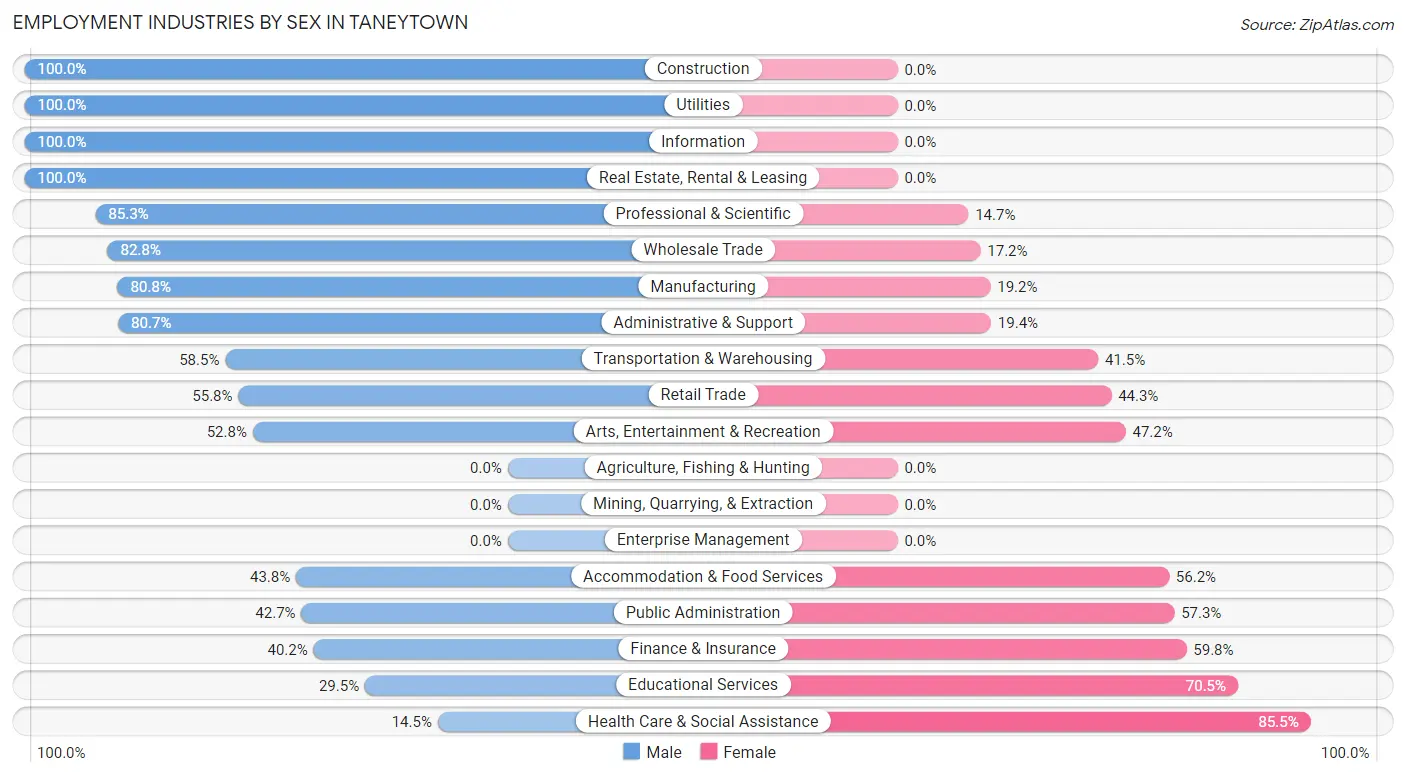
Employment Industries by Sex in Taneytown
The Taneytown industries that see more men than women are Construction (100.0%), Utilities (100.0%), and Information (100.0%), whereas the industries that tend to have a higher number of women are Health Care & Social Assistance (85.5%), Educational Services (70.5%), and Finance & Insurance (59.8%).
| Industry | Male | Female |
| Agriculture, Fishing & Hunting | 0 (0.0%) | 0 (0.0%) |
| Mining, Quarrying, & Extraction | 0 (0.0%) | 0 (0.0%) |
| Construction | 224 (100.0%) | 0 (0.0%) |
| Manufacturing | 210 (80.8%) | 50 (19.2%) |
| Wholesale Trade | 82 (82.8%) | 17 (17.2%) |
| Retail Trade | 194 (55.7%) | 154 (44.3%) |
| Transportation & Warehousing | 69 (58.5%) | 49 (41.5%) |
| Utilities | 46 (100.0%) | 0 (0.0%) |
| Information | 48 (100.0%) | 0 (0.0%) |
| Finance & Insurance | 86 (40.2%) | 128 (59.8%) |
| Real Estate, Rental & Leasing | 15 (100.0%) | 0 (0.0%) |
| Professional & Scientific | 227 (85.3%) | 39 (14.7%) |
| Enterprise Management | 0 (0.0%) | 0 (0.0%) |
| Administrative & Support | 100 (80.6%) | 24 (19.4%) |
| Educational Services | 96 (29.5%) | 229 (70.5%) |
| Health Care & Social Assistance | 91 (14.5%) | 537 (85.5%) |
| Arts, Entertainment & Recreation | 19 (52.8%) | 17 (47.2%) |
| Accommodation & Food Services | 46 (43.8%) | 59 (56.2%) |
| Public Administration | 85 (42.7%) | 114 (57.3%) |
| Total | 1,677 (53.8%) | 1,439 (46.2%) |
Education in Taneytown
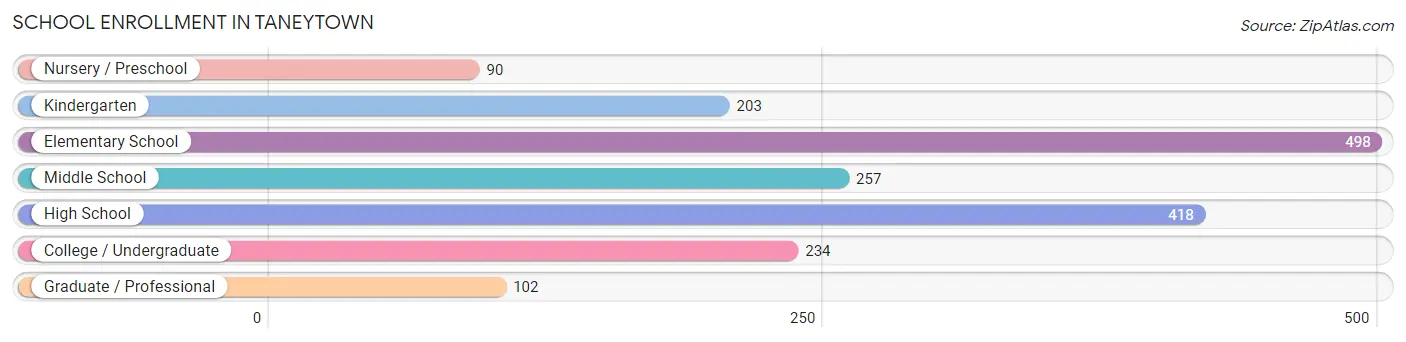
School Enrollment in Taneytown
The most common levels of schooling among the 1,802 students in Taneytown are elementary school (498 | 27.6%), high school (418 | 23.2%), and middle school (257 | 14.3%).
| School Level | # Students | % Students |
| Nursery / Preschool | 90 | 5.0% |
| Kindergarten | 203 | 11.3% |
| Elementary School | 498 | 27.6% |
| Middle School | 257 | 14.3% |
| High School | 418 | 23.2% |
| College / Undergraduate | 234 | 13.0% |
| Graduate / Professional | 102 | 5.7% |
| Total | 1,802 | 100.0% |
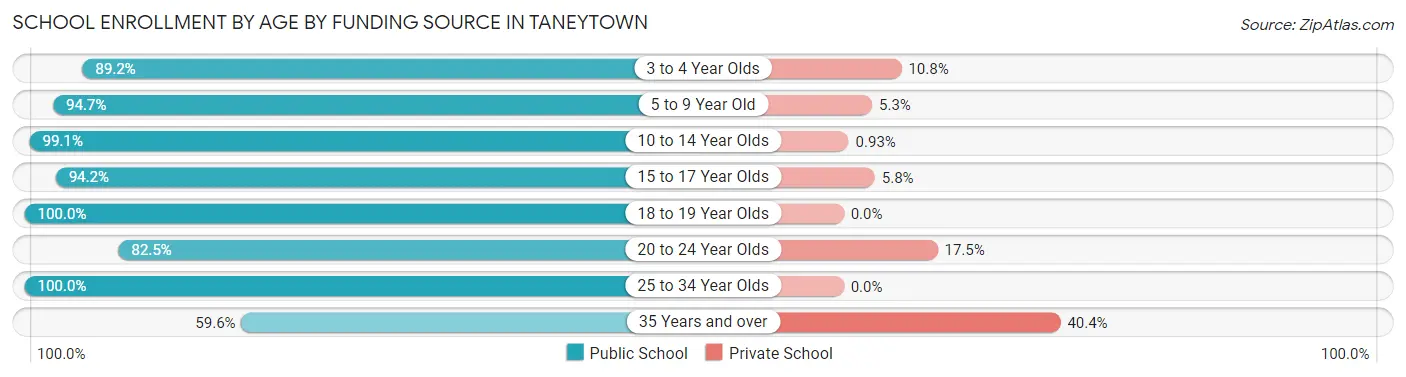
School Enrollment by Age by Funding Source in Taneytown
Out of a total of 1,802 students who are enrolled in schools in Taneytown, 141 (7.8%) attend a private institution, while the remaining 1,661 (92.2%) are enrolled in public schools. The age group of 35 years and over has the highest likelihood of being enrolled in private schools, with 42 (40.4% in the age bracket) enrolled. Conversely, the age group of 18 to 19 year olds has the lowest likelihood of being enrolled in a private school, with 33 (100.0% in the age bracket) attending a public institution.
| Age Bracket | Public School | Private School |
| 3 to 4 Year Olds | 58 (89.2%) | 7 (10.8%) |
| 5 to 9 Year Old | 625 (94.7%) | 35 (5.3%) |
| 10 to 14 Year Olds | 426 (99.1%) | 4 (0.9%) |
| 15 to 17 Year Olds | 276 (94.2%) | 17 (5.8%) |
| 18 to 19 Year Olds | 33 (100.0%) | 0 (0.0%) |
| 20 to 24 Year Olds | 170 (82.5%) | 36 (17.5%) |
| 25 to 34 Year Olds | 11 (100.0%) | 0 (0.0%) |
| 35 Years and over | 62 (59.6%) | 42 (40.4%) |
| Total | 1,661 (92.2%) | 141 (7.8%) |
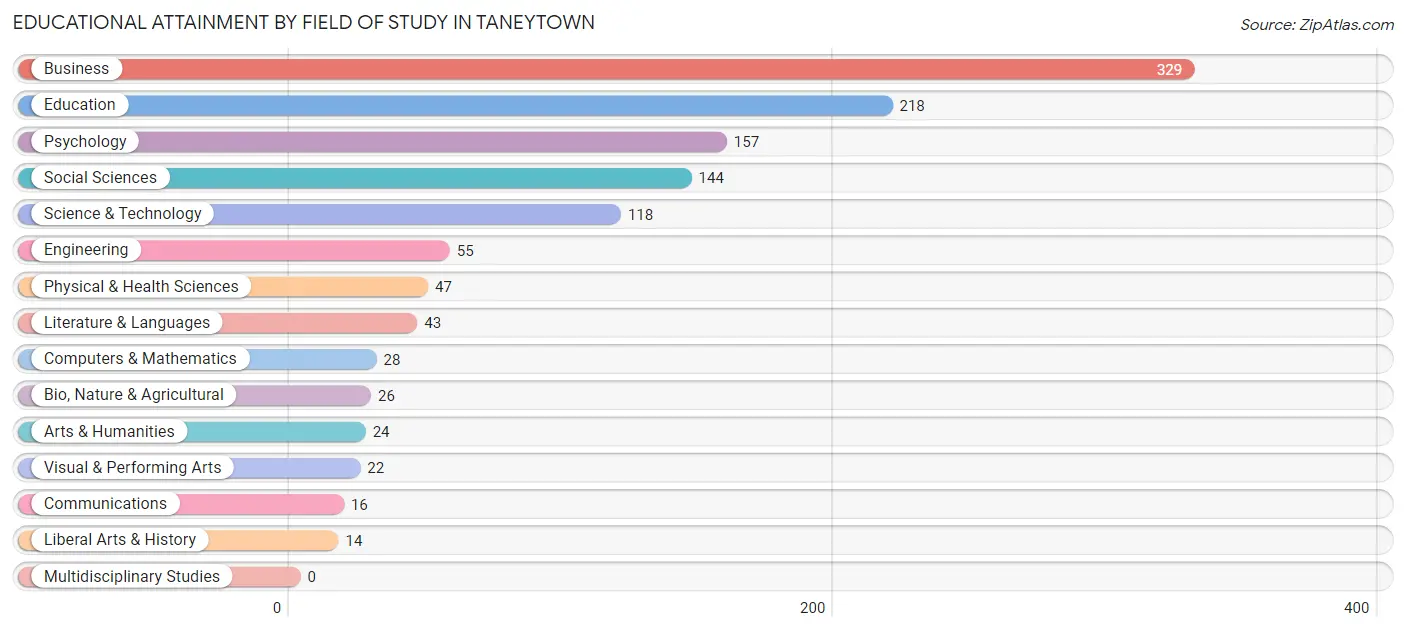
Educational Attainment by Field of Study in Taneytown
Business (329 | 26.5%), education (218 | 17.6%), psychology (157 | 12.7%), social sciences (144 | 11.6%), and science & technology (118 | 9.5%) are the most common fields of study among 1,241 individuals in Taneytown who have obtained a bachelor's degree or higher.
| Field of Study | # Graduates | % Graduates |
| Computers & Mathematics | 28 | 2.3% |
| Bio, Nature & Agricultural | 26 | 2.1% |
| Physical & Health Sciences | 47 | 3.8% |
| Psychology | 157 | 12.7% |
| Social Sciences | 144 | 11.6% |
| Engineering | 55 | 4.4% |
| Multidisciplinary Studies | 0 | 0.0% |
| Science & Technology | 118 | 9.5% |
| Business | 329 | 26.5% |
| Education | 218 | 17.6% |
| Literature & Languages | 43 | 3.5% |
| Liberal Arts & History | 14 | 1.1% |
| Visual & Performing Arts | 22 | 1.8% |
| Communications | 16 | 1.3% |
| Arts & Humanities | 24 | 1.9% |
| Total | 1,241 | 100.0% |
Transportation & Commute in Taneytown
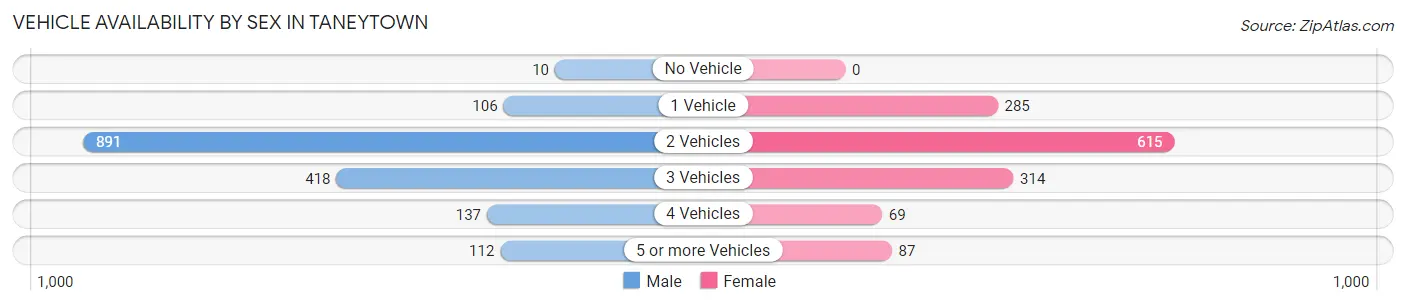
Vehicle Availability by Sex in Taneytown
The most prevalent vehicle ownership categories in Taneytown are males with 2 vehicles (891, accounting for 53.2%) and females with 2 vehicles (615, making up 65.0%).
| Vehicles Available | Male | Female |
| No Vehicle | 10 (0.6%) | 0 (0.0%) |
| 1 Vehicle | 106 (6.3%) | 285 (20.8%) |
| 2 Vehicles | 891 (53.2%) | 615 (44.9%) |
| 3 Vehicles | 418 (25.0%) | 314 (22.9%) |
| 4 Vehicles | 137 (8.2%) | 69 (5.0%) |
| 5 or more Vehicles | 112 (6.7%) | 87 (6.4%) |
| Total | 1,674 (100.0%) | 1,370 (100.0%) |
Commute Time in Taneytown
The most frequently occuring commute durations in Taneytown are 60 to 89 minutes (537 commuters, 19.4%), 20 to 24 minutes (371 commuters, 13.4%), and 30 to 34 minutes (354 commuters, 12.8%).
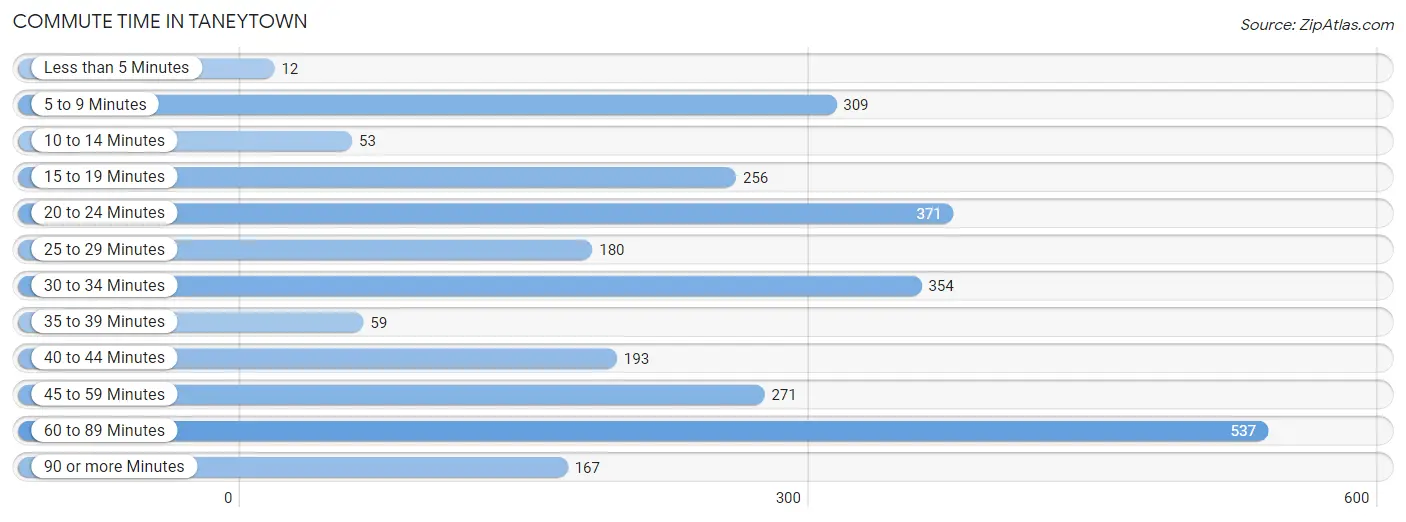
| Commute Time | # Commuters | % Commuters |
| Less than 5 Minutes | 12 | 0.4% |
| 5 to 9 Minutes | 309 | 11.2% |
| 10 to 14 Minutes | 53 | 1.9% |
| 15 to 19 Minutes | 256 | 9.3% |
| 20 to 24 Minutes | 371 | 13.4% |
| 25 to 29 Minutes | 180 | 6.5% |
| 30 to 34 Minutes | 354 | 12.8% |
| 35 to 39 Minutes | 59 | 2.1% |
| 40 to 44 Minutes | 193 | 7.0% |
| 45 to 59 Minutes | 271 | 9.8% |
| 60 to 89 Minutes | 537 | 19.4% |
| 90 or more Minutes | 167 | 6.0% |
Commute Time by Sex in Taneytown
The most common commute times in Taneytown are 60 to 89 minutes (379 commuters, 24.0%) for males and 30 to 34 minutes (232 commuters, 19.6%) for females.
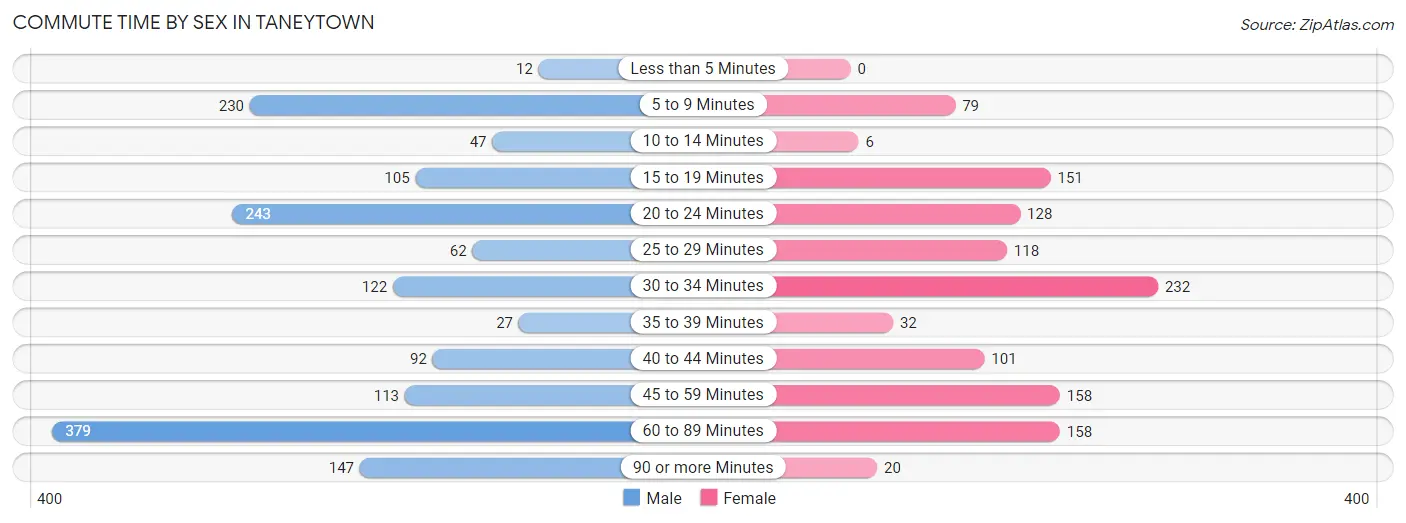
| Commute Time | Male | Female |
| Less than 5 Minutes | 12 (0.8%) | 0 (0.0%) |
| 5 to 9 Minutes | 230 (14.6%) | 79 (6.7%) |
| 10 to 14 Minutes | 47 (3.0%) | 6 (0.5%) |
| 15 to 19 Minutes | 105 (6.7%) | 151 (12.8%) |
| 20 to 24 Minutes | 243 (15.4%) | 128 (10.8%) |
| 25 to 29 Minutes | 62 (3.9%) | 118 (10.0%) |
| 30 to 34 Minutes | 122 (7.7%) | 232 (19.6%) |
| 35 to 39 Minutes | 27 (1.7%) | 32 (2.7%) |
| 40 to 44 Minutes | 92 (5.8%) | 101 (8.5%) |
| 45 to 59 Minutes | 113 (7.2%) | 158 (13.4%) |
| 60 to 89 Minutes | 379 (24.0%) | 158 (13.4%) |
| 90 or more Minutes | 147 (9.3%) | 20 (1.7%) |
Time of Departure to Work by Sex in Taneytown
The most frequent times of departure to work in Taneytown are 12:00 AM to 4:59 AM (274, 17.3%) for males and 7:30 AM to 7:59 AM (208, 17.6%) for females.
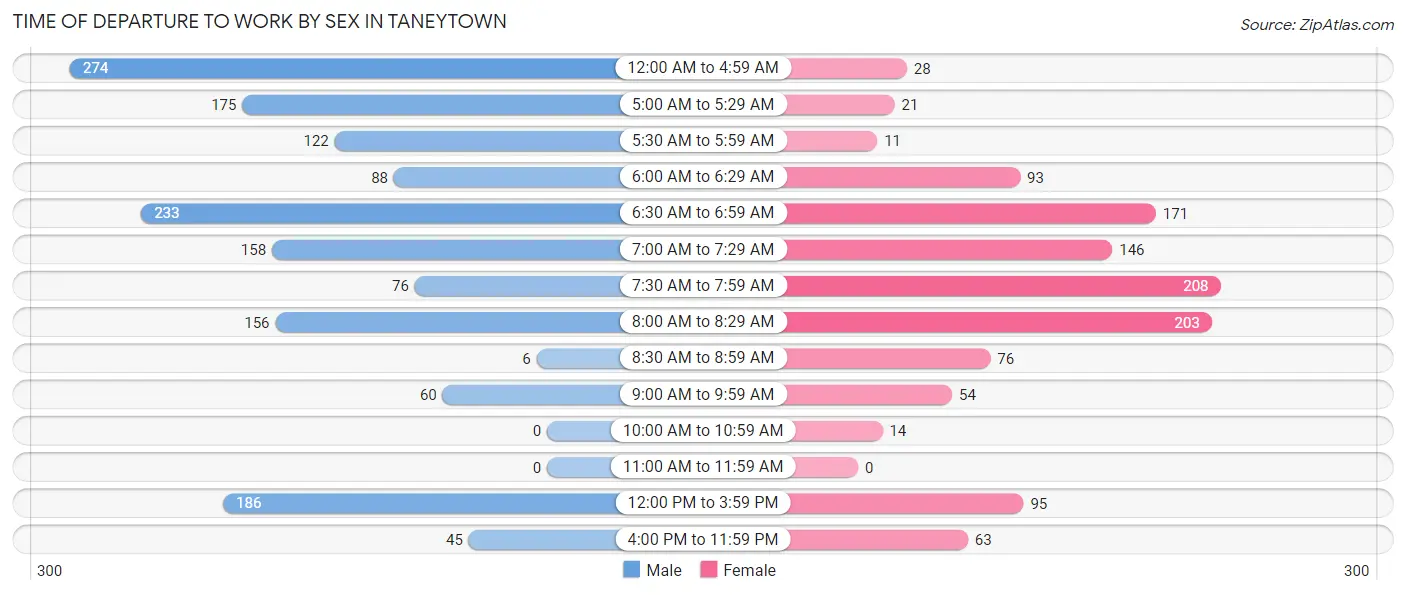
| Time of Departure | Male | Female |
| 12:00 AM to 4:59 AM | 274 (17.3%) | 28 (2.4%) |
| 5:00 AM to 5:29 AM | 175 (11.1%) | 21 (1.8%) |
| 5:30 AM to 5:59 AM | 122 (7.7%) | 11 (0.9%) |
| 6:00 AM to 6:29 AM | 88 (5.6%) | 93 (7.9%) |
| 6:30 AM to 6:59 AM | 233 (14.8%) | 171 (14.4%) |
| 7:00 AM to 7:29 AM | 158 (10.0%) | 146 (12.3%) |
| 7:30 AM to 7:59 AM | 76 (4.8%) | 208 (17.6%) |
| 8:00 AM to 8:29 AM | 156 (9.9%) | 203 (17.2%) |
| 8:30 AM to 8:59 AM | 6 (0.4%) | 76 (6.4%) |
| 9:00 AM to 9:59 AM | 60 (3.8%) | 54 (4.6%) |
| 10:00 AM to 10:59 AM | 0 (0.0%) | 14 (1.2%) |
| 11:00 AM to 11:59 AM | 0 (0.0%) | 0 (0.0%) |
| 12:00 PM to 3:59 PM | 186 (11.8%) | 95 (8.0%) |
| 4:00 PM to 11:59 PM | 45 (2.9%) | 63 (5.3%) |
| Total | 1,579 (100.0%) | 1,183 (100.0%) |
Housing Occupancy in Taneytown
Occupancy by Ownership in Taneytown
Of the total 2,792 dwellings in Taneytown, owner-occupied units account for 2,250 (80.6%), while renter-occupied units make up 542 (19.4%).
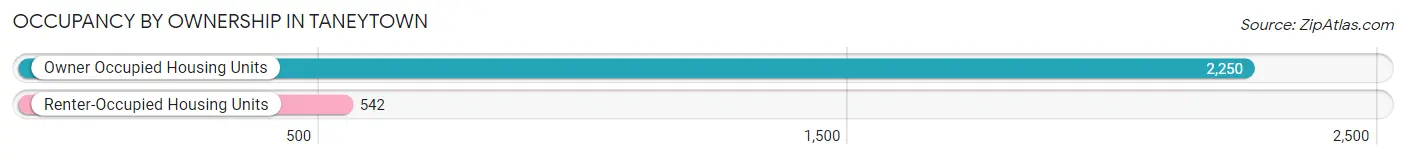
| Occupancy | # Housing Units | % Housing Units |
| Owner Occupied Housing Units | 2,250 | 80.6% |
| Renter-Occupied Housing Units | 542 | 19.4% |
| Total Occupied Housing Units | 2,792 | 100.0% |
Occupancy by Household Size in Taneytown
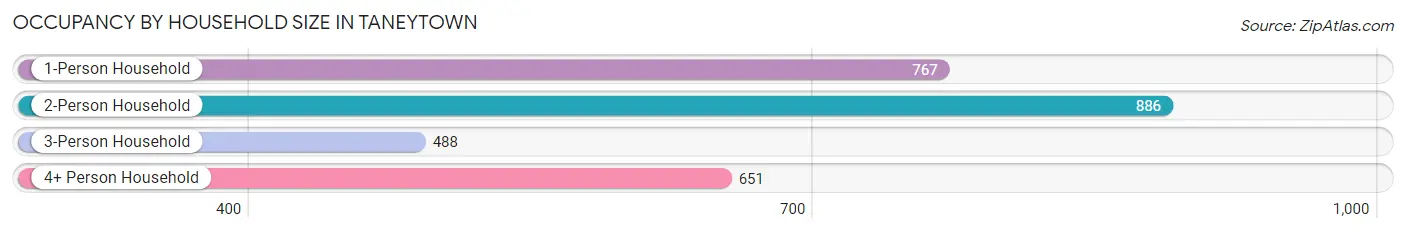
| Household Size | # Housing Units | % Housing Units |
| 1-Person Household | 767 | 27.5% |
| 2-Person Household | 886 | 31.7% |
| 3-Person Household | 488 | 17.5% |
| 4+ Person Household | 651 | 23.3% |
| Total Housing Units | 2,792 | 100.0% |
Occupancy by Ownership by Household Size in Taneytown
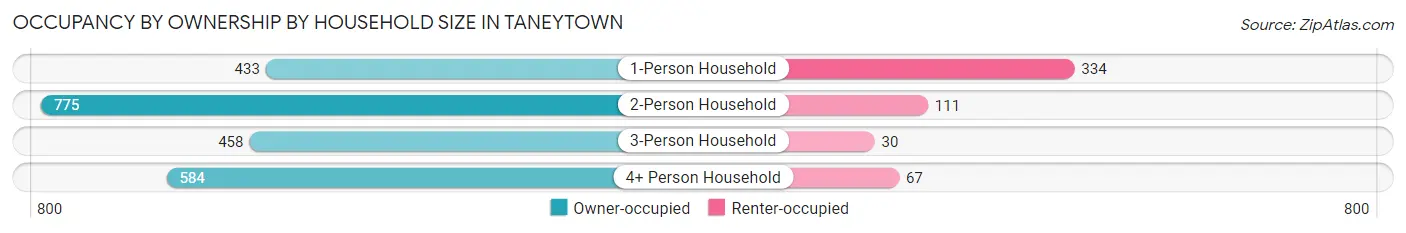
| Household Size | Owner-occupied | Renter-occupied |
| 1-Person Household | 433 (56.5%) | 334 (43.5%) |
| 2-Person Household | 775 (87.5%) | 111 (12.5%) |
| 3-Person Household | 458 (93.9%) | 30 (6.1%) |
| 4+ Person Household | 584 (89.7%) | 67 (10.3%) |
| Total Housing Units | 2,250 (80.6%) | 542 (19.4%) |
Occupancy by Educational Attainment in Taneytown
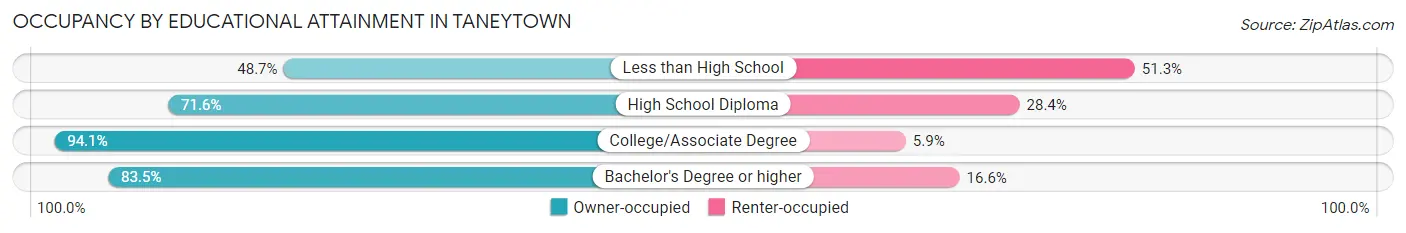
| Household Size | Owner-occupied | Renter-occupied |
| Less than High School | 75 (48.7%) | 79 (51.3%) |
| High School Diploma | 692 (71.6%) | 275 (28.4%) |
| College/Associate Degree | 782 (94.1%) | 49 (5.9%) |
| Bachelor's Degree or higher | 701 (83.5%) | 139 (16.6%) |
Occupancy by Age of Householder in Taneytown
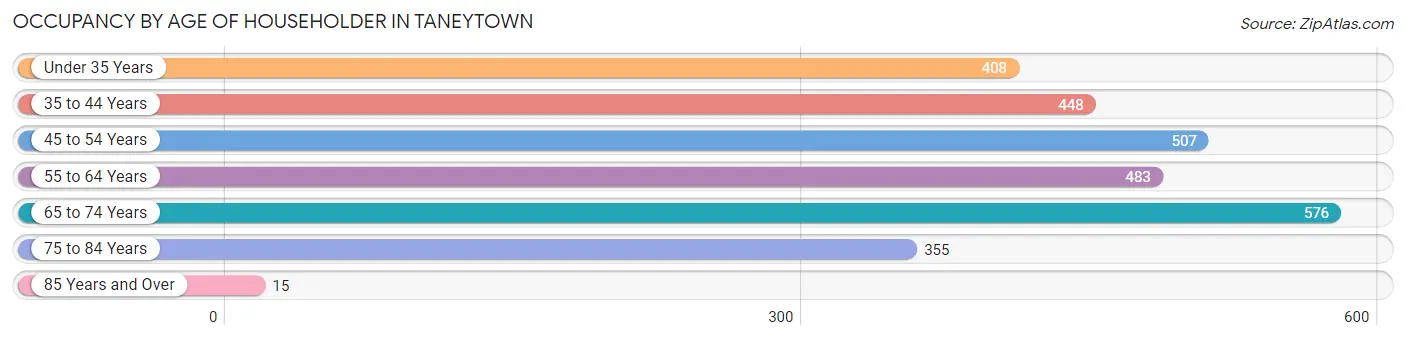
| Age Bracket | # Households | % Households |
| Under 35 Years | 408 | 14.6% |
| 35 to 44 Years | 448 | 16.1% |
| 45 to 54 Years | 507 | 18.2% |
| 55 to 64 Years | 483 | 17.3% |
| 65 to 74 Years | 576 | 20.6% |
| 75 to 84 Years | 355 | 12.7% |
| 85 Years and Over | 15 | 0.5% |
| Total | 2,792 | 100.0% |
Housing Finances in Taneytown
Median Income by Occupancy in Taneytown
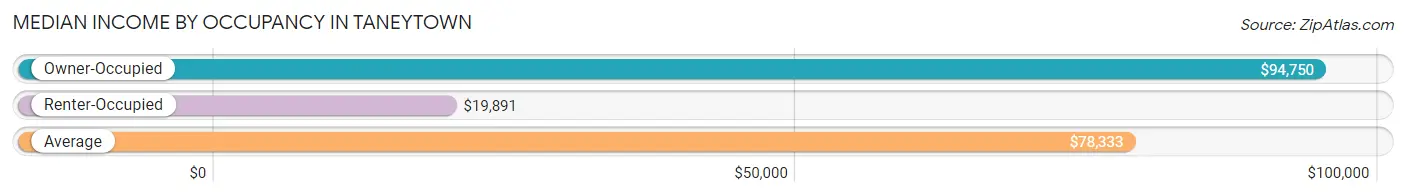
| Occupancy Type | # Households | Median Income |
| Owner-Occupied | 2,250 (80.6%) | $94,750 |
| Renter-Occupied | 542 (19.4%) | $19,891 |
| Average | 2,792 (100.0%) | $78,333 |
Occupancy by Householder Income Bracket in Taneytown
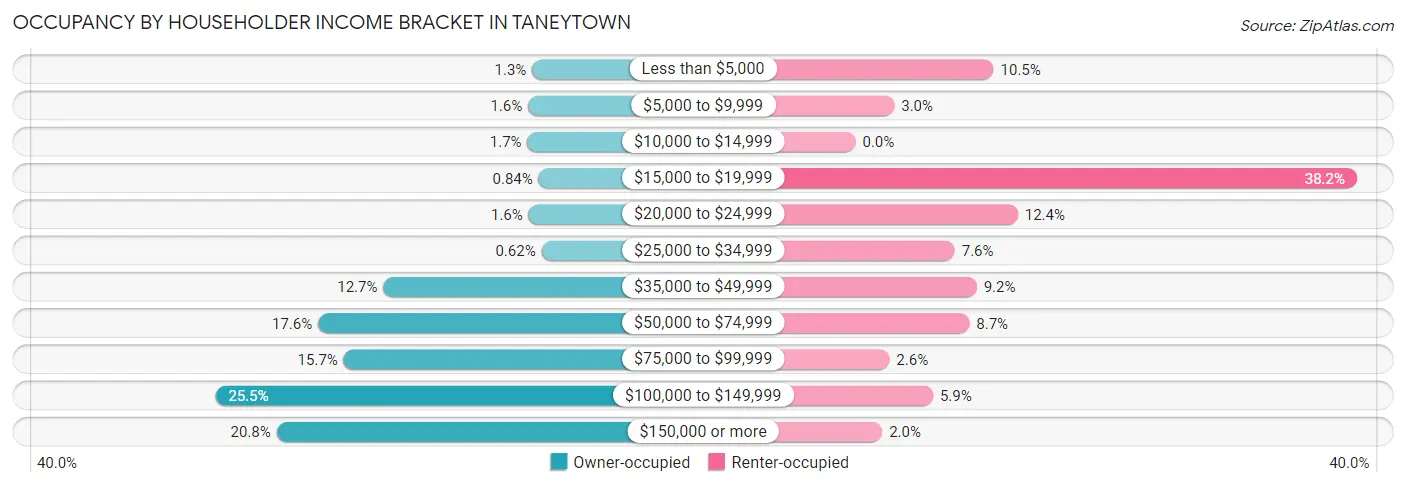
| Income Bracket | Owner-occupied | Renter-occupied |
| Less than $5,000 | 30 (1.3%) | 57 (10.5%) |
| $5,000 to $9,999 | 37 (1.6%) | 16 (2.9%) |
| $10,000 to $14,999 | 38 (1.7%) | 0 (0.0%) |
| $15,000 to $19,999 | 19 (0.8%) | 207 (38.2%) |
| $20,000 to $24,999 | 36 (1.6%) | 67 (12.4%) |
| $25,000 to $34,999 | 14 (0.6%) | 41 (7.6%) |
| $35,000 to $49,999 | 285 (12.7%) | 50 (9.2%) |
| $50,000 to $74,999 | 397 (17.6%) | 47 (8.7%) |
| $75,000 to $99,999 | 353 (15.7%) | 14 (2.6%) |
| $100,000 to $149,999 | 573 (25.5%) | 32 (5.9%) |
| $150,000 or more | 468 (20.8%) | 11 (2.0%) |
| Total | 2,250 (100.0%) | 542 (100.0%) |
Monthly Housing Cost Tiers in Taneytown
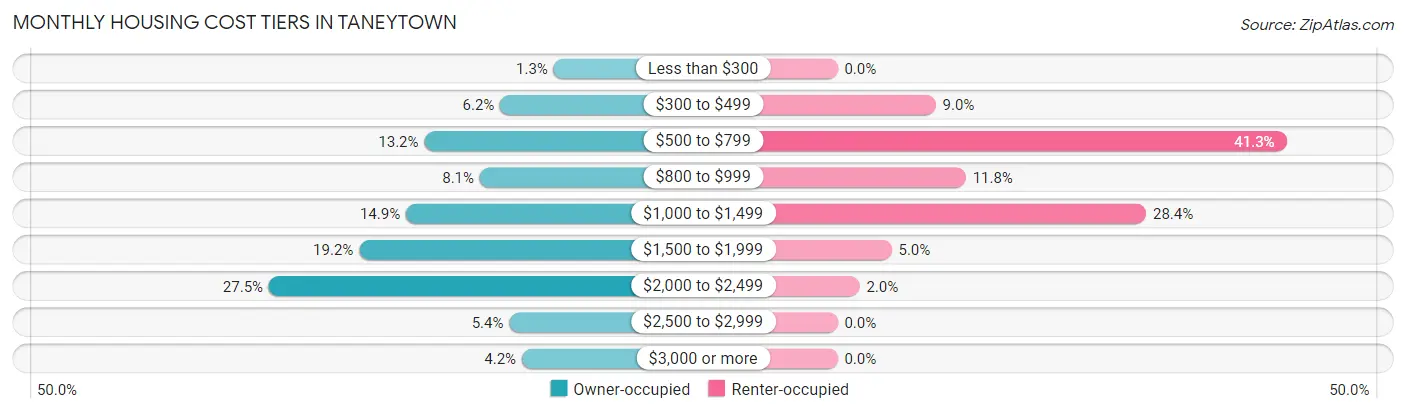
| Monthly Cost | Owner-occupied | Renter-occupied |
| Less than $300 | 29 (1.3%) | 0 (0.0%) |
| $300 to $499 | 140 (6.2%) | 49 (9.0%) |
| $500 to $799 | 297 (13.2%) | 224 (41.3%) |
| $800 to $999 | 182 (8.1%) | 64 (11.8%) |
| $1,000 to $1,499 | 335 (14.9%) | 154 (28.4%) |
| $1,500 to $1,999 | 432 (19.2%) | 27 (5.0%) |
| $2,000 to $2,499 | 619 (27.5%) | 11 (2.0%) |
| $2,500 to $2,999 | 121 (5.4%) | 0 (0.0%) |
| $3,000 or more | 95 (4.2%) | 0 (0.0%) |
| Total | 2,250 (100.0%) | 542 (100.0%) |
Physical Housing Characteristics in Taneytown
Housing Structures in Taneytown
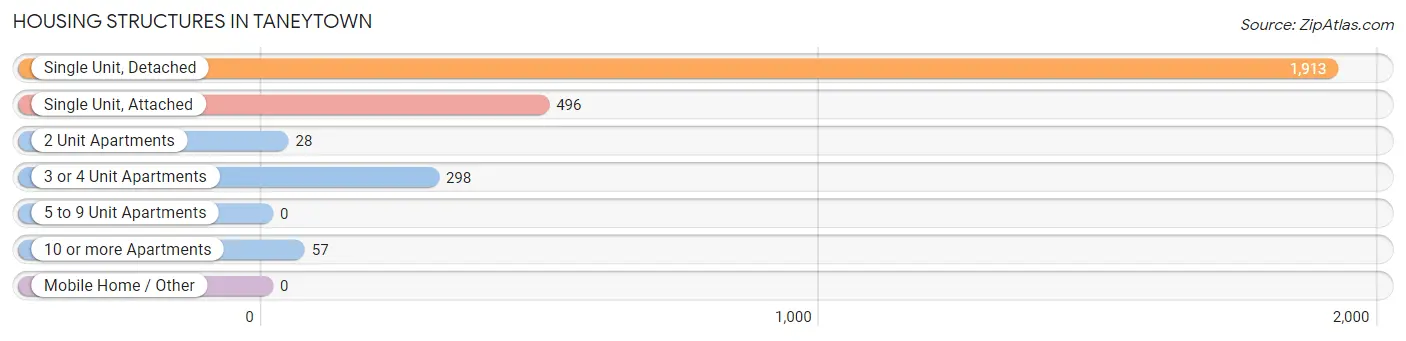
| Structure Type | # Housing Units | % Housing Units |
| Single Unit, Detached | 1,913 | 68.5% |
| Single Unit, Attached | 496 | 17.8% |
| 2 Unit Apartments | 28 | 1.0% |
| 3 or 4 Unit Apartments | 298 | 10.7% |
| 5 to 9 Unit Apartments | 0 | 0.0% |
| 10 or more Apartments | 57 | 2.0% |
| Mobile Home / Other | 0 | 0.0% |
| Total | 2,792 | 100.0% |
Housing Structures by Occupancy in Taneytown
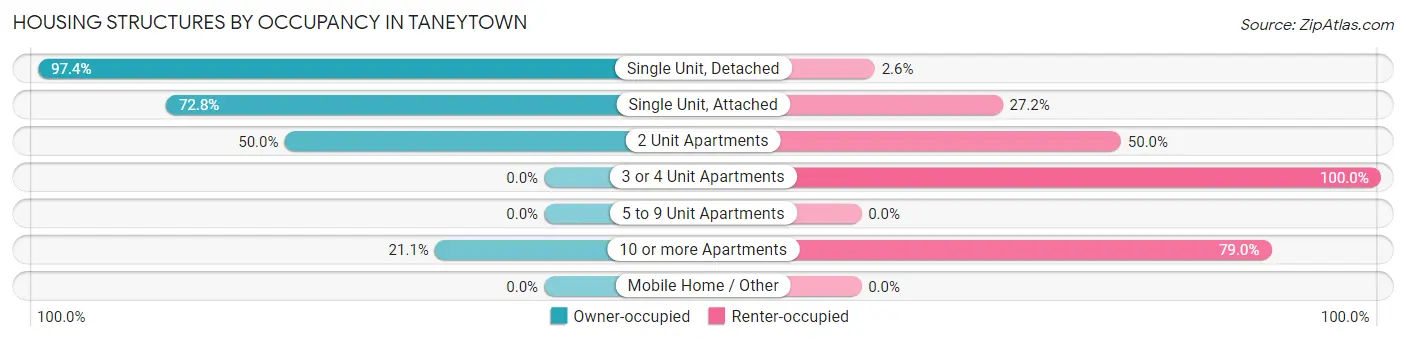
| Structure Type | Owner-occupied | Renter-occupied |
| Single Unit, Detached | 1,863 (97.4%) | 50 (2.6%) |
| Single Unit, Attached | 361 (72.8%) | 135 (27.2%) |
| 2 Unit Apartments | 14 (50.0%) | 14 (50.0%) |
| 3 or 4 Unit Apartments | 0 (0.0%) | 298 (100.0%) |
| 5 to 9 Unit Apartments | 0 (0.0%) | 0 (0.0%) |
| 10 or more Apartments | 12 (21.0%) | 45 (78.9%) |
| Mobile Home / Other | 0 (0.0%) | 0 (0.0%) |
| Total | 2,250 (80.6%) | 542 (19.4%) |
Housing Structures by Number of Rooms in Taneytown
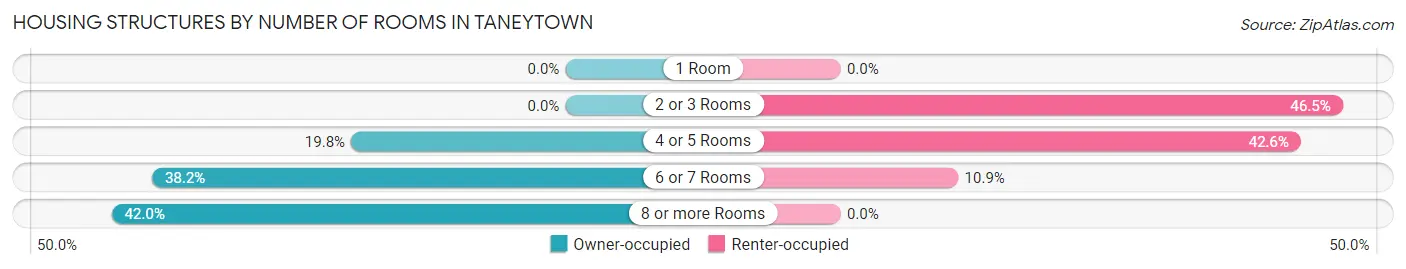
| Number of Rooms | Owner-occupied | Renter-occupied |
| 1 Room | 0 (0.0%) | 0 (0.0%) |
| 2 or 3 Rooms | 0 (0.0%) | 252 (46.5%) |
| 4 or 5 Rooms | 446 (19.8%) | 231 (42.6%) |
| 6 or 7 Rooms | 860 (38.2%) | 59 (10.9%) |
| 8 or more Rooms | 944 (42.0%) | 0 (0.0%) |
| Total | 2,250 (100.0%) | 542 (100.0%) |
Housing Structure by Heating Type in Taneytown
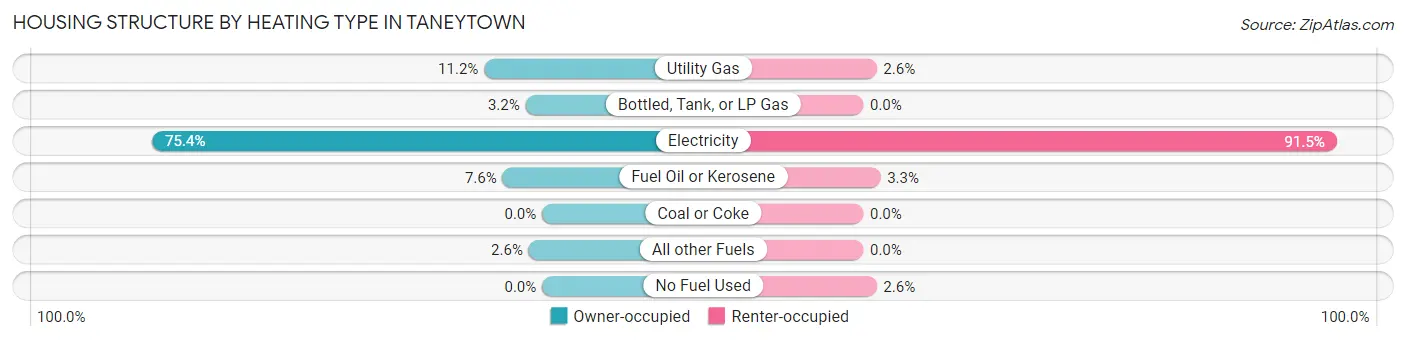
| Heating Type | Owner-occupied | Renter-occupied |
| Utility Gas | 252 (11.2%) | 14 (2.6%) |
| Bottled, Tank, or LP Gas | 72 (3.2%) | 0 (0.0%) |
| Electricity | 1,696 (75.4%) | 496 (91.5%) |
| Fuel Oil or Kerosene | 172 (7.6%) | 18 (3.3%) |
| Coal or Coke | 0 (0.0%) | 0 (0.0%) |
| All other Fuels | 58 (2.6%) | 0 (0.0%) |
| No Fuel Used | 0 (0.0%) | 14 (2.6%) |
| Total | 2,250 (100.0%) | 542 (100.0%) |
Household Vehicle Usage in Taneytown
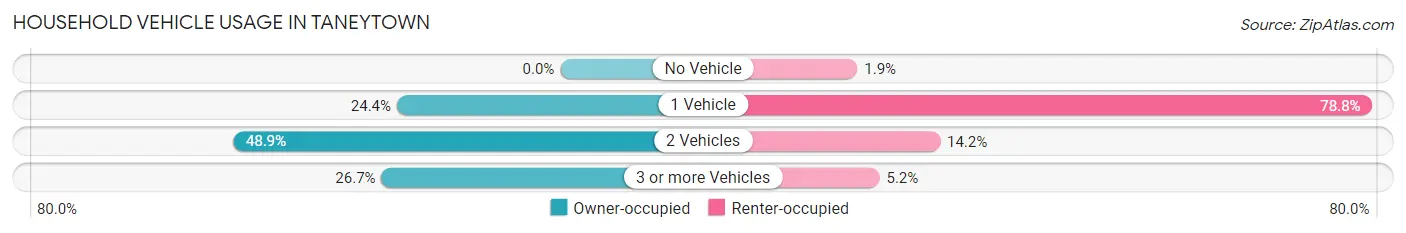
| Vehicles per Household | Owner-occupied | Renter-occupied |
| No Vehicle | 0 (0.0%) | 10 (1.8%) |
| 1 Vehicle | 549 (24.4%) | 427 (78.8%) |
| 2 Vehicles | 1,100 (48.9%) | 77 (14.2%) |
| 3 or more Vehicles | 601 (26.7%) | 28 (5.2%) |
| Total | 2,250 (100.0%) | 542 (100.0%) |
Real Estate & Mortgages in Taneytown
Real Estate and Mortgage Overview in Taneytown
| Characteristic | Without Mortgage | With Mortgage |
| Housing Units | 648 | 1,602 |
| Median Property Value | $268,500 | $307,700 |
| Median Household Income | $72,143 | $423 |
| Monthly Housing Costs | $592 | $95 |
| Real Estate Taxes | $3,486 | $37 |
Property Value by Mortgage Status in Taneytown
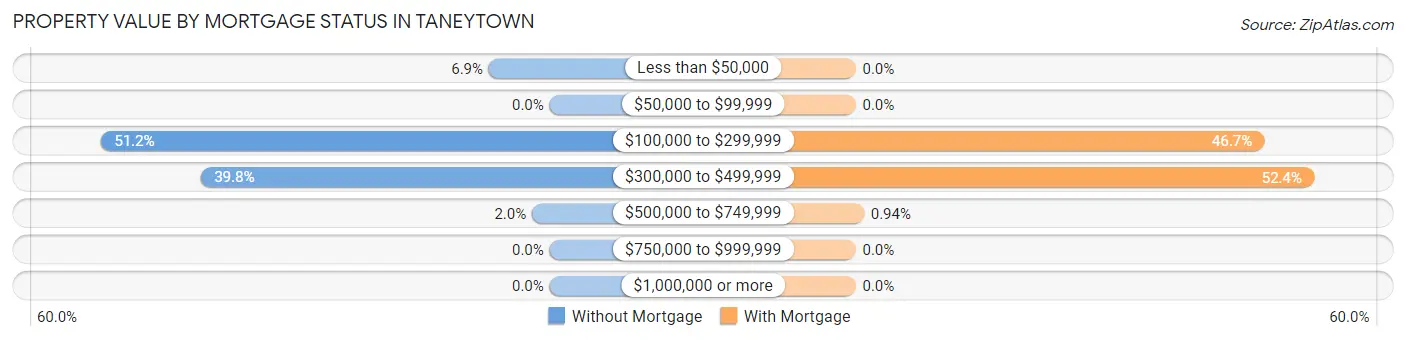
| Property Value | Without Mortgage | With Mortgage |
| Less than $50,000 | 45 (6.9%) | 0 (0.0%) |
| $50,000 to $99,999 | 0 (0.0%) | 0 (0.0%) |
| $100,000 to $299,999 | 332 (51.2%) | 748 (46.7%) |
| $300,000 to $499,999 | 258 (39.8%) | 839 (52.4%) |
| $500,000 to $749,999 | 13 (2.0%) | 15 (0.9%) |
| $750,000 to $999,999 | 0 (0.0%) | 0 (0.0%) |
| $1,000,000 or more | 0 (0.0%) | 0 (0.0%) |
| Total | 648 (100.0%) | 1,602 (100.0%) |
Household Income by Mortgage Status in Taneytown
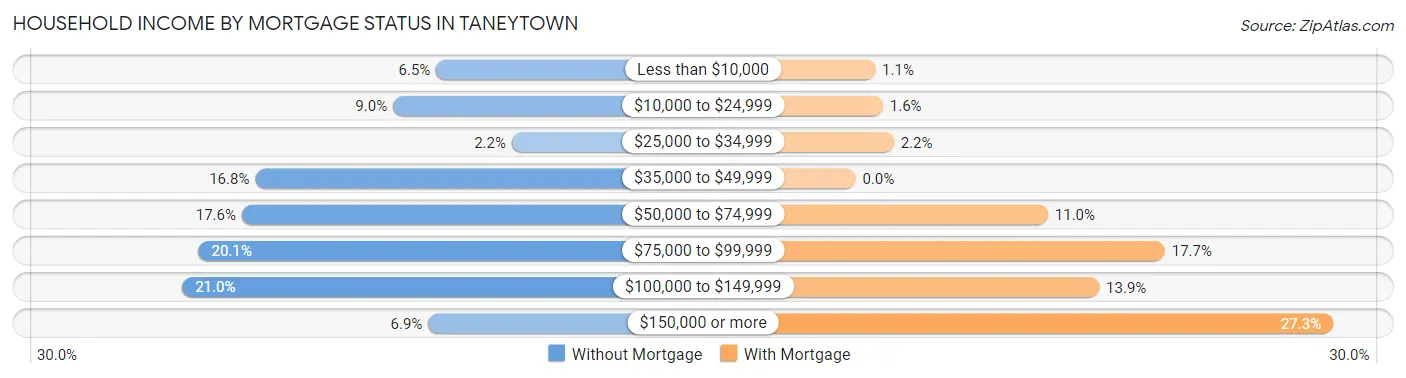
| Household Income | Without Mortgage | With Mortgage |
| Less than $10,000 | 42 (6.5%) | 18 (1.1%) |
| $10,000 to $24,999 | 58 (8.9%) | 25 (1.6%) |
| $25,000 to $34,999 | 14 (2.2%) | 35 (2.2%) |
| $35,000 to $49,999 | 109 (16.8%) | 0 (0.0%) |
| $50,000 to $74,999 | 114 (17.6%) | 176 (11.0%) |
| $75,000 to $99,999 | 130 (20.1%) | 283 (17.7%) |
| $100,000 to $149,999 | 136 (21.0%) | 223 (13.9%) |
| $150,000 or more | 45 (6.9%) | 437 (27.3%) |
| Total | 648 (100.0%) | 1,602 (100.0%) |
Property Value to Household Income Ratio in Taneytown
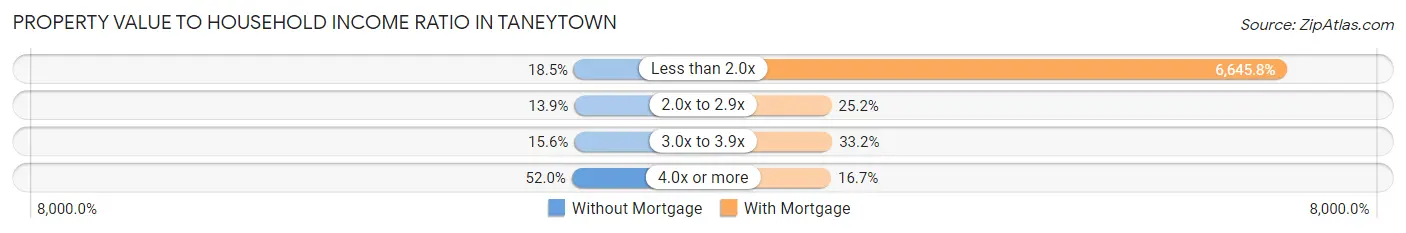
| Value-to-Income Ratio | Without Mortgage | With Mortgage |
| Less than 2.0x | 120 (18.5%) | 106,466 (6,645.8%) |
| 2.0x to 2.9x | 90 (13.9%) | 404 (25.2%) |
| 3.0x to 3.9x | 101 (15.6%) | 532 (33.2%) |
| 4.0x or more | 337 (52.0%) | 267 (16.7%) |
| Total | 648 (100.0%) | 1,602 (100.0%) |
Real Estate Taxes by Mortgage Status in Taneytown
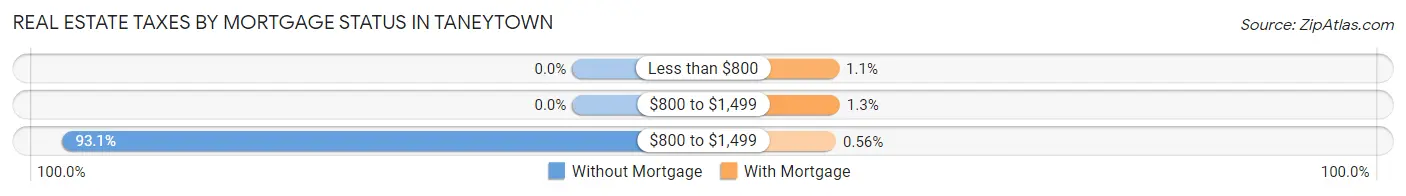
| Property Taxes | Without Mortgage | With Mortgage |
| Less than $800 | 0 (0.0%) | 18 (1.1%) |
| $800 to $1,499 | 0 (0.0%) | 20 (1.3%) |
| $800 to $1,499 | 603 (93.1%) | 9 (0.6%) |
| Total | 648 (100.0%) | 1,602 (100.0%) |
Health & Disability in Taneytown
Health Insurance Coverage by Age in Taneytown
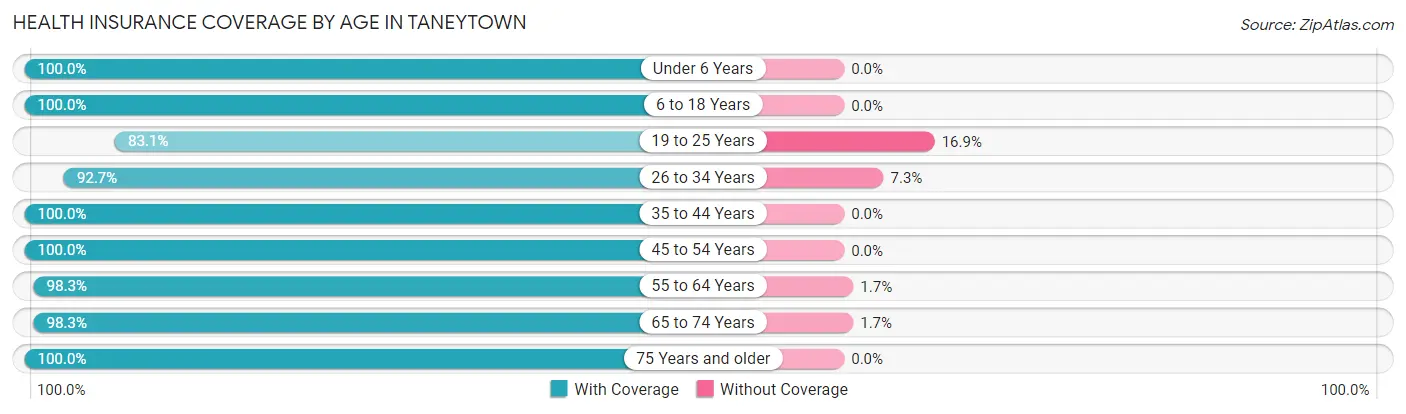
| Age Bracket | With Coverage | Without Coverage |
| Under 6 Years | 608 (100.0%) | 0 (0.0%) |
| 6 to 18 Years | 1,328 (100.0%) | 0 (0.0%) |
| 19 to 25 Years | 478 (83.1%) | 97 (16.9%) |
| 26 to 34 Years | 695 (92.7%) | 55 (7.3%) |
| 35 to 44 Years | 744 (100.0%) | 0 (0.0%) |
| 45 to 54 Years | 819 (100.0%) | 0 (0.0%) |
| 55 to 64 Years | 811 (98.3%) | 14 (1.7%) |
| 65 to 74 Years | 936 (98.3%) | 16 (1.7%) |
| 75 Years and older | 540 (100.0%) | 0 (0.0%) |
| Total | 6,959 (97.5%) | 182 (2.5%) |
Health Insurance Coverage by Citizenship Status in Taneytown
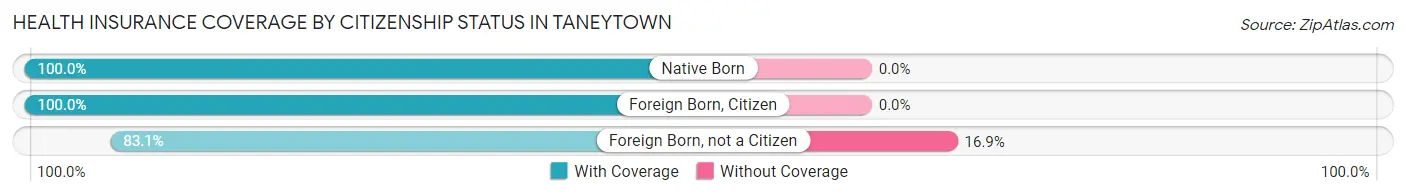
| Citizenship Status | With Coverage | Without Coverage |
| Native Born | 608 (100.0%) | 0 (0.0%) |
| Foreign Born, Citizen | 1,328 (100.0%) | 0 (0.0%) |
| Foreign Born, not a Citizen | 478 (83.1%) | 97 (16.9%) |
Health Insurance Coverage by Household Income in Taneytown
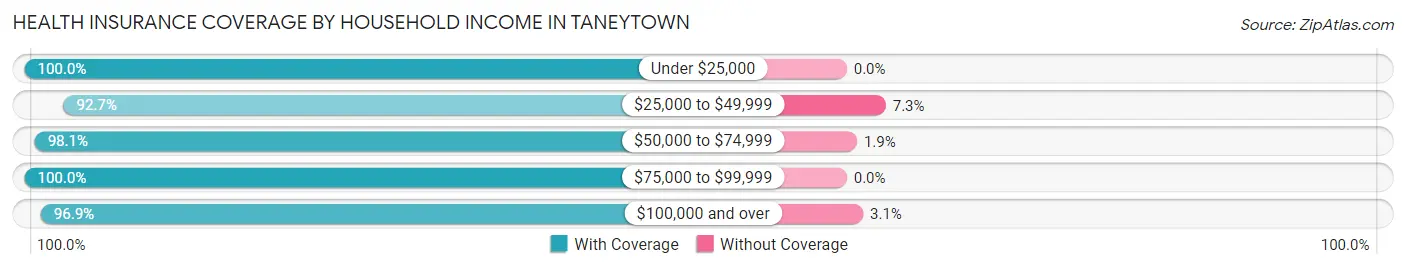
| Household Income | With Coverage | Without Coverage |
| Under $25,000 | 897 (100.0%) | 0 (0.0%) |
| $25,000 to $49,999 | 647 (92.7%) | 51 (7.3%) |
| $50,000 to $74,999 | 1,290 (98.1%) | 25 (1.9%) |
| $75,000 to $99,999 | 760 (100.0%) | 0 (0.0%) |
| $100,000 and over | 3,361 (96.9%) | 106 (3.1%) |
Public vs Private Health Insurance Coverage by Age in Taneytown
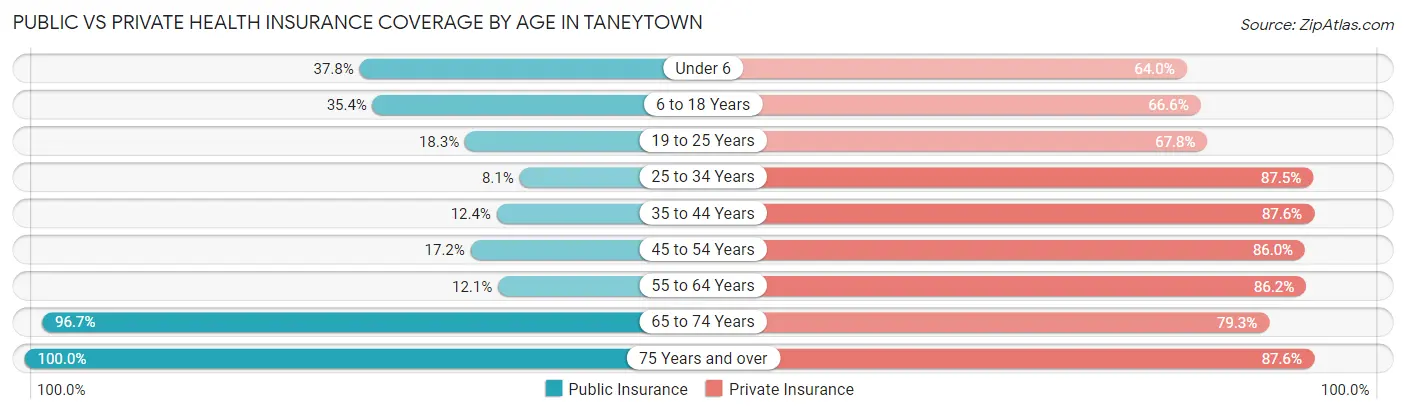
| Age Bracket | Public Insurance | Private Insurance |
| Under 6 | 230 (37.8%) | 389 (64.0%) |
| 6 to 18 Years | 470 (35.4%) | 884 (66.6%) |
| 19 to 25 Years | 105 (18.3%) | 390 (67.8%) |
| 25 to 34 Years | 61 (8.1%) | 656 (87.5%) |
| 35 to 44 Years | 92 (12.4%) | 652 (87.6%) |
| 45 to 54 Years | 141 (17.2%) | 704 (86.0%) |
| 55 to 64 Years | 100 (12.1%) | 711 (86.2%) |
| 65 to 74 Years | 921 (96.7%) | 755 (79.3%) |
| 75 Years and over | 540 (100.0%) | 473 (87.6%) |
| Total | 2,660 (37.2%) | 5,614 (78.6%) |
Disability Status by Sex by Age in Taneytown
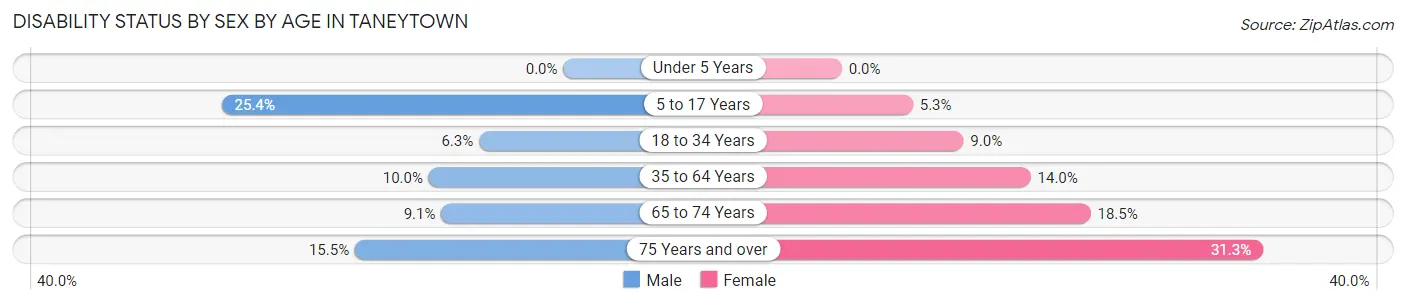
| Age Bracket | Male | Female |
| Under 5 Years | 0 (0.0%) | 0 (0.0%) |
| 5 to 17 Years | 156 (25.4%) | 43 (5.3%) |
| 18 to 34 Years | 46 (6.3%) | 58 (9.0%) |
| 35 to 64 Years | 106 (10.0%) | 186 (14.0%) |
| 65 to 74 Years | 46 (9.1%) | 82 (18.5%) |
| 75 Years and over | 41 (15.5%) | 86 (31.3%) |
Disability Class by Sex by Age in Taneytown
Disability Class: Hearing Difficulty
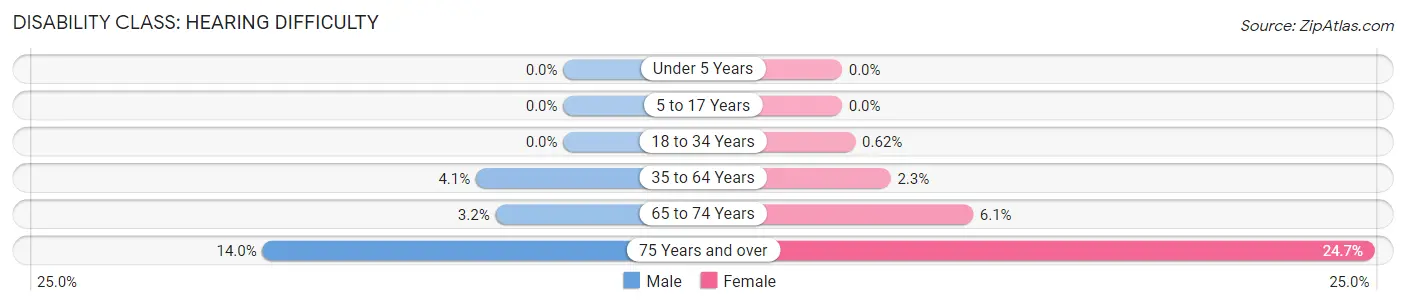
| Age Bracket | Male | Female |
| Under 5 Years | 0 (0.0%) | 0 (0.0%) |
| 5 to 17 Years | 0 (0.0%) | 0 (0.0%) |
| 18 to 34 Years | 0 (0.0%) | 4 (0.6%) |
| 35 to 64 Years | 43 (4.1%) | 30 (2.3%) |
| 65 to 74 Years | 16 (3.2%) | 27 (6.1%) |
| 75 Years and over | 37 (14.0%) | 68 (24.7%) |
Disability Class: Vision Difficulty
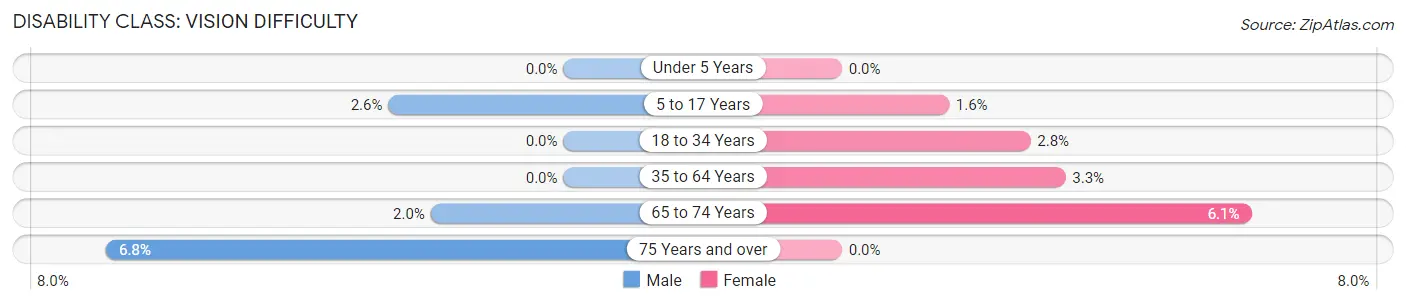
| Age Bracket | Male | Female |
| Under 5 Years | 0 (0.0%) | 0 (0.0%) |
| 5 to 17 Years | 16 (2.6%) | 13 (1.6%) |
| 18 to 34 Years | 0 (0.0%) | 18 (2.8%) |
| 35 to 64 Years | 0 (0.0%) | 44 (3.3%) |
| 65 to 74 Years | 10 (2.0%) | 27 (6.1%) |
| 75 Years and over | 18 (6.8%) | 0 (0.0%) |
Disability Class: Cognitive Difficulty
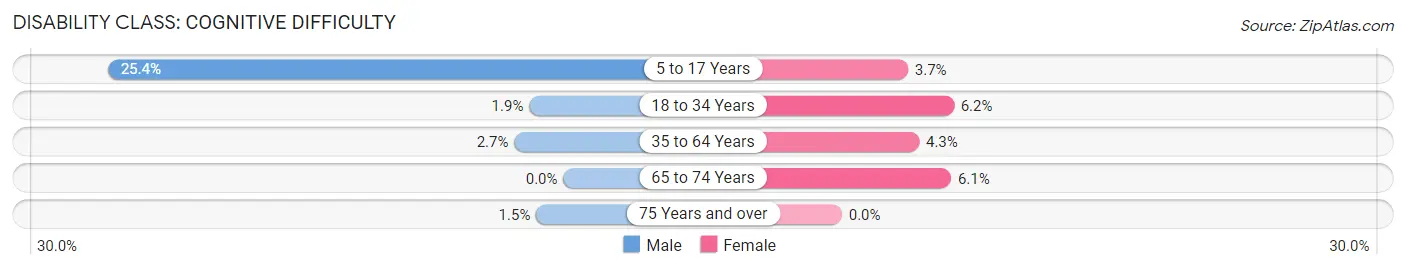
| Age Bracket | Male | Female |
| 5 to 17 Years | 156 (25.4%) | 30 (3.7%) |
| 18 to 34 Years | 14 (1.9%) | 40 (6.2%) |
| 35 to 64 Years | 29 (2.7%) | 57 (4.3%) |
| 65 to 74 Years | 0 (0.0%) | 27 (6.1%) |
| 75 Years and over | 4 (1.5%) | 0 (0.0%) |
Disability Class: Ambulatory Difficulty
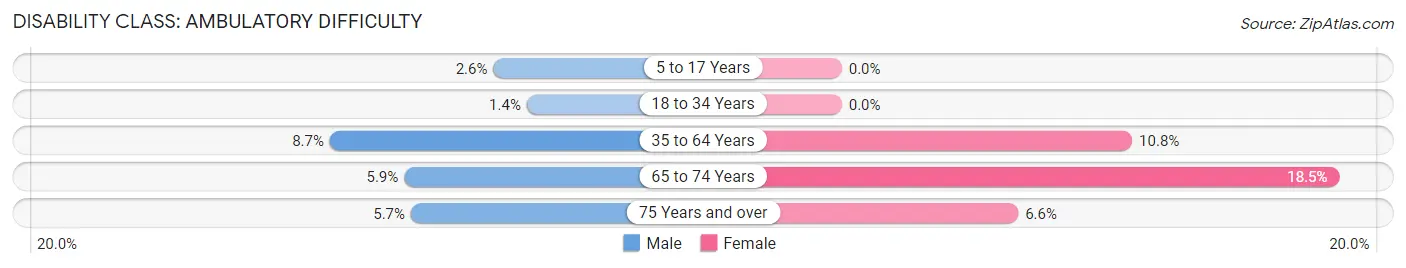
| Age Bracket | Male | Female |
| 5 to 17 Years | 16 (2.6%) | 0 (0.0%) |
| 18 to 34 Years | 10 (1.4%) | 0 (0.0%) |
| 35 to 64 Years | 92 (8.7%) | 143 (10.8%) |
| 65 to 74 Years | 30 (5.9%) | 82 (18.5%) |
| 75 Years and over | 15 (5.7%) | 18 (6.6%) |
Disability Class: Self-Care Difficulty
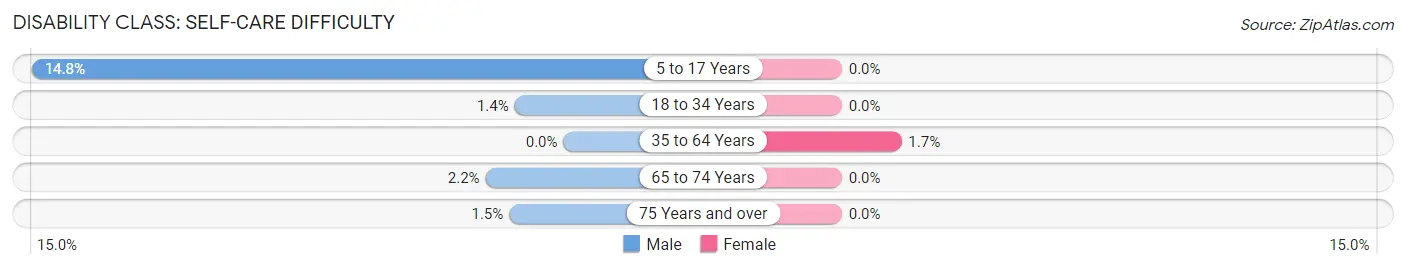
| Age Bracket | Male | Female |
| 5 to 17 Years | 91 (14.8%) | 0 (0.0%) |
| 18 to 34 Years | 10 (1.4%) | 0 (0.0%) |
| 35 to 64 Years | 0 (0.0%) | 22 (1.7%) |
| 65 to 74 Years | 11 (2.2%) | 0 (0.0%) |
| 75 Years and over | 4 (1.5%) | 0 (0.0%) |
Technology Access in Taneytown
Computing Device Access in Taneytown
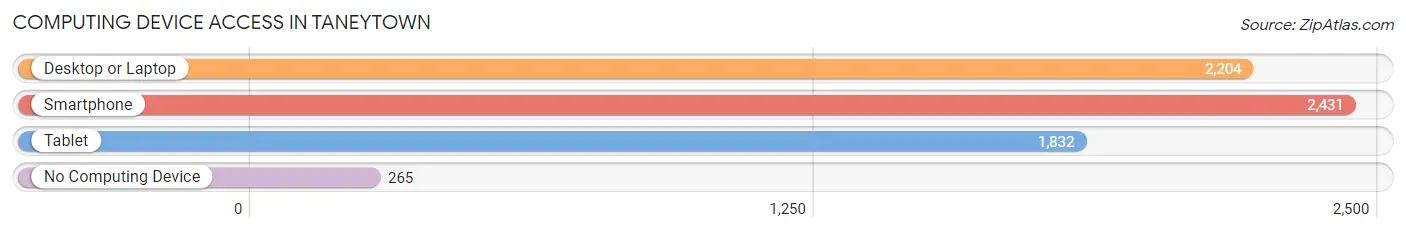
| Device Type | # Households | % Households |
| Desktop or Laptop | 2,204 | 78.9% |
| Smartphone | 2,431 | 87.1% |
| Tablet | 1,832 | 65.6% |
| No Computing Device | 265 | 9.5% |
| Total | 2,792 | 100.0% |
Internet Access in Taneytown
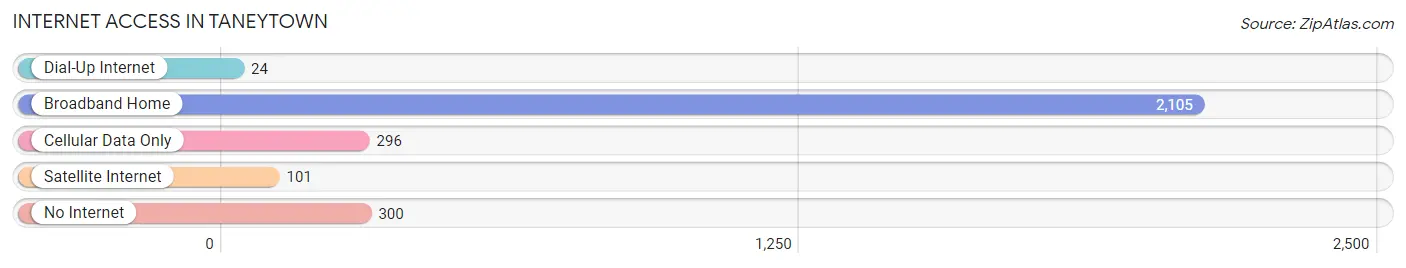
| Internet Type | # Households | % Households |
| Dial-Up Internet | 24 | 0.9% |
| Broadband Home | 2,105 | 75.4% |
| Cellular Data Only | 296 | 10.6% |
| Satellite Internet | 101 | 3.6% |
| No Internet | 300 | 10.7% |
| Total | 2,792 | 100.0% |
Taneytown Summary
Taneytown is a small town located in Carroll County, Maryland, United States. It is situated in the northern part of the state, about 30 miles northwest of Baltimore and 40 miles south of Harrisburg, Pennsylvania. The town was founded in 1754 and is named after the Taney family, who were among the first settlers in the area. As of the 2010 census, the population of Taneytown was 6,728.
History
Taneytown was founded in 1754 by the Taney family, who were among the first settlers in the area. The town was originally known as Taney's Town, and was later shortened to Taneytown. The town was incorporated in 1815 and was named after the Taney family.
The town was an important stop on the National Road, which was the first federally funded highway in the United States. The road was built in the early 19th century and connected Cumberland, Maryland to Vandalia, Illinois. The road was an important route for settlers heading west and for goods being transported between the east and west coasts.
During the Civil War, Taneytown was the site of a major battle between Union and Confederate forces. The Battle of Taneytown was fought on July 1, 1863 and resulted in a Union victory.
Geography
Taneytown is located in northern Maryland, about 30 miles northwest of Baltimore and 40 miles south of Harrisburg, Pennsylvania. The town is situated in the Piedmont region of Maryland, which is characterized by rolling hills and valleys. The town is located in the Monocacy River Valley, which is a tributary of the Potomac River.
The town has a total area of 2.2 square miles, all of which is land. The town is located at an elevation of 545 feet above sea level.
Economy
Taneytown's economy is largely based on agriculture and tourism. The town is home to several farms, which produce a variety of crops, including corn, soybeans, wheat, and hay. The town is also home to several wineries, which produce a variety of wines.
The town is also home to several small businesses, including restaurants, retail stores, and professional services. The town is also home to several manufacturing companies, which produce a variety of products, including furniture, clothing, and electronics.
Demographics
As of the 2010 census, the population of Taneytown was 6,728. The town has a population density of 3,039 people per square mile. The median age of the population is 39.7 years, and the median household income is $60,945.
The town is predominantly white, with 91.3% of the population identifying as white. The town also has a small Hispanic population, with 4.3% of the population identifying as Hispanic or Latino. The town also has a small African American population, with 2.2% of the population identifying as African American.
Conclusion
Taneytown is a small town located in Carroll County, Maryland. The town was founded in 1754 and is named after the Taney family, who were among the first settlers in the area. The town was an important stop on the National Road and was the site of a major battle during the Civil War. The town's economy is largely based on agriculture and tourism, and the population is predominantly white.
Common Questions
What is Per Capita Income in Taneytown?
Per Capita income in Taneytown is $36,589.
What is the Median Family Income in Taneytown?
Median Family Income in Taneytown is $101,823.
What is the Median Household income in Taneytown?
Median Household Income in Taneytown is $78,333.
What is Income or Wage Gap in Taneytown?
Income or Wage Gap in Taneytown is 23.7%.
Women in Taneytown earn 76.3 cents for every dollar earned by a man.
What is Family Income Deficit in Taneytown?
Family Income Deficit in Taneytown is $17,848.
Families that are below poverty line in Taneytown earn $17,848 less on average than the poverty threshold level.
What is Inequality or Gini Index in Taneytown?
Inequality or Gini Index in Taneytown is 0.41.
What is the Total Population of Taneytown?
Total Population of Taneytown is 7,234.
What is the Total Male Population of Taneytown?
Total Male Population of Taneytown is 3,447.
What is the Total Female Population of Taneytown?
Total Female Population of Taneytown is 3,787.
What is the Ratio of Males per 100 Females in Taneytown?
There are 91.02 Males per 100 Females in Taneytown.
What is the Ratio of Females per 100 Males in Taneytown?
There are 109.86 Females per 100 Males in Taneytown.
What is the Median Population Age in Taneytown?
Median Population Age in Taneytown is 38.7 Years.
What is the Average Family Size in Taneytown
Average Family Size in Taneytown is 3.2 People.
What is the Average Household Size in Taneytown
Average Household Size in Taneytown is 2.6 People.
How Large is the Labor Force in Taneytown?
There are 3,278 People in the Labor Forcein in Taneytown.
What is the Percentage of People in the Labor Force in Taneytown?
59.5% of People are in the Labor Force in Taneytown.
What is the Unemployment Rate in Taneytown?
Unemployment Rate in Taneytown is 4.2%.