Cities with the Most Immigrants from Northern Africa in Maryland
RELATED REPORTS & OPTIONS
Northern Africa
Maryland
Compare Cities
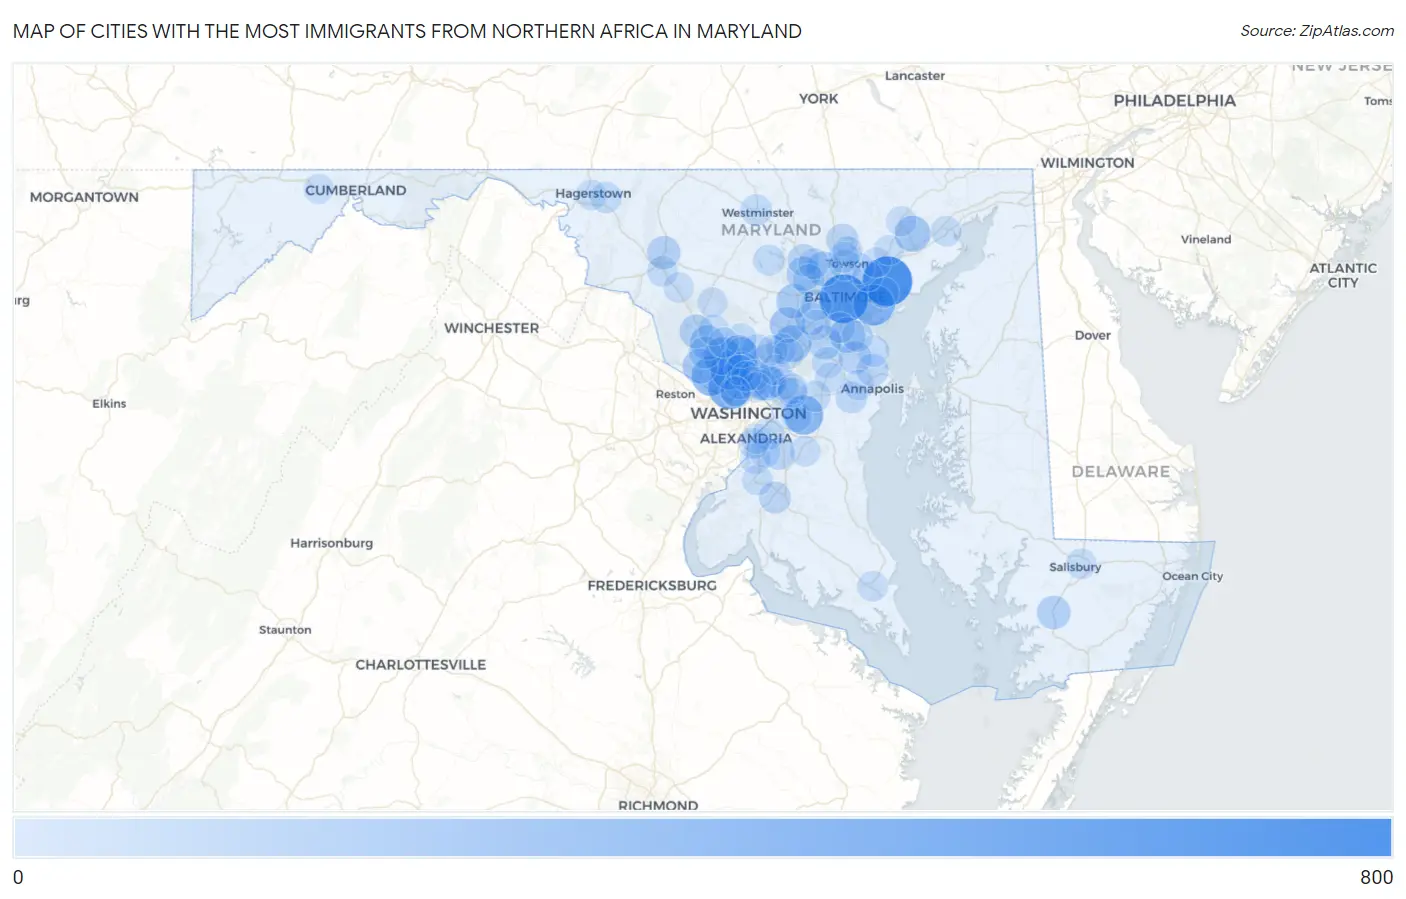
Map of Cities with the Most Immigrants from Northern Africa in Maryland
0
800
Cities with the Most Immigrants from Northern Africa in Maryland
| City | Northern Africa | vs State | vs National | |
| 1. | Middle River | 675 | 9,113(7.41%)#1 | 421,832(0.16%)#76 |
| 2. | Baltimore | 642 | 9,113(7.04%)#2 | 421,832(0.15%)#84 |
| 3. | Bethesda | 447 | 9,113(4.91%)#3 | 421,832(0.11%)#133 |
| 4. | Dundalk | 377 | 9,113(4.14%)#4 | 421,832(0.09%)#162 |
| 5. | Aspen Hill | 321 | 9,113(3.52%)#5 | 421,832(0.08%)#209 |
| 6. | Potomac | 317 | 9,113(3.48%)#6 | 421,832(0.08%)#215 |
| 7. | Kettering | 311 | 9,113(3.41%)#7 | 421,832(0.07%)#221 |
| 8. | North Bethesda | 301 | 9,113(3.30%)#8 | 421,832(0.07%)#232 |
| 9. | Rockville | 256 | 9,113(2.81%)#9 | 421,832(0.06%)#273 |
| 10. | North Laurel | 235 | 9,113(2.58%)#10 | 421,832(0.06%)#299 |
| 11. | Adelphi | 203 | 9,113(2.23%)#11 | 421,832(0.05%)#359 |
| 12. | Bel Air South | 201 | 9,113(2.21%)#12 | 421,832(0.05%)#363 |
| 13. | Glen Burnie | 187 | 9,113(2.05%)#13 | 421,832(0.04%)#398 |
| 14. | Columbia | 185 | 9,113(2.03%)#14 | 421,832(0.04%)#404 |
| 15. | Travilah | 163 | 9,113(1.79%)#15 | 421,832(0.04%)#451 |
| 16. | Ellicott City | 160 | 9,113(1.76%)#16 | 421,832(0.04%)#461 |
| 17. | Pikesville | 157 | 9,113(1.72%)#17 | 421,832(0.04%)#466 |
| 18. | Gaithersburg | 152 | 9,113(1.67%)#18 | 421,832(0.04%)#482 |
| 19. | Randallstown | 147 | 9,113(1.61%)#19 | 421,832(0.03%)#503 |
| 20. | Severn | 125 | 9,113(1.37%)#20 | 421,832(0.03%)#574 |
| 21. | Germantown | 123 | 9,113(1.35%)#21 | 421,832(0.03%)#581 |
| 22. | Princess Anne | 123 | 9,113(1.35%)#22 | 421,832(0.03%)#583 |
| 23. | Frederick | 114 | 9,113(1.25%)#23 | 421,832(0.03%)#621 |
| 24. | Woodlawn Cdp Baltimore County | 91 | 9,113(1.00%)#24 | 421,832(0.02%)#747 |
| 25. | Severna Park | 90 | 9,113(0.99%)#25 | 421,832(0.02%)#754 |
| 26. | Ilchester | 84 | 9,113(0.92%)#26 | 421,832(0.02%)#781 |
| 27. | Cockeysville | 82 | 9,113(0.90%)#27 | 421,832(0.02%)#797 |
| 28. | Arnold | 79 | 9,113(0.87%)#28 | 421,832(0.02%)#816 |
| 29. | North Potomac | 75 | 9,113(0.82%)#29 | 421,832(0.02%)#858 |
| 30. | Clinton | 71 | 9,113(0.78%)#30 | 421,832(0.02%)#890 |
| 31. | Owings Mills | 65 | 9,113(0.71%)#31 | 421,832(0.02%)#949 |
| 32. | Waldorf | 64 | 9,113(0.70%)#32 | 421,832(0.02%)#960 |
| 33. | Marlow Heights | 61 | 9,113(0.67%)#33 | 421,832(0.01%)#999 |
| 34. | Milford Mill | 58 | 9,113(0.64%)#34 | 421,832(0.01%)#1,028 |
| 35. | Green Valley | 58 | 9,113(0.64%)#35 | 421,832(0.01%)#1,032 |
| 36. | Riva | 55 | 9,113(0.60%)#36 | 421,832(0.01%)#1,066 |
| 37. | Fairland | 52 | 9,113(0.57%)#37 | 421,832(0.01%)#1,101 |
| 38. | Cloverly | 52 | 9,113(0.57%)#38 | 421,832(0.01%)#1,103 |
| 39. | Greenbelt | 50 | 9,113(0.55%)#39 | 421,832(0.01%)#1,126 |
| 40. | Robinwood | 50 | 9,113(0.55%)#40 | 421,832(0.01%)#1,132 |
| 41. | Westminster | 48 | 9,113(0.53%)#41 | 421,832(0.01%)#1,162 |
| 42. | Lake Shore | 46 | 9,113(0.50%)#42 | 421,832(0.01%)#1,195 |
| 43. | Largo | 46 | 9,113(0.50%)#43 | 421,832(0.01%)#1,199 |
| 44. | Bowie | 45 | 9,113(0.49%)#44 | 421,832(0.01%)#1,205 |
| 45. | Towson | 41 | 9,113(0.45%)#45 | 421,832(0.01%)#1,280 |
| 46. | Catonsville | 40 | 9,113(0.44%)#46 | 421,832(0.01%)#1,295 |
| 47. | Eldersburg | 40 | 9,113(0.44%)#47 | 421,832(0.01%)#1,298 |
| 48. | Wheaton | 38 | 9,113(0.42%)#48 | 421,832(0.01%)#1,332 |
| 49. | Odenton | 38 | 9,113(0.42%)#49 | 421,832(0.01%)#1,334 |
| 50. | Pasadena | 38 | 9,113(0.42%)#50 | 421,832(0.01%)#1,336 |
| 51. | College Park | 36 | 9,113(0.40%)#51 | 421,832(0.01%)#1,372 |
| 52. | Olney | 34 | 9,113(0.37%)#52 | 421,832(0.01%)#1,420 |
| 53. | Garrison | 34 | 9,113(0.37%)#53 | 421,832(0.01%)#1,434 |
| 54. | Parkville | 33 | 9,113(0.36%)#54 | 421,832(0.01%)#1,452 |
| 55. | Leisure World | 33 | 9,113(0.36%)#55 | 421,832(0.01%)#1,460 |
| 56. | Ballenger Creek | 30 | 9,113(0.33%)#56 | 421,832(0.01%)#1,517 |
| 57. | Chevy Chase | 29 | 9,113(0.32%)#57 | 421,832(0.01%)#1,555 |
| 58. | Lutherville | 29 | 9,113(0.32%)#58 | 421,832(0.01%)#1,557 |
| 59. | Fort Washington | 28 | 9,113(0.31%)#59 | 421,832(0.01%)#1,574 |
| 60. | California | 28 | 9,113(0.31%)#60 | 421,832(0.01%)#1,582 |
| 61. | Silver Spring | 27 | 9,113(0.30%)#61 | 421,832(0.01%)#1,596 |
| 62. | Langley Park | 27 | 9,113(0.30%)#62 | 421,832(0.01%)#1,607 |
| 63. | Parole | 26 | 9,113(0.29%)#63 | 421,832(0.01%)#1,630 |
| 64. | Accokeek | 26 | 9,113(0.29%)#64 | 421,832(0.01%)#1,633 |
| 65. | Marlton | 26 | 9,113(0.29%)#65 | 421,832(0.01%)#1,634 |
| 66. | Hagerstown | 24 | 9,113(0.26%)#66 | 421,832(0.01%)#1,684 |
| 67. | Ferndale | 23 | 9,113(0.25%)#67 | 421,832(0.01%)#1,725 |
| 68. | Montgomery Village | 22 | 9,113(0.24%)#68 | 421,832(0.01%)#1,750 |
| 69. | Friendship Heights Village | 21 | 9,113(0.23%)#69 | 421,832(0.00%)#1,799 |
| 70. | Salisbury | 20 | 9,113(0.22%)#70 | 421,832(0.00%)#1,811 |
| 71. | Flower Hill | 20 | 9,113(0.22%)#71 | 421,832(0.00%)#1,816 |
| 72. | Urbana | 20 | 9,113(0.22%)#72 | 421,832(0.00%)#1,818 |
| 73. | West Laurel | 20 | 9,113(0.22%)#73 | 421,832(0.00%)#1,830 |
| 74. | Redland | 19 | 9,113(0.21%)#74 | 421,832(0.00%)#1,860 |
| 75. | Friendly | 19 | 9,113(0.21%)#75 | 421,832(0.00%)#1,865 |
| 76. | National Harbor | 19 | 9,113(0.21%)#76 | 421,832(0.00%)#1,872 |
| 77. | Essex | 18 | 9,113(0.20%)#77 | 421,832(0.00%)#1,887 |
| 78. | Aberdeen | 18 | 9,113(0.20%)#78 | 421,832(0.00%)#1,900 |
| 79. | New Carrollton | 17 | 9,113(0.19%)#79 | 421,832(0.00%)#1,946 |
| 80. | Overlea | 17 | 9,113(0.19%)#80 | 421,832(0.00%)#1,950 |
| 81. | North Kensington | 17 | 9,113(0.19%)#81 | 421,832(0.00%)#1,960 |
| 82. | Honeygo | 16 | 9,113(0.18%)#82 | 421,832(0.00%)#2,007 |
| 83. | Four Corners | 16 | 9,113(0.18%)#83 | 421,832(0.00%)#2,018 |
| 84. | Elkridge | 15 | 9,113(0.16%)#84 | 421,832(0.00%)#2,057 |
| 85. | Bel Air North | 14 | 9,113(0.15%)#85 | 421,832(0.00%)#2,111 |
| 86. | Beltsville | 14 | 9,113(0.15%)#86 | 421,832(0.00%)#2,116 |
| 87. | Takoma Park | 14 | 9,113(0.15%)#87 | 421,832(0.00%)#2,120 |
| 88. | Timonium | 13 | 9,113(0.14%)#88 | 421,832(0.00%)#2,171 |
| 89. | Forest Glen | 13 | 9,113(0.14%)#89 | 421,832(0.00%)#2,187 |
| 90. | Perry Hall | 12 | 9,113(0.13%)#90 | 421,832(0.00%)#2,221 |
| 91. | Kingsville | 12 | 9,113(0.13%)#91 | 421,832(0.00%)#2,251 |
| 92. | Seabrook | 11 | 9,113(0.12%)#92 | 421,832(0.00%)#2,280 |
| 93. | Forest Heights | 11 | 9,113(0.12%)#93 | 421,832(0.00%)#2,303 |
| 94. | Burtonsville | 10 | 9,113(0.11%)#94 | 421,832(0.00%)#2,344 |
| 95. | Somerset | 9 | 9,113(0.10%)#95 | 421,832(0.00%)#2,443 |
| 96. | Laurel | 8 | 9,113(0.09%)#96 | 421,832(0.00%)#2,463 |
| 97. | Crofton | 8 | 9,113(0.09%)#97 | 421,832(0.00%)#2,464 |
| 98. | Damascus | 7 | 9,113(0.08%)#98 | 421,832(0.00%)#2,537 |
| 99. | Lanham | 7 | 9,113(0.08%)#99 | 421,832(0.00%)#2,540 |
| 100. | Frostburg | 7 | 9,113(0.08%)#100 | 421,832(0.00%)#2,554 |
Common Questions
What are the Top 10 Cities with the Most Immigrants from Northern Africa in Maryland?
Top 10 Cities with the Most Immigrants from Northern Africa in Maryland are:
#1
675
#2
642
#3
447
#4
377
#5
321
#6
317
#7
311
#8
301
#9
256
#10
235
What city has the Most Immigrants from Northern Africa in Maryland?
Middle River has the Most Immigrants from Northern Africa in Maryland with 675.
What is the Total Immigrants from Northern Africa in the State of Maryland?
Total Immigrants from Northern Africa in Maryland is 9,113.
What is the Total Immigrants from Northern Africa in the United States?
Total Immigrants from Northern Africa in the United States is 421,832.