College Park, MD Map & Demographics
College Park Map
College Park Overview
$26,381
PER CAPITA INCOME
$112,587
AVG FAMILY INCOME
$76,973
AVG HOUSEHOLD INCOME
55.2%
WAGE / INCOME GAP [ % ]
44.8¢/ $1
WAGE / INCOME GAP [ $ ]
0.49
INEQUALITY / GINI INDEX
34,416
TOTAL POPULATION
17,549
MALE POPULATION
16,867
FEMALE POPULATION
104.04
MALES / 100 FEMALES
96.11
FEMALES / 100 MALES
21.6
MEDIAN AGE
3.2
AVG FAMILY SIZE
2.7
AVG HOUSEHOLD SIZE
17,453
LABOR FORCE [ PEOPLE ]
55.4%
PERCENT IN LABOR FORCE
6.7%
UNEMPLOYMENT RATE
Income in College Park
Income Overview in College Park
Per Capita Income in College Park is $26,381, while median incomes of families and households are $112,587 and $76,973 respectively.
| Characteristic | Number | Measure |
| Per Capita Income | 34,416 | $26,381 |
| Median Family Income | 3,665 | $112,587 |
| Mean Family Income | 3,665 | $131,803 |
| Median Household Income | 8,835 | $76,973 |
| Mean Household Income | 8,835 | $95,307 |
| Income Deficit | 3,665 | $0 |
| Wage / Income Gap (%) | 34,416 | 55.22% |
| Wage / Income Gap ($) | 34,416 | 44.78¢ per $1 |
| Gini / Inequality Index | 34,416 | 0.49 |
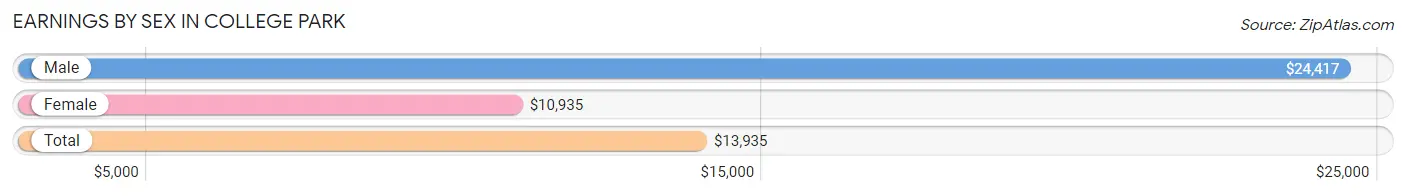
Earnings by Sex in College Park
Average Earnings in College Park are $13,935, $24,417 for men and $10,935 for women, a difference of 55.2%.
| Sex | Number | Average Earnings |
| Male | 11,454 (50.5%) | $24,417 |
| Female | 11,247 (49.5%) | $10,935 |
| Total | 22,701 (100.0%) | $13,935 |
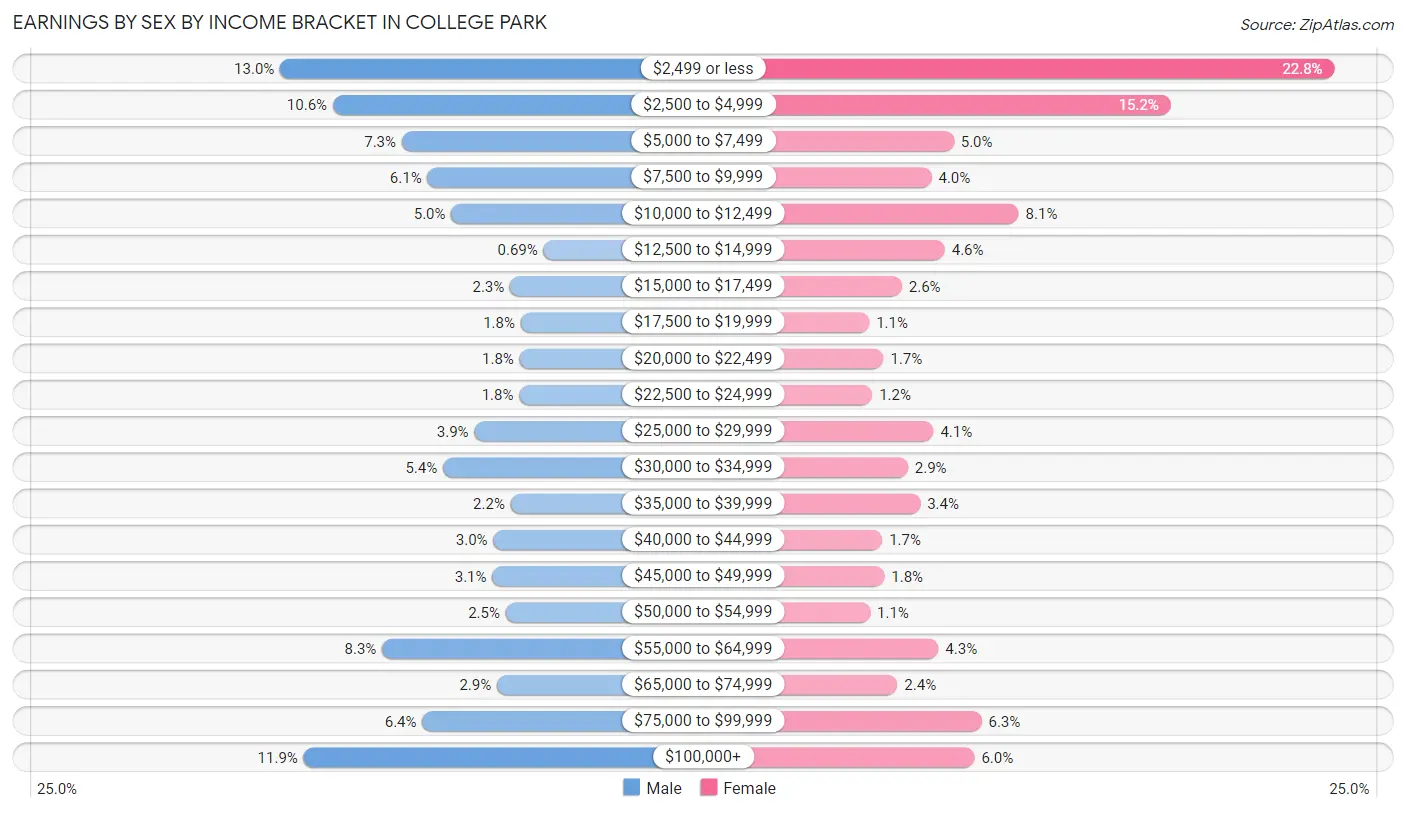
Earnings by Sex by Income Bracket in College Park
The most common earnings brackets in College Park are $2,499 or less for men (1,493 | 13.0%) and $2,499 or less for women (2,569 | 22.8%).
| Income | Male | Female |
| $2,499 or less | 1,493 (13.0%) | 2,569 (22.8%) |
| $2,500 to $4,999 | 1,210 (10.6%) | 1,706 (15.2%) |
| $5,000 to $7,499 | 840 (7.3%) | 563 (5.0%) |
| $7,500 to $9,999 | 702 (6.1%) | 447 (4.0%) |
| $10,000 to $12,499 | 574 (5.0%) | 905 (8.1%) |
| $12,500 to $14,999 | 79 (0.7%) | 516 (4.6%) |
| $15,000 to $17,499 | 259 (2.3%) | 290 (2.6%) |
| $17,500 to $19,999 | 202 (1.8%) | 118 (1.1%) |
| $20,000 to $22,499 | 207 (1.8%) | 193 (1.7%) |
| $22,500 to $24,999 | 210 (1.8%) | 134 (1.2%) |
| $25,000 to $29,999 | 450 (3.9%) | 457 (4.1%) |
| $30,000 to $34,999 | 618 (5.4%) | 322 (2.9%) |
| $35,000 to $39,999 | 255 (2.2%) | 387 (3.4%) |
| $40,000 to $44,999 | 348 (3.0%) | 187 (1.7%) |
| $45,000 to $49,999 | 354 (3.1%) | 198 (1.8%) |
| $50,000 to $54,999 | 282 (2.5%) | 123 (1.1%) |
| $55,000 to $64,999 | 945 (8.3%) | 482 (4.3%) |
| $65,000 to $74,999 | 329 (2.9%) | 267 (2.4%) |
| $75,000 to $99,999 | 730 (6.4%) | 710 (6.3%) |
| $100,000+ | 1,367 (11.9%) | 673 (6.0%) |
| Total | 11,454 (100.0%) | 11,247 (100.0%) |
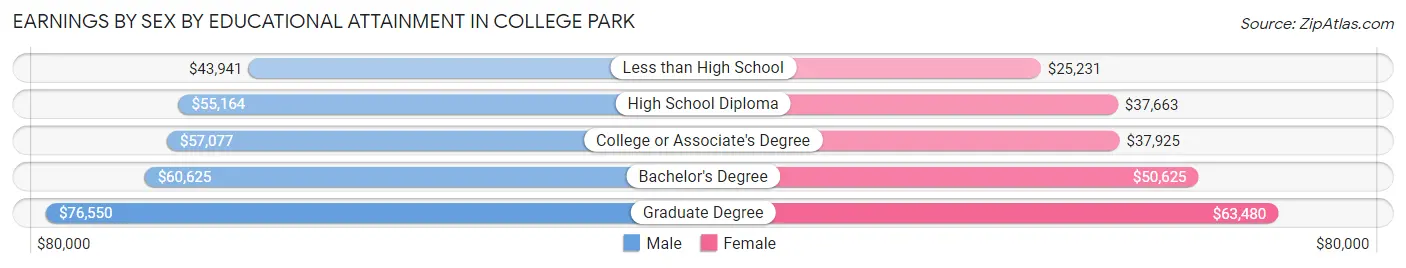
Earnings by Sex by Educational Attainment in College Park
Average earnings in College Park are $55,697 for men and $43,669 for women, a difference of 21.6%. Men with an educational attainment of graduate degree enjoy the highest average annual earnings of $76,550, while those with less than high school education earn the least with $43,941. Women with an educational attainment of graduate degree earn the most with the average annual earnings of $63,480, while those with less than high school education have the smallest earnings of $25,231.
| Educational Attainment | Male Income | Female Income |
| Less than High School | $43,941 | $25,231 |
| High School Diploma | $55,164 | $37,663 |
| College or Associate's Degree | $57,077 | $37,925 |
| Bachelor's Degree | $60,625 | $50,625 |
| Graduate Degree | $76,550 | $63,480 |
| Total | $55,697 | $43,669 |
Family Income in College Park
Family Income Brackets in College Park
According to the College Park family income data, there are 1,052 families falling into the $100,000 to $149,999 income range, which is the most common income bracket and makes up 28.7% of all families.
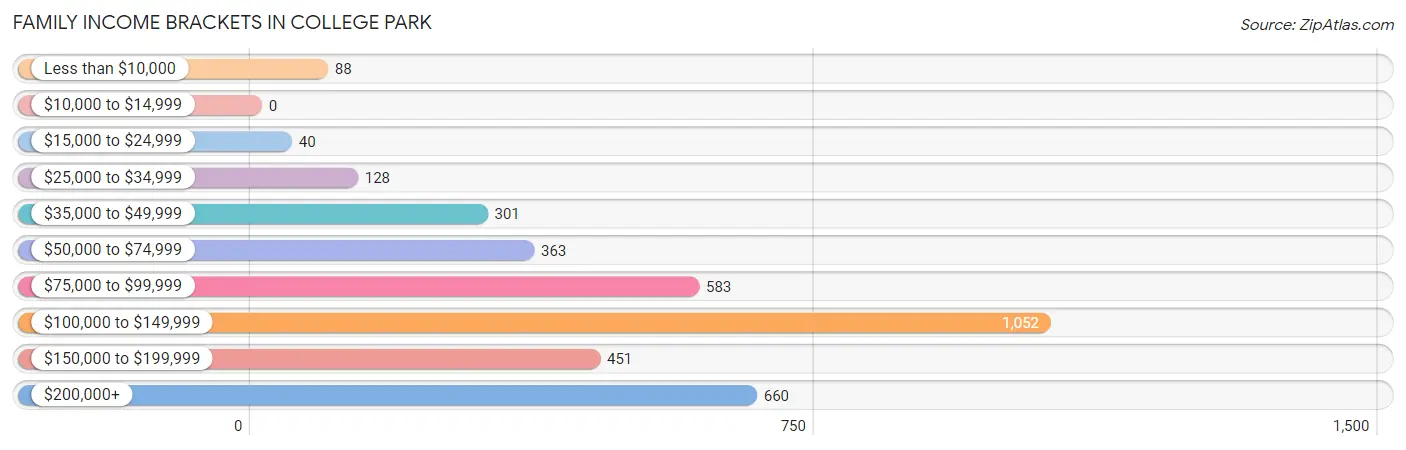
| Income Bracket | # Families | % Families |
| Less than $10,000 | 88 | 2.4% |
| $10,000 to $14,999 | 0 | 0.0% |
| $15,000 to $24,999 | 40 | 1.1% |
| $25,000 to $34,999 | 128 | 3.5% |
| $35,000 to $49,999 | 301 | 8.2% |
| $50,000 to $74,999 | 363 | 9.9% |
| $75,000 to $99,999 | 583 | 15.9% |
| $100,000 to $149,999 | 1,052 | 28.7% |
| $150,000 to $199,999 | 451 | 12.3% |
| $200,000+ | 660 | 18.0% |
Family Income by Famaliy Size in College Park
6-person families (107 | 2.9%) account for the highest median family income in College Park with $181,625 per family, while 2-person families (1,544 | 42.1%) have the highest median income of $53,176 per family member.
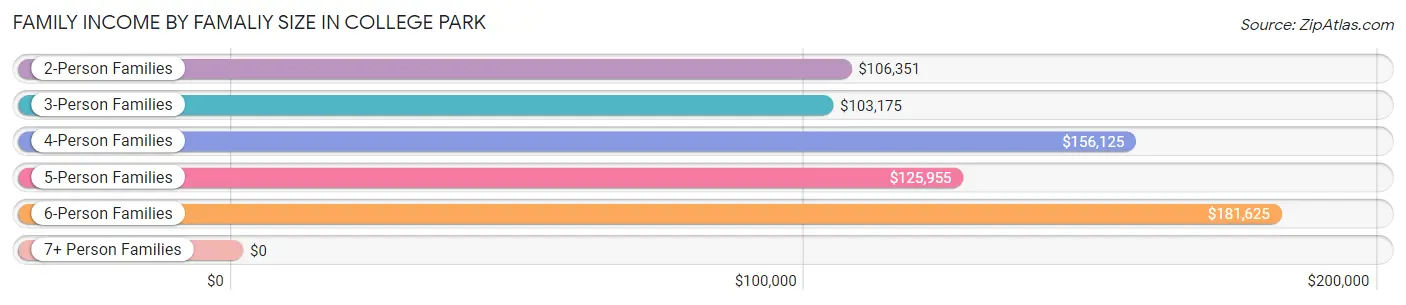
| Income Bracket | # Families | Median Income |
| 2-Person Families | 1,544 (42.1%) | $106,351 |
| 3-Person Families | 1,044 (28.5%) | $103,175 |
| 4-Person Families | 506 (13.8%) | $156,125 |
| 5-Person Families | 444 (12.1%) | $125,955 |
| 6-Person Families | 107 (2.9%) | $181,625 |
| 7+ Person Families | 20 (0.5%) | $0 |
| Total | 3,665 (100.0%) | $112,587 |
Family Income by Number of Earners in College Park
The median family income in College Park is $112,587, with families comprising 3+ earners (721) having the highest median family income of $148,617, while families with no earners (366) have the lowest median family income of $38,478, accounting for 19.7% and 10.0% of families, respectively.
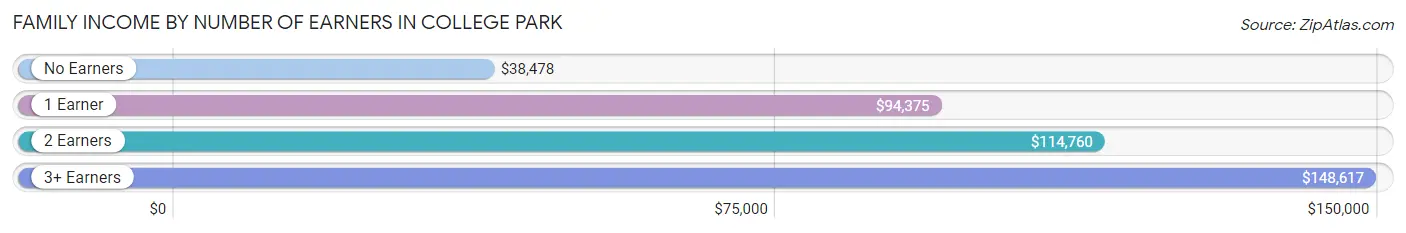
| Number of Earners | # Families | Median Income |
| No Earners | 366 (10.0%) | $38,478 |
| 1 Earner | 975 (26.6%) | $94,375 |
| 2 Earners | 1,603 (43.7%) | $114,760 |
| 3+ Earners | 721 (19.7%) | $148,617 |
| Total | 3,665 (100.0%) | $112,587 |
Household Income in College Park
Household Income Brackets in College Park
With 1,440 households falling in the category, the $100,000 to $149,999 income range is the most frequent in College Park, accounting for 16.3% of all households. In contrast, only 389 households (4.4%) fall into the $25,000 to $34,999 income bracket, making it the least populous group.
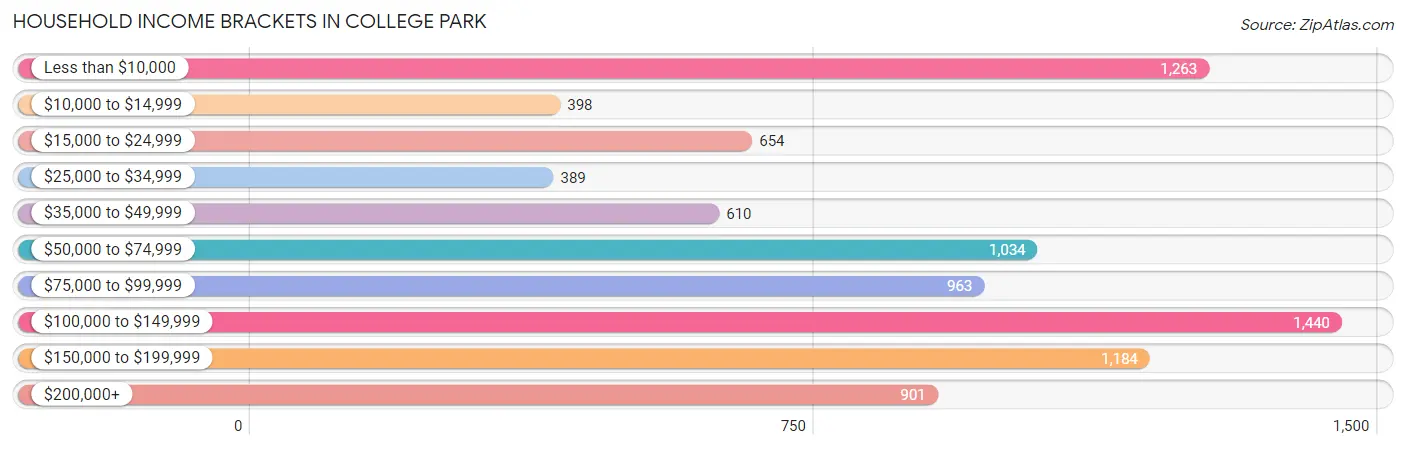
| Income Bracket | # Households | % Households |
| Less than $10,000 | 1,263 | 14.3% |
| $10,000 to $14,999 | 398 | 4.5% |
| $15,000 to $24,999 | 654 | 7.4% |
| $25,000 to $34,999 | 389 | 4.4% |
| $35,000 to $49,999 | 610 | 6.9% |
| $50,000 to $74,999 | 1,034 | 11.7% |
| $75,000 to $99,999 | 963 | 10.9% |
| $100,000 to $149,999 | 1,440 | 16.3% |
| $150,000 to $199,999 | 1,184 | 13.4% |
| $200,000+ | 901 | 10.2% |
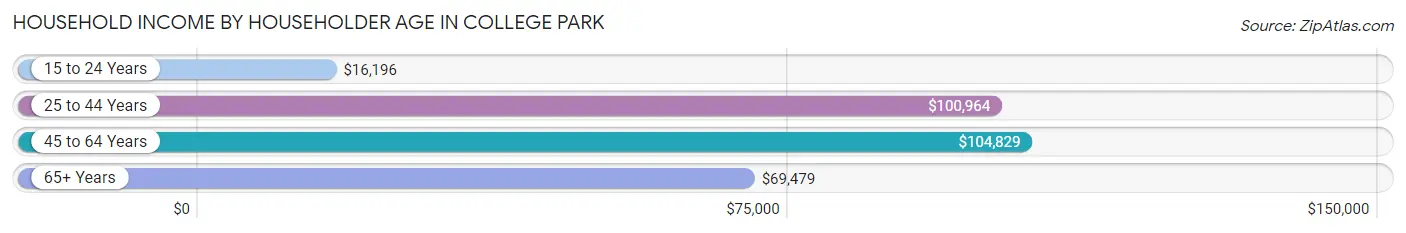
Household Income by Householder Age in College Park
The median household income in College Park is $76,973, with the highest median household income of $104,829 found in the 45 to 64 years age bracket for the primary householder. A total of 2,076 households (23.5%) fall into this category. Meanwhile, the 15 to 24 years age bracket for the primary householder has the lowest median household income of $16,196, with 2,381 households (27.0%) in this group.
| Income Bracket | # Households | Median Income |
| 15 to 24 Years | 2,381 (27.0%) | $16,196 |
| 25 to 44 Years | 2,974 (33.7%) | $100,964 |
| 45 to 64 Years | 2,076 (23.5%) | $104,829 |
| 65+ Years | 1,404 (15.9%) | $69,479 |
| Total | 8,835 (100.0%) | $76,973 |
Poverty in College Park
Income Below Poverty by Sex and Age in College Park
With 22.9% poverty level for males and 32.9% for females among the residents of College Park, 18 to 24 year old males and 18 to 24 year old females are the most vulnerable to poverty, with 1,977 males (61.2%) and 3,080 females (74.0%) in their respective age groups living below the poverty level.
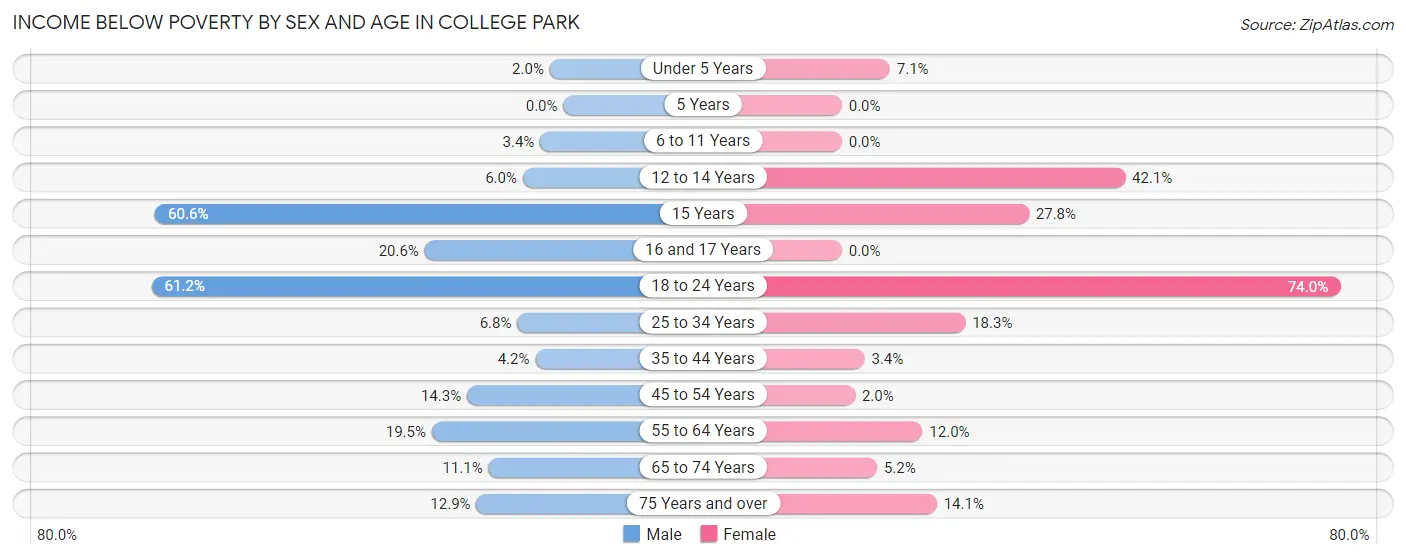
| Age Bracket | Male | Female |
| Under 5 Years | 13 (2.0%) | 49 (7.1%) |
| 5 Years | 0 (0.0%) | 0 (0.0%) |
| 6 to 11 Years | 15 (3.4%) | 0 (0.0%) |
| 12 to 14 Years | 20 (6.0%) | 61 (42.1%) |
| 15 Years | 20 (60.6%) | 20 (27.8%) |
| 16 and 17 Years | 21 (20.6%) | 0 (0.0%) |
| 18 to 24 Years | 1,977 (61.2%) | 3,080 (74.0%) |
| 25 to 34 Years | 137 (6.8%) | 367 (18.3%) |
| 35 to 44 Years | 83 (4.2%) | 36 (3.4%) |
| 45 to 54 Years | 175 (14.3%) | 18 (1.9%) |
| 55 to 64 Years | 221 (19.5%) | 113 (12.0%) |
| 65 to 74 Years | 84 (11.1%) | 35 (5.2%) |
| 75 Years and over | 39 (12.9%) | 85 (14.1%) |
| Total | 2,805 (22.9%) | 3,864 (32.9%) |
Income Above Poverty by Sex and Age in College Park
According to the poverty statistics in College Park, males aged 5 years and females aged 5 years are the age groups that are most secure financially, with 100.0% of males and 100.0% of females in these age groups living above the poverty line.
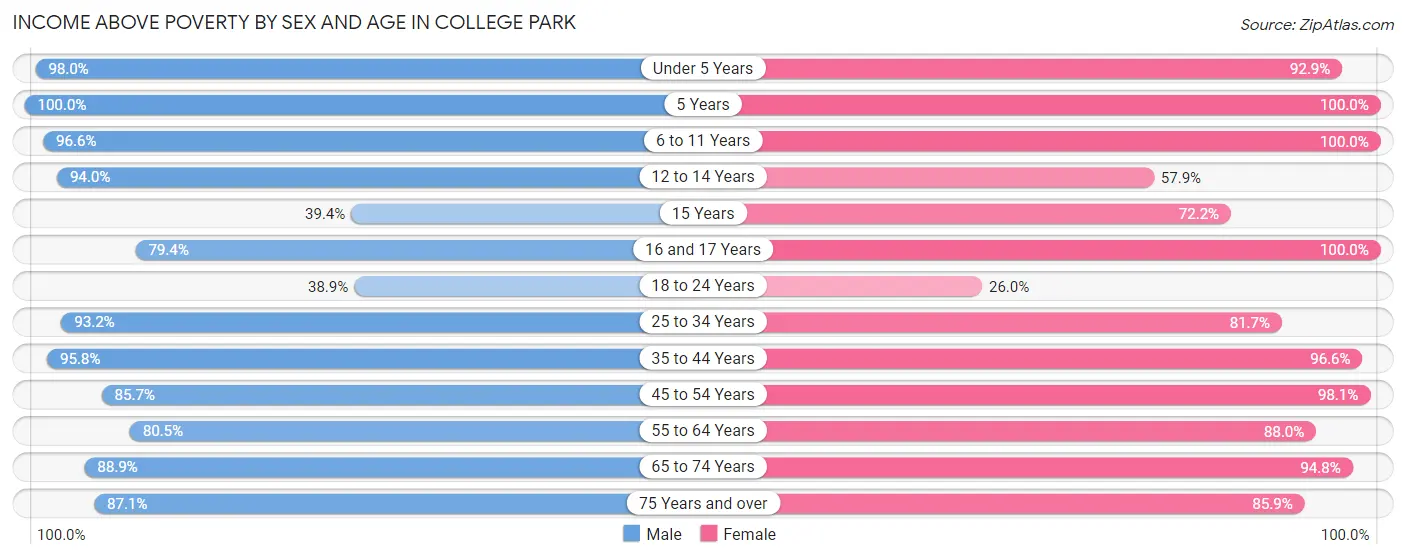
| Age Bracket | Male | Female |
| Under 5 Years | 630 (98.0%) | 637 (92.9%) |
| 5 Years | 61 (100.0%) | 35 (100.0%) |
| 6 to 11 Years | 421 (96.6%) | 313 (100.0%) |
| 12 to 14 Years | 312 (94.0%) | 84 (57.9%) |
| 15 Years | 13 (39.4%) | 52 (72.2%) |
| 16 and 17 Years | 81 (79.4%) | 117 (100.0%) |
| 18 to 24 Years | 1,256 (38.9%) | 1,084 (26.0%) |
| 25 to 34 Years | 1,866 (93.2%) | 1,635 (81.7%) |
| 35 to 44 Years | 1,909 (95.8%) | 1,028 (96.6%) |
| 45 to 54 Years | 1,048 (85.7%) | 906 (98.1%) |
| 55 to 64 Years | 910 (80.5%) | 831 (88.0%) |
| 65 to 74 Years | 672 (88.9%) | 635 (94.8%) |
| 75 Years and over | 263 (87.1%) | 518 (85.9%) |
| Total | 9,442 (77.1%) | 7,875 (67.1%) |
Income Below Poverty Among Married-Couple Families in College Park
The poverty statistics for married-couple families in College Park show that 1.5% or 39 of the total 2,532 families live below the poverty line. Families with 3 or 4 children have the highest poverty rate of 10.8%, comprising of 26 families. On the other hand, families with 1 or 2 children have the lowest poverty rate of 0.0%, which includes 0 families.
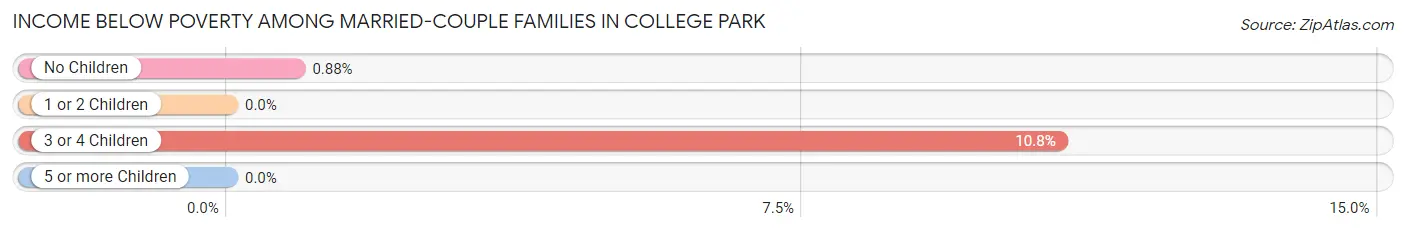
| Children | Above Poverty | Below Poverty |
| No Children | 1,471 (99.1%) | 13 (0.9%) |
| 1 or 2 Children | 798 (100.0%) | 0 (0.0%) |
| 3 or 4 Children | 214 (89.2%) | 26 (10.8%) |
| 5 or more Children | 10 (100.0%) | 0 (0.0%) |
| Total | 2,493 (98.5%) | 39 (1.5%) |
Income Below Poverty Among Single-Parent Households in College Park
According to the poverty data in College Park, 5.2% or 25 single-father households and 11.2% or 73 single-mother households are living below the poverty line. Among single-father households, those with no children have the highest poverty rate, with 25 households (6.9%) experiencing poverty. Likewise, among single-mother households, those with no children have the highest poverty rate, with 43 households (12.2%) falling below the poverty line.
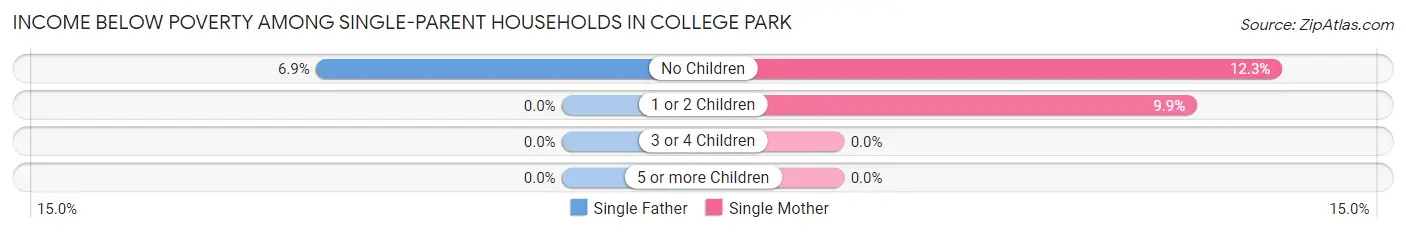
| Children | Single Father | Single Mother |
| No Children | 25 (6.9%) | 43 (12.2%) |
| 1 or 2 Children | 0 (0.0%) | 30 (9.9%) |
| 3 or 4 Children | 0 (0.0%) | 0 (0.0%) |
| 5 or more Children | 0 (0.0%) | 0 (0.0%) |
| Total | 25 (5.2%) | 73 (11.2%) |
Income Below Poverty Among Married-Couple vs Single-Parent Households in College Park
The poverty data for College Park shows that 39 of the married-couple family households (1.5%) and 98 of the single-parent households (8.6%) are living below the poverty level. Within the married-couple family households, those with 3 or 4 children have the highest poverty rate, with 26 households (10.8%) falling below the poverty line. Among the single-parent households, those with no children have the highest poverty rate, with 68 household (9.5%) living below poverty.
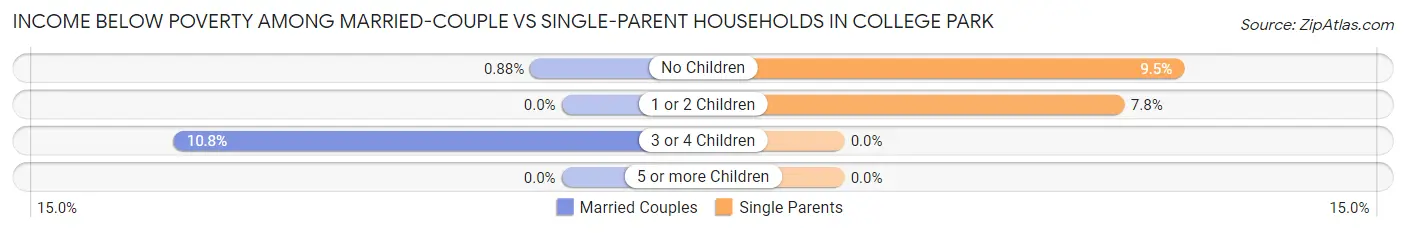
| Children | Married-Couple Families | Single-Parent Households |
| No Children | 13 (0.9%) | 68 (9.5%) |
| 1 or 2 Children | 0 (0.0%) | 30 (7.8%) |
| 3 or 4 Children | 26 (10.8%) | 0 (0.0%) |
| 5 or more Children | 0 (0.0%) | 0 (0.0%) |
| Total | 39 (1.5%) | 98 (8.6%) |
Race in College Park
The most populous races in College Park are White / Caucasian (15,605 | 45.3%), Black / African American (7,782 | 22.6%), and Hispanic or Latino (5,662 | 16.5%).
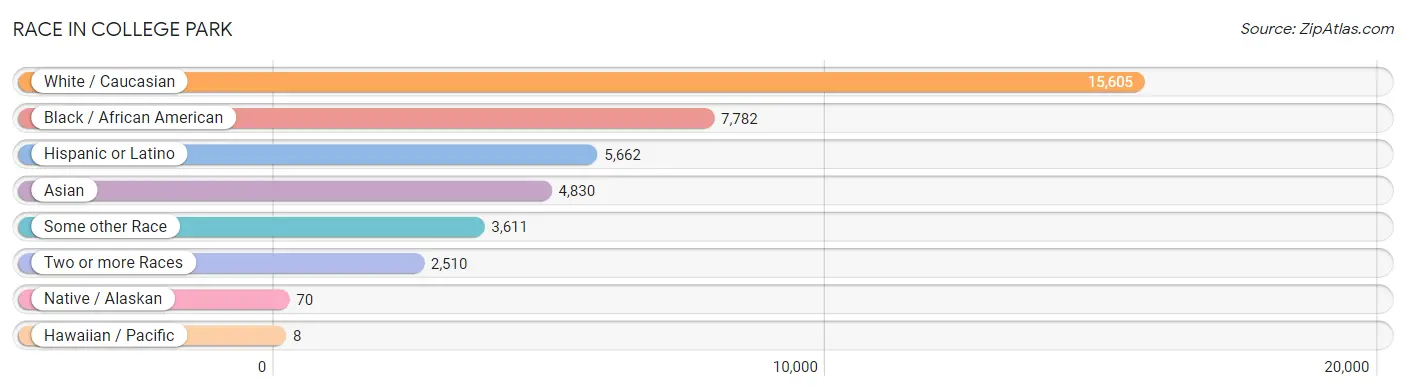
| Race | # Population | % Population |
| Asian | 4,830 | 14.0% |
| Black / African American | 7,782 | 22.6% |
| Hawaiian / Pacific | 8 | 0.0% |
| Hispanic or Latino | 5,662 | 16.5% |
| Native / Alaskan | 70 | 0.2% |
| White / Caucasian | 15,605 | 45.3% |
| Two or more Races | 2,510 | 7.3% |
| Some other Race | 3,611 | 10.5% |
| Total | 34,416 | 100.0% |
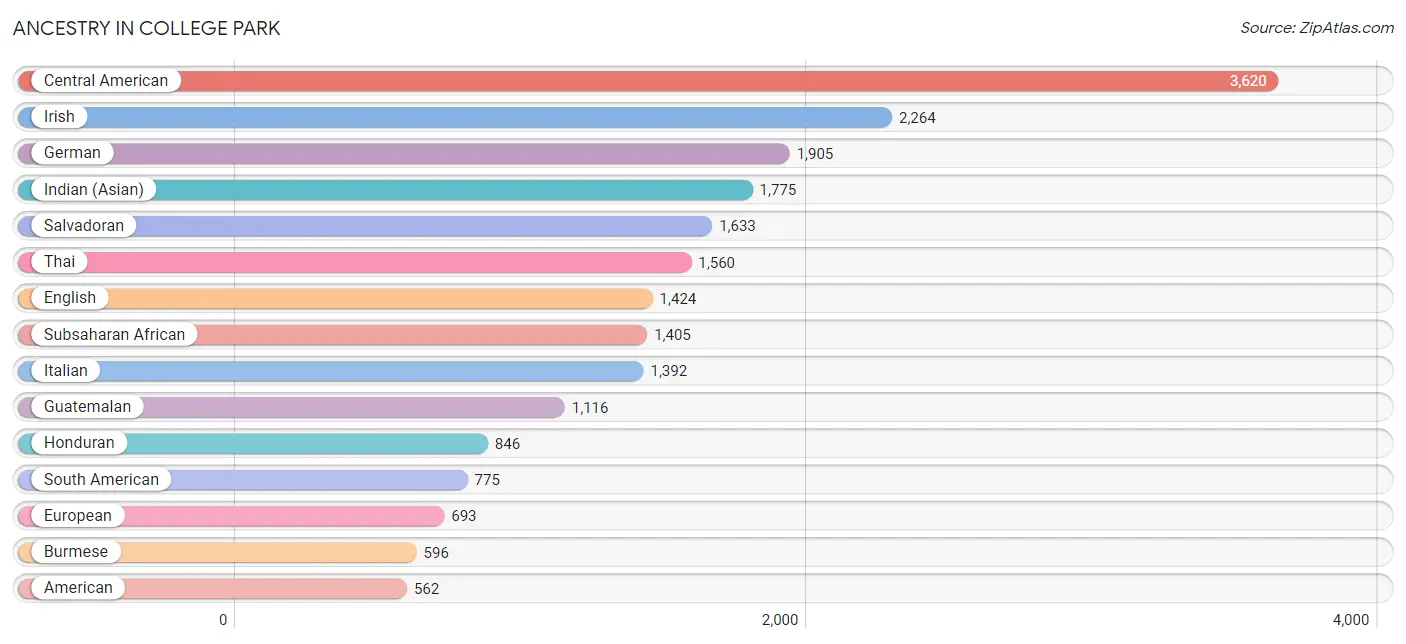
Ancestry in College Park
The most populous ancestries reported in College Park are Central American (3,620 | 10.5%), Irish (2,264 | 6.6%), German (1,905 | 5.5%), Indian (Asian) (1,775 | 5.2%), and Salvadoran (1,633 | 4.7%), together accounting for 32.5% of all College Park residents.
| Ancestry | # Population | % Population |
| African | 478 | 1.4% |
| American | 562 | 1.6% |
| Arab | 418 | 1.2% |
| Argentinean | 48 | 0.1% |
| Armenian | 54 | 0.2% |
| Australian | 13 | 0.0% |
| Austrian | 33 | 0.1% |
| Barbadian | 34 | 0.1% |
| Belgian | 86 | 0.3% |
| Bermudan | 23 | 0.1% |
| Bhutanese | 43 | 0.1% |
| Bolivian | 218 | 0.6% |
| Brazilian | 439 | 1.3% |
| British | 152 | 0.4% |
| British West Indian | 9 | 0.0% |
| Burmese | 596 | 1.7% |
| Canadian | 18 | 0.1% |
| Central American | 3,620 | 10.5% |
| Cherokee | 75 | 0.2% |
| Chilean | 40 | 0.1% |
| Choctaw | 45 | 0.1% |
| Colombian | 311 | 0.9% |
| Croatian | 15 | 0.0% |
| Cuban | 99 | 0.3% |
| Czech | 105 | 0.3% |
| Danish | 1 | 0.0% |
| Dominican | 125 | 0.4% |
| Dutch | 85 | 0.3% |
| Eastern European | 237 | 0.7% |
| Ecuadorian | 79 | 0.2% |
| Egyptian | 164 | 0.5% |
| English | 1,424 | 4.1% |
| Ethiopian | 221 | 0.6% |
| European | 693 | 2.0% |
| Filipino | 97 | 0.3% |
| Finnish | 8 | 0.0% |
| French | 317 | 0.9% |
| French Canadian | 57 | 0.2% |
| German | 1,905 | 5.5% |
| Ghanaian | 64 | 0.2% |
| Greek | 193 | 0.6% |
| Guatemalan | 1,116 | 3.2% |
| Guyanese | 79 | 0.2% |
| Haitian | 35 | 0.1% |
| Honduran | 846 | 2.5% |
| Hungarian | 15 | 0.0% |
| Indian (Asian) | 1,775 | 5.2% |
| Indonesian | 181 | 0.5% |
| Iranian | 86 | 0.3% |
| Irish | 2,264 | 6.6% |
| Israeli | 25 | 0.1% |
| Italian | 1,392 | 4.0% |
| Jamaican | 269 | 0.8% |
| Kenyan | 13 | 0.0% |
| Korean | 555 | 1.6% |
| Laotian | 4 | 0.0% |
| Latvian | 1 | 0.0% |
| Lebanese | 45 | 0.1% |
| Liberian | 36 | 0.1% |
| Lithuanian | 18 | 0.1% |
| Maltese | 10 | 0.0% |
| Mexican | 465 | 1.3% |
| Mongolian | 23 | 0.1% |
| Moroccan | 75 | 0.2% |
| New Zealander | 24 | 0.1% |
| Nicaraguan | 12 | 0.0% |
| Nigerian | 460 | 1.3% |
| Northern European | 43 | 0.1% |
| Norwegian | 113 | 0.3% |
| Pakistani | 5 | 0.0% |
| Palestinian | 11 | 0.0% |
| Panamanian | 11 | 0.0% |
| Pennsylvania German | 10 | 0.0% |
| Peruvian | 52 | 0.2% |
| Polish | 474 | 1.4% |
| Portuguese | 19 | 0.1% |
| Puerto Rican | 258 | 0.7% |
| Romanian | 74 | 0.2% |
| Russian | 312 | 0.9% |
| Salvadoran | 1,633 | 4.7% |
| Scandinavian | 33 | 0.1% |
| Scotch-Irish | 138 | 0.4% |
| Scottish | 270 | 0.8% |
| Sierra Leonean | 62 | 0.2% |
| Slavic | 1 | 0.0% |
| Slovak | 5 | 0.0% |
| Slovene | 28 | 0.1% |
| South African | 5 | 0.0% |
| South American | 775 | 2.2% |
| Spaniard | 50 | 0.2% |
| Spanish | 72 | 0.2% |
| Sri Lankan | 134 | 0.4% |
| Subsaharan African | 1,405 | 4.1% |
| Sudanese | 27 | 0.1% |
| Swedish | 44 | 0.1% |
| Swiss | 47 | 0.1% |
| Syrian | 8 | 0.0% |
| Thai | 1,560 | 4.5% |
| Turkish | 39 | 0.1% |
| Ukrainian | 131 | 0.4% |
| Uruguayan | 8 | 0.0% |
| Venezuelan | 19 | 0.1% |
| Vietnamese | 298 | 0.9% |
| Welsh | 129 | 0.4% |
| West Indian | 8 | 0.0% | View All 105 Rows |
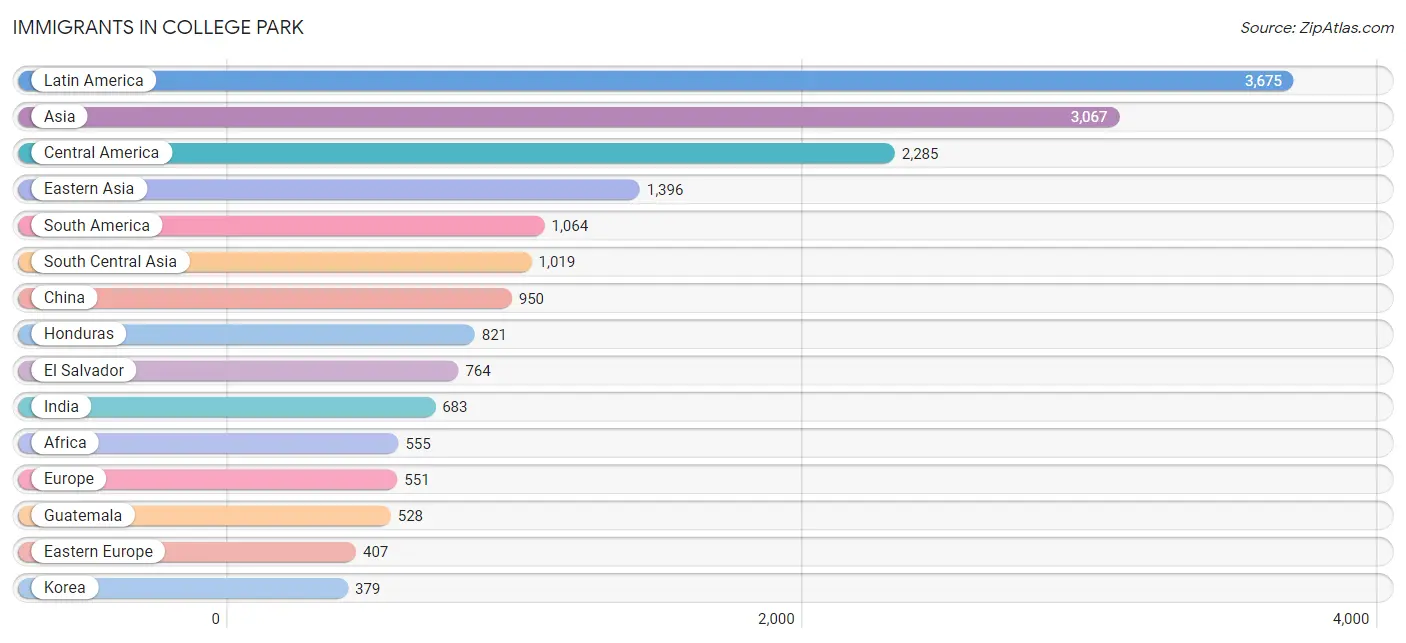
Immigrants in College Park
The most numerous immigrant groups reported in College Park came from Latin America (3,675 | 10.7%), Asia (3,067 | 8.9%), Central America (2,285 | 6.6%), Eastern Asia (1,396 | 4.1%), and South America (1,064 | 3.1%), together accounting for 33.4% of all College Park residents.
| Immigration Origin | # Population | % Population |
| Africa | 555 | 1.6% |
| Asia | 3,067 | 8.9% |
| Australia | 33 | 0.1% |
| Bangladesh | 256 | 0.7% |
| Belarus | 14 | 0.0% |
| Bolivia | 111 | 0.3% |
| Brazil | 260 | 0.8% |
| Cabo Verde | 20 | 0.1% |
| Cameroon | 13 | 0.0% |
| Canada | 62 | 0.2% |
| Caribbean | 326 | 0.9% |
| Central America | 2,285 | 6.6% |
| Chile | 19 | 0.1% |
| China | 950 | 2.8% |
| Colombia | 292 | 0.9% |
| Cuba | 68 | 0.2% |
| Denmark | 6 | 0.0% |
| Dominican Republic | 50 | 0.2% |
| Eastern Africa | 86 | 0.3% |
| Eastern Asia | 1,396 | 4.1% |
| Eastern Europe | 407 | 1.2% |
| Ecuador | 89 | 0.3% |
| Egypt | 6 | 0.0% |
| El Salvador | 764 | 2.2% |
| Eritrea | 3 | 0.0% |
| Ethiopia | 71 | 0.2% |
| Europe | 551 | 1.6% |
| France | 19 | 0.1% |
| Germany | 23 | 0.1% |
| Grenada | 8 | 0.0% |
| Guatemala | 528 | 1.5% |
| Guyana | 178 | 0.5% |
| Haiti | 16 | 0.1% |
| Honduras | 821 | 2.4% |
| Hong Kong | 7 | 0.0% |
| India | 683 | 2.0% |
| Indonesia | 18 | 0.1% |
| Iran | 22 | 0.1% |
| Israel | 254 | 0.7% |
| Italy | 85 | 0.3% |
| Jamaica | 164 | 0.5% |
| Japan | 67 | 0.2% |
| Korea | 379 | 1.1% |
| Latin America | 3,675 | 10.7% |
| Latvia | 301 | 0.9% |
| Liberia | 20 | 0.1% |
| Malaysia | 23 | 0.1% |
| Mexico | 139 | 0.4% |
| Middle Africa | 45 | 0.1% |
| Nepal | 32 | 0.1% |
| Nicaragua | 22 | 0.1% |
| Nigeria | 248 | 0.7% |
| Northern Africa | 36 | 0.1% |
| Northern Europe | 8 | 0.0% |
| Norway | 2 | 0.0% |
| Oceania | 33 | 0.1% |
| Panama | 11 | 0.0% |
| Peru | 52 | 0.2% |
| Philippines | 126 | 0.4% |
| Poland | 16 | 0.1% |
| Romania | 10 | 0.0% |
| Russia | 66 | 0.2% |
| Saudi Arabia | 44 | 0.1% |
| Sierra Leone | 28 | 0.1% |
| South Africa | 54 | 0.2% |
| South America | 1,064 | 3.1% |
| South Central Asia | 1,019 | 3.0% |
| South Eastern Asia | 348 | 1.0% |
| Southern Europe | 94 | 0.3% |
| Spain | 9 | 0.0% |
| Sri Lanka | 26 | 0.1% |
| Taiwan | 13 | 0.0% |
| Thailand | 10 | 0.0% |
| Trinidad and Tobago | 19 | 0.1% |
| Turkey | 6 | 0.0% |
| Uruguay | 4 | 0.0% |
| Venezuela | 53 | 0.2% |
| Vietnam | 8 | 0.0% |
| Western Africa | 327 | 0.9% |
| Western Asia | 304 | 0.9% |
| Western Europe | 42 | 0.1% |
| Zaire | 32 | 0.1% | View All 82 Rows |
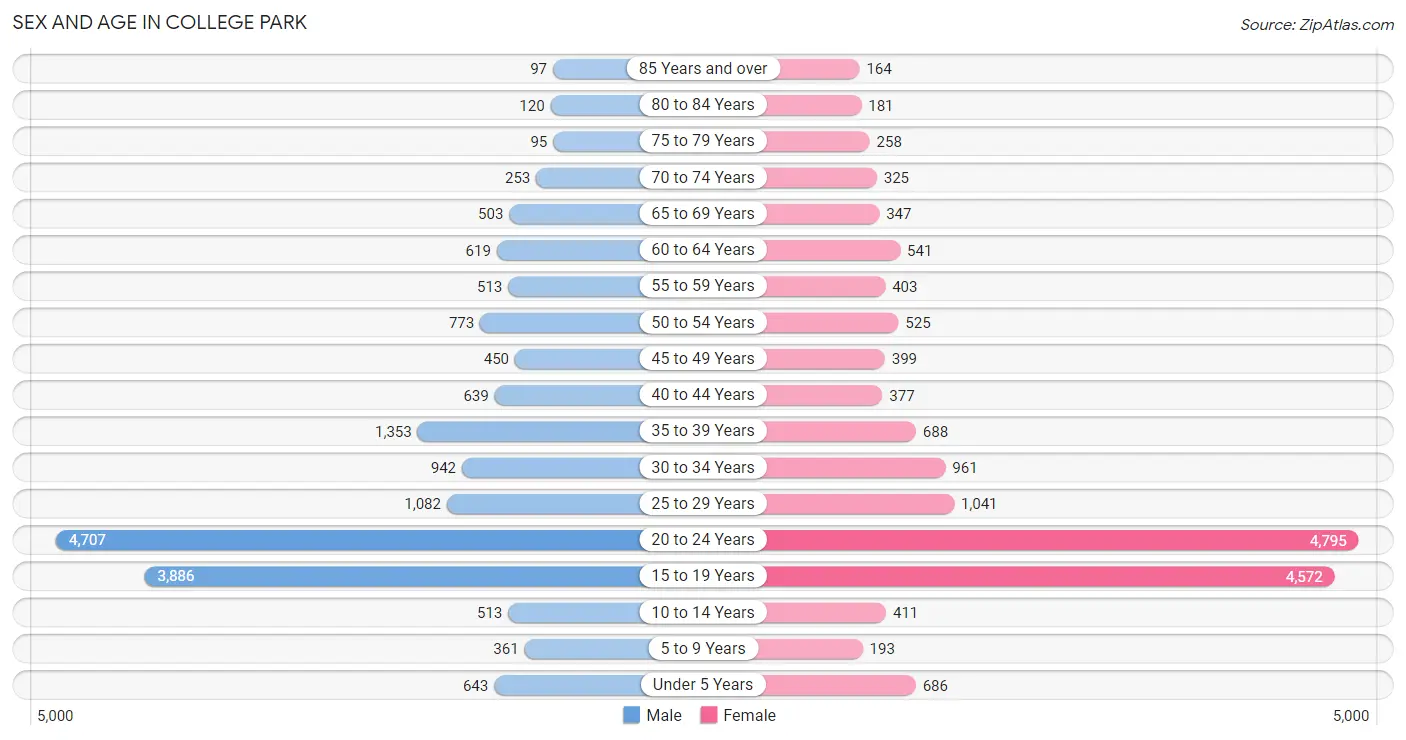
Sex and Age in College Park
Sex and Age in College Park
The most populous age groups in College Park are 20 to 24 Years (4,707 | 26.8%) for men and 20 to 24 Years (4,795 | 28.4%) for women.
| Age Bracket | Male | Female |
| Under 5 Years | 643 (3.7%) | 686 (4.1%) |
| 5 to 9 Years | 361 (2.1%) | 193 (1.1%) |
| 10 to 14 Years | 513 (2.9%) | 411 (2.4%) |
| 15 to 19 Years | 3,886 (22.1%) | 4,572 (27.1%) |
| 20 to 24 Years | 4,707 (26.8%) | 4,795 (28.4%) |
| 25 to 29 Years | 1,082 (6.2%) | 1,041 (6.2%) |
| 30 to 34 Years | 942 (5.4%) | 961 (5.7%) |
| 35 to 39 Years | 1,353 (7.7%) | 688 (4.1%) |
| 40 to 44 Years | 639 (3.6%) | 377 (2.2%) |
| 45 to 49 Years | 450 (2.6%) | 399 (2.4%) |
| 50 to 54 Years | 773 (4.4%) | 525 (3.1%) |
| 55 to 59 Years | 513 (2.9%) | 403 (2.4%) |
| 60 to 64 Years | 619 (3.5%) | 541 (3.2%) |
| 65 to 69 Years | 503 (2.9%) | 347 (2.1%) |
| 70 to 74 Years | 253 (1.4%) | 325 (1.9%) |
| 75 to 79 Years | 95 (0.5%) | 258 (1.5%) |
| 80 to 84 Years | 120 (0.7%) | 181 (1.1%) |
| 85 Years and over | 97 (0.5%) | 164 (1.0%) |
| Total | 17,549 (100.0%) | 16,867 (100.0%) |
Families and Households in College Park
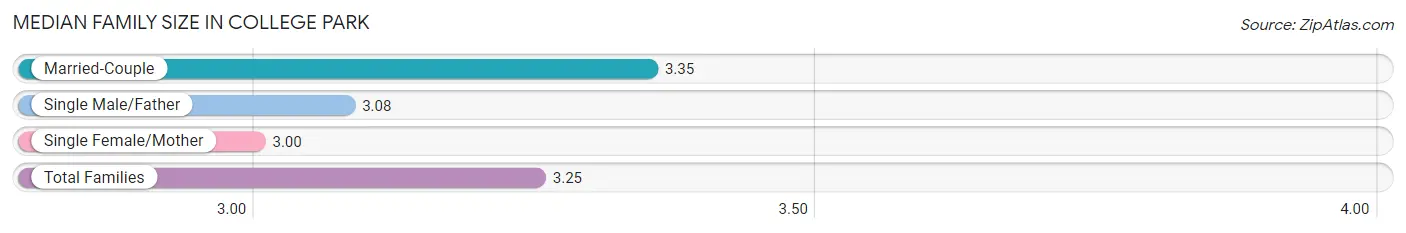
Median Family Size in College Park
The median family size in College Park is 3.25 persons per family, with married-couple families (2,532 | 69.1%) accounting for the largest median family size of 3.35 persons per family. On the other hand, single female/mother families (655 | 17.9%) represent the smallest median family size with 3.00 persons per family.
| Family Type | # Families | Family Size |
| Married-Couple | 2,532 (69.1%) | 3.35 |
| Single Male/Father | 478 (13.0%) | 3.08 |
| Single Female/Mother | 655 (17.9%) | 3.00 |
| Total Families | 3,665 (100.0%) | 3.25 |
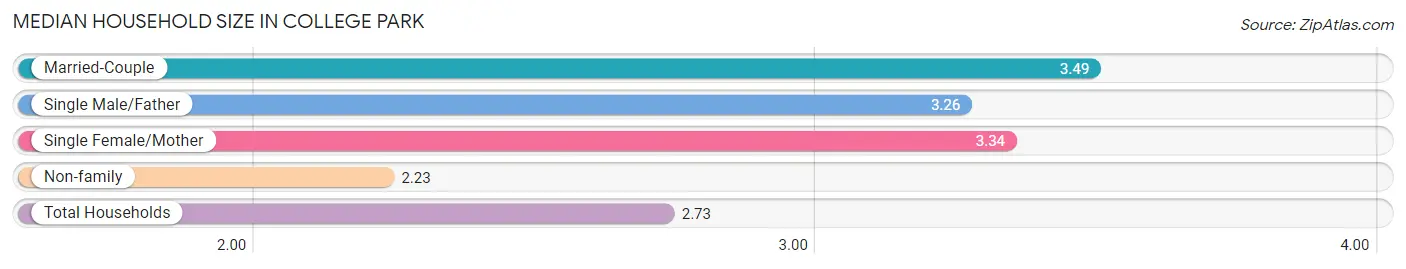
Median Household Size in College Park
The median household size in College Park is 2.73 persons per household, with married-couple households (2,532 | 28.7%) accounting for the largest median household size of 3.49 persons per household. non-family households (5,170 | 58.5%) represent the smallest median household size with 2.23 persons per household.
| Household Type | # Households | Household Size |
| Married-Couple | 2,532 (28.7%) | 3.49 |
| Single Male/Father | 478 (5.4%) | 3.26 |
| Single Female/Mother | 655 (7.4%) | 3.34 |
| Non-family | 5,170 (58.5%) | 2.23 |
| Total Households | 8,835 (100.0%) | 2.73 |
Household Size by Marriage Status in College Park
Out of a total of 8,835 households in College Park, 3,665 (41.5%) are family households, while 5,170 (58.5%) are nonfamily households. The most numerous type of family households are 2-person households, comprising 1,397, and the most common type of nonfamily households are 1-person households, comprising 2,605.
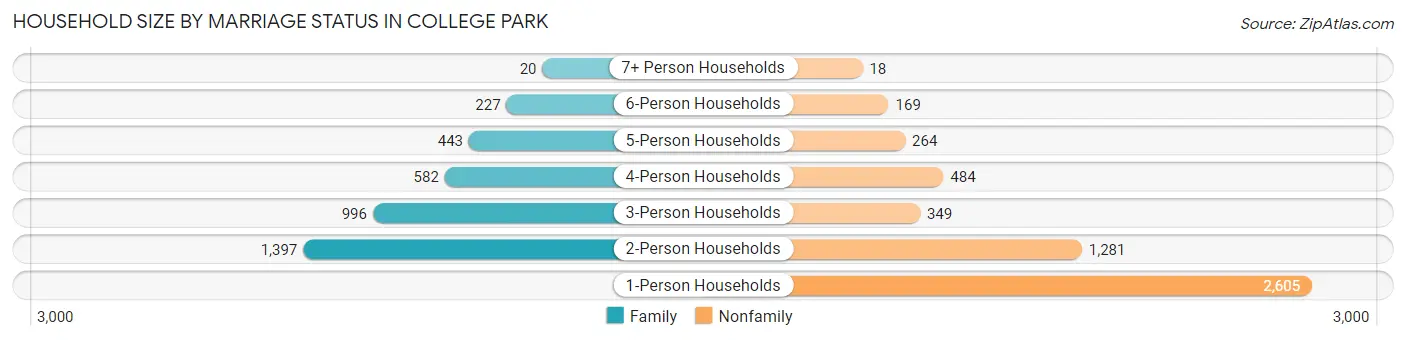
| Household Size | Family Households | Nonfamily Households |
| 1-Person Households | - | 2,605 (29.5%) |
| 2-Person Households | 1,397 (15.8%) | 1,281 (14.5%) |
| 3-Person Households | 996 (11.3%) | 349 (4.0%) |
| 4-Person Households | 582 (6.6%) | 484 (5.5%) |
| 5-Person Households | 443 (5.0%) | 264 (3.0%) |
| 6-Person Households | 227 (2.6%) | 169 (1.9%) |
| 7+ Person Households | 20 (0.2%) | 18 (0.2%) |
| Total | 3,665 (41.5%) | 5,170 (58.5%) |
Female Fertility in College Park
Fertility by Age in College Park
Average fertility rate in College Park is 14.0 births per 1,000 women. Women in the age bracket of 35 to 50 years have the highest fertility rate with 57.0 births per 1,000 women. Women in the age bracket of 35 to 50 years acount for 51.7% of all women with births.
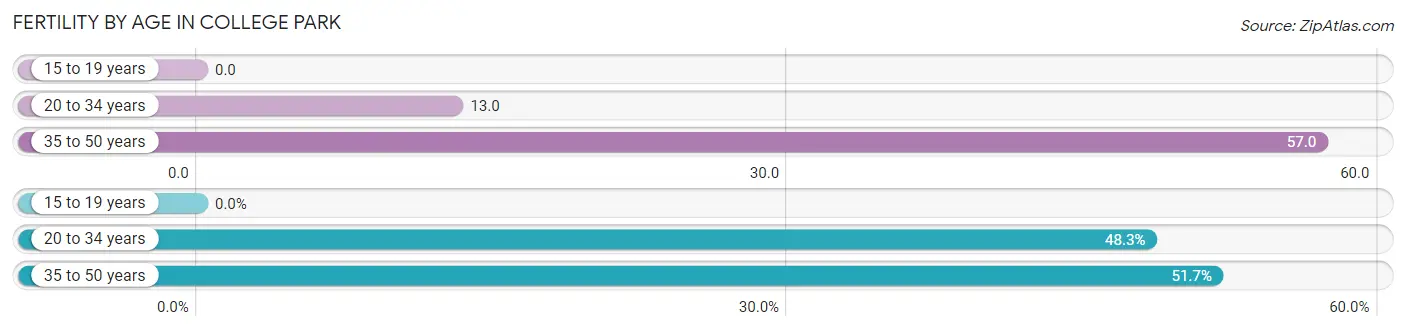
| Age Bracket | Women with Births | Births / 1,000 Women |
| 15 to 19 years | 0 (0.0%) | 0.0 |
| 20 to 34 years | 86 (48.3%) | 13.0 |
| 35 to 50 years | 92 (51.7%) | 57.0 |
| Total | 178 (100.0%) | 14.0 |
Fertility by Age by Marriage Status in College Park
77.5% of women with births (178) in College Park are married. The highest percentage of unmarried women with births falls into 20 to 34 years age bracket with 29.1% of them unmarried at the time of birth, while the lowest percentage of unmarried women with births belong to 35 to 50 years age bracket with 16.3% of them unmarried.
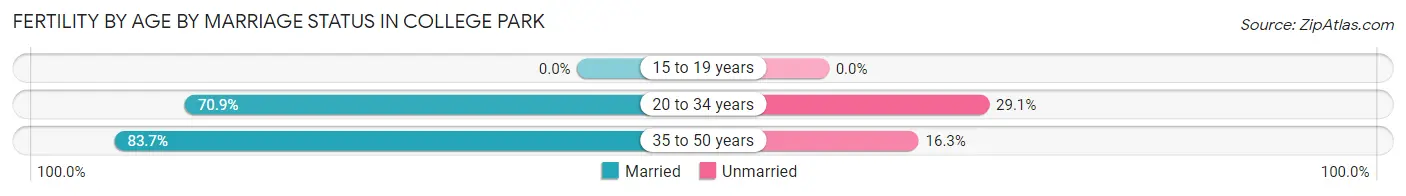
| Age Bracket | Married | Unmarried |
| 15 to 19 years | 0 (0.0%) | 0 (0.0%) |
| 20 to 34 years | 61 (70.9%) | 25 (29.1%) |
| 35 to 50 years | 77 (83.7%) | 15 (16.3%) |
| Total | 138 (77.5%) | 40 (22.5%) |
Fertility by Education in College Park
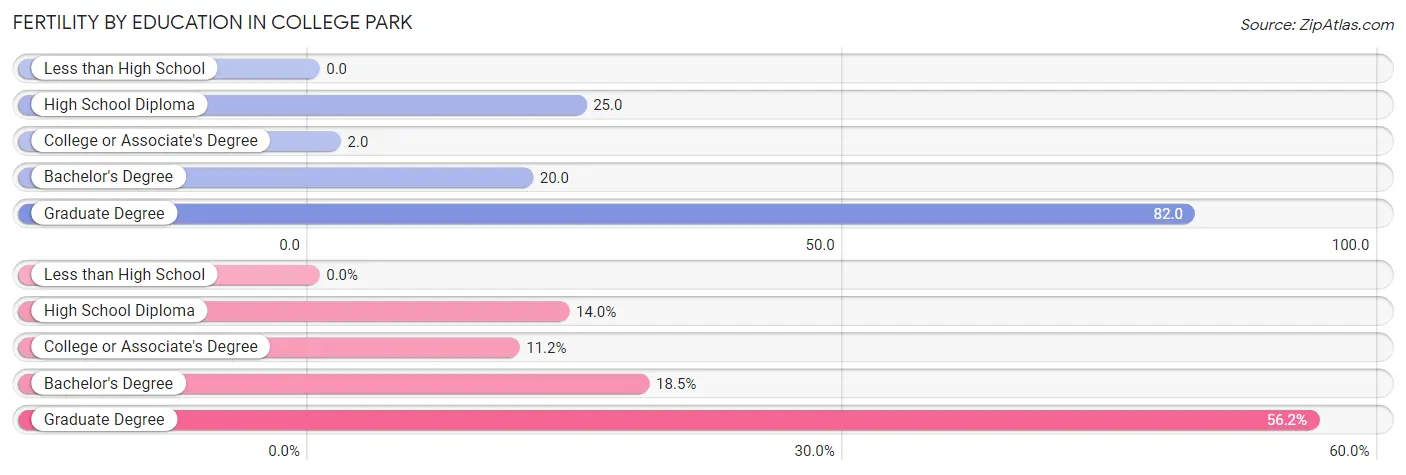
| Educational Attainment | Women with Births | Births / 1,000 Women |
| Less than High School | 0 (0.0%) | 0.0 |
| High School Diploma | 25 (14.0%) | 25.0 |
| College or Associate's Degree | 20 (11.2%) | 2.0 |
| Bachelor's Degree | 33 (18.5%) | 20.0 |
| Graduate Degree | 100 (56.2%) | 82.0 |
| Total | 178 (100.0%) | 14.0 |
Fertility by Education by Marriage Status in College Park
22.5% of women with births in College Park are unmarried. Women with the educational attainment of college or associate's degree are most likely to be married with 100.0% of them married at childbirth, while women with the educational attainment of high school diploma are least likely to be married with 100.0% of them unmarried at childbirth.
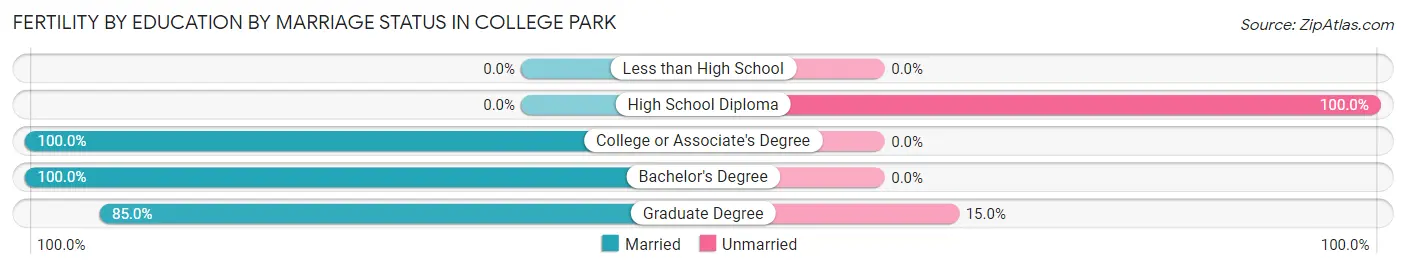
| Educational Attainment | Married | Unmarried |
| Less than High School | 0 (0.0%) | 0 (0.0%) |
| High School Diploma | 0 (0.0%) | 25 (100.0%) |
| College or Associate's Degree | 20 (100.0%) | 0 (0.0%) |
| Bachelor's Degree | 33 (100.0%) | 0 (0.0%) |
| Graduate Degree | 85 (85.0%) | 15 (15.0%) |
| Total | 138 (77.5%) | 40 (22.5%) |
Employment Characteristics in College Park
Employment by Class of Employer in College Park
Among the 16,065 employed individuals in College Park, private company employees (9,402 | 58.5%), state government employees (2,559 | 15.9%), and not-for-profit organizations (1,393 | 8.7%) make up the most common classes of employment.
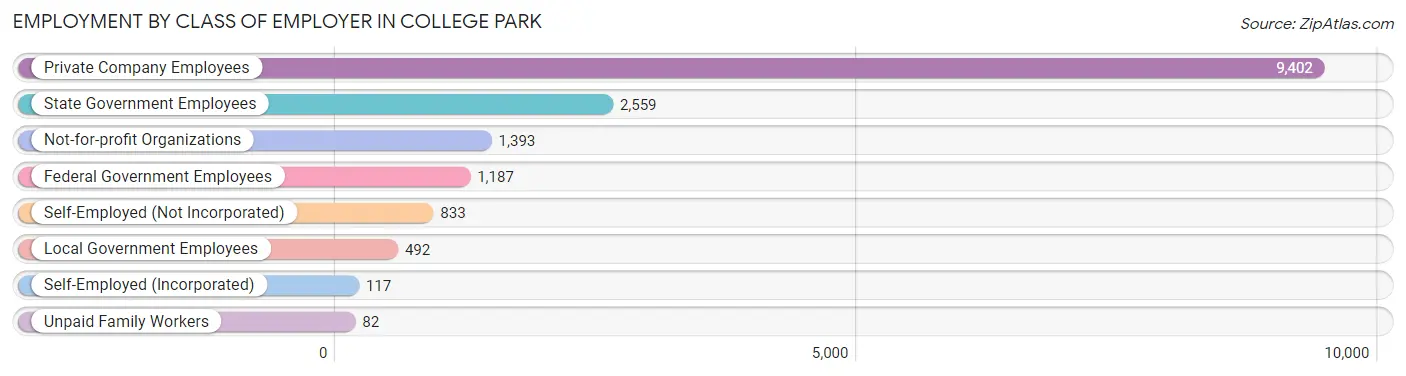
| Employer Class | # Employees | % Employees |
| Private Company Employees | 9,402 | 58.5% |
| Self-Employed (Incorporated) | 117 | 0.7% |
| Self-Employed (Not Incorporated) | 833 | 5.2% |
| Not-for-profit Organizations | 1,393 | 8.7% |
| Local Government Employees | 492 | 3.1% |
| State Government Employees | 2,559 | 15.9% |
| Federal Government Employees | 1,187 | 7.4% |
| Unpaid Family Workers | 82 | 0.5% |
| Total | 16,065 | 100.0% |
Employment Status by Age in College Park
According to the labor force statistics for College Park, out of the total population over 16 years of age (31,504), 55.4% or 17,453 individuals are in the labor force, with 6.7% or 1,169 of them unemployed. The age group with the highest labor force participation rate is 30 to 34 years, with 92.9% or 1,768 individuals in the labor force. Within the labor force, the 16 to 19 years age range has the highest percentage of unemployed individuals, with 11.1% or 250 of them being unemployed.
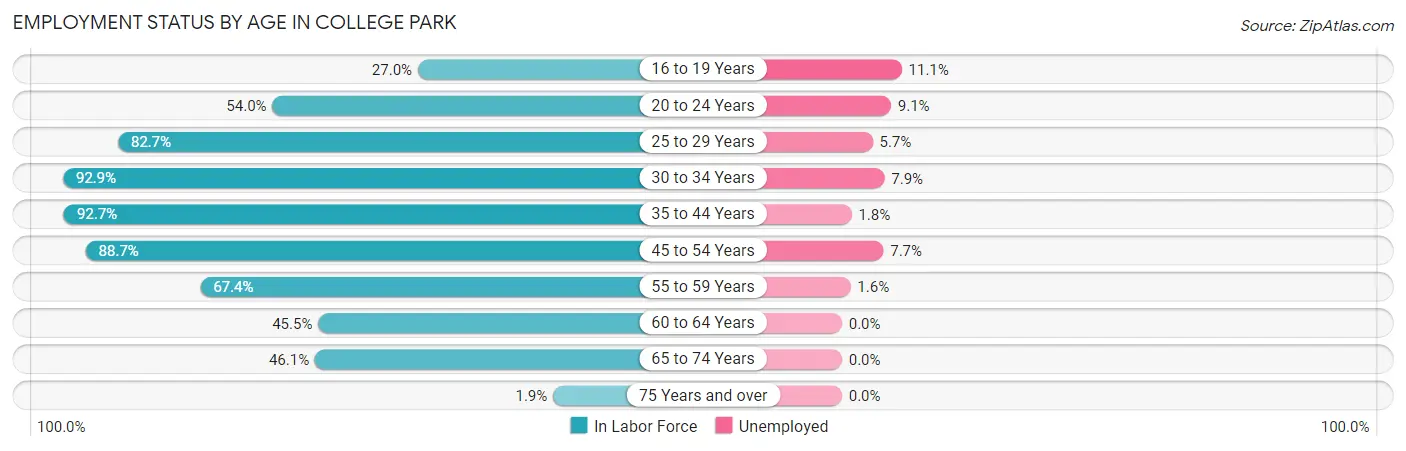
| Age Bracket | In Labor Force | Unemployed |
| 16 to 19 Years | 2,255 (27.0%) | 250 (11.1%) |
| 20 to 24 Years | 5,131 (54.0%) | 467 (9.1%) |
| 25 to 29 Years | 1,756 (82.7%) | 100 (5.7%) |
| 30 to 34 Years | 1,768 (92.9%) | 140 (7.9%) |
| 35 to 44 Years | 2,834 (92.7%) | 51 (1.8%) |
| 45 to 54 Years | 1,904 (88.7%) | 147 (7.7%) |
| 55 to 59 Years | 617 (67.4%) | 10 (1.6%) |
| 60 to 64 Years | 528 (45.5%) | 0 (0.0%) |
| 65 to 74 Years | 658 (46.1%) | 0 (0.0%) |
| 75 Years and over | 17 (1.9%) | 0 (0.0%) |
| Total | 17,453 (55.4%) | 1,169 (6.7%) |
Employment Status by Educational Attainment in College Park
According to labor force statistics for College Park, 83.2% of individuals (9,407) out of the total population between 25 and 64 years of age (11,306) are in the labor force, with 4.7% or 442 of them being unemployed. The group with the highest labor force participation rate are those with the educational attainment of bachelor's degree or higher, with 87.6% or 5,027 individuals in the labor force. Within the labor force, individuals with less than high school education have the highest percentage of unemployment, with 9.1% or 124 of them being unemployed.
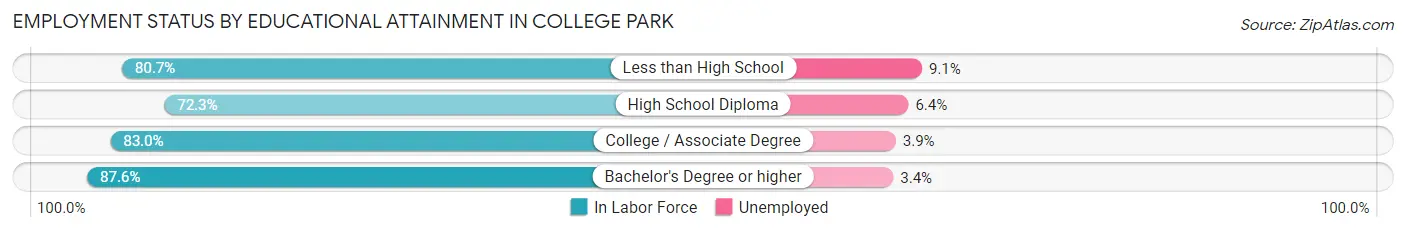
| Educational Attainment | In Labor Force | Unemployed |
| Less than High School | 1,361 (80.7%) | 153 (9.1%) |
| High School Diploma | 1,353 (72.3%) | 120 (6.4%) |
| College / Associate Degree | 1,668 (83.0%) | 78 (3.9%) |
| Bachelor's Degree or higher | 5,027 (87.6%) | 195 (3.4%) |
| Total | 9,407 (83.2%) | 531 (4.7%) |
Employment Occupations by Sex in College Park
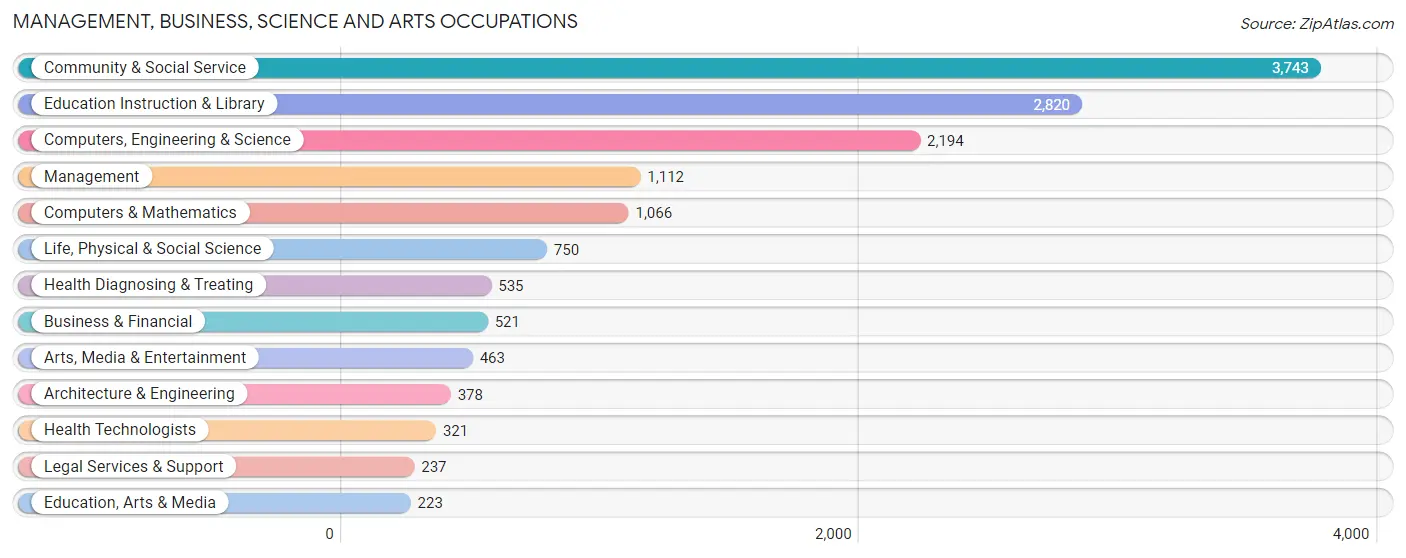
Management, Business, Science and Arts Occupations
The most common Management, Business, Science and Arts occupations in College Park are Community & Social Service (3,743 | 23.1%), Education Instruction & Library (2,820 | 17.4%), Computers, Engineering & Science (2,194 | 13.6%), Management (1,112 | 6.9%), and Computers & Mathematics (1,066 | 6.6%).
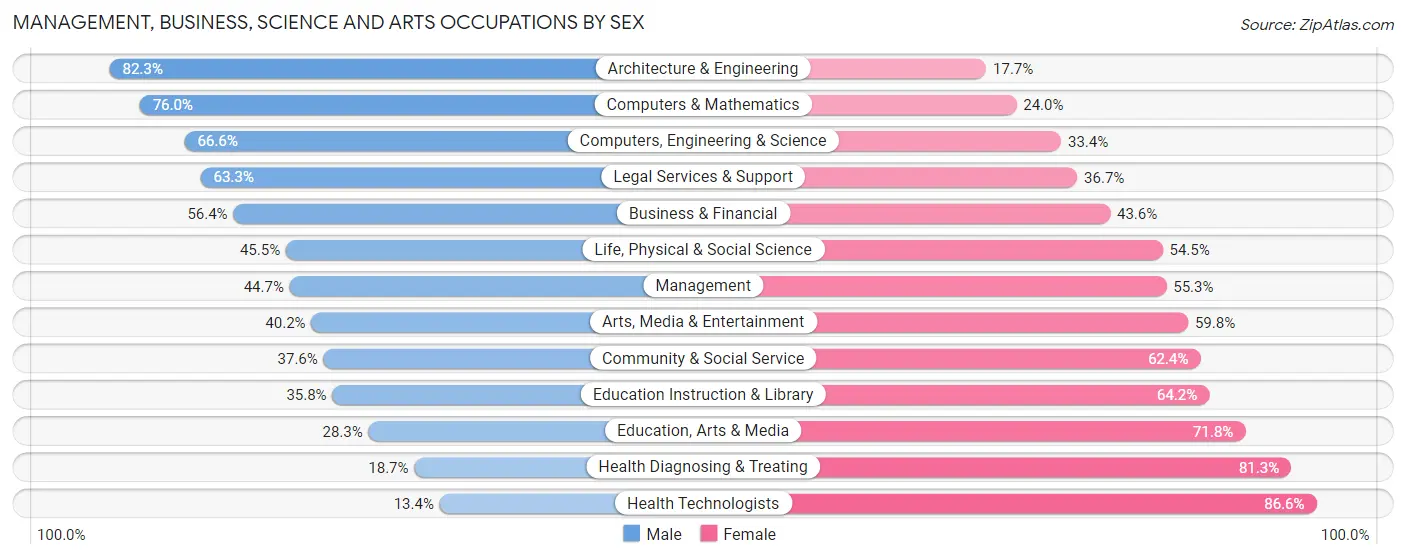
Management, Business, Science and Arts Occupations by Sex
Within the Management, Business, Science and Arts occupations in College Park, the most male-oriented occupations are Architecture & Engineering (82.3%), Computers & Mathematics (76.0%), and Computers, Engineering & Science (66.6%), while the most female-oriented occupations are Health Technologists (86.6%), Health Diagnosing & Treating (81.3%), and Education, Arts & Media (71.8%).
| Occupation | Male | Female |
| Management | 497 (44.7%) | 615 (55.3%) |
| Business & Financial | 294 (56.4%) | 227 (43.6%) |
| Computers, Engineering & Science | 1,462 (66.6%) | 732 (33.4%) |
| Computers & Mathematics | 810 (76.0%) | 256 (24.0%) |
| Architecture & Engineering | 311 (82.3%) | 67 (17.7%) |
| Life, Physical & Social Science | 341 (45.5%) | 409 (54.5%) |
| Community & Social Service | 1,408 (37.6%) | 2,335 (62.4%) |
| Education, Arts & Media | 63 (28.2%) | 160 (71.8%) |
| Legal Services & Support | 150 (63.3%) | 87 (36.7%) |
| Education Instruction & Library | 1,009 (35.8%) | 1,811 (64.2%) |
| Arts, Media & Entertainment | 186 (40.2%) | 277 (59.8%) |
| Health Diagnosing & Treating | 100 (18.7%) | 435 (81.3%) |
| Health Technologists | 43 (13.4%) | 278 (86.6%) |
| Total (Category) | 3,761 (46.4%) | 4,344 (53.6%) |
| Total (Overall) | 8,071 (49.8%) | 8,122 (50.2%) |
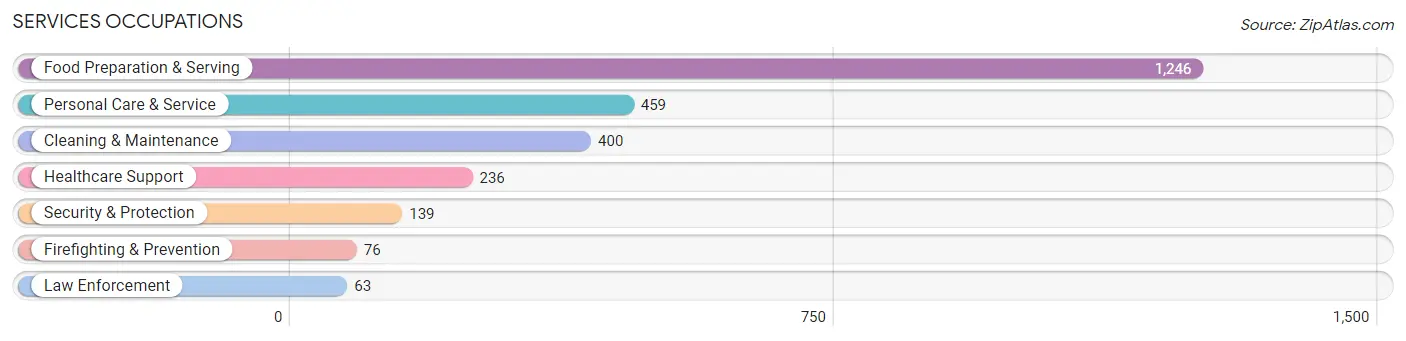
Services Occupations
The most common Services occupations in College Park are Food Preparation & Serving (1,246 | 7.7%), Personal Care & Service (459 | 2.8%), Cleaning & Maintenance (400 | 2.5%), Healthcare Support (236 | 1.5%), and Security & Protection (139 | 0.9%).
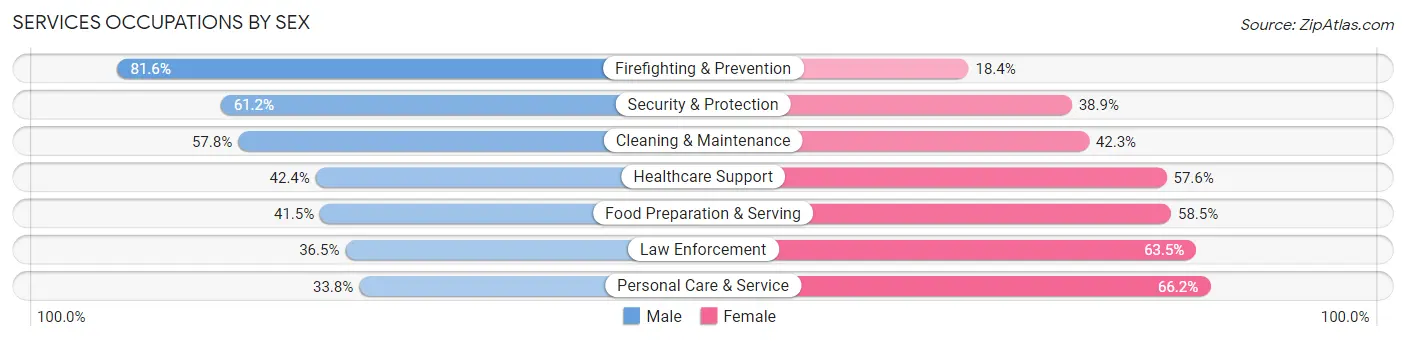
Services Occupations by Sex
Within the Services occupations in College Park, the most male-oriented occupations are Firefighting & Prevention (81.6%), Security & Protection (61.2%), and Cleaning & Maintenance (57.8%), while the most female-oriented occupations are Personal Care & Service (66.2%), Law Enforcement (63.5%), and Food Preparation & Serving (58.5%).
| Occupation | Male | Female |
| Healthcare Support | 100 (42.4%) | 136 (57.6%) |
| Security & Protection | 85 (61.2%) | 54 (38.9%) |
| Firefighting & Prevention | 62 (81.6%) | 14 (18.4%) |
| Law Enforcement | 23 (36.5%) | 40 (63.5%) |
| Food Preparation & Serving | 517 (41.5%) | 729 (58.5%) |
| Cleaning & Maintenance | 231 (57.8%) | 169 (42.2%) |
| Personal Care & Service | 155 (33.8%) | 304 (66.2%) |
| Total (Category) | 1,088 (43.9%) | 1,392 (56.1%) |
| Total (Overall) | 8,071 (49.8%) | 8,122 (50.2%) |
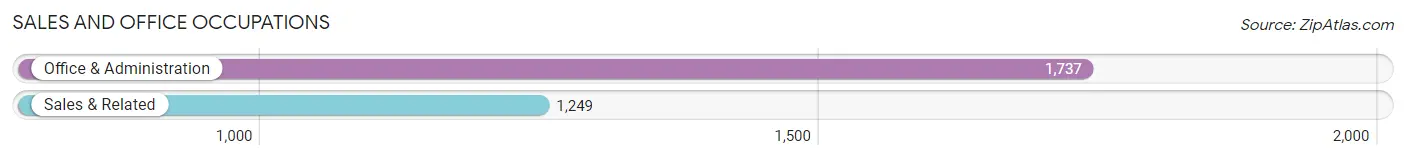
Sales and Office Occupations
The most common Sales and Office occupations in College Park are Office & Administration (1,737 | 10.7%), and Sales & Related (1,249 | 7.7%).
Sales and Office Occupations by Sex
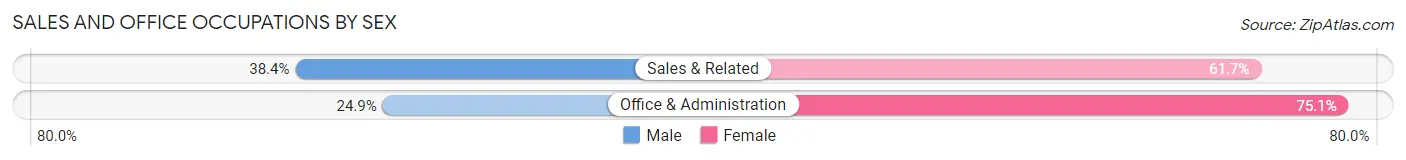
| Occupation | Male | Female |
| Sales & Related | 479 (38.4%) | 770 (61.7%) |
| Office & Administration | 433 (24.9%) | 1,304 (75.1%) |
| Total (Category) | 912 (30.5%) | 2,074 (69.5%) |
| Total (Overall) | 8,071 (49.8%) | 8,122 (50.2%) |
Natural Resources, Construction and Maintenance Occupations
The most common Natural Resources, Construction and Maintenance occupations in College Park are Construction & Extraction (1,550 | 9.6%), Installation, Maintenance & Repair (209 | 1.3%), and Farming, Fishing & Forestry (10 | 0.1%).

Natural Resources, Construction and Maintenance Occupations by Sex
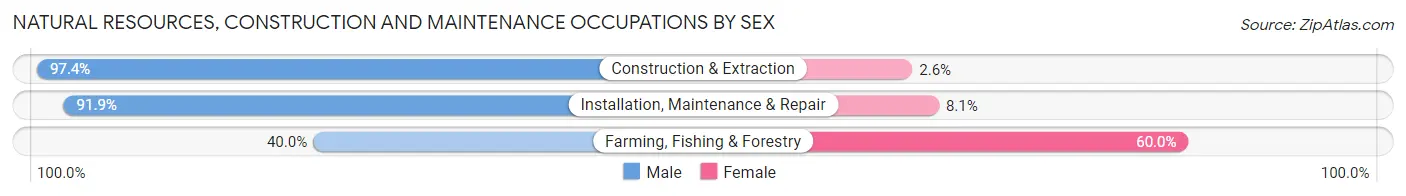
| Occupation | Male | Female |
| Farming, Fishing & Forestry | 4 (40.0%) | 6 (60.0%) |
| Construction & Extraction | 1,510 (97.4%) | 40 (2.6%) |
| Installation, Maintenance & Repair | 192 (91.9%) | 17 (8.1%) |
| Total (Category) | 1,706 (96.4%) | 63 (3.6%) |
| Total (Overall) | 8,071 (49.8%) | 8,122 (50.2%) |
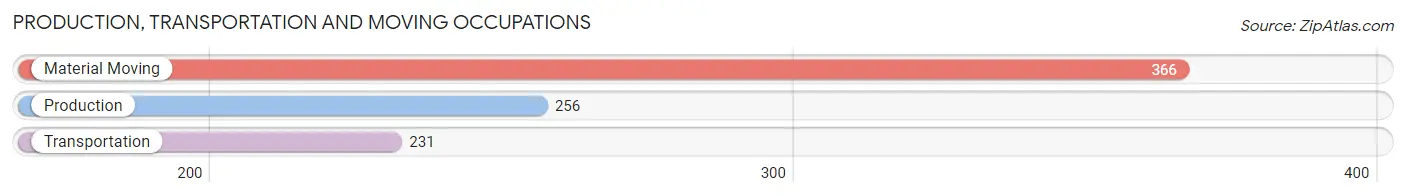
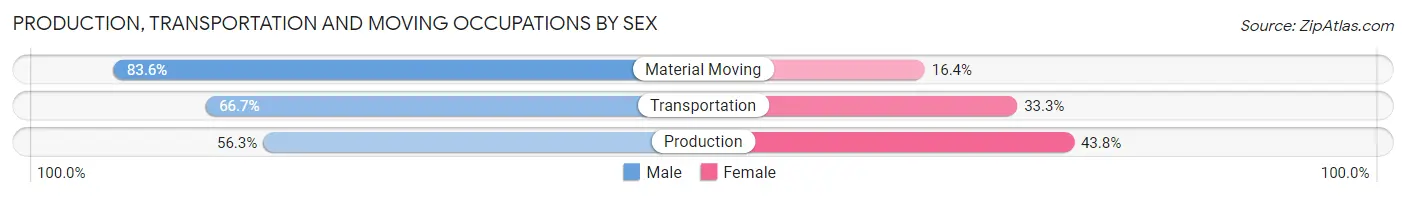
Production, Transportation and Moving Occupations
The most common Production, Transportation and Moving occupations in College Park are Material Moving (366 | 2.3%), Production (256 | 1.6%), and Transportation (231 | 1.4%).
Production, Transportation and Moving Occupations by Sex
| Occupation | Male | Female |
| Production | 144 (56.2%) | 112 (43.8%) |
| Transportation | 154 (66.7%) | 77 (33.3%) |
| Material Moving | 306 (83.6%) | 60 (16.4%) |
| Total (Category) | 604 (70.8%) | 249 (29.2%) |
| Total (Overall) | 8,071 (49.8%) | 8,122 (50.2%) |
Employment Industries by Sex in College Park
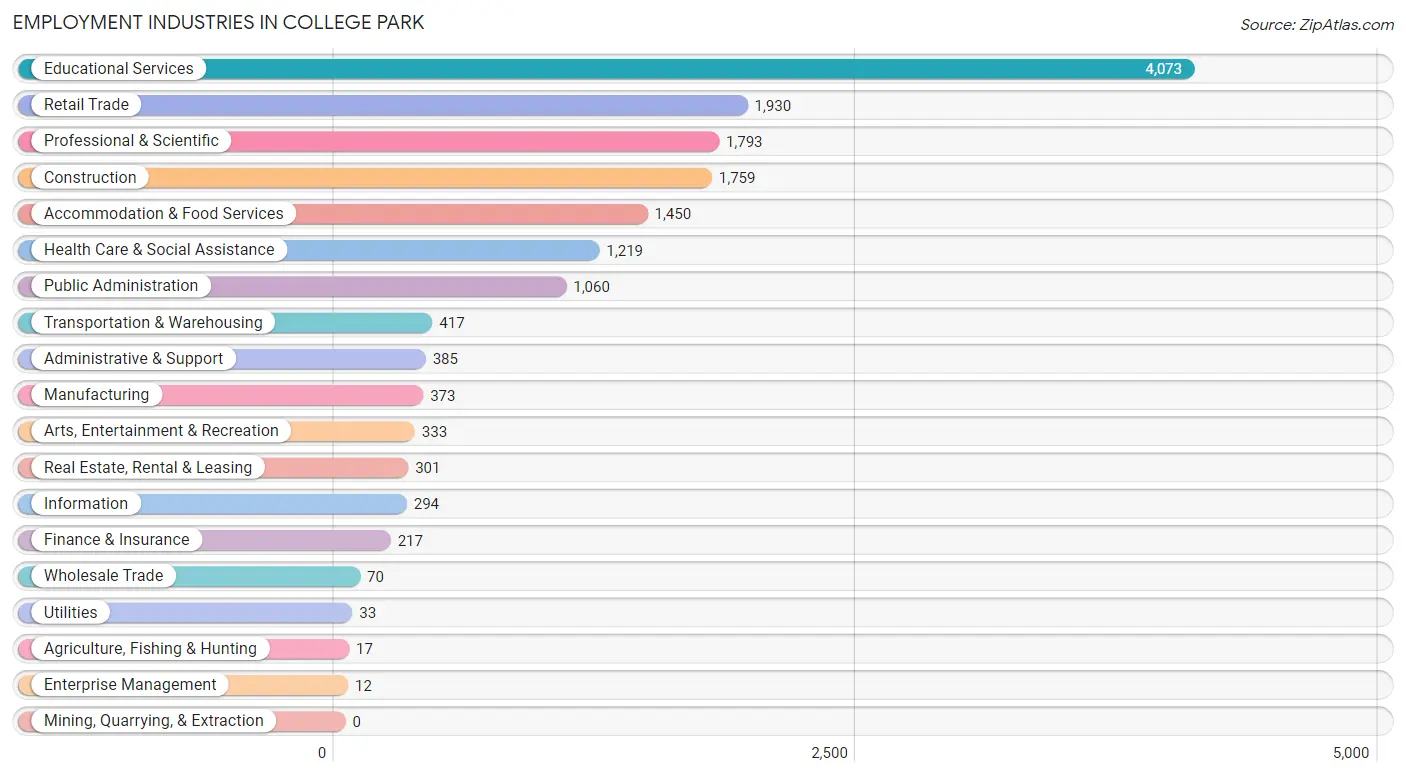
Employment Industries in College Park
The major employment industries in College Park include Educational Services (4,073 | 25.2%), Retail Trade (1,930 | 11.9%), Professional & Scientific (1,793 | 11.1%), Construction (1,759 | 10.9%), and Accommodation & Food Services (1,450 | 8.9%).
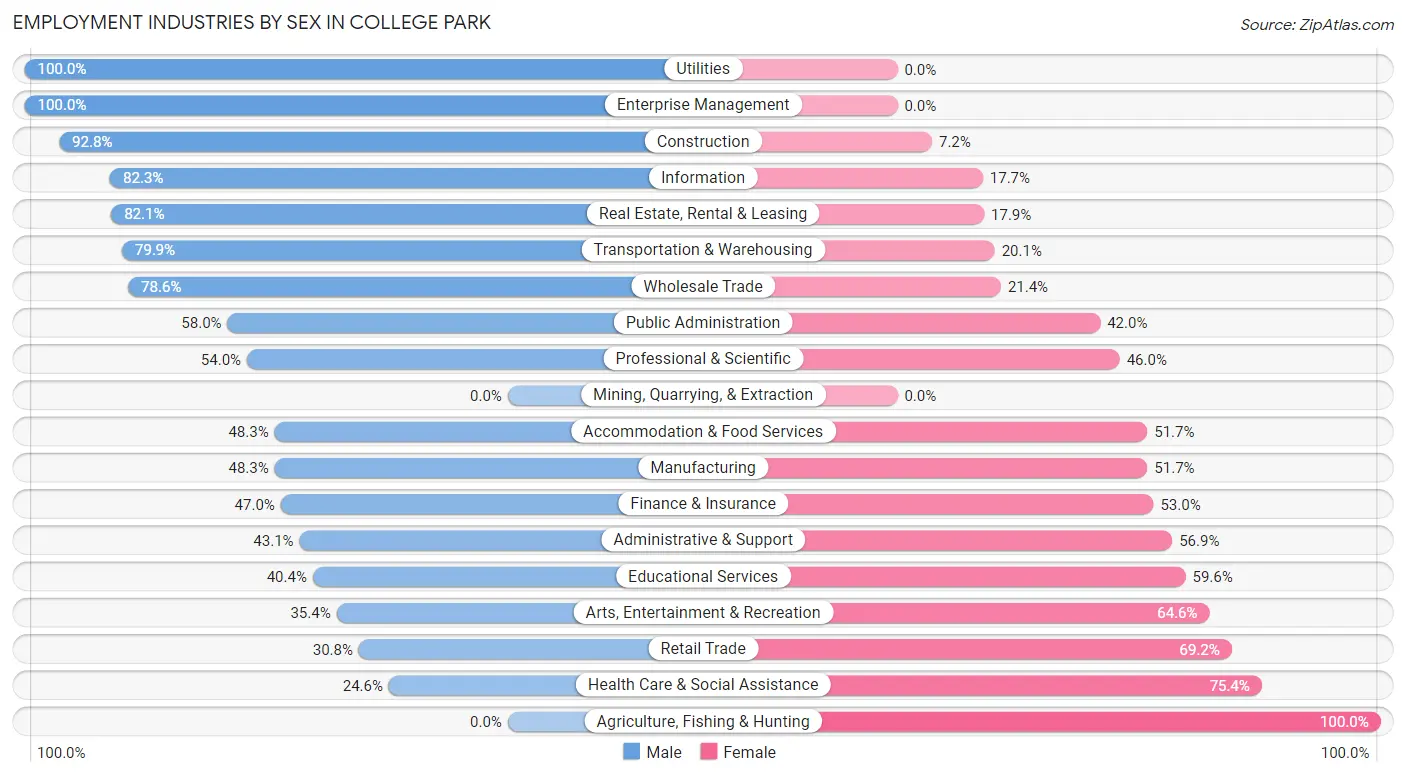
Employment Industries by Sex in College Park
The College Park industries that see more men than women are Utilities (100.0%), Enterprise Management (100.0%), and Construction (92.8%), whereas the industries that tend to have a higher number of women are Agriculture, Fishing & Hunting (100.0%), Health Care & Social Assistance (75.4%), and Retail Trade (69.2%).
| Industry | Male | Female |
| Agriculture, Fishing & Hunting | 0 (0.0%) | 17 (100.0%) |
| Mining, Quarrying, & Extraction | 0 (0.0%) | 0 (0.0%) |
| Construction | 1,633 (92.8%) | 126 (7.2%) |
| Manufacturing | 180 (48.3%) | 193 (51.7%) |
| Wholesale Trade | 55 (78.6%) | 15 (21.4%) |
| Retail Trade | 595 (30.8%) | 1,335 (69.2%) |
| Transportation & Warehousing | 333 (79.9%) | 84 (20.1%) |
| Utilities | 33 (100.0%) | 0 (0.0%) |
| Information | 242 (82.3%) | 52 (17.7%) |
| Finance & Insurance | 102 (47.0%) | 115 (53.0%) |
| Real Estate, Rental & Leasing | 247 (82.1%) | 54 (17.9%) |
| Professional & Scientific | 968 (54.0%) | 825 (46.0%) |
| Enterprise Management | 12 (100.0%) | 0 (0.0%) |
| Administrative & Support | 166 (43.1%) | 219 (56.9%) |
| Educational Services | 1,644 (40.4%) | 2,429 (59.6%) |
| Health Care & Social Assistance | 300 (24.6%) | 919 (75.4%) |
| Arts, Entertainment & Recreation | 118 (35.4%) | 215 (64.6%) |
| Accommodation & Food Services | 700 (48.3%) | 750 (51.7%) |
| Public Administration | 615 (58.0%) | 445 (42.0%) |
| Total | 8,071 (49.8%) | 8,122 (50.2%) |
Education in College Park
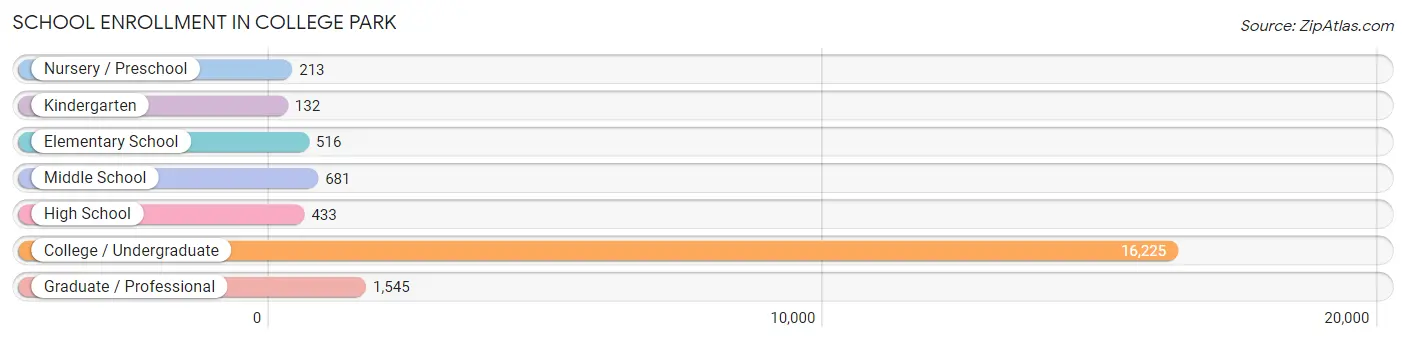
School Enrollment in College Park
The most common levels of schooling among the 19,745 students in College Park are college / undergraduate (16,225 | 82.2%), graduate / professional (1,545 | 7.8%), and middle school (681 | 3.5%).
| School Level | # Students | % Students |
| Nursery / Preschool | 213 | 1.1% |
| Kindergarten | 132 | 0.7% |
| Elementary School | 516 | 2.6% |
| Middle School | 681 | 3.5% |
| High School | 433 | 2.2% |
| College / Undergraduate | 16,225 | 82.2% |
| Graduate / Professional | 1,545 | 7.8% |
| Total | 19,745 | 100.0% |
School Enrollment by Age by Funding Source in College Park
Out of a total of 19,745 students who are enrolled in schools in College Park, 1,560 (7.9%) attend a private institution, while the remaining 18,185 (92.1%) are enrolled in public schools. The age group of 3 to 4 year olds has the highest likelihood of being enrolled in private schools, with 124 (65.3% in the age bracket) enrolled. Conversely, the age group of 18 to 19 year olds has the lowest likelihood of being enrolled in a private school, with 7,700 (97.3% in the age bracket) attending a public institution.
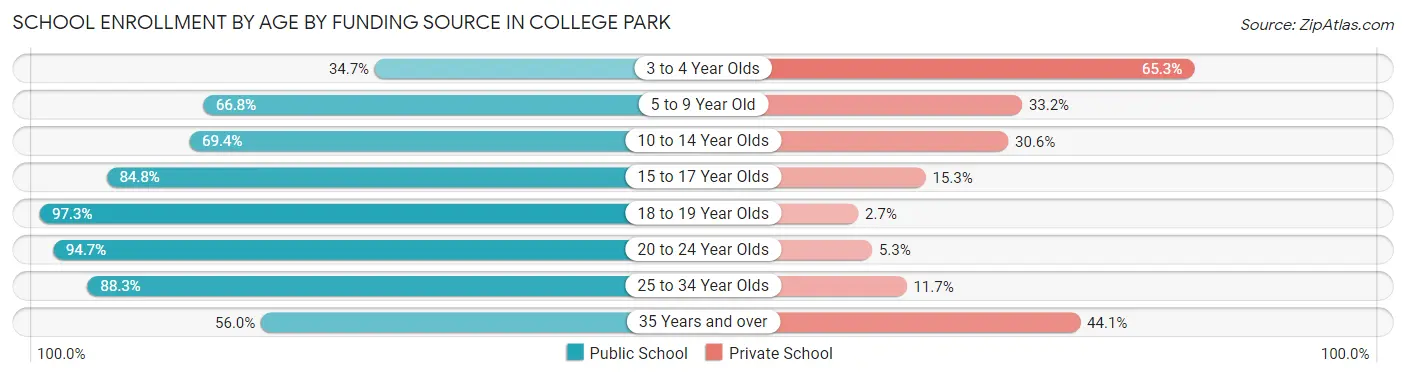
| Age Bracket | Public School | Private School |
| 3 to 4 Year Olds | 66 (34.7%) | 124 (65.3%) |
| 5 to 9 Year Old | 356 (66.8%) | 177 (33.2%) |
| 10 to 14 Year Olds | 641 (69.4%) | 283 (30.6%) |
| 15 to 17 Year Olds | 350 (84.8%) | 63 (15.2%) |
| 18 to 19 Year Olds | 7,700 (97.3%) | 214 (2.7%) |
| 20 to 24 Year Olds | 7,844 (94.7%) | 436 (5.3%) |
| 25 to 34 Year Olds | 1,094 (88.3%) | 145 (11.7%) |
| 35 Years and over | 141 (55.9%) | 111 (44.1%) |
| Total | 18,185 (92.1%) | 1,560 (7.9%) |
Educational Attainment by Field of Study in College Park
Engineering (924 | 12.5%), social sciences (811 | 11.0%), computers & mathematics (729 | 9.9%), bio, nature & agricultural (718 | 9.7%), and business (601 | 8.2%) are the most common fields of study among 7,371 individuals in College Park who have obtained a bachelor's degree or higher.
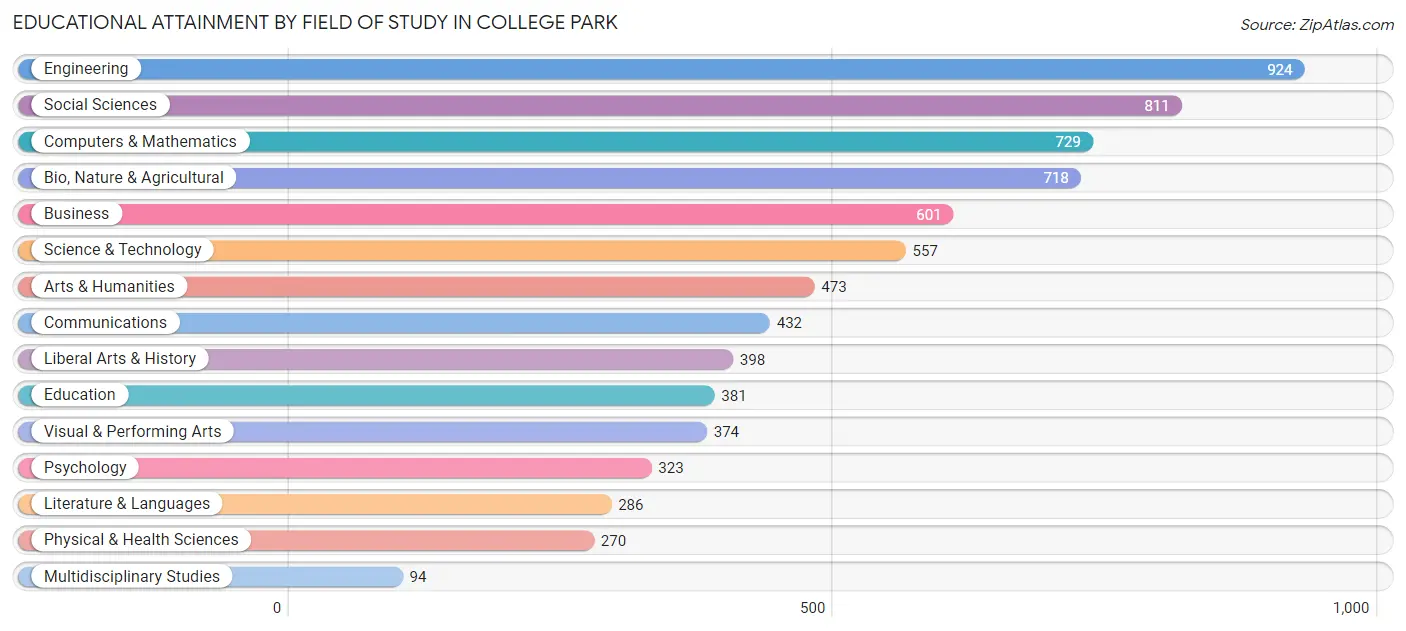
| Field of Study | # Graduates | % Graduates |
| Computers & Mathematics | 729 | 9.9% |
| Bio, Nature & Agricultural | 718 | 9.7% |
| Physical & Health Sciences | 270 | 3.7% |
| Psychology | 323 | 4.4% |
| Social Sciences | 811 | 11.0% |
| Engineering | 924 | 12.5% |
| Multidisciplinary Studies | 94 | 1.3% |
| Science & Technology | 557 | 7.6% |
| Business | 601 | 8.2% |
| Education | 381 | 5.2% |
| Literature & Languages | 286 | 3.9% |
| Liberal Arts & History | 398 | 5.4% |
| Visual & Performing Arts | 374 | 5.1% |
| Communications | 432 | 5.9% |
| Arts & Humanities | 473 | 6.4% |
| Total | 7,371 | 100.0% |
Transportation & Commute in College Park
Vehicle Availability by Sex in College Park
The most prevalent vehicle ownership categories in College Park are males with 2 vehicles (2,588, accounting for 35.1%) and females with 2 vehicles (1,885, making up 41.5%).
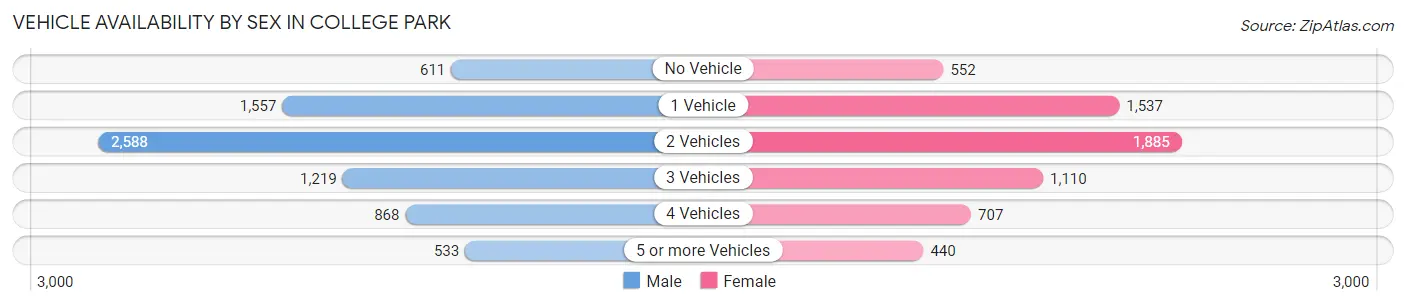
| Vehicles Available | Male | Female |
| No Vehicle | 611 (8.3%) | 552 (8.9%) |
| 1 Vehicle | 1,557 (21.1%) | 1,537 (24.7%) |
| 2 Vehicles | 2,588 (35.1%) | 1,885 (30.2%) |
| 3 Vehicles | 1,219 (16.5%) | 1,110 (17.8%) |
| 4 Vehicles | 868 (11.8%) | 707 (11.4%) |
| 5 or more Vehicles | 533 (7.2%) | 440 (7.1%) |
| Total | 7,376 (100.0%) | 6,231 (100.0%) |
Commute Time in College Park
The most frequently occuring commute durations in College Park are 10 to 14 minutes (2,434 commuters, 17.7%), 15 to 19 minutes (2,295 commuters, 16.7%), and 20 to 24 minutes (1,981 commuters, 14.4%).
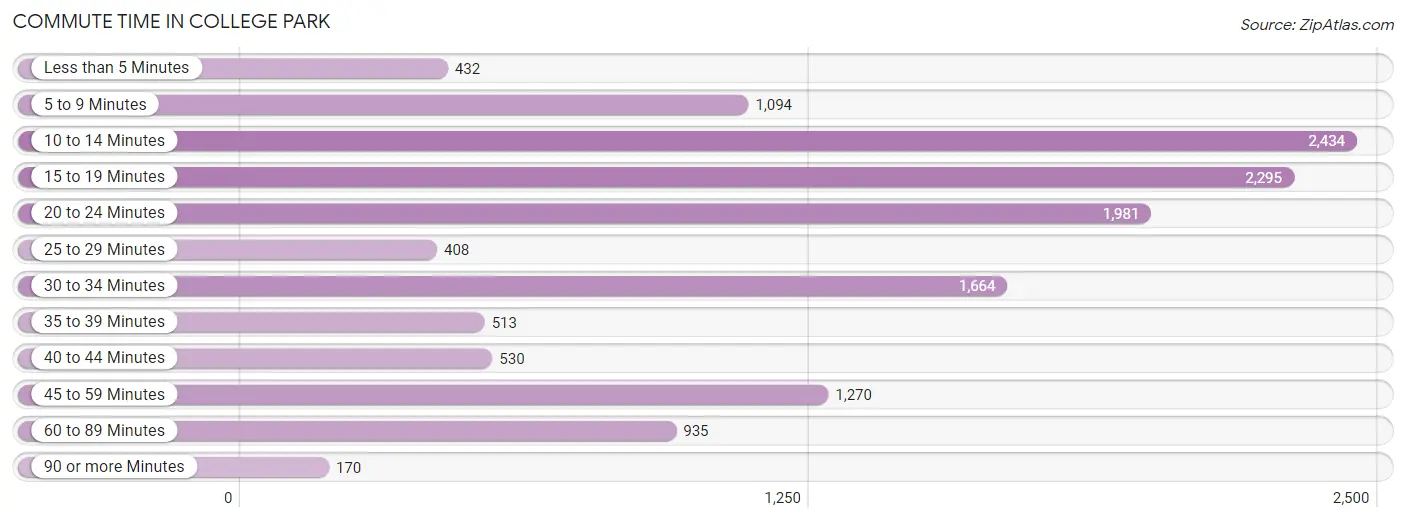
| Commute Time | # Commuters | % Commuters |
| Less than 5 Minutes | 432 | 3.2% |
| 5 to 9 Minutes | 1,094 | 8.0% |
| 10 to 14 Minutes | 2,434 | 17.7% |
| 15 to 19 Minutes | 2,295 | 16.7% |
| 20 to 24 Minutes | 1,981 | 14.4% |
| 25 to 29 Minutes | 408 | 3.0% |
| 30 to 34 Minutes | 1,664 | 12.1% |
| 35 to 39 Minutes | 513 | 3.7% |
| 40 to 44 Minutes | 530 | 3.9% |
| 45 to 59 Minutes | 1,270 | 9.2% |
| 60 to 89 Minutes | 935 | 6.8% |
| 90 or more Minutes | 170 | 1.2% |
Commute Time by Sex in College Park
The most common commute times in College Park are 20 to 24 minutes (1,175 commuters, 16.5%) for males and 10 to 14 minutes (1,487 commuters, 22.5%) for females.
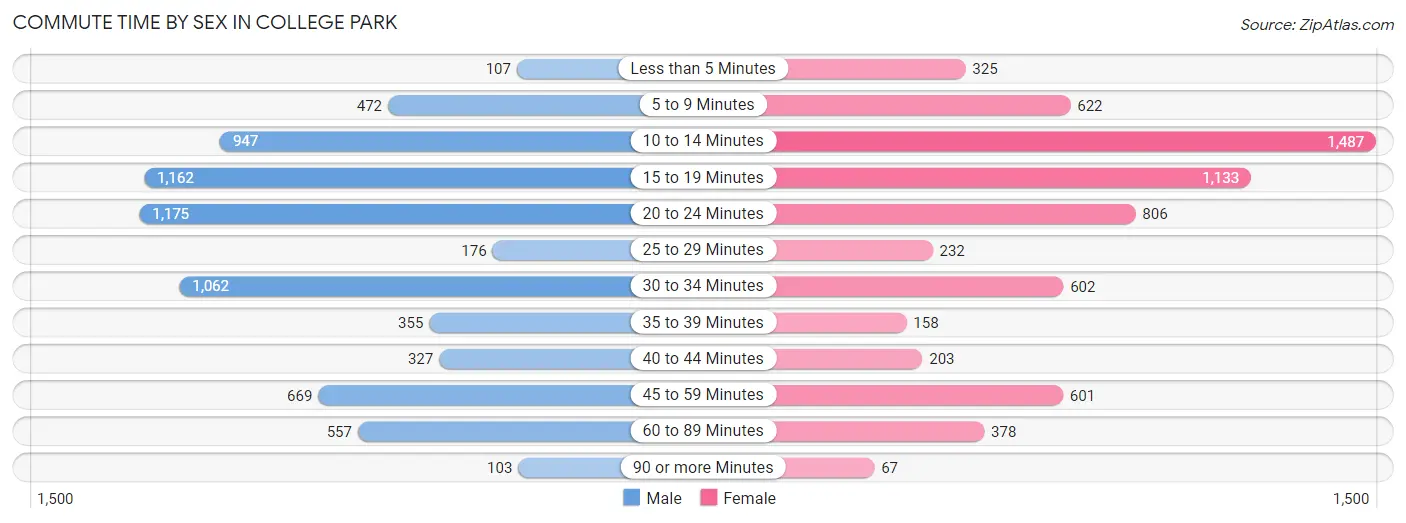
| Commute Time | Male | Female |
| Less than 5 Minutes | 107 (1.5%) | 325 (4.9%) |
| 5 to 9 Minutes | 472 (6.6%) | 622 (9.4%) |
| 10 to 14 Minutes | 947 (13.3%) | 1,487 (22.5%) |
| 15 to 19 Minutes | 1,162 (16.3%) | 1,133 (17.1%) |
| 20 to 24 Minutes | 1,175 (16.5%) | 806 (12.2%) |
| 25 to 29 Minutes | 176 (2.5%) | 232 (3.5%) |
| 30 to 34 Minutes | 1,062 (14.9%) | 602 (9.1%) |
| 35 to 39 Minutes | 355 (5.0%) | 158 (2.4%) |
| 40 to 44 Minutes | 327 (4.6%) | 203 (3.1%) |
| 45 to 59 Minutes | 669 (9.4%) | 601 (9.1%) |
| 60 to 89 Minutes | 557 (7.8%) | 378 (5.7%) |
| 90 or more Minutes | 103 (1.5%) | 67 (1.0%) |
Time of Departure to Work by Sex in College Park
The most frequent times of departure to work in College Park are 8:00 AM to 8:29 AM (1,192, 16.8%) for males and 9:00 AM to 9:59 AM (870, 13.2%) for females.
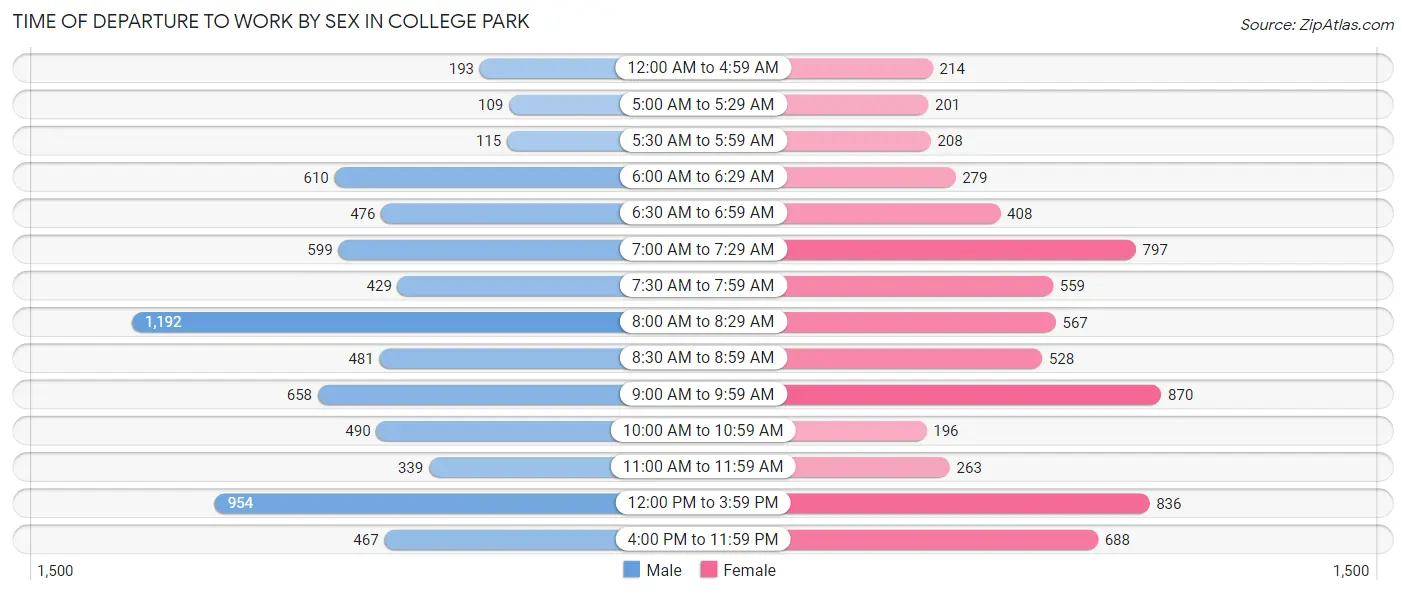
| Time of Departure | Male | Female |
| 12:00 AM to 4:59 AM | 193 (2.7%) | 214 (3.2%) |
| 5:00 AM to 5:29 AM | 109 (1.5%) | 201 (3.0%) |
| 5:30 AM to 5:59 AM | 115 (1.6%) | 208 (3.1%) |
| 6:00 AM to 6:29 AM | 610 (8.6%) | 279 (4.2%) |
| 6:30 AM to 6:59 AM | 476 (6.7%) | 408 (6.2%) |
| 7:00 AM to 7:29 AM | 599 (8.4%) | 797 (12.0%) |
| 7:30 AM to 7:59 AM | 429 (6.0%) | 559 (8.5%) |
| 8:00 AM to 8:29 AM | 1,192 (16.8%) | 567 (8.6%) |
| 8:30 AM to 8:59 AM | 481 (6.8%) | 528 (8.0%) |
| 9:00 AM to 9:59 AM | 658 (9.2%) | 870 (13.2%) |
| 10:00 AM to 10:59 AM | 490 (6.9%) | 196 (3.0%) |
| 11:00 AM to 11:59 AM | 339 (4.8%) | 263 (4.0%) |
| 12:00 PM to 3:59 PM | 954 (13.4%) | 836 (12.6%) |
| 4:00 PM to 11:59 PM | 467 (6.6%) | 688 (10.4%) |
| Total | 7,112 (100.0%) | 6,614 (100.0%) |
Housing Occupancy in College Park
Occupancy by Ownership in College Park
Of the total 8,835 dwellings in College Park, owner-occupied units account for 3,613 (40.9%), while renter-occupied units make up 5,222 (59.1%).
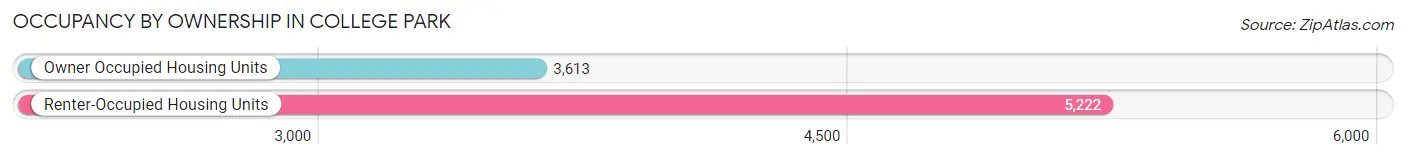
| Occupancy | # Housing Units | % Housing Units |
| Owner Occupied Housing Units | 3,613 | 40.9% |
| Renter-Occupied Housing Units | 5,222 | 59.1% |
| Total Occupied Housing Units | 8,835 | 100.0% |
Occupancy by Household Size in College Park
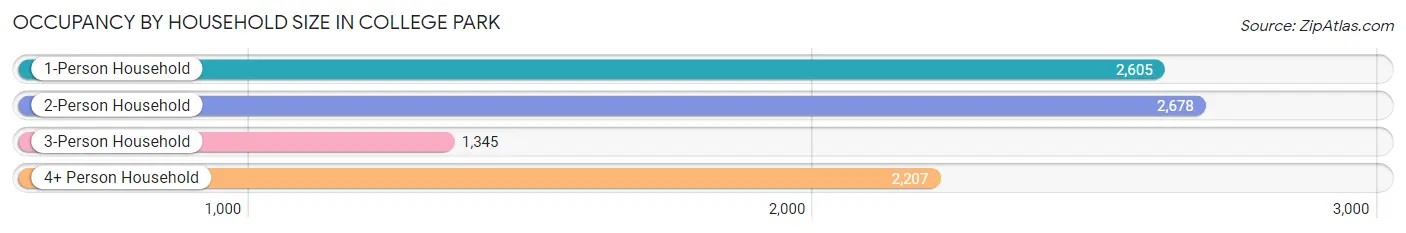
| Household Size | # Housing Units | % Housing Units |
| 1-Person Household | 2,605 | 29.5% |
| 2-Person Household | 2,678 | 30.3% |
| 3-Person Household | 1,345 | 15.2% |
| 4+ Person Household | 2,207 | 25.0% |
| Total Housing Units | 8,835 | 100.0% |
Occupancy by Ownership by Household Size in College Park
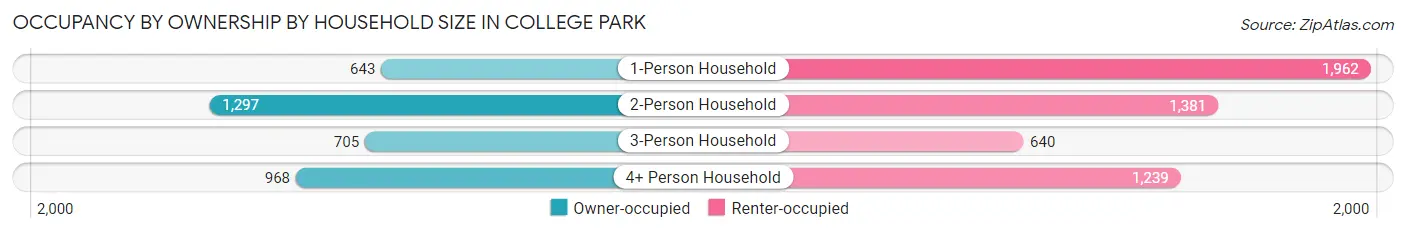
| Household Size | Owner-occupied | Renter-occupied |
| 1-Person Household | 643 (24.7%) | 1,962 (75.3%) |
| 2-Person Household | 1,297 (48.4%) | 1,381 (51.6%) |
| 3-Person Household | 705 (52.4%) | 640 (47.6%) |
| 4+ Person Household | 968 (43.9%) | 1,239 (56.1%) |
| Total Housing Units | 3,613 (40.9%) | 5,222 (59.1%) |
Occupancy by Educational Attainment in College Park
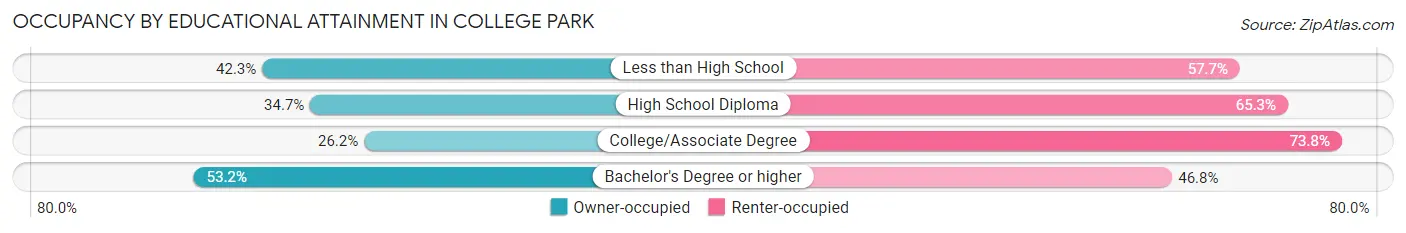
| Household Size | Owner-occupied | Renter-occupied |
| Less than High School | 207 (42.3%) | 282 (57.7%) |
| High School Diploma | 454 (34.7%) | 854 (65.3%) |
| College/Associate Degree | 766 (26.2%) | 2,162 (73.8%) |
| Bachelor's Degree or higher | 2,186 (53.2%) | 1,924 (46.8%) |
Occupancy by Age of Householder in College Park
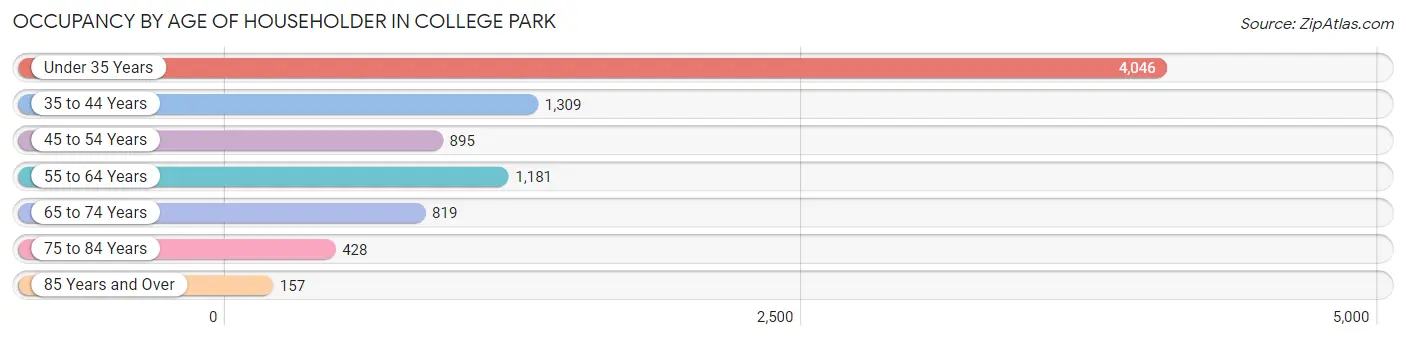
| Age Bracket | # Households | % Households |
| Under 35 Years | 4,046 | 45.8% |
| 35 to 44 Years | 1,309 | 14.8% |
| 45 to 54 Years | 895 | 10.1% |
| 55 to 64 Years | 1,181 | 13.4% |
| 65 to 74 Years | 819 | 9.3% |
| 75 to 84 Years | 428 | 4.8% |
| 85 Years and Over | 157 | 1.8% |
| Total | 8,835 | 100.0% |
Housing Finances in College Park
Median Income by Occupancy in College Park
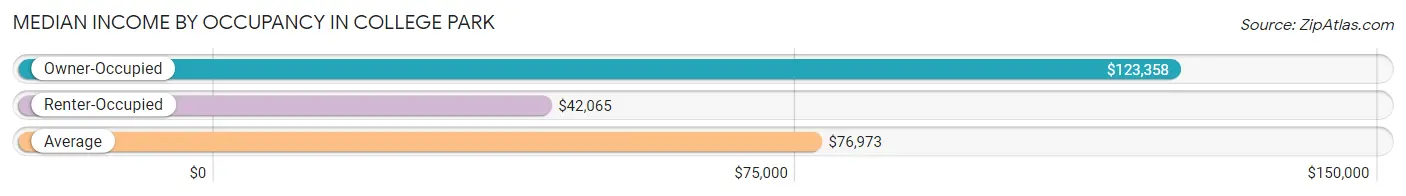
| Occupancy Type | # Households | Median Income |
| Owner-Occupied | 3,613 (40.9%) | $123,358 |
| Renter-Occupied | 5,222 (59.1%) | $42,065 |
| Average | 8,835 (100.0%) | $76,973 |
Occupancy by Householder Income Bracket in College Park
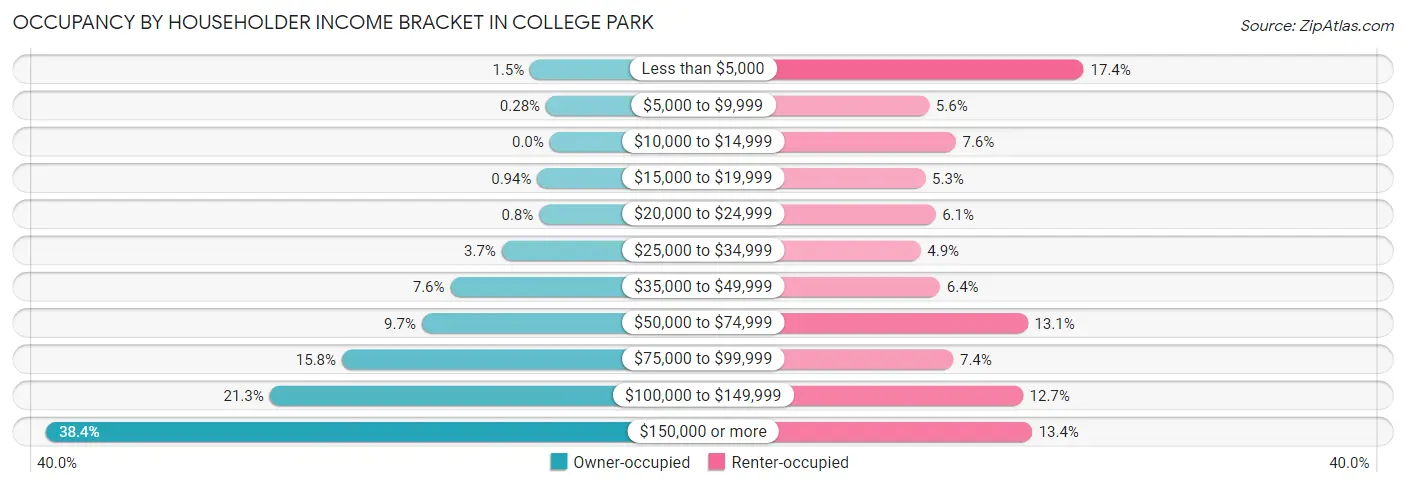
| Income Bracket | Owner-occupied | Renter-occupied |
| Less than $5,000 | 54 (1.5%) | 907 (17.4%) |
| $5,000 to $9,999 | 10 (0.3%) | 292 (5.6%) |
| $10,000 to $14,999 | 0 (0.0%) | 398 (7.6%) |
| $15,000 to $19,999 | 34 (0.9%) | 277 (5.3%) |
| $20,000 to $24,999 | 29 (0.8%) | 317 (6.1%) |
| $25,000 to $34,999 | 132 (3.6%) | 258 (4.9%) |
| $35,000 to $49,999 | 273 (7.6%) | 335 (6.4%) |
| $50,000 to $74,999 | 352 (9.7%) | 684 (13.1%) |
| $75,000 to $99,999 | 572 (15.8%) | 388 (7.4%) |
| $100,000 to $149,999 | 771 (21.3%) | 665 (12.7%) |
| $150,000 or more | 1,386 (38.4%) | 701 (13.4%) |
| Total | 3,613 (100.0%) | 5,222 (100.0%) |
Monthly Housing Cost Tiers in College Park
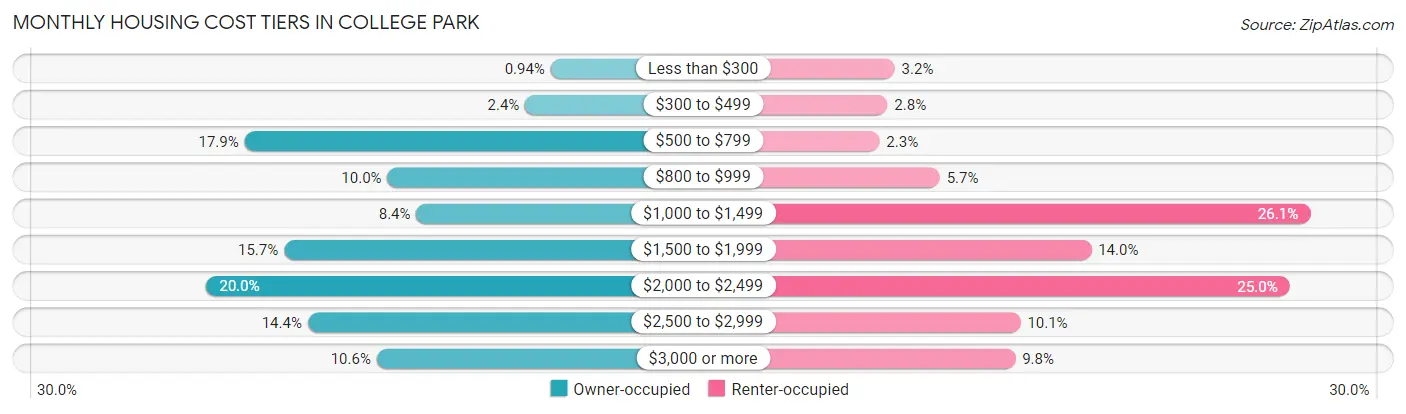
| Monthly Cost | Owner-occupied | Renter-occupied |
| Less than $300 | 34 (0.9%) | 165 (3.2%) |
| $300 to $499 | 85 (2.4%) | 144 (2.8%) |
| $500 to $799 | 645 (17.8%) | 121 (2.3%) |
| $800 to $999 | 360 (10.0%) | 295 (5.7%) |
| $1,000 to $1,499 | 302 (8.4%) | 1,363 (26.1%) |
| $1,500 to $1,999 | 566 (15.7%) | 732 (14.0%) |
| $2,000 to $2,499 | 721 (20.0%) | 1,304 (25.0%) |
| $2,500 to $2,999 | 519 (14.4%) | 528 (10.1%) |
| $3,000 or more | 381 (10.5%) | 513 (9.8%) |
| Total | 3,613 (100.0%) | 5,222 (100.0%) |
Physical Housing Characteristics in College Park
Housing Structures in College Park
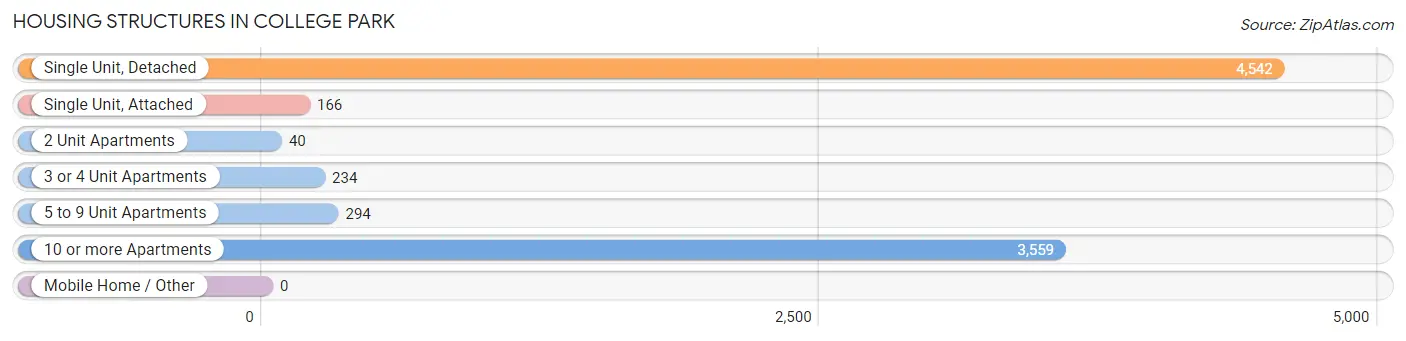
| Structure Type | # Housing Units | % Housing Units |
| Single Unit, Detached | 4,542 | 51.4% |
| Single Unit, Attached | 166 | 1.9% |
| 2 Unit Apartments | 40 | 0.4% |
| 3 or 4 Unit Apartments | 234 | 2.6% |
| 5 to 9 Unit Apartments | 294 | 3.3% |
| 10 or more Apartments | 3,559 | 40.3% |
| Mobile Home / Other | 0 | 0.0% |
| Total | 8,835 | 100.0% |
Housing Structures by Occupancy in College Park
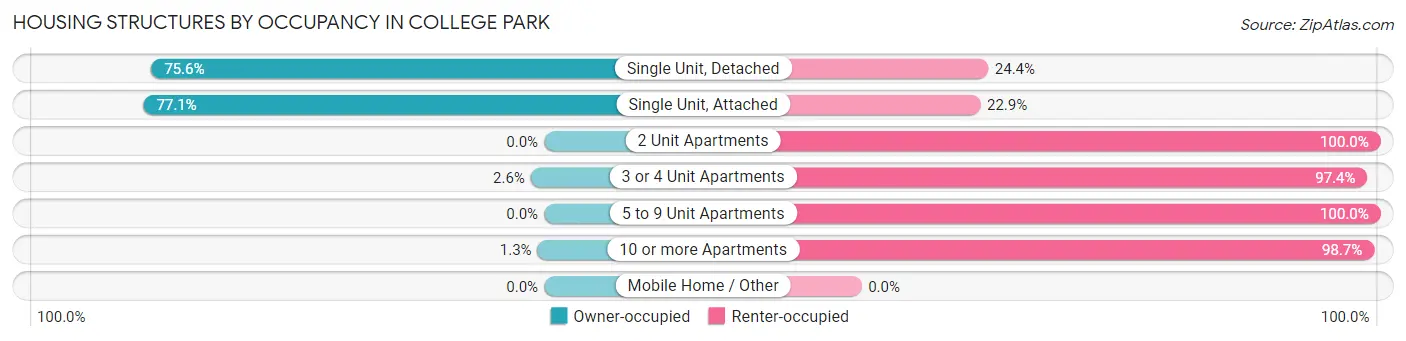
| Structure Type | Owner-occupied | Renter-occupied |
| Single Unit, Detached | 3,434 (75.6%) | 1,108 (24.4%) |
| Single Unit, Attached | 128 (77.1%) | 38 (22.9%) |
| 2 Unit Apartments | 0 (0.0%) | 40 (100.0%) |
| 3 or 4 Unit Apartments | 6 (2.6%) | 228 (97.4%) |
| 5 to 9 Unit Apartments | 0 (0.0%) | 294 (100.0%) |
| 10 or more Apartments | 45 (1.3%) | 3,514 (98.7%) |
| Mobile Home / Other | 0 (0.0%) | 0 (0.0%) |
| Total | 3,613 (40.9%) | 5,222 (59.1%) |
Housing Structures by Number of Rooms in College Park
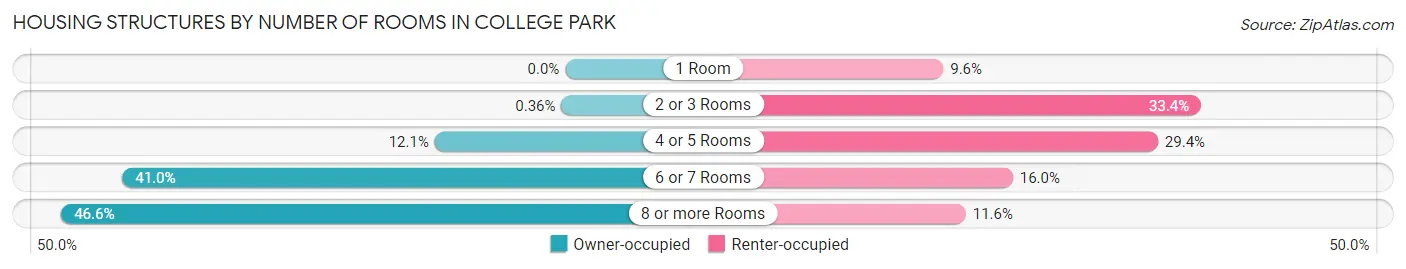
| Number of Rooms | Owner-occupied | Renter-occupied |
| 1 Room | 0 (0.0%) | 499 (9.6%) |
| 2 or 3 Rooms | 13 (0.4%) | 1,744 (33.4%) |
| 4 or 5 Rooms | 436 (12.1%) | 1,536 (29.4%) |
| 6 or 7 Rooms | 1,480 (41.0%) | 835 (16.0%) |
| 8 or more Rooms | 1,684 (46.6%) | 608 (11.6%) |
| Total | 3,613 (100.0%) | 5,222 (100.0%) |
Housing Structure by Heating Type in College Park
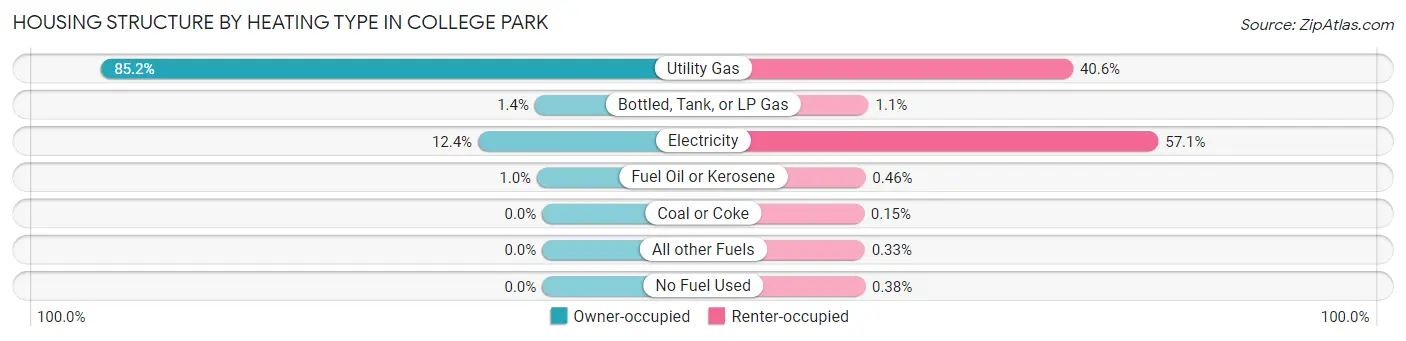
| Heating Type | Owner-occupied | Renter-occupied |
| Utility Gas | 3,078 (85.2%) | 2,118 (40.6%) |
| Bottled, Tank, or LP Gas | 51 (1.4%) | 56 (1.1%) |
| Electricity | 448 (12.4%) | 2,979 (57.1%) |
| Fuel Oil or Kerosene | 36 (1.0%) | 24 (0.5%) |
| Coal or Coke | 0 (0.0%) | 8 (0.2%) |
| All other Fuels | 0 (0.0%) | 17 (0.3%) |
| No Fuel Used | 0 (0.0%) | 20 (0.4%) |
| Total | 3,613 (100.0%) | 5,222 (100.0%) |
Household Vehicle Usage in College Park
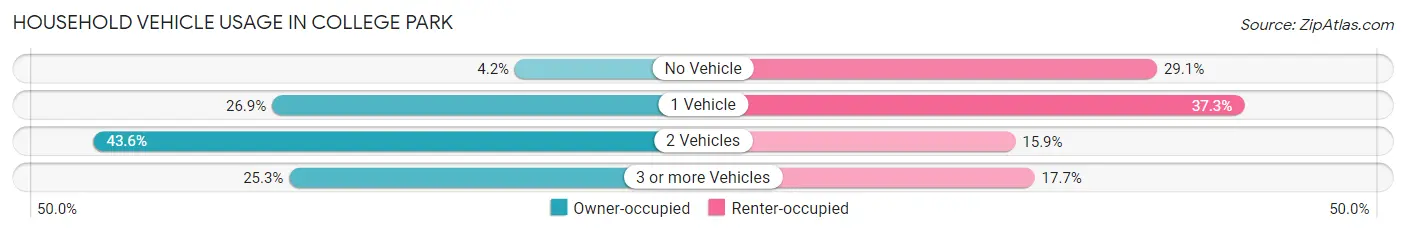
| Vehicles per Household | Owner-occupied | Renter-occupied |
| No Vehicle | 153 (4.2%) | 1,521 (29.1%) |
| 1 Vehicle | 972 (26.9%) | 1,945 (37.2%) |
| 2 Vehicles | 1,574 (43.6%) | 831 (15.9%) |
| 3 or more Vehicles | 914 (25.3%) | 925 (17.7%) |
| Total | 3,613 (100.0%) | 5,222 (100.0%) |
Real Estate & Mortgages in College Park
Real Estate and Mortgage Overview in College Park
| Characteristic | Without Mortgage | With Mortgage |
| Housing Units | 1,213 | 2,400 |
| Median Property Value | $393,800 | $410,800 |
| Median Household Income | $103,353 | $1,008 |
| Monthly Housing Costs | $733 | $381 |
| Real Estate Taxes | $4,688 | $29 |
Property Value by Mortgage Status in College Park
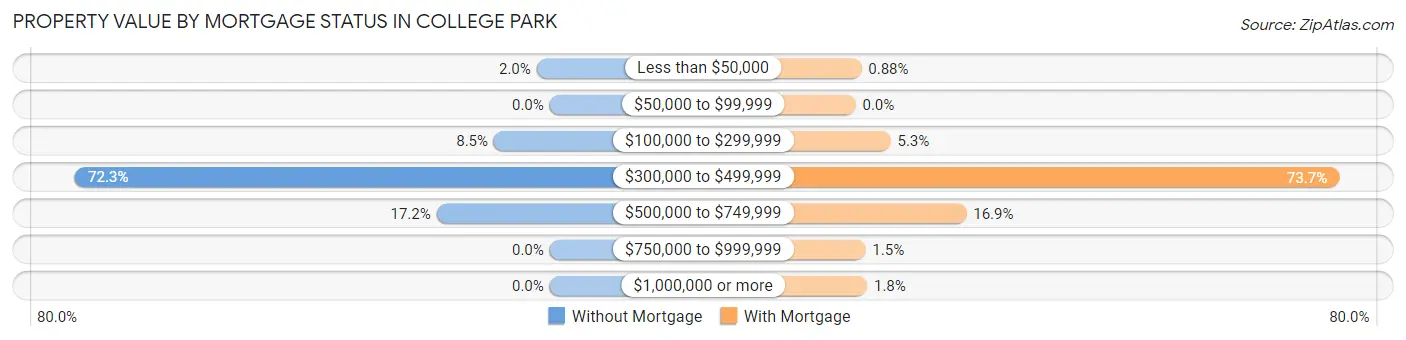
| Property Value | Without Mortgage | With Mortgage |
| Less than $50,000 | 24 (2.0%) | 21 (0.9%) |
| $50,000 to $99,999 | 0 (0.0%) | 0 (0.0%) |
| $100,000 to $299,999 | 103 (8.5%) | 128 (5.3%) |
| $300,000 to $499,999 | 877 (72.3%) | 1,768 (73.7%) |
| $500,000 to $749,999 | 209 (17.2%) | 405 (16.9%) |
| $750,000 to $999,999 | 0 (0.0%) | 36 (1.5%) |
| $1,000,000 or more | 0 (0.0%) | 42 (1.8%) |
| Total | 1,213 (100.0%) | 2,400 (100.0%) |
Household Income by Mortgage Status in College Park
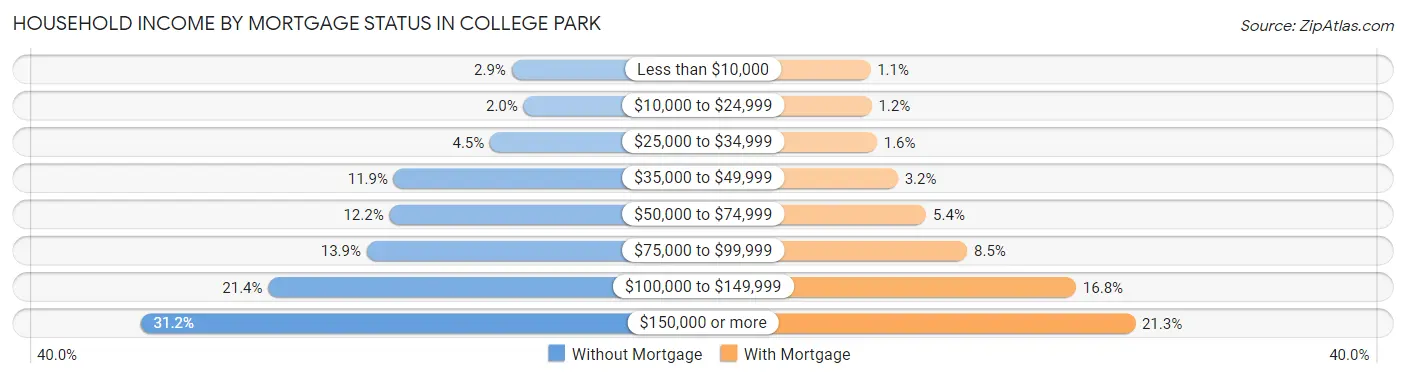
| Household Income | Without Mortgage | With Mortgage |
| Less than $10,000 | 35 (2.9%) | 27 (1.1%) |
| $10,000 to $24,999 | 24 (2.0%) | 29 (1.2%) |
| $25,000 to $34,999 | 55 (4.5%) | 39 (1.6%) |
| $35,000 to $49,999 | 144 (11.9%) | 77 (3.2%) |
| $50,000 to $74,999 | 148 (12.2%) | 129 (5.4%) |
| $75,000 to $99,999 | 169 (13.9%) | 204 (8.5%) |
| $100,000 to $149,999 | 260 (21.4%) | 403 (16.8%) |
| $150,000 or more | 378 (31.2%) | 511 (21.3%) |
| Total | 1,213 (100.0%) | 2,400 (100.0%) |
Property Value to Household Income Ratio in College Park
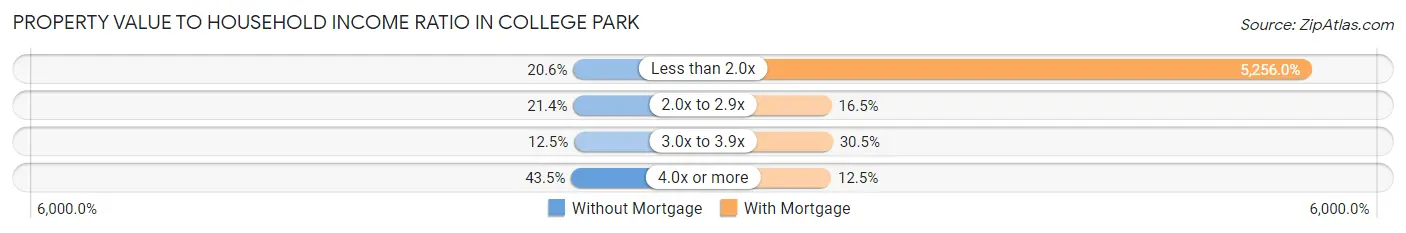
| Value-to-Income Ratio | Without Mortgage | With Mortgage |
| Less than 2.0x | 250 (20.6%) | 126,144 (5,256.0%) |
| 2.0x to 2.9x | 260 (21.4%) | 395 (16.5%) |
| 3.0x to 3.9x | 151 (12.4%) | 732 (30.5%) |
| 4.0x or more | 527 (43.4%) | 300 (12.5%) |
| Total | 1,213 (100.0%) | 2,400 (100.0%) |
Real Estate Taxes by Mortgage Status in College Park
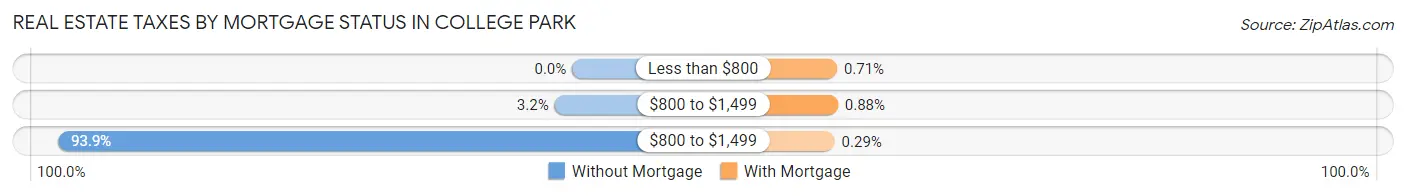
| Property Taxes | Without Mortgage | With Mortgage |
| Less than $800 | 0 (0.0%) | 17 (0.7%) |
| $800 to $1,499 | 39 (3.2%) | 21 (0.9%) |
| $800 to $1,499 | 1,139 (93.9%) | 7 (0.3%) |
| Total | 1,213 (100.0%) | 2,400 (100.0%) |
Health & Disability in College Park
Health Insurance Coverage by Age in College Park
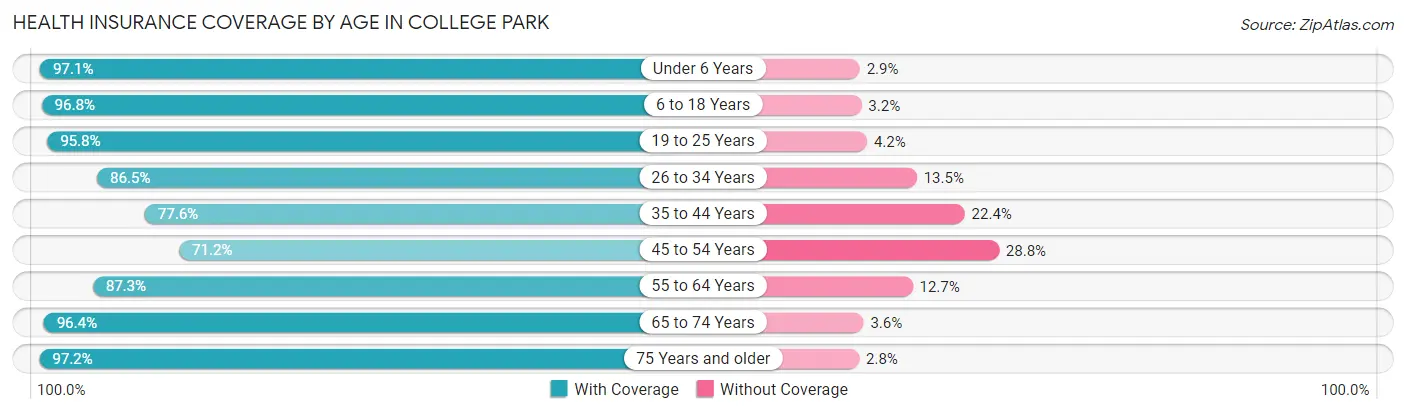
| Age Bracket | With Coverage | Without Coverage |
| Under 6 Years | 1,384 (97.1%) | 41 (2.9%) |
| 6 to 18 Years | 5,226 (96.8%) | 172 (3.2%) |
| 19 to 25 Years | 13,755 (95.8%) | 607 (4.2%) |
| 26 to 34 Years | 3,022 (86.5%) | 472 (13.5%) |
| 35 to 44 Years | 2,371 (77.6%) | 686 (22.4%) |
| 45 to 54 Years | 1,528 (71.2%) | 619 (28.8%) |
| 55 to 64 Years | 1,811 (87.3%) | 264 (12.7%) |
| 65 to 74 Years | 1,375 (96.4%) | 51 (3.6%) |
| 75 Years and older | 880 (97.2%) | 25 (2.8%) |
| Total | 31,352 (91.4%) | 2,937 (8.6%) |
Health Insurance Coverage by Citizenship Status in College Park
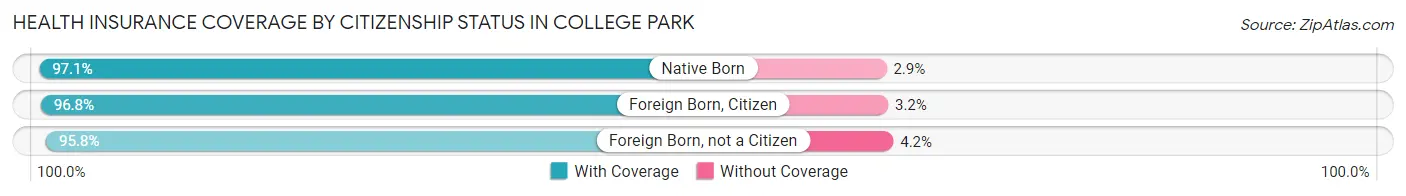
| Citizenship Status | With Coverage | Without Coverage |
| Native Born | 1,384 (97.1%) | 41 (2.9%) |
| Foreign Born, Citizen | 5,226 (96.8%) | 172 (3.2%) |
| Foreign Born, not a Citizen | 13,755 (95.8%) | 607 (4.2%) |
Health Insurance Coverage by Household Income in College Park
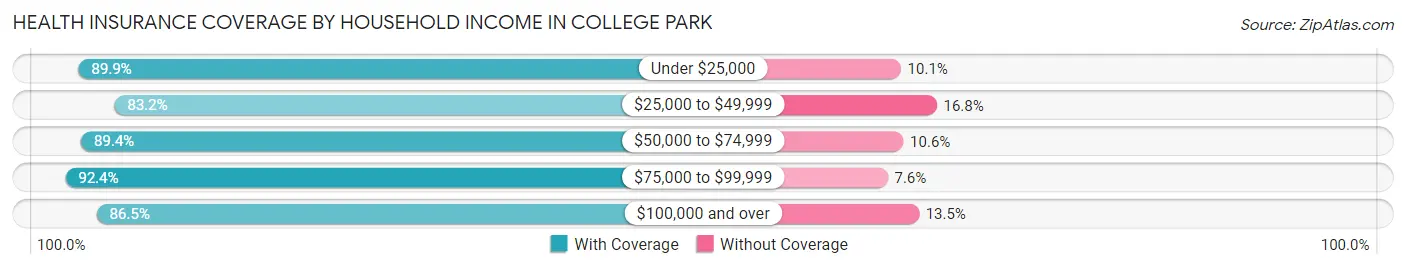
| Household Income | With Coverage | Without Coverage |
| Under $25,000 | 4,010 (89.9%) | 450 (10.1%) |
| $25,000 to $49,999 | 2,162 (83.2%) | 437 (16.8%) |
| $50,000 to $74,999 | 2,472 (89.4%) | 292 (10.6%) |
| $75,000 to $99,999 | 2,602 (92.4%) | 215 (7.6%) |
| $100,000 and over | 9,827 (86.5%) | 1,530 (13.5%) |
Public vs Private Health Insurance Coverage by Age in College Park
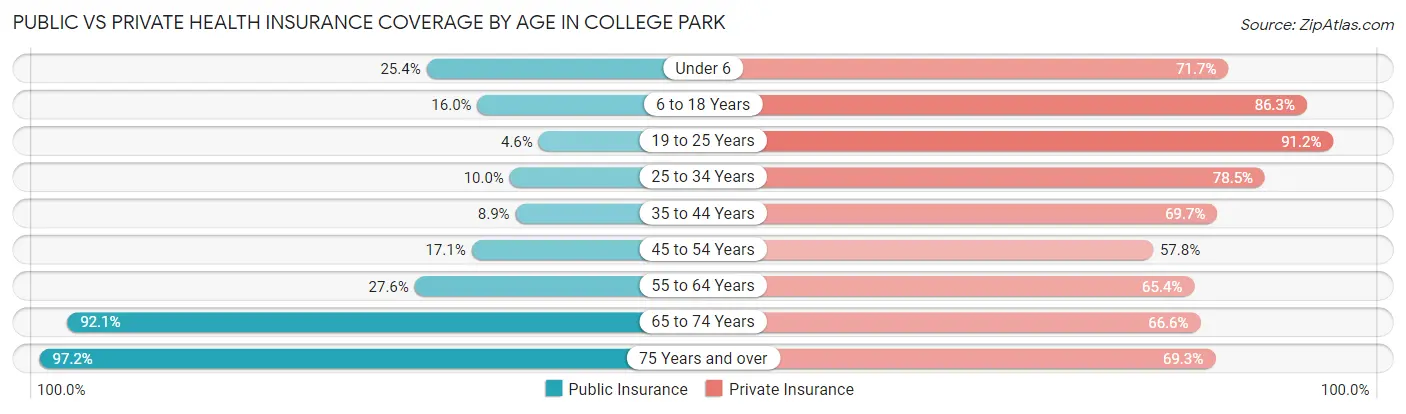
| Age Bracket | Public Insurance | Private Insurance |
| Under 6 | 362 (25.4%) | 1,022 (71.7%) |
| 6 to 18 Years | 861 (16.0%) | 4,659 (86.3%) |
| 19 to 25 Years | 659 (4.6%) | 13,100 (91.2%) |
| 25 to 34 Years | 348 (10.0%) | 2,744 (78.5%) |
| 35 to 44 Years | 272 (8.9%) | 2,130 (69.7%) |
| 45 to 54 Years | 366 (17.1%) | 1,240 (57.8%) |
| 55 to 64 Years | 573 (27.6%) | 1,357 (65.4%) |
| 65 to 74 Years | 1,313 (92.1%) | 949 (66.5%) |
| 75 Years and over | 880 (97.2%) | 627 (69.3%) |
| Total | 5,634 (16.4%) | 27,828 (81.2%) |
Disability Status by Sex by Age in College Park
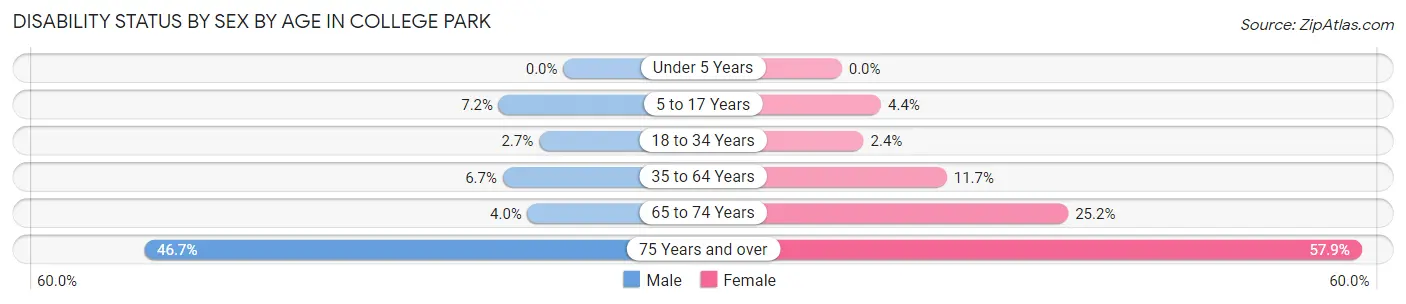
| Age Bracket | Male | Female |
| Under 5 Years | 0 (0.0%) | 0 (0.0%) |
| 5 to 17 Years | 76 (7.2%) | 38 (4.4%) |
| 18 to 34 Years | 280 (2.7%) | 270 (2.4%) |
| 35 to 64 Years | 293 (6.7%) | 343 (11.7%) |
| 65 to 74 Years | 30 (4.0%) | 169 (25.2%) |
| 75 Years and over | 141 (46.7%) | 349 (57.9%) |
Disability Class by Sex by Age in College Park
Disability Class: Hearing Difficulty
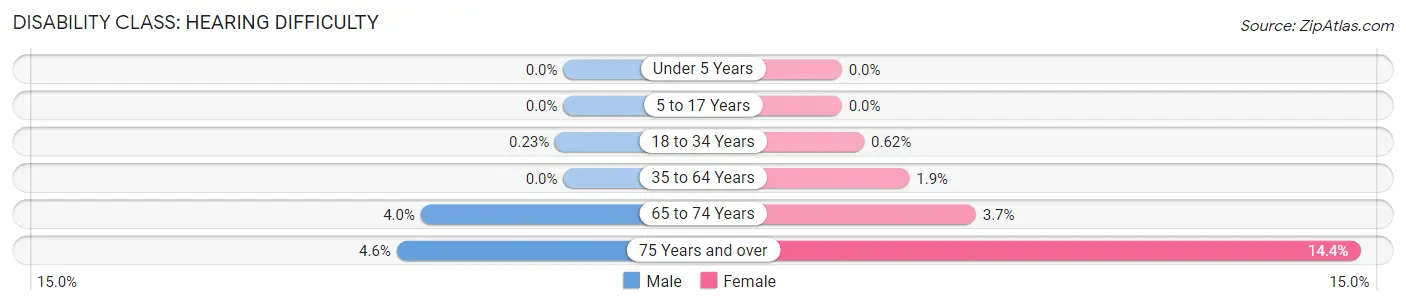
| Age Bracket | Male | Female |
| Under 5 Years | 0 (0.0%) | 0 (0.0%) |
| 5 to 17 Years | 0 (0.0%) | 0 (0.0%) |
| 18 to 34 Years | 24 (0.2%) | 69 (0.6%) |
| 35 to 64 Years | 0 (0.0%) | 55 (1.9%) |
| 65 to 74 Years | 30 (4.0%) | 25 (3.7%) |
| 75 Years and over | 14 (4.6%) | 87 (14.4%) |
Disability Class: Vision Difficulty
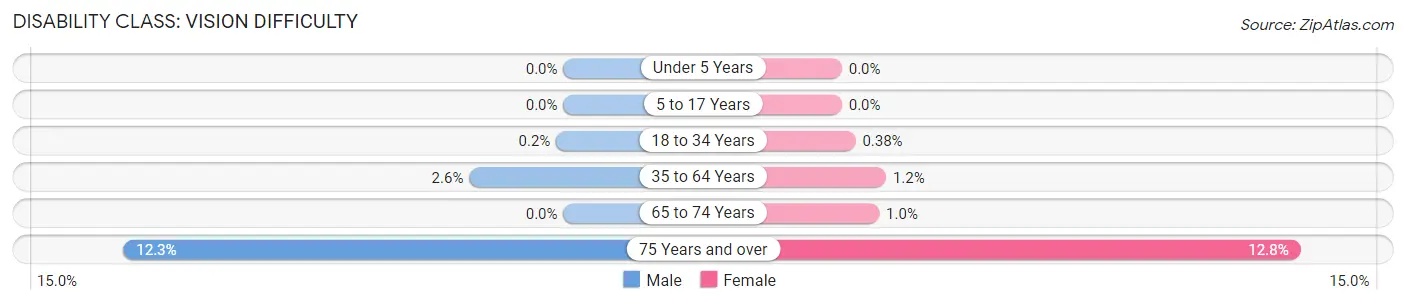
| Age Bracket | Male | Female |
| Under 5 Years | 0 (0.0%) | 0 (0.0%) |
| 5 to 17 Years | 0 (0.0%) | 0 (0.0%) |
| 18 to 34 Years | 21 (0.2%) | 42 (0.4%) |
| 35 to 64 Years | 114 (2.6%) | 36 (1.2%) |
| 65 to 74 Years | 0 (0.0%) | 7 (1.0%) |
| 75 Years and over | 37 (12.2%) | 77 (12.8%) |
Disability Class: Cognitive Difficulty
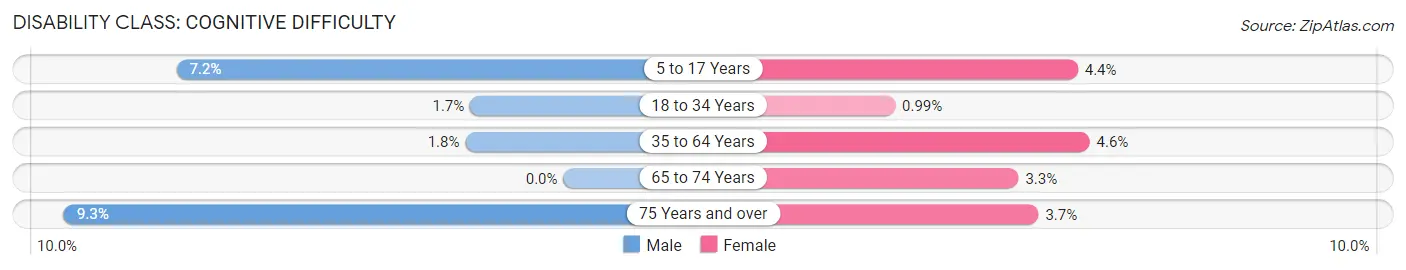
| Age Bracket | Male | Female |
| 5 to 17 Years | 76 (7.2%) | 38 (4.4%) |
| 18 to 34 Years | 179 (1.7%) | 110 (1.0%) |
| 35 to 64 Years | 79 (1.8%) | 135 (4.6%) |
| 65 to 74 Years | 0 (0.0%) | 22 (3.3%) |
| 75 Years and over | 28 (9.3%) | 22 (3.6%) |
Disability Class: Ambulatory Difficulty
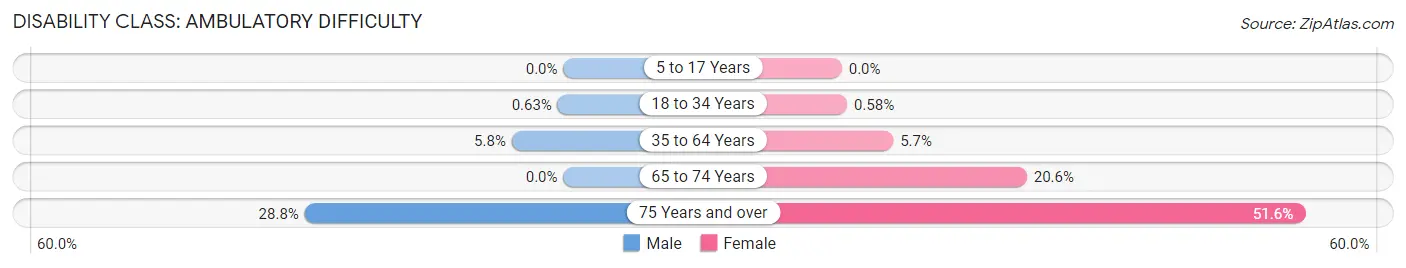
| Age Bracket | Male | Female |
| 5 to 17 Years | 0 (0.0%) | 0 (0.0%) |
| 18 to 34 Years | 65 (0.6%) | 64 (0.6%) |
| 35 to 64 Years | 250 (5.8%) | 168 (5.7%) |
| 65 to 74 Years | 0 (0.0%) | 138 (20.6%) |
| 75 Years and over | 87 (28.8%) | 311 (51.6%) |
Disability Class: Self-Care Difficulty
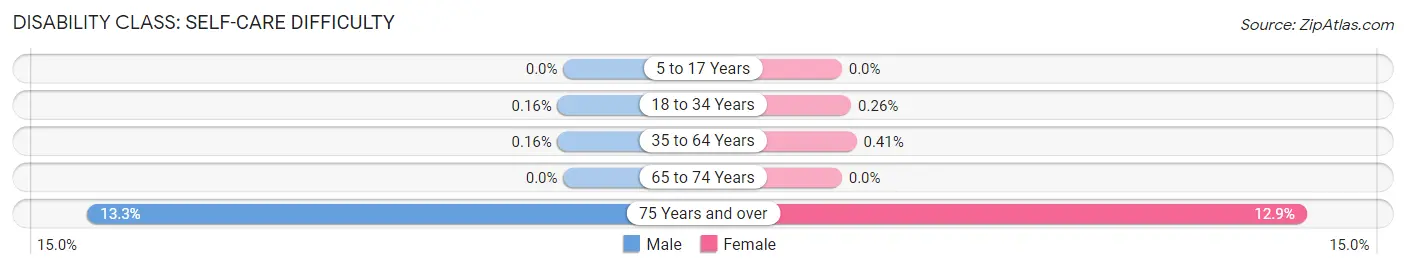
| Age Bracket | Male | Female |
| 5 to 17 Years | 0 (0.0%) | 0 (0.0%) |
| 18 to 34 Years | 17 (0.2%) | 29 (0.3%) |
| 35 to 64 Years | 7 (0.2%) | 12 (0.4%) |
| 65 to 74 Years | 0 (0.0%) | 0 (0.0%) |
| 75 Years and over | 40 (13.3%) | 78 (12.9%) |
Technology Access in College Park
Computing Device Access in College Park
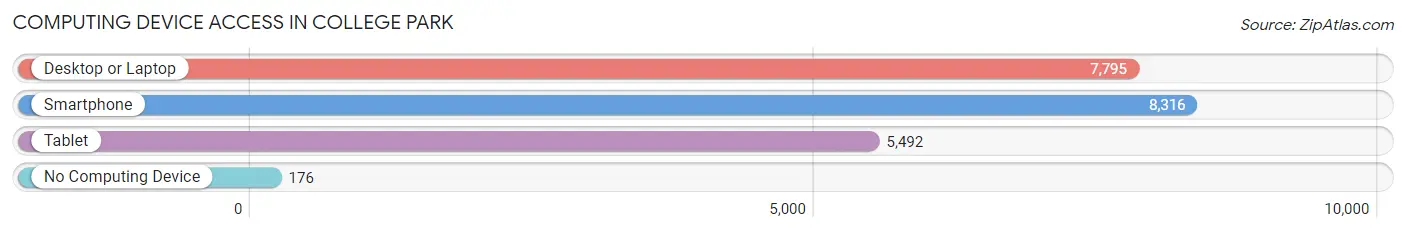
| Device Type | # Households | % Households |
| Desktop or Laptop | 7,795 | 88.2% |
| Smartphone | 8,316 | 94.1% |
| Tablet | 5,492 | 62.2% |
| No Computing Device | 176 | 2.0% |
| Total | 8,835 | 100.0% |
Internet Access in College Park
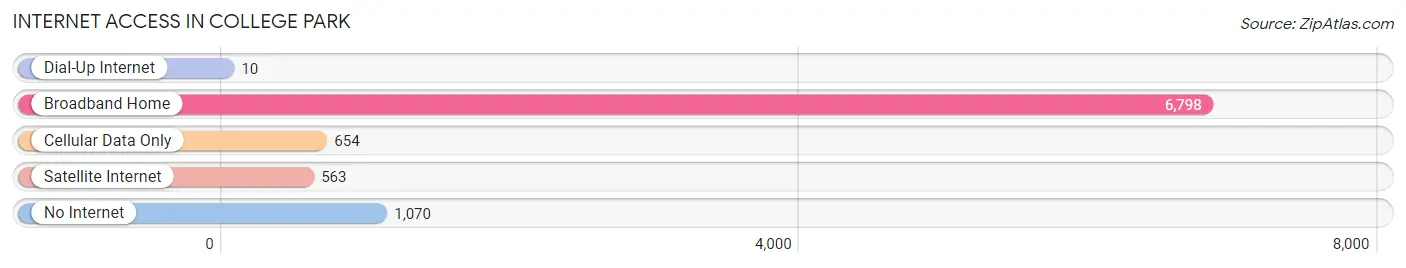
| Internet Type | # Households | % Households |
| Dial-Up Internet | 10 | 0.1% |
| Broadband Home | 6,798 | 76.9% |
| Cellular Data Only | 654 | 7.4% |
| Satellite Internet | 563 | 6.4% |
| No Internet | 1,070 | 12.1% |
| Total | 8,835 | 100.0% |
College Park Summary
History
College Park, Maryland is a city located in Prince George’s County, Maryland, United States, just outside of Washington, D.C. The city is home to the University of Maryland, College Park, the flagship institution of the University System of Maryland. The city is also home to the National Archives at College Park, the National Oceanic and Atmospheric Administration Center for Weather and Climate Prediction, and the National Institute of Standards and Technology.
The area that is now College Park was first settled in the early 19th century by the Piscataway tribe. The tribe was eventually forced out of the area by the Maryland government in the 1830s. The area was then developed as a farming community, with the first post office opening in 1851. The area was known as “College Station” until 1893, when the name was changed to College Park.
In 1856, the Maryland Agricultural College (now the University of Maryland, College Park) was founded in the area. The college was the first public institution of higher education in the state of Maryland. The college was initially a land-grant college, and was later designated as a research university in 1959.
The city of College Park was officially incorporated in 1945. The city has since grown to become a major educational and research center, with the University of Maryland, College Park being the largest employer in the city.
Geography
College Park is located in Prince George’s County, Maryland, United States, just outside of Washington, D.C. The city is situated on the banks of the Anacostia River, and is bordered by the cities of Hyattsville and Greenbelt to the north, and by the cities of Beltsville and Laurel to the south. The city has a total area of 8.2 square miles, of which 8.1 square miles is land and 0.1 square miles is water.
The city is located in the Piedmont region of Maryland, and is characterized by rolling hills and valleys. The city is located at an elevation of approximately 200 feet above sea level. The climate in College Park is classified as humid subtropical, with hot, humid summers and mild winters.
Economy
The economy of College Park is largely driven by the University of Maryland, College Park, which is the largest employer in the city. The university employs over 10,000 people, and has an annual economic impact of over $2 billion. Other major employers in the city include the National Archives at College Park, the National Oceanic and Atmospheric Administration Center for Weather and Climate Prediction, and the National Institute of Standards and Technology.
The city also has a vibrant retail sector, with numerous shopping centers, restaurants, and other businesses located throughout the city. The city is also home to a number of technology companies, including the headquarters of the software company, Blackboard Inc.
Demographics
As of the 2010 census, the population of College Park was 30,413. The racial makeup of the city was 54.3% White, 24.2% African American, 0.3% Native American, 13.2% Asian, 0.1% Pacific Islander, 4.2% from other races, and 3.7% from two or more races. Hispanic or Latino of any race were 8.7% of the population.
The median household income in College Park was $50,845, and the median family income was $63,867. The per capita income for the city was $25,890. About 11.2% of families and 17.2% of the population were below the poverty line, including 22.2% of those under age 18 and 8.2% of those age 65 or over.
Common Questions
What is Per Capita Income in College Park?
Per Capita income in College Park is $26,381.
What is the Median Family Income in College Park?
Median Family Income in College Park is $112,587.
What is the Median Household income in College Park?
Median Household Income in College Park is $76,973.
What is Income or Wage Gap in College Park?
Income or Wage Gap in College Park is 55.2%.
Women in College Park earn 44.8 cents for every dollar earned by a man.
What is Inequality or Gini Index in College Park?
Inequality or Gini Index in College Park is 0.49.
What is the Total Population of College Park?
Total Population of College Park is 34,416.
What is the Total Male Population of College Park?
Total Male Population of College Park is 17,549.
What is the Total Female Population of College Park?
Total Female Population of College Park is 16,867.
What is the Ratio of Males per 100 Females in College Park?
There are 104.04 Males per 100 Females in College Park.
What is the Ratio of Females per 100 Males in College Park?
There are 96.11 Females per 100 Males in College Park.
What is the Median Population Age in College Park?
Median Population Age in College Park is 21.6 Years.
What is the Average Family Size in College Park
Average Family Size in College Park is 3.2 People.
What is the Average Household Size in College Park
Average Household Size in College Park is 2.7 People.
How Large is the Labor Force in College Park?
There are 17,453 People in the Labor Forcein in College Park.
What is the Percentage of People in the Labor Force in College Park?
55.4% of People are in the Labor Force in College Park.
What is the Unemployment Rate in College Park?
Unemployment Rate in College Park is 6.7%.