Cities with the Most Immigrants from Middle Africa in Maryland
RELATED REPORTS & OPTIONS
Middle Africa
Maryland
Compare Cities
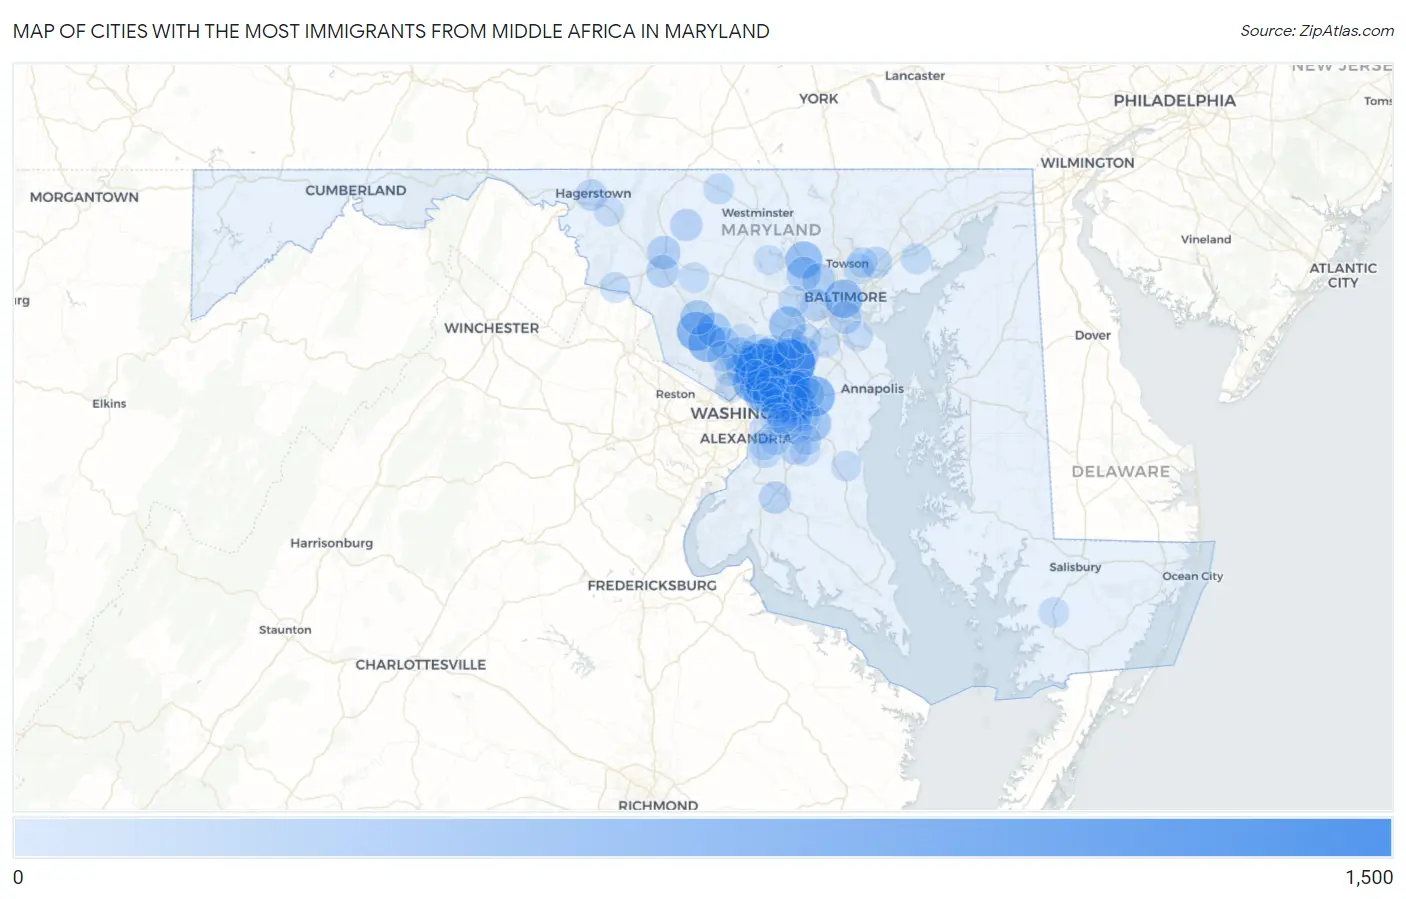
Map of Cities with the Most Immigrants from Middle Africa in Maryland
0
1,500
Cities with the Most Immigrants from Middle Africa in Maryland
| City | Middle Africa | vs State | vs National | |
| 1. | White Oak | 1,392 | 27,057(5.14%)#1 | 193,874(0.72%)#19 |
| 2. | South Laurel | 1,269 | 27,057(4.69%)#2 | 193,874(0.65%)#22 |
| 3. | New Carrollton | 1,064 | 27,057(3.93%)#3 | 193,874(0.55%)#24 |
| 4. | Greenbelt | 1,017 | 27,057(3.76%)#4 | 193,874(0.52%)#26 |
| 5. | Adelphi | 956 | 27,057(3.53%)#5 | 193,874(0.49%)#32 |
| 6. | Fairland | 911 | 27,057(3.37%)#6 | 193,874(0.47%)#35 |
| 7. | Bowie | 702 | 27,057(2.59%)#7 | 193,874(0.36%)#48 |
| 8. | Silver Spring | 658 | 27,057(2.43%)#8 | 193,874(0.34%)#50 |
| 9. | Germantown | 647 | 27,057(2.39%)#9 | 193,874(0.33%)#53 |
| 10. | Gaithersburg | 644 | 27,057(2.38%)#10 | 193,874(0.33%)#55 |
| 11. | Chillum | 620 | 27,057(2.29%)#11 | 193,874(0.32%)#56 |
| 12. | Seabrook | 614 | 27,057(2.27%)#12 | 193,874(0.32%)#57 |
| 13. | Baltimore | 585 | 27,057(2.16%)#13 | 193,874(0.30%)#60 |
| 14. | Owings Mills | 507 | 27,057(1.87%)#14 | 193,874(0.26%)#69 |
| 15. | Columbia | 487 | 27,057(1.80%)#15 | 193,874(0.25%)#71 |
| 16. | Landover | 408 | 27,057(1.51%)#16 | 193,874(0.21%)#87 |
| 17. | Lanham | 403 | 27,057(1.49%)#17 | 193,874(0.21%)#91 |
| 18. | Lake Arbor | 380 | 27,057(1.40%)#18 | 193,874(0.20%)#100 |
| 19. | Maryland City | 367 | 27,057(1.36%)#19 | 193,874(0.19%)#105 |
| 20. | Mitchellville | 365 | 27,057(1.35%)#20 | 193,874(0.19%)#108 |
| 21. | Brock Hall | 360 | 27,057(1.33%)#21 | 193,874(0.19%)#110 |
| 22. | Aspen Hill | 350 | 27,057(1.29%)#22 | 193,874(0.18%)#113 |
| 23. | Montgomery Village | 344 | 27,057(1.27%)#23 | 193,874(0.18%)#116 |
| 24. | Clarksburg | 335 | 27,057(1.24%)#24 | 193,874(0.17%)#121 |
| 25. | Randallstown | 321 | 27,057(1.19%)#25 | 193,874(0.17%)#123 |
| 26. | Calverton | 295 | 27,057(1.09%)#26 | 193,874(0.15%)#134 |
| 27. | Bladensburg | 281 | 27,057(1.04%)#27 | 193,874(0.14%)#142 |
| 28. | Konterra | 277 | 27,057(1.02%)#28 | 193,874(0.14%)#144 |
| 29. | Woodlawn Cdp Baltimore County | 274 | 27,057(1.01%)#29 | 193,874(0.14%)#145 |
| 30. | Frederick | 261 | 27,057(0.96%)#30 | 193,874(0.13%)#153 |
| 31. | Lochearn | 261 | 27,057(0.96%)#31 | 193,874(0.13%)#154 |
| 32. | Takoma Park | 252 | 27,057(0.93%)#32 | 193,874(0.13%)#160 |
| 33. | Glenn Dale | 252 | 27,057(0.93%)#33 | 193,874(0.13%)#161 |
| 34. | Beltsville | 242 | 27,057(0.89%)#34 | 193,874(0.12%)#171 |
| 35. | Wheaton | 235 | 27,057(0.87%)#35 | 193,874(0.12%)#177 |
| 36. | Cedar Heights | 229 | 27,057(0.85%)#36 | 193,874(0.12%)#184 |
| 37. | East Riverdale | 219 | 27,057(0.81%)#37 | 193,874(0.11%)#190 |
| 38. | Kettering | 213 | 27,057(0.79%)#38 | 193,874(0.11%)#196 |
| 39. | Ballenger Creek | 205 | 27,057(0.76%)#39 | 193,874(0.11%)#200 |
| 40. | Brooklyn Park | 199 | 27,057(0.74%)#40 | 193,874(0.10%)#204 |
| 41. | Catonsville | 193 | 27,057(0.71%)#41 | 193,874(0.10%)#212 |
| 42. | Woodsboro | 180 | 27,057(0.67%)#42 | 193,874(0.09%)#224 |
| 43. | Waldorf | 178 | 27,057(0.66%)#43 | 193,874(0.09%)#226 |
| 44. | Burnt Mills | 168 | 27,057(0.62%)#44 | 193,874(0.09%)#234 |
| 45. | Mount Rainier | 163 | 27,057(0.60%)#45 | 193,874(0.08%)#239 |
| 46. | Glenmont | 161 | 27,057(0.60%)#46 | 193,874(0.08%)#242 |
| 47. | North Bethesda | 156 | 27,057(0.58%)#47 | 193,874(0.08%)#246 |
| 48. | Langley Park | 152 | 27,057(0.56%)#48 | 193,874(0.08%)#250 |
| 49. | Largo | 151 | 27,057(0.56%)#49 | 193,874(0.08%)#254 |
| 50. | Laurel | 149 | 27,057(0.55%)#50 | 193,874(0.08%)#259 |
| 51. | Rosaryville | 146 | 27,057(0.54%)#51 | 193,874(0.08%)#261 |
| 52. | Perry Hall | 141 | 27,057(0.52%)#52 | 193,874(0.07%)#268 |
| 53. | Hagerstown | 139 | 27,057(0.51%)#53 | 193,874(0.07%)#272 |
| 54. | Fairwood | 137 | 27,057(0.51%)#54 | 193,874(0.07%)#276 |
| 55. | Summerfield | 131 | 27,057(0.48%)#55 | 193,874(0.07%)#281 |
| 56. | Cloverly | 123 | 27,057(0.45%)#56 | 193,874(0.06%)#296 |
| 57. | Hillcrest Heights | 117 | 27,057(0.43%)#57 | 193,874(0.06%)#303 |
| 58. | Westphalia | 117 | 27,057(0.43%)#58 | 193,874(0.06%)#304 |
| 59. | District Heights | 117 | 27,057(0.43%)#59 | 193,874(0.06%)#305 |
| 60. | Brown Station | 117 | 27,057(0.43%)#60 | 193,874(0.06%)#306 |
| 61. | Friendly | 114 | 27,057(0.42%)#61 | 193,874(0.06%)#313 |
| 62. | Flower Hill | 109 | 27,057(0.40%)#62 | 193,874(0.06%)#324 |
| 63. | Hillandale | 109 | 27,057(0.40%)#63 | 193,874(0.06%)#325 |
| 64. | Redland | 98 | 27,057(0.36%)#64 | 193,874(0.05%)#351 |
| 65. | Layhill | 96 | 27,057(0.35%)#65 | 193,874(0.05%)#359 |
| 66. | Edgewood | 94 | 27,057(0.35%)#66 | 193,874(0.05%)#362 |
| 67. | Springdale | 93 | 27,057(0.34%)#67 | 193,874(0.05%)#365 |
| 68. | Burtonsville | 90 | 27,057(0.33%)#68 | 193,874(0.05%)#376 |
| 69. | Taneytown | 89 | 27,057(0.33%)#69 | 193,874(0.05%)#382 |
| 70. | Ellicott City | 86 | 27,057(0.32%)#70 | 193,874(0.04%)#392 |
| 71. | Brunswick | 85 | 27,057(0.31%)#71 | 193,874(0.04%)#396 |
| 72. | Parkville | 82 | 27,057(0.30%)#72 | 193,874(0.04%)#407 |
| 73. | Rockville | 78 | 27,057(0.29%)#73 | 193,874(0.04%)#421 |
| 74. | Hyattsville | 73 | 27,057(0.27%)#74 | 193,874(0.04%)#439 |
| 75. | Riverdale Park | 63 | 27,057(0.23%)#75 | 193,874(0.03%)#497 |
| 76. | Monrovia | 61 | 27,057(0.23%)#76 | 193,874(0.03%)#508 |
| 77. | Camp Springs | 59 | 27,057(0.22%)#77 | 193,874(0.03%)#512 |
| 78. | Carney | 58 | 27,057(0.21%)#78 | 193,874(0.03%)#519 |
| 79. | Honeygo | 55 | 27,057(0.20%)#79 | 193,874(0.03%)#536 |
| 80. | Owings | 55 | 27,057(0.20%)#80 | 193,874(0.03%)#540 |
| 81. | North Laurel | 54 | 27,057(0.20%)#81 | 193,874(0.03%)#544 |
| 82. | Marlton | 53 | 27,057(0.20%)#82 | 193,874(0.03%)#551 |
| 83. | Princess Anne | 53 | 27,057(0.20%)#83 | 193,874(0.03%)#552 |
| 84. | Queensland | 51 | 27,057(0.19%)#84 | 193,874(0.03%)#568 |
| 85. | Bethesda | 49 | 27,057(0.18%)#85 | 193,874(0.03%)#577 |
| 86. | Pasadena | 49 | 27,057(0.18%)#86 | 193,874(0.03%)#578 |
| 87. | Cheverly | 49 | 27,057(0.18%)#87 | 193,874(0.03%)#582 |
| 88. | Beaver Creek | 49 | 27,057(0.18%)#88 | 193,874(0.03%)#583 |
| 89. | Severn | 48 | 27,057(0.18%)#89 | 193,874(0.02%)#585 |
| 90. | College Park | 45 | 27,057(0.17%)#90 | 193,874(0.02%)#605 |
| 91. | Oxon Hill | 45 | 27,057(0.17%)#91 | 193,874(0.02%)#608 |
| 92. | Brentwood | 44 | 27,057(0.16%)#92 | 193,874(0.02%)#614 |
| 93. | Coral Hills | 43 | 27,057(0.16%)#93 | 193,874(0.02%)#625 |
| 94. | Forestville | 42 | 27,057(0.16%)#94 | 193,874(0.02%)#632 |
| 95. | Fairmount Heights | 41 | 27,057(0.15%)#95 | 193,874(0.02%)#642 |
| 96. | Four Corners | 39 | 27,057(0.14%)#96 | 193,874(0.02%)#664 |
| 97. | Olney | 38 | 27,057(0.14%)#97 | 193,874(0.02%)#671 |
| 98. | Eldersburg | 36 | 27,057(0.13%)#98 | 193,874(0.02%)#686 |
| 99. | Walker Mill | 33 | 27,057(0.12%)#99 | 193,874(0.02%)#720 |
| 100. | Jessup | 33 | 27,057(0.12%)#100 | 193,874(0.02%)#721 |
Common Questions
What are the Top 10 Cities with the Most Immigrants from Middle Africa in Maryland?
Top 10 Cities with the Most Immigrants from Middle Africa in Maryland are:
#1
1,392
#2
1,269
#3
1,064
#4
1,017
#5
956
#6
911
#7
702
#8
658
#9
647
#10
644
What city has the Most Immigrants from Middle Africa in Maryland?
White Oak has the Most Immigrants from Middle Africa in Maryland with 1,392.
What is the Total Immigrants from Middle Africa in the State of Maryland?
Total Immigrants from Middle Africa in Maryland is 27,057.
What is the Total Immigrants from Middle Africa in the United States?
Total Immigrants from Middle Africa in the United States is 193,874.