Easton, MD Map & Demographics
Easton Map
Easton Overview
$43,844
PER CAPITA INCOME
$102,776
AVG FAMILY INCOME
$75,198
AVG HOUSEHOLD INCOME
23.3%
WAGE / INCOME GAP [ % ]
76.7¢/ $1
WAGE / INCOME GAP [ $ ]
$7,895
FAMILY INCOME DEFICIT
0.48
INEQUALITY / GINI INDEX
17,118
TOTAL POPULATION
7,941
MALE POPULATION
9,177
FEMALE POPULATION
86.53
MALES / 100 FEMALES
115.56
FEMALES / 100 MALES
45.4
MEDIAN AGE
3.1
AVG FAMILY SIZE
2.3
AVG HOUSEHOLD SIZE
8,060
LABOR FORCE [ PEOPLE ]
58.5%
PERCENT IN LABOR FORCE
1.5%
UNEMPLOYMENT RATE
Easton Zip Codes
Income in Easton
Income Overview in Easton
Per Capita Income in Easton is $43,844, while median incomes of families and households are $102,776 and $75,198 respectively.
| Characteristic | Number | Measure |
| Per Capita Income | 17,118 | $43,844 |
| Median Family Income | 3,977 | $102,776 |
| Mean Family Income | 3,977 | $130,042 |
| Median Household Income | 7,195 | $75,198 |
| Mean Household Income | 7,195 | $100,189 |
| Income Deficit | 3,977 | $7,895 |
| Wage / Income Gap (%) | 17,118 | 23.32% |
| Wage / Income Gap ($) | 17,118 | 76.68¢ per $1 |
| Gini / Inequality Index | 17,118 | 0.48 |
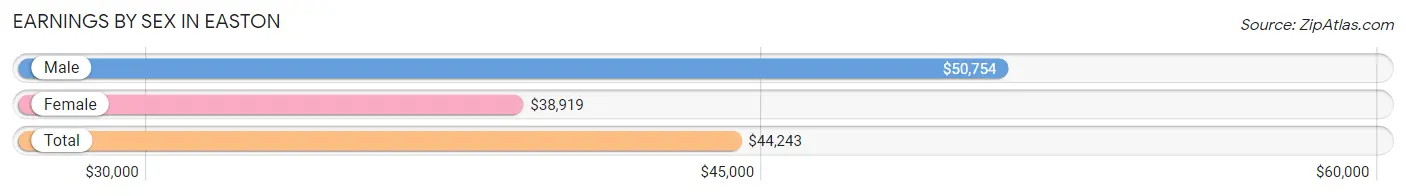
Earnings by Sex in Easton
Average Earnings in Easton are $44,243, $50,754 for men and $38,919 for women, a difference of 23.3%.
| Sex | Number | Average Earnings |
| Male | 4,229 (50.2%) | $50,754 |
| Female | 4,197 (49.8%) | $38,919 |
| Total | 8,426 (100.0%) | $44,243 |
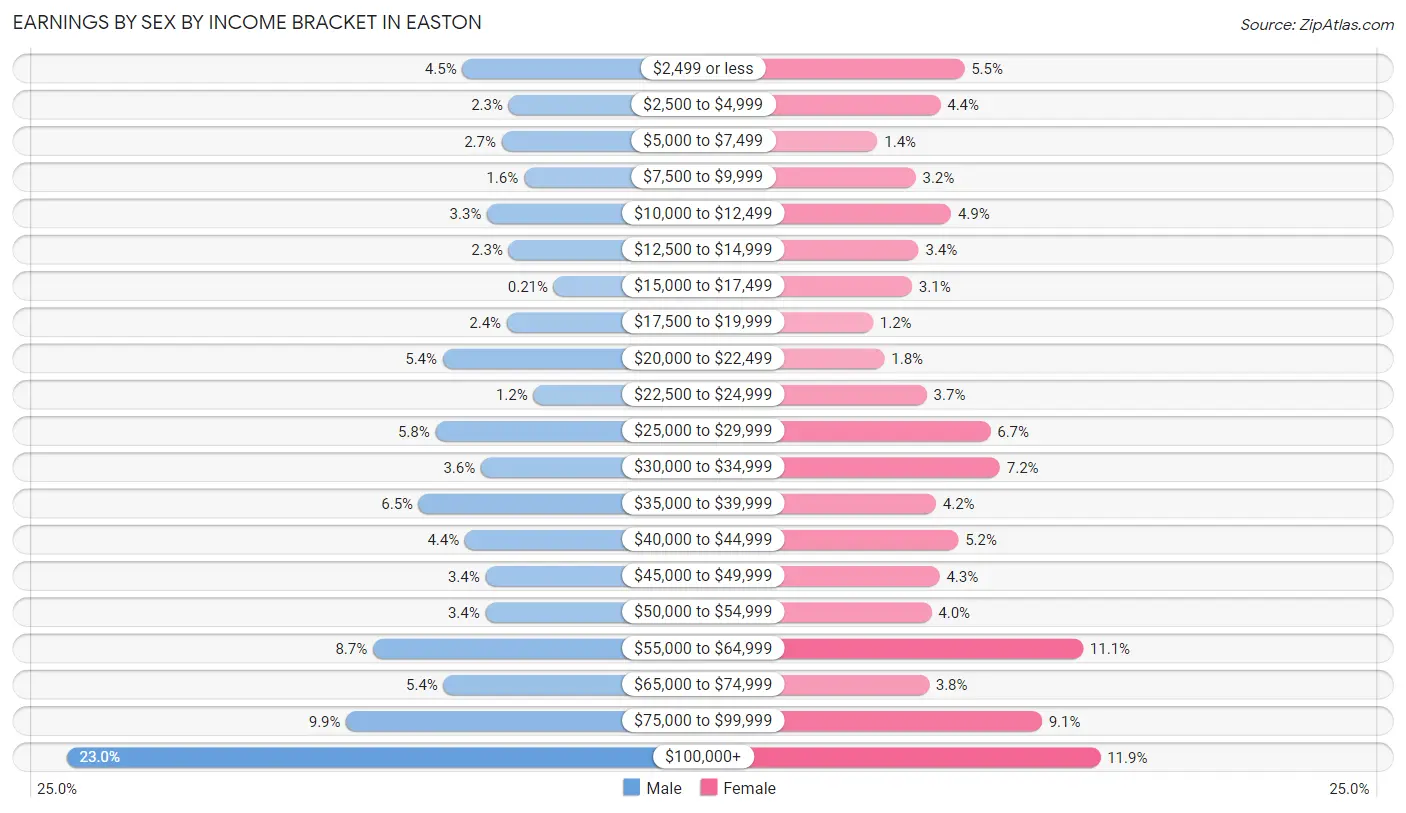
Earnings by Sex by Income Bracket in Easton
The most common earnings brackets in Easton are $100,000+ for men (974 | 23.0%) and $100,000+ for women (498 | 11.9%).
| Income | Male | Female |
| $2,499 or less | 190 (4.5%) | 231 (5.5%) |
| $2,500 to $4,999 | 98 (2.3%) | 184 (4.4%) |
| $5,000 to $7,499 | 112 (2.6%) | 60 (1.4%) |
| $7,500 to $9,999 | 68 (1.6%) | 135 (3.2%) |
| $10,000 to $12,499 | 141 (3.3%) | 205 (4.9%) |
| $12,500 to $14,999 | 98 (2.3%) | 141 (3.4%) |
| $15,000 to $17,499 | 9 (0.2%) | 128 (3.0%) |
| $17,500 to $19,999 | 102 (2.4%) | 51 (1.2%) |
| $20,000 to $22,499 | 229 (5.4%) | 74 (1.8%) |
| $22,500 to $24,999 | 49 (1.2%) | 157 (3.7%) |
| $25,000 to $29,999 | 243 (5.8%) | 282 (6.7%) |
| $30,000 to $34,999 | 153 (3.6%) | 301 (7.2%) |
| $35,000 to $39,999 | 276 (6.5%) | 175 (4.2%) |
| $40,000 to $44,999 | 185 (4.4%) | 219 (5.2%) |
| $45,000 to $49,999 | 144 (3.4%) | 182 (4.3%) |
| $50,000 to $54,999 | 144 (3.4%) | 166 (4.0%) |
| $55,000 to $64,999 | 367 (8.7%) | 464 (11.1%) |
| $65,000 to $74,999 | 227 (5.4%) | 161 (3.8%) |
| $75,000 to $99,999 | 420 (9.9%) | 383 (9.1%) |
| $100,000+ | 974 (23.0%) | 498 (11.9%) |
| Total | 4,229 (100.0%) | 4,197 (100.0%) |
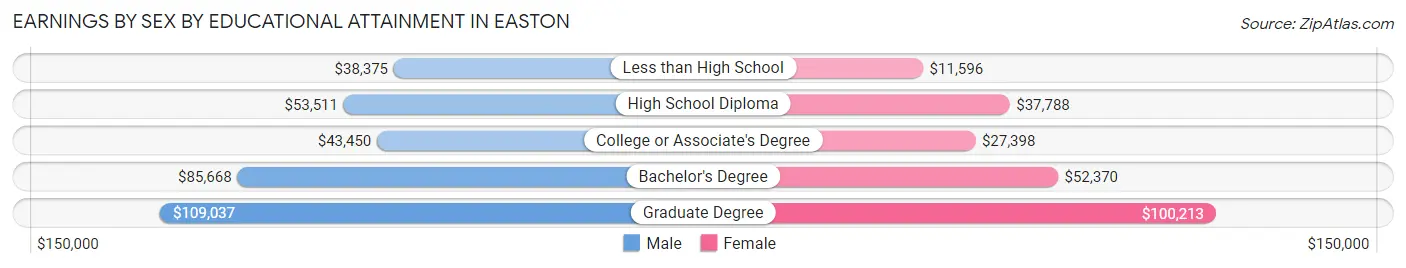
Earnings by Sex by Educational Attainment in Easton
Average earnings in Easton are $55,952 for men and $45,050 for women, a difference of 19.5%. Men with an educational attainment of graduate degree enjoy the highest average annual earnings of $109,037, while those with less than high school education earn the least with $38,375. Women with an educational attainment of graduate degree earn the most with the average annual earnings of $100,213, while those with less than high school education have the smallest earnings of $11,596.
| Educational Attainment | Male Income | Female Income |
| Less than High School | $38,375 | $11,596 |
| High School Diploma | $53,511 | $37,788 |
| College or Associate's Degree | $43,450 | $27,398 |
| Bachelor's Degree | $85,668 | $52,370 |
| Graduate Degree | $109,037 | $100,213 |
| Total | $55,952 | $45,050 |
Family Income in Easton
Family Income Brackets in Easton
According to the Easton family income data, there are 863 families falling into the $100,000 to $149,999 income range, which is the most common income bracket and makes up 21.7% of all families. Conversely, the less than $10,000 income bracket is the least frequent group with only 64 families (1.6%) belonging to this category.
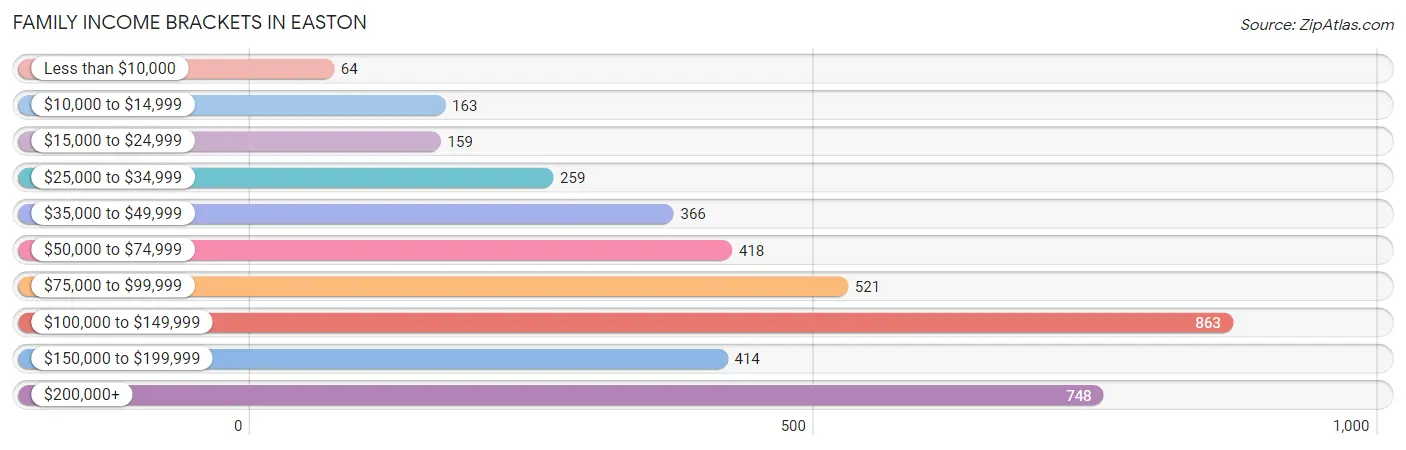
| Income Bracket | # Families | % Families |
| Less than $10,000 | 64 | 1.6% |
| $10,000 to $14,999 | 163 | 4.1% |
| $15,000 to $24,999 | 159 | 4.0% |
| $25,000 to $34,999 | 259 | 6.5% |
| $35,000 to $49,999 | 366 | 9.2% |
| $50,000 to $74,999 | 418 | 10.5% |
| $75,000 to $99,999 | 521 | 13.1% |
| $100,000 to $149,999 | 863 | 21.7% |
| $150,000 to $199,999 | 414 | 10.4% |
| $200,000+ | 748 | 18.8% |
Family Income by Famaliy Size in Easton
7+ person families (64 | 1.6%) account for the highest median family income in Easton with $250,001 per family, while 3-person families (832 | 20.9%) have the highest median income of $44,722 per family member.
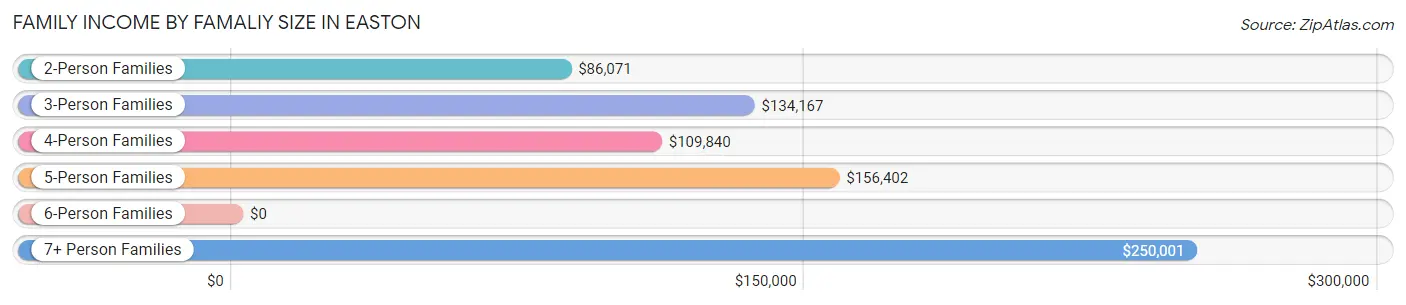
| Income Bracket | # Families | Median Income |
| 2-Person Families | 2,136 (53.7%) | $86,071 |
| 3-Person Families | 832 (20.9%) | $134,167 |
| 4-Person Families | 679 (17.1%) | $109,840 |
| 5-Person Families | 180 (4.5%) | $156,402 |
| 6-Person Families | 86 (2.2%) | $0 |
| 7+ Person Families | 64 (1.6%) | $250,001 |
| Total | 3,977 (100.0%) | $102,776 |
Family Income by Number of Earners in Easton
The median family income in Easton is $102,776, with families comprising 3+ earners (422) having the highest median family income of $168,571, while families with 1 earner (1,148) have the lowest median family income of $62,625, accounting for 10.6% and 28.9% of families, respectively.
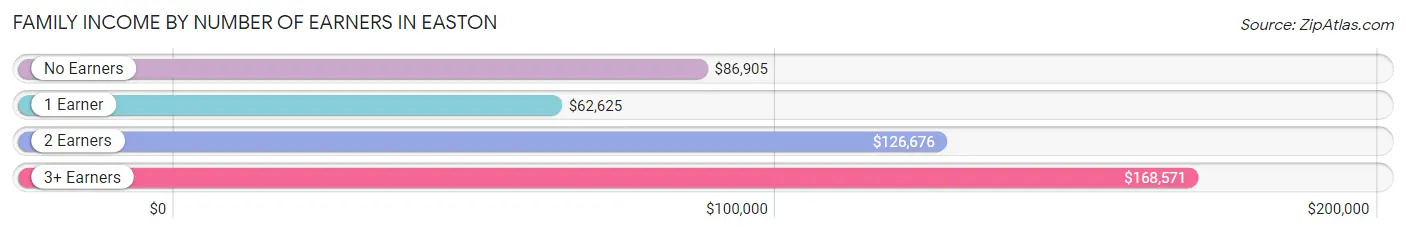
| Number of Earners | # Families | Median Income |
| No Earners | 886 (22.3%) | $86,905 |
| 1 Earner | 1,148 (28.9%) | $62,625 |
| 2 Earners | 1,521 (38.2%) | $126,676 |
| 3+ Earners | 422 (10.6%) | $168,571 |
| Total | 3,977 (100.0%) | $102,776 |
Household Income in Easton
Household Income Brackets in Easton
With 1,151 households falling in the category, the $100,000 to $149,999 income range is the most frequent in Easton, accounting for 16.0% of all households. In contrast, only 288 households (4.0%) fall into the $10,000 to $14,999 income bracket, making it the least populous group.
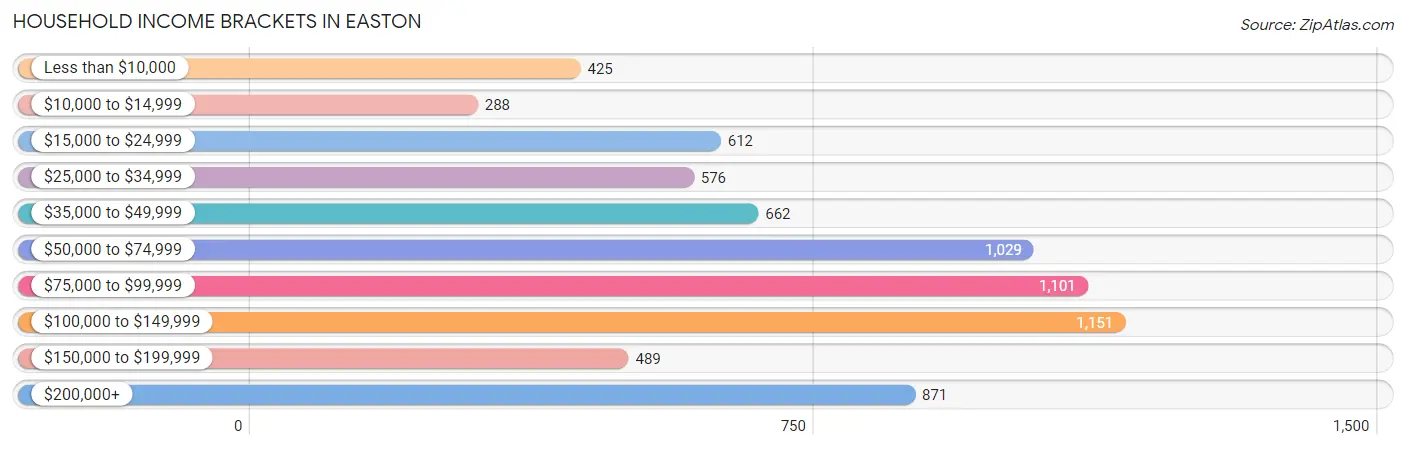
| Income Bracket | # Households | % Households |
| Less than $10,000 | 425 | 5.9% |
| $10,000 to $14,999 | 288 | 4.0% |
| $15,000 to $24,999 | 612 | 8.5% |
| $25,000 to $34,999 | 576 | 8.0% |
| $35,000 to $49,999 | 662 | 9.2% |
| $50,000 to $74,999 | 1,029 | 14.3% |
| $75,000 to $99,999 | 1,101 | 15.3% |
| $100,000 to $149,999 | 1,151 | 16.0% |
| $150,000 to $199,999 | 489 | 6.8% |
| $200,000+ | 871 | 12.1% |
Household Income by Householder Age in Easton
The median household income in Easton is $75,198, with the highest median household income of $101,500 found in the 15 to 24 years age bracket for the primary householder. A total of 98 households (1.4%) fall into this category. Meanwhile, the 65+ years age bracket for the primary householder has the lowest median household income of $65,476, with 2,804 households (39.0%) in this group.
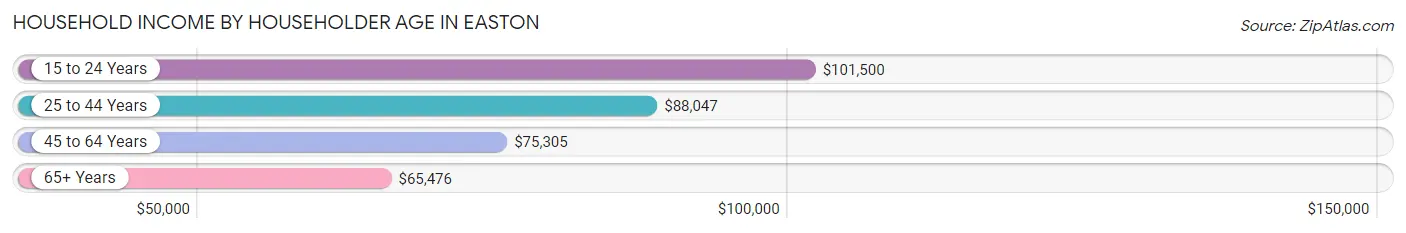
| Income Bracket | # Households | Median Income |
| 15 to 24 Years | 98 (1.4%) | $101,500 |
| 25 to 44 Years | 1,686 (23.4%) | $88,047 |
| 45 to 64 Years | 2,607 (36.2%) | $75,305 |
| 65+ Years | 2,804 (39.0%) | $65,476 |
| Total | 7,195 (100.0%) | $75,198 |
Poverty in Easton
Income Below Poverty by Sex and Age in Easton
With 10.6% poverty level for males and 12.3% for females among the residents of Easton, 12 to 14 year old males and 12 to 14 year old females are the most vulnerable to poverty, with 75 males (35.5%) and 33 females (23.2%) in their respective age groups living below the poverty level.
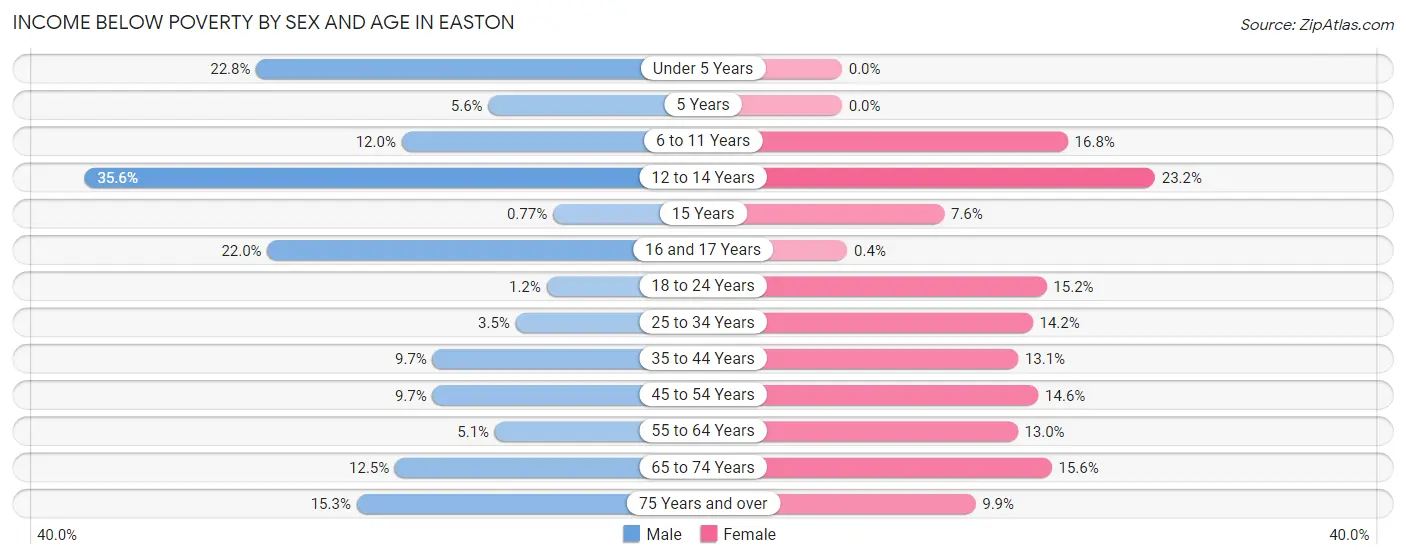
| Age Bracket | Male | Female |
| Under 5 Years | 114 (22.8%) | 0 (0.0%) |
| 5 Years | 4 (5.6%) | 0 (0.0%) |
| 6 to 11 Years | 116 (12.0%) | 84 (16.8%) |
| 12 to 14 Years | 75 (35.5%) | 33 (23.2%) |
| 15 Years | 1 (0.8%) | 6 (7.6%) |
| 16 and 17 Years | 29 (22.0%) | 1 (0.4%) |
| 18 to 24 Years | 4 (1.2%) | 77 (15.2%) |
| 25 to 34 Years | 43 (3.5%) | 148 (14.2%) |
| 35 to 44 Years | 71 (9.7%) | 119 (13.1%) |
| 45 to 54 Years | 76 (9.7%) | 170 (14.6%) |
| 55 to 64 Years | 49 (5.1%) | 139 (13.0%) |
| 65 to 74 Years | 105 (12.5%) | 154 (15.6%) |
| 75 Years and over | 143 (15.3%) | 156 (9.9%) |
| Total | 830 (10.6%) | 1,087 (12.3%) |
Income Above Poverty by Sex and Age in Easton
According to the poverty statistics in Easton, males aged 15 years and females aged under 5 years are the age groups that are most secure financially, with 99.2% of males and 100.0% of females in these age groups living above the poverty line.
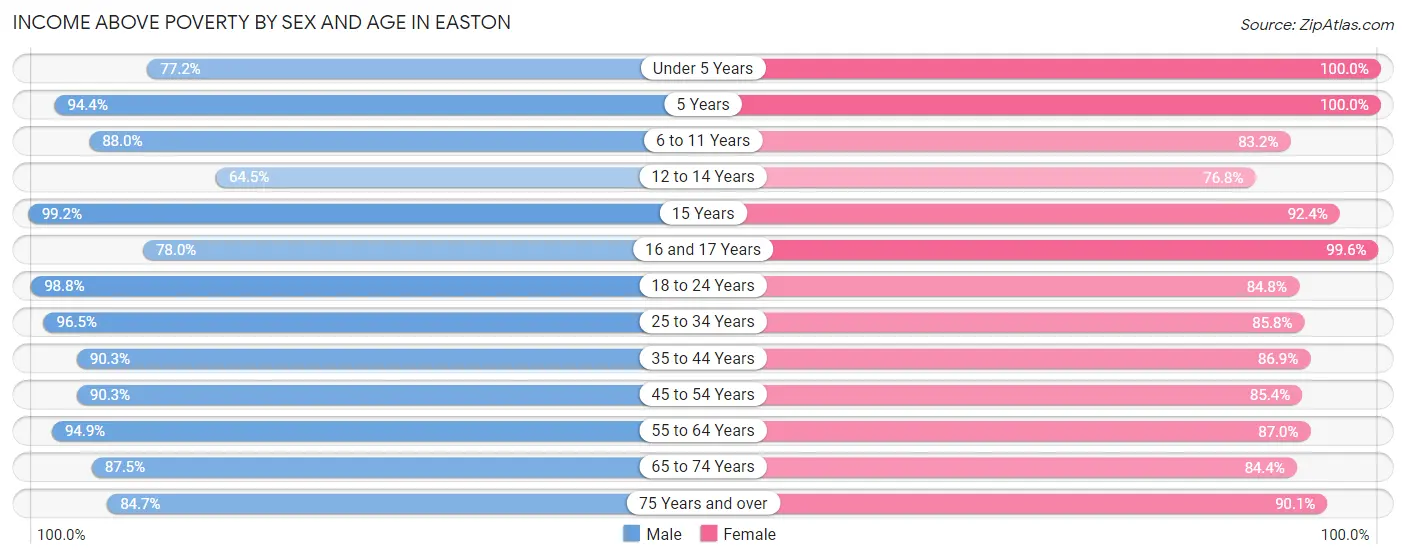
| Age Bracket | Male | Female |
| Under 5 Years | 386 (77.2%) | 368 (100.0%) |
| 5 Years | 68 (94.4%) | 244 (100.0%) |
| 6 to 11 Years | 851 (88.0%) | 417 (83.2%) |
| 12 to 14 Years | 136 (64.4%) | 109 (76.8%) |
| 15 Years | 129 (99.2%) | 73 (92.4%) |
| 16 and 17 Years | 103 (78.0%) | 251 (99.6%) |
| 18 to 24 Years | 319 (98.8%) | 430 (84.8%) |
| 25 to 34 Years | 1,170 (96.5%) | 897 (85.8%) |
| 35 to 44 Years | 661 (90.3%) | 791 (86.9%) |
| 45 to 54 Years | 707 (90.3%) | 996 (85.4%) |
| 55 to 64 Years | 916 (94.9%) | 927 (87.0%) |
| 65 to 74 Years | 736 (87.5%) | 835 (84.4%) |
| 75 Years and over | 789 (84.7%) | 1,418 (90.1%) |
| Total | 6,971 (89.4%) | 7,756 (87.7%) |
Income Below Poverty Among Married-Couple Families in Easton
The poverty statistics for married-couple families in Easton show that 2.0% or 57 of the total 2,898 families live below the poverty line. Families with 3 or 4 children have the highest poverty rate of 2.8%, comprising of 6 families. On the other hand, families with 5 or more children have the lowest poverty rate of 0.0%, which includes 0 families.
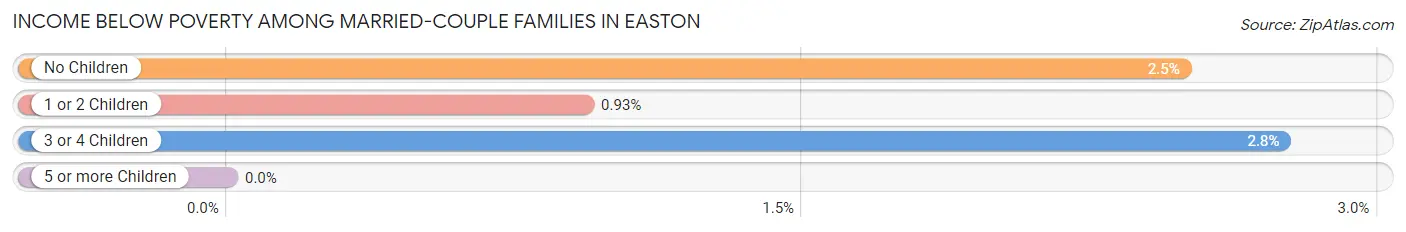
| Children | Above Poverty | Below Poverty |
| No Children | 1,645 (97.5%) | 42 (2.5%) |
| 1 or 2 Children | 958 (99.1%) | 9 (0.9%) |
| 3 or 4 Children | 212 (97.3%) | 6 (2.8%) |
| 5 or more Children | 26 (100.0%) | 0 (0.0%) |
| Total | 2,841 (98.0%) | 57 (2.0%) |
Income Below Poverty Among Single-Parent Households in Easton
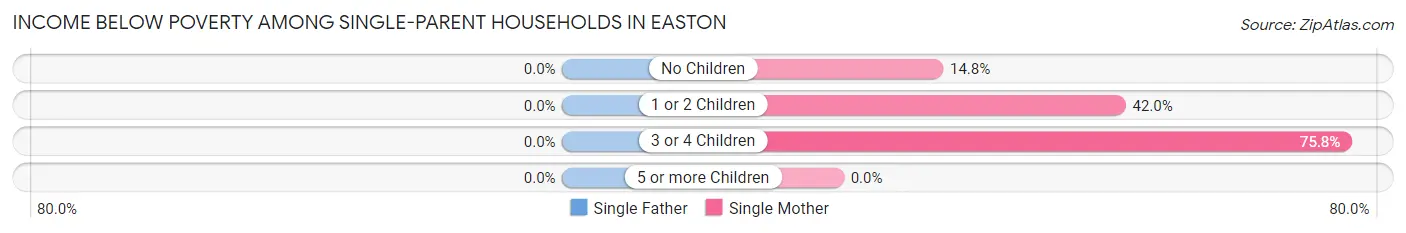
| Children | Single Father | Single Mother |
| No Children | 0 (0.0%) | 48 (14.8%) |
| 1 or 2 Children | 0 (0.0%) | 210 (42.0%) |
| 3 or 4 Children | 0 (0.0%) | 50 (75.8%) |
| 5 or more Children | 0 (0.0%) | 0 (0.0%) |
| Total | 0 (0.0%) | 308 (34.6%) |
Income Below Poverty Among Married-Couple vs Single-Parent Households in Easton
The poverty data for Easton shows that 57 of the married-couple family households (2.0%) and 308 of the single-parent households (28.5%) are living below the poverty level. Within the married-couple family households, those with 3 or 4 children have the highest poverty rate, with 6 households (2.8%) falling below the poverty line. Among the single-parent households, those with 3 or 4 children have the highest poverty rate, with 50 household (75.8%) living below poverty.
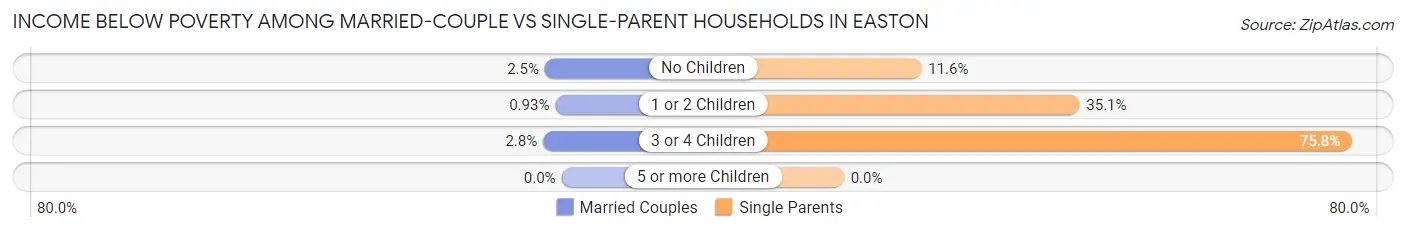
| Children | Married-Couple Families | Single-Parent Households |
| No Children | 42 (2.5%) | 48 (11.6%) |
| 1 or 2 Children | 9 (0.9%) | 210 (35.1%) |
| 3 or 4 Children | 6 (2.8%) | 50 (75.8%) |
| 5 or more Children | 0 (0.0%) | 0 (0.0%) |
| Total | 57 (2.0%) | 308 (28.5%) |
Race in Easton
The most populous races in Easton are White / Caucasian (11,972 | 69.9%), Black / African American (2,753 | 16.1%), and Hispanic or Latino (1,812 | 10.6%).
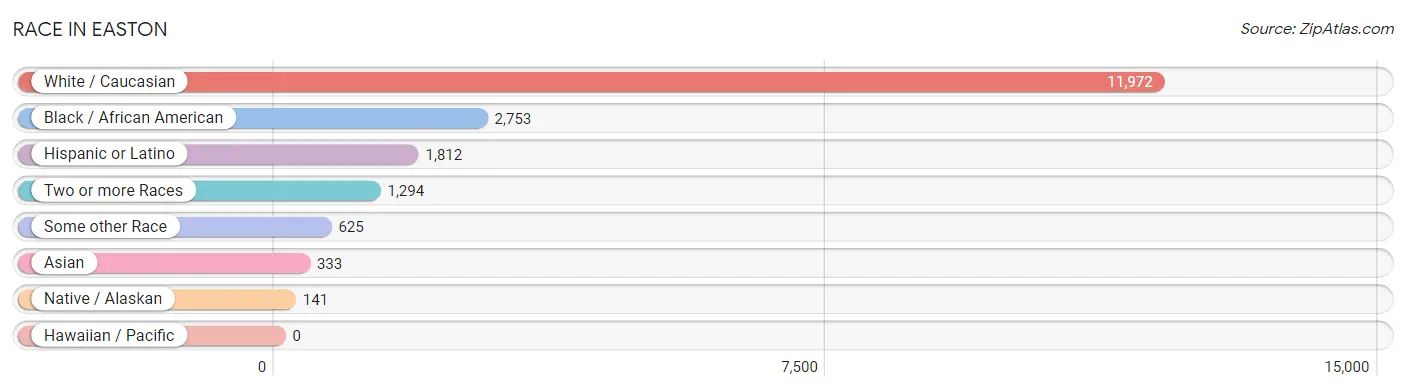
| Race | # Population | % Population |
| Asian | 333 | 1.9% |
| Black / African American | 2,753 | 16.1% |
| Hawaiian / Pacific | 0 | 0.0% |
| Hispanic or Latino | 1,812 | 10.6% |
| Native / Alaskan | 141 | 0.8% |
| White / Caucasian | 11,972 | 69.9% |
| Two or more Races | 1,294 | 7.6% |
| Some other Race | 625 | 3.6% |
| Total | 17,118 | 100.0% |
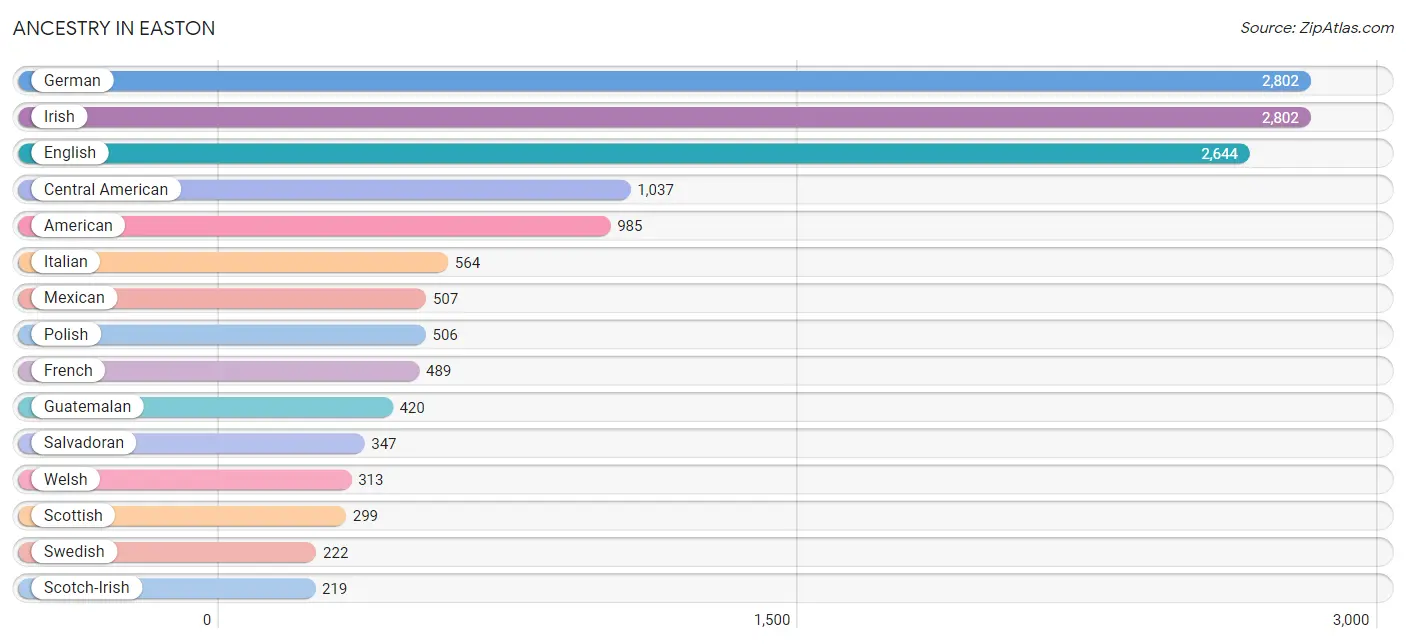
Ancestry in Easton
The most populous ancestries reported in Easton are German (2,802 | 16.4%), Irish (2,802 | 16.4%), English (2,644 | 15.4%), Central American (1,037 | 6.1%), and American (985 | 5.8%), together accounting for 60.0% of all Easton residents.
| Ancestry | # Population | % Population |
| Afghan | 27 | 0.2% |
| African | 49 | 0.3% |
| Alaska Native | 2 | 0.0% |
| American | 985 | 5.8% |
| Arab | 31 | 0.2% |
| Austrian | 52 | 0.3% |
| Belgian | 18 | 0.1% |
| Brazilian | 74 | 0.4% |
| British | 39 | 0.2% |
| Burmese | 21 | 0.1% |
| Canadian | 10 | 0.1% |
| Central American | 1,037 | 6.1% |
| Central American Indian | 50 | 0.3% |
| Cherokee | 32 | 0.2% |
| Costa Rican | 147 | 0.9% |
| Czech | 115 | 0.7% |
| Czechoslovakian | 28 | 0.2% |
| Danish | 23 | 0.1% |
| Dutch | 64 | 0.4% |
| Eastern European | 156 | 0.9% |
| Ecuadorian | 24 | 0.1% |
| English | 2,644 | 15.4% |
| European | 212 | 1.2% |
| French | 489 | 2.9% |
| French Canadian | 71 | 0.4% |
| German | 2,802 | 16.4% |
| Greek | 15 | 0.1% |
| Guatemalan | 420 | 2.5% |
| Haitian | 75 | 0.4% |
| Honduran | 123 | 0.7% |
| Hungarian | 21 | 0.1% |
| Indian (Asian) | 17 | 0.1% |
| Iranian | 31 | 0.2% |
| Irish | 2,802 | 16.4% |
| Italian | 564 | 3.3% |
| Jamaican | 32 | 0.2% |
| Korean | 175 | 1.0% |
| Lithuanian | 140 | 0.8% |
| Mexican | 507 | 3.0% |
| Navajo | 11 | 0.1% |
| Northern European | 136 | 0.8% |
| Norwegian | 133 | 0.8% |
| Pennsylvania German | 8 | 0.1% |
| Peruvian | 32 | 0.2% |
| Polish | 506 | 3.0% |
| Portuguese | 16 | 0.1% |
| Puerto Rican | 101 | 0.6% |
| Romanian | 49 | 0.3% |
| Russian | 131 | 0.8% |
| Salvadoran | 347 | 2.0% |
| Scandinavian | 19 | 0.1% |
| Scotch-Irish | 219 | 1.3% |
| Scottish | 299 | 1.8% |
| Seminole | 23 | 0.1% |
| Sierra Leonean | 4 | 0.0% |
| Slovak | 21 | 0.1% |
| South American | 79 | 0.5% |
| Sri Lankan | 41 | 0.2% |
| Subsaharan African | 53 | 0.3% |
| Swedish | 222 | 1.3% |
| Swiss | 28 | 0.2% |
| Thai | 118 | 0.7% |
| Ukrainian | 79 | 0.5% |
| Venezuelan | 23 | 0.1% |
| Welsh | 313 | 1.8% | View All 65 Rows |
Immigrants in Easton
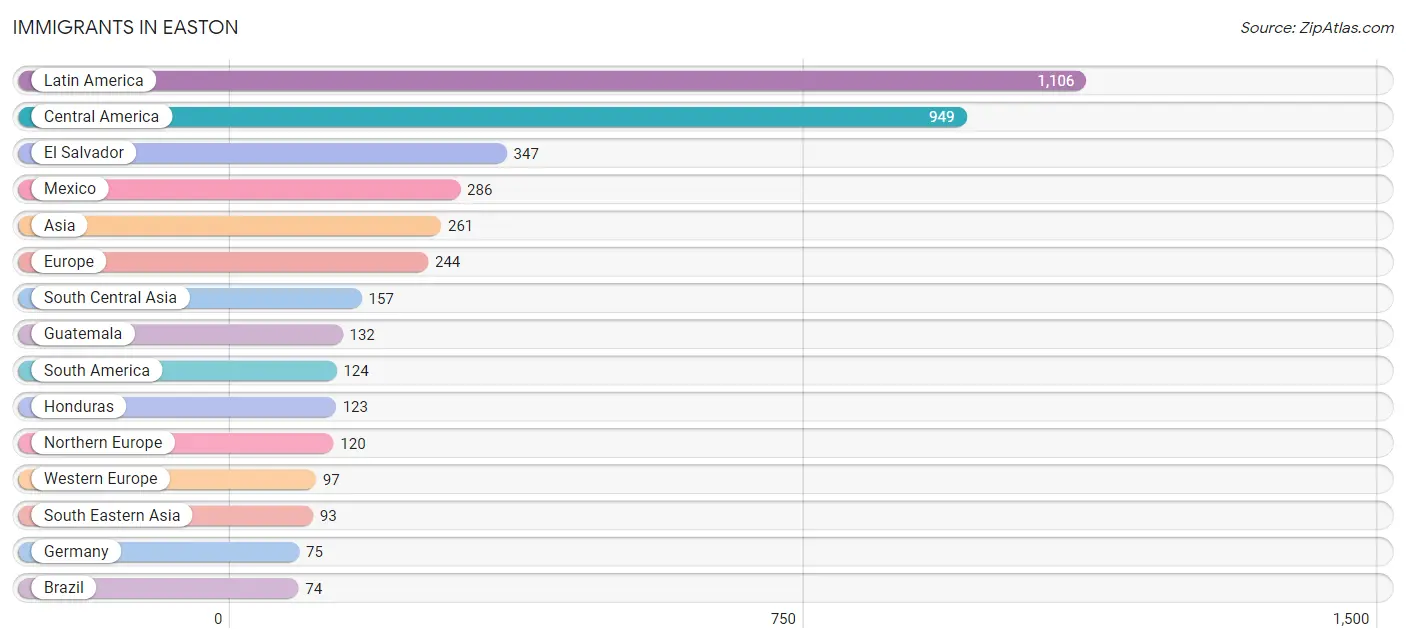
The most numerous immigrant groups reported in Easton came from Latin America (1,106 | 6.5%), Central America (949 | 5.5%), El Salvador (347 | 2.0%), Mexico (286 | 1.7%), and Asia (261 | 1.5%), together accounting for 17.2% of all Easton residents.
| Immigration Origin | # Population | % Population |
| Afghanistan | 10 | 0.1% |
| Africa | 4 | 0.0% |
| Asia | 261 | 1.5% |
| Austria | 11 | 0.1% |
| Bangladesh | 21 | 0.1% |
| Belgium | 11 | 0.1% |
| Brazil | 74 | 0.4% |
| Canada | 52 | 0.3% |
| Caribbean | 33 | 0.2% |
| Central America | 949 | 5.5% |
| China | 11 | 0.1% |
| Costa Rica | 61 | 0.4% |
| Czechoslovakia | 7 | 0.0% |
| Eastern Asia | 11 | 0.1% |
| Eastern Europe | 27 | 0.2% |
| Ecuador | 8 | 0.1% |
| El Salvador | 347 | 2.0% |
| England | 21 | 0.1% |
| Europe | 244 | 1.4% |
| Germany | 75 | 0.4% |
| Guatemala | 132 | 0.8% |
| Haiti | 33 | 0.2% |
| Honduras | 123 | 0.7% |
| India | 31 | 0.2% |
| Iran | 31 | 0.2% |
| Ireland | 14 | 0.1% |
| Latin America | 1,106 | 6.5% |
| Mexico | 286 | 1.7% |
| Northern Europe | 120 | 0.7% |
| Pakistan | 64 | 0.4% |
| Peru | 32 | 0.2% |
| Philippines | 72 | 0.4% |
| Russia | 20 | 0.1% |
| Sierra Leone | 4 | 0.0% |
| South America | 124 | 0.7% |
| South Central Asia | 157 | 0.9% |
| South Eastern Asia | 93 | 0.5% |
| Sweden | 52 | 0.3% |
| Venezuela | 10 | 0.1% |
| Vietnam | 21 | 0.1% |
| Western Africa | 4 | 0.0% |
| Western Europe | 97 | 0.6% | View All 42 Rows |
Sex and Age in Easton
Sex and Age in Easton
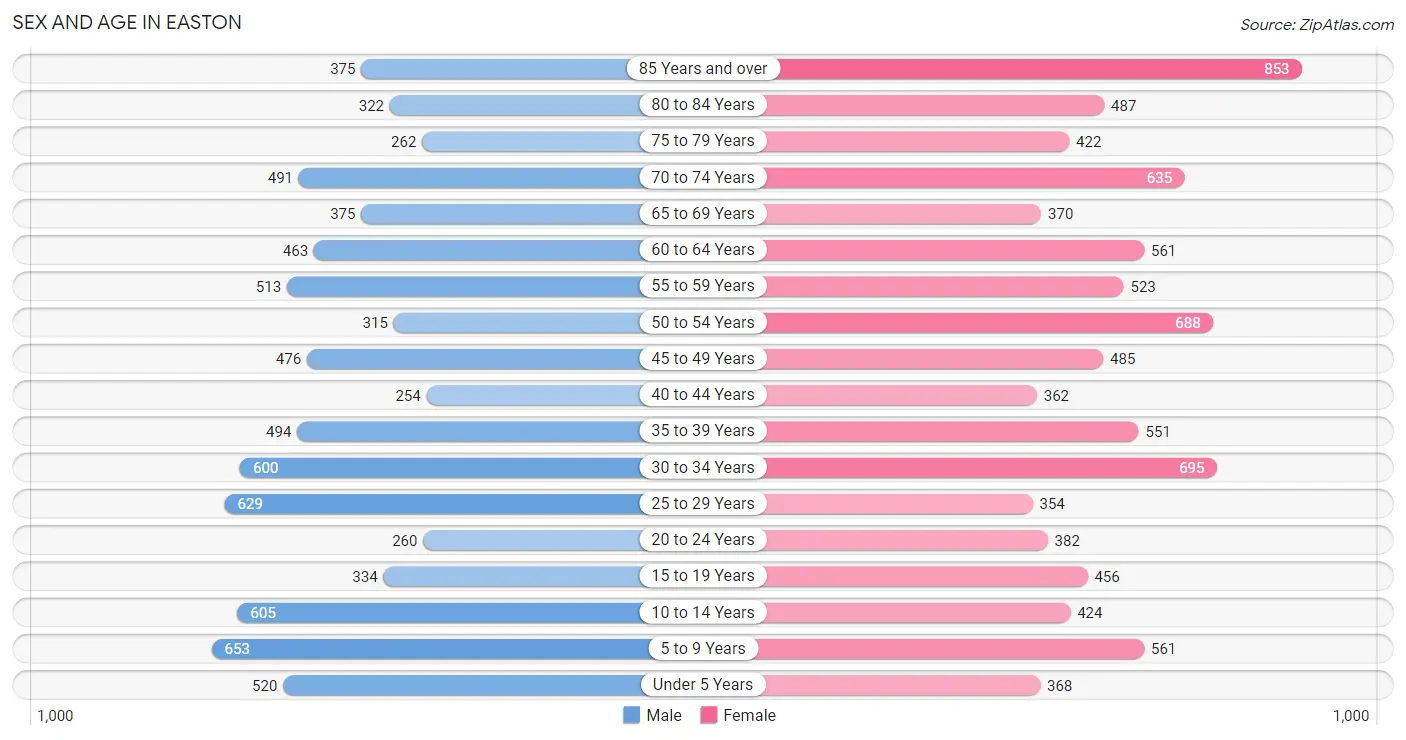
The most populous age groups in Easton are 5 to 9 Years (653 | 8.2%) for men and 85 Years and over (853 | 9.3%) for women.
| Age Bracket | Male | Female |
| Under 5 Years | 520 (6.6%) | 368 (4.0%) |
| 5 to 9 Years | 653 (8.2%) | 561 (6.1%) |
| 10 to 14 Years | 605 (7.6%) | 424 (4.6%) |
| 15 to 19 Years | 334 (4.2%) | 456 (5.0%) |
| 20 to 24 Years | 260 (3.3%) | 382 (4.2%) |
| 25 to 29 Years | 629 (7.9%) | 354 (3.9%) |
| 30 to 34 Years | 600 (7.6%) | 695 (7.6%) |
| 35 to 39 Years | 494 (6.2%) | 551 (6.0%) |
| 40 to 44 Years | 254 (3.2%) | 362 (3.9%) |
| 45 to 49 Years | 476 (6.0%) | 485 (5.3%) |
| 50 to 54 Years | 315 (4.0%) | 688 (7.5%) |
| 55 to 59 Years | 513 (6.5%) | 523 (5.7%) |
| 60 to 64 Years | 463 (5.8%) | 561 (6.1%) |
| 65 to 69 Years | 375 (4.7%) | 370 (4.0%) |
| 70 to 74 Years | 491 (6.2%) | 635 (6.9%) |
| 75 to 79 Years | 262 (3.3%) | 422 (4.6%) |
| 80 to 84 Years | 322 (4.1%) | 487 (5.3%) |
| 85 Years and over | 375 (4.7%) | 853 (9.3%) |
| Total | 7,941 (100.0%) | 9,177 (100.0%) |
Families and Households in Easton
Median Family Size in Easton
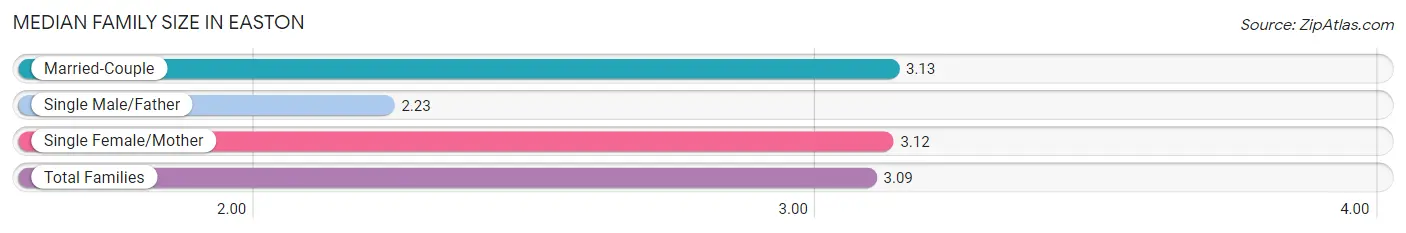
The median family size in Easton is 3.09 persons per family, with married-couple families (2,898 | 72.9%) accounting for the largest median family size of 3.13 persons per family. On the other hand, single male/father families (189 | 4.8%) represent the smallest median family size with 2.23 persons per family.
| Family Type | # Families | Family Size |
| Married-Couple | 2,898 (72.9%) | 3.13 |
| Single Male/Father | 189 (4.8%) | 2.23 |
| Single Female/Mother | 890 (22.4%) | 3.12 |
| Total Families | 3,977 (100.0%) | 3.09 |
Median Household Size in Easton
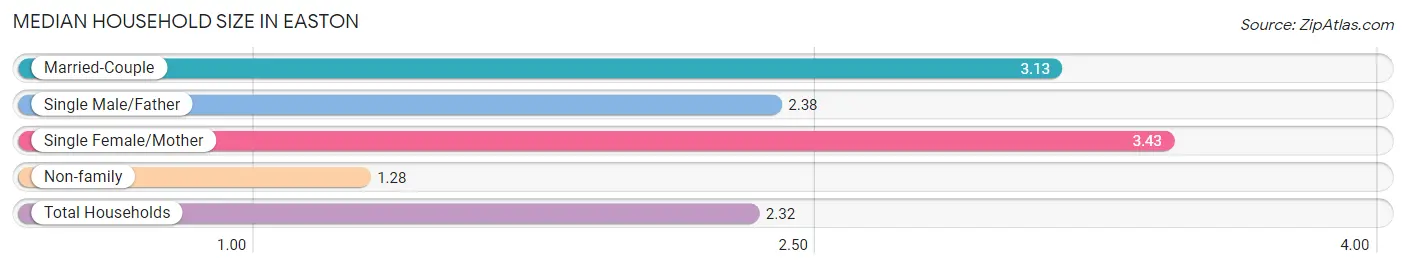
The median household size in Easton is 2.32 persons per household, with single female/mother households (890 | 12.4%) accounting for the largest median household size of 3.43 persons per household. non-family households (3,218 | 44.7%) represent the smallest median household size with 1.28 persons per household.
| Household Type | # Households | Household Size |
| Married-Couple | 2,898 (40.3%) | 3.13 |
| Single Male/Father | 189 (2.6%) | 2.38 |
| Single Female/Mother | 890 (12.4%) | 3.43 |
| Non-family | 3,218 (44.7%) | 1.28 |
| Total Households | 7,195 (100.0%) | 2.32 |
Household Size by Marriage Status in Easton
Out of a total of 7,195 households in Easton, 3,977 (55.3%) are family households, while 3,218 (44.7%) are nonfamily households. The most numerous type of family households are 2-person households, comprising 2,060, and the most common type of nonfamily households are 1-person households, comprising 2,755.
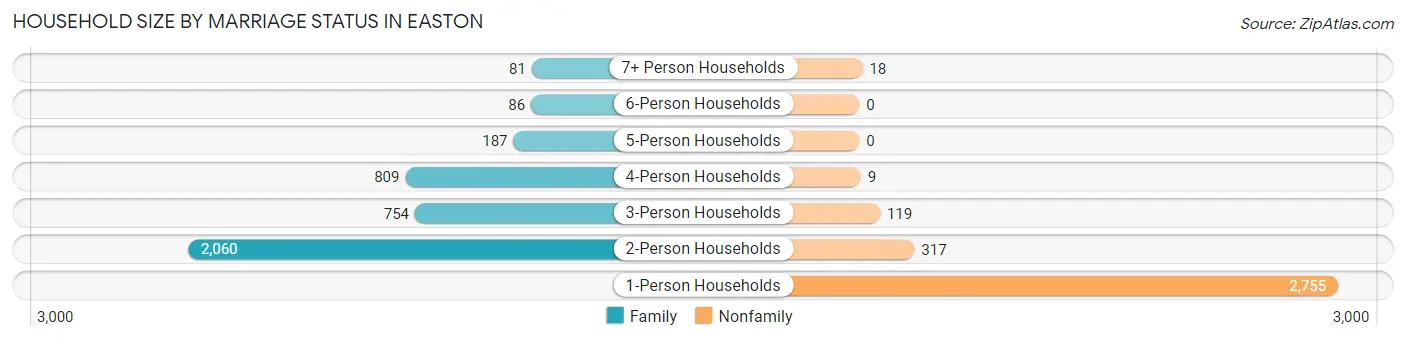
| Household Size | Family Households | Nonfamily Households |
| 1-Person Households | - | 2,755 (38.3%) |
| 2-Person Households | 2,060 (28.6%) | 317 (4.4%) |
| 3-Person Households | 754 (10.5%) | 119 (1.7%) |
| 4-Person Households | 809 (11.2%) | 9 (0.1%) |
| 5-Person Households | 187 (2.6%) | 0 (0.0%) |
| 6-Person Households | 86 (1.2%) | 0 (0.0%) |
| 7+ Person Households | 81 (1.1%) | 18 (0.3%) |
| Total | 3,977 (55.3%) | 3,218 (44.7%) |
Female Fertility in Easton
Fertility by Age in Easton
Average fertility rate in Easton is 125.0 births per 1,000 women. Women in the age bracket of 20 to 34 years have the highest fertility rate with 180.0 births per 1,000 women. Women in the age bracket of 20 to 34 years acount for 58.2% of all women with births.
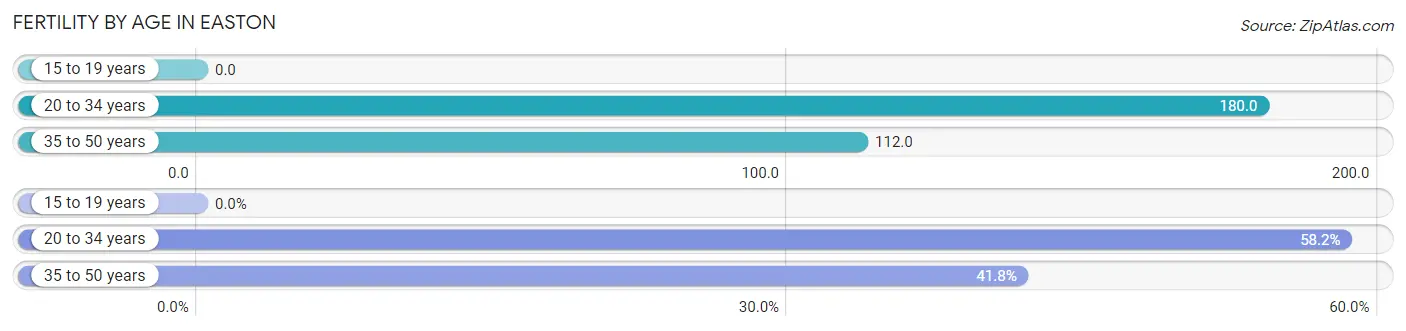
| Age Bracket | Women with Births | Births / 1,000 Women |
| 15 to 19 years | 0 (0.0%) | 0.0 |
| 20 to 34 years | 258 (58.2%) | 180.0 |
| 35 to 50 years | 185 (41.8%) | 112.0 |
| Total | 443 (100.0%) | 125.0 |
Fertility by Age by Marriage Status in Easton
73.4% of women with births (443) in Easton are married. The highest percentage of unmarried women with births falls into 35 to 50 years age bracket with 63.8% of them unmarried at the time of birth, while the lowest percentage of unmarried women with births belong to 20 to 34 years age bracket with 0.0% of them unmarried.
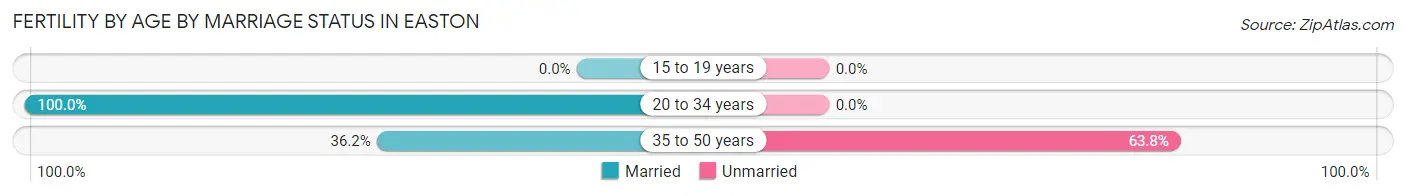
| Age Bracket | Married | Unmarried |
| 15 to 19 years | 0 (0.0%) | 0 (0.0%) |
| 20 to 34 years | 258 (100.0%) | 0 (0.0%) |
| 35 to 50 years | 67 (36.2%) | 118 (63.8%) |
| Total | 325 (73.4%) | 118 (26.6%) |
Fertility by Education in Easton
Average fertility rate in Easton is 125.0 births per 1,000 women. Women with the education attainment of college or associate's degree have the highest fertility rate of 265.0 births per 1,000 women, while women with the education attainment of less than high school have the lowest fertility at 11.0 births per 1,000 women. Women with the education attainment of college or associate's degree represent 71.8% of all women with births.
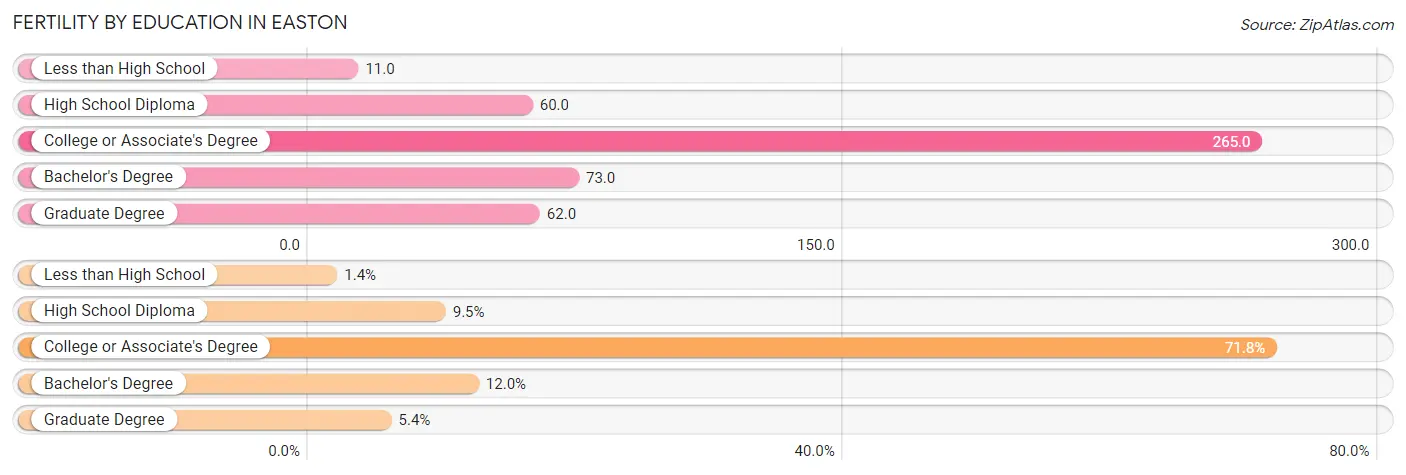
| Educational Attainment | Women with Births | Births / 1,000 Women |
| Less than High School | 6 (1.3%) | 11.0 |
| High School Diploma | 42 (9.5%) | 60.0 |
| College or Associate's Degree | 318 (71.8%) | 265.0 |
| Bachelor's Degree | 53 (12.0%) | 73.0 |
| Graduate Degree | 24 (5.4%) | 62.0 |
| Total | 443 (100.0%) | 125.0 |
Fertility by Education by Marriage Status in Easton
26.6% of women with births in Easton are unmarried. Women with the educational attainment of less than high school are most likely to be married with 100.0% of them married at childbirth, while women with the educational attainment of college or associate's degree are least likely to be married with 37.1% of them unmarried at childbirth.
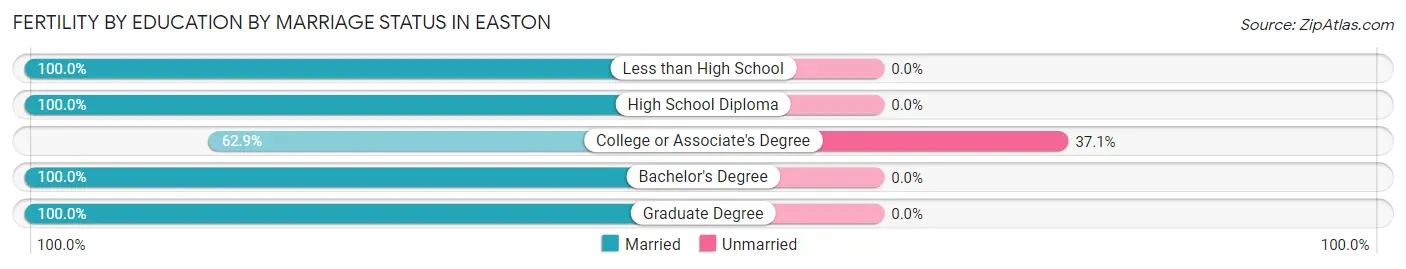
| Educational Attainment | Married | Unmarried |
| Less than High School | 6 (100.0%) | 0 (0.0%) |
| High School Diploma | 42 (100.0%) | 0 (0.0%) |
| College or Associate's Degree | 200 (62.9%) | 118 (37.1%) |
| Bachelor's Degree | 53 (100.0%) | 0 (0.0%) |
| Graduate Degree | 24 (100.0%) | 0 (0.0%) |
| Total | 325 (73.4%) | 118 (26.6%) |
Employment Characteristics in Easton
Employment by Class of Employer in Easton
Among the 7,827 employed individuals in Easton, private company employees (5,060 | 64.6%), not-for-profit organizations (752 | 9.6%), and self-employed (not incorporated) (513 | 6.6%) make up the most common classes of employment.
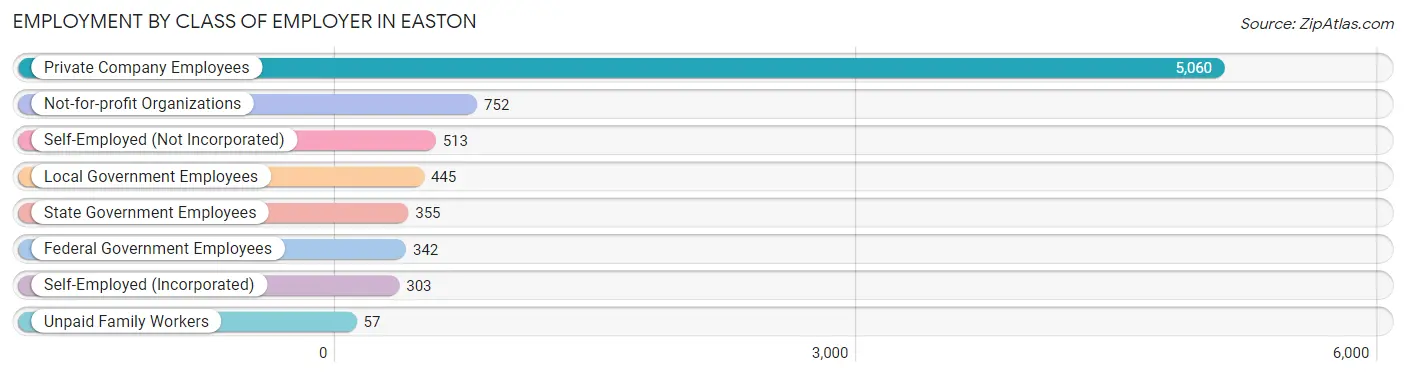
| Employer Class | # Employees | % Employees |
| Private Company Employees | 5,060 | 64.6% |
| Self-Employed (Incorporated) | 303 | 3.9% |
| Self-Employed (Not Incorporated) | 513 | 6.6% |
| Not-for-profit Organizations | 752 | 9.6% |
| Local Government Employees | 445 | 5.7% |
| State Government Employees | 355 | 4.5% |
| Federal Government Employees | 342 | 4.4% |
| Unpaid Family Workers | 57 | 0.7% |
| Total | 7,827 | 100.0% |
Employment Status by Age in Easton
According to the labor force statistics for Easton, out of the total population over 16 years of age (13,778), 58.5% or 8,060 individuals are in the labor force, with 1.5% or 121 of them unemployed. The age group with the highest labor force participation rate is 45 to 54 years, with 89.4% or 1,756 individuals in the labor force. Within the labor force, the 75 years and over age range has the highest percentage of unemployed individuals, with 4.3% or 8 of them being unemployed.
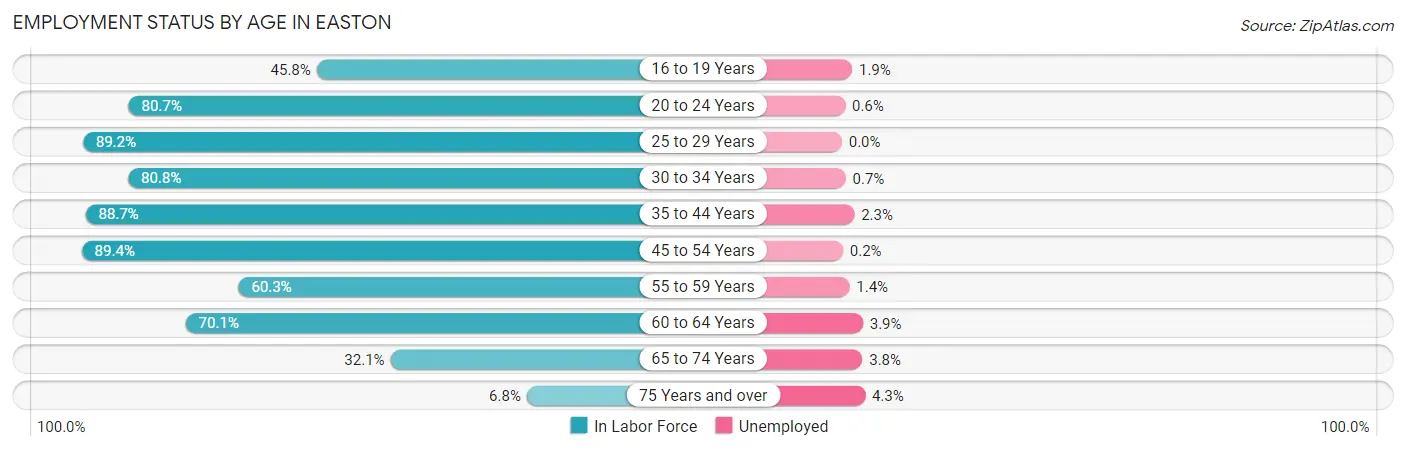
| Age Bracket | In Labor Force | Unemployed |
| 16 to 19 Years | 266 (45.8%) | 5 (1.9%) |
| 20 to 24 Years | 518 (80.7%) | 3 (0.6%) |
| 25 to 29 Years | 877 (89.2%) | 0 (0.0%) |
| 30 to 34 Years | 1,046 (80.8%) | 7 (0.7%) |
| 35 to 44 Years | 1,473 (88.7%) | 34 (2.3%) |
| 45 to 54 Years | 1,756 (89.4%) | 4 (0.2%) |
| 55 to 59 Years | 625 (60.3%) | 9 (1.4%) |
| 60 to 64 Years | 718 (70.1%) | 28 (3.9%) |
| 65 to 74 Years | 601 (32.1%) | 23 (3.8%) |
| 75 Years and over | 185 (6.8%) | 8 (4.3%) |
| Total | 8,060 (58.5%) | 121 (1.5%) |
Employment Status by Educational Attainment in Easton
According to labor force statistics for Easton, 81.6% of individuals (6,498) out of the total population between 25 and 64 years of age (7,963) are in the labor force, with 1.3% or 84 of them being unemployed. The group with the highest labor force participation rate are those with the educational attainment of bachelor's degree or higher, with 87.1% or 2,494 individuals in the labor force. Within the labor force, individuals with less than high school education have the highest percentage of unemployment, with 3.9% or 23 of them being unemployed.
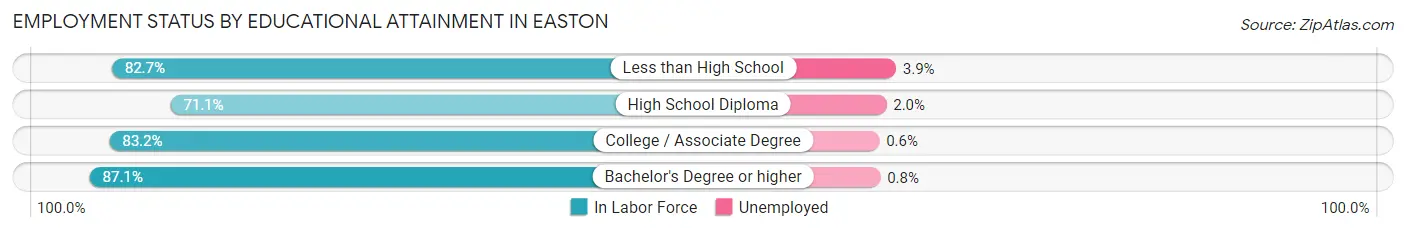
| Educational Attainment | In Labor Force | Unemployed |
| Less than High School | 592 (82.7%) | 28 (3.9%) |
| High School Diploma | 1,401 (71.1%) | 39 (2.0%) |
| College / Associate Degree | 2,008 (83.2%) | 14 (0.6%) |
| Bachelor's Degree or higher | 2,494 (87.1%) | 23 (0.8%) |
| Total | 6,498 (81.6%) | 104 (1.3%) |
Employment Occupations by Sex in Easton
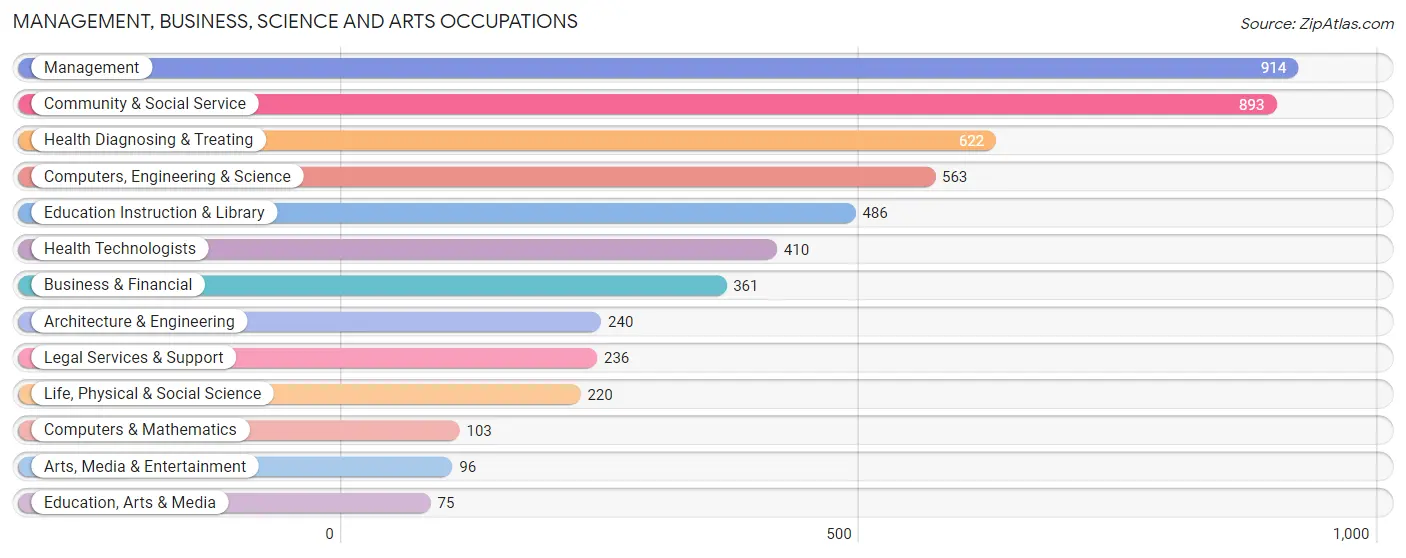
Management, Business, Science and Arts Occupations
The most common Management, Business, Science and Arts occupations in Easton are Management (914 | 11.6%), Community & Social Service (893 | 11.3%), Health Diagnosing & Treating (622 | 7.9%), Computers, Engineering & Science (563 | 7.1%), and Education Instruction & Library (486 | 6.1%).
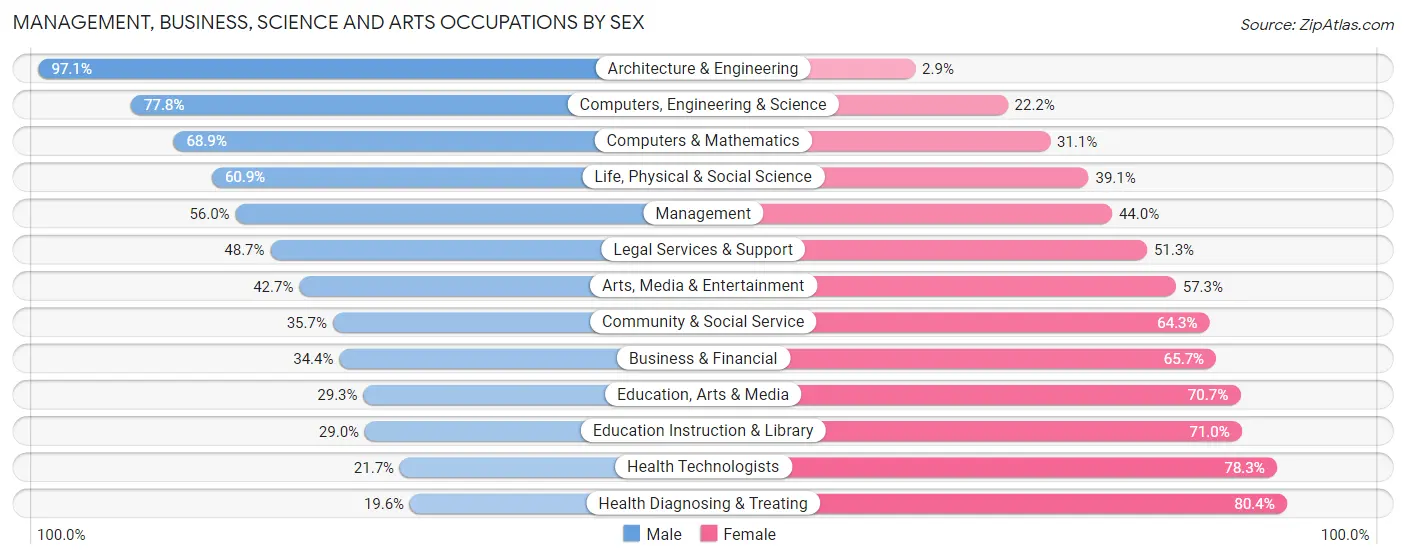
Management, Business, Science and Arts Occupations by Sex
Within the Management, Business, Science and Arts occupations in Easton, the most male-oriented occupations are Architecture & Engineering (97.1%), Computers, Engineering & Science (77.8%), and Computers & Mathematics (68.9%), while the most female-oriented occupations are Health Diagnosing & Treating (80.4%), Health Technologists (78.3%), and Education Instruction & Library (71.0%).
| Occupation | Male | Female |
| Management | 512 (56.0%) | 402 (44.0%) |
| Business & Financial | 124 (34.4%) | 237 (65.6%) |
| Computers, Engineering & Science | 438 (77.8%) | 125 (22.2%) |
| Computers & Mathematics | 71 (68.9%) | 32 (31.1%) |
| Architecture & Engineering | 233 (97.1%) | 7 (2.9%) |
| Life, Physical & Social Science | 134 (60.9%) | 86 (39.1%) |
| Community & Social Service | 319 (35.7%) | 574 (64.3%) |
| Education, Arts & Media | 22 (29.3%) | 53 (70.7%) |
| Legal Services & Support | 115 (48.7%) | 121 (51.3%) |
| Education Instruction & Library | 141 (29.0%) | 345 (71.0%) |
| Arts, Media & Entertainment | 41 (42.7%) | 55 (57.3%) |
| Health Diagnosing & Treating | 122 (19.6%) | 500 (80.4%) |
| Health Technologists | 89 (21.7%) | 321 (78.3%) |
| Total (Category) | 1,515 (45.2%) | 1,838 (54.8%) |
| Total (Overall) | 3,987 (50.4%) | 3,920 (49.6%) |
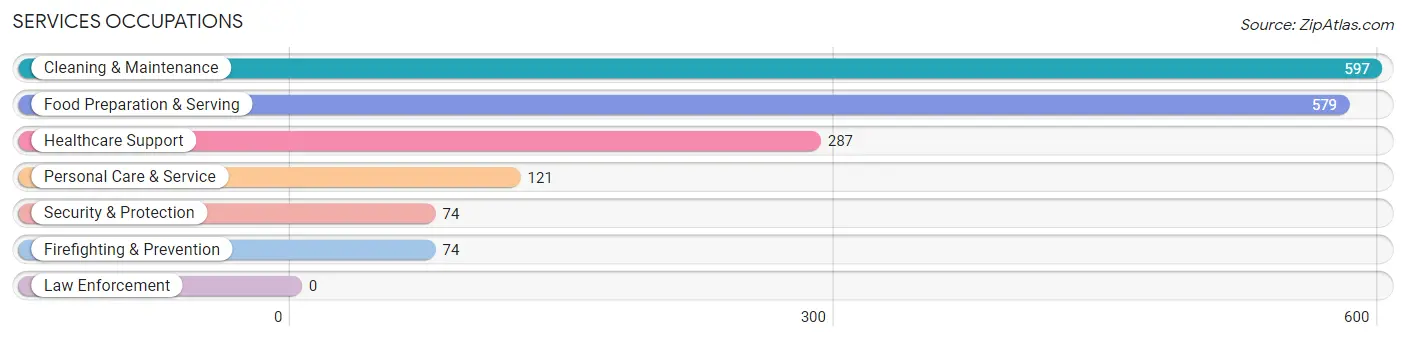
Services Occupations
The most common Services occupations in Easton are Cleaning & Maintenance (597 | 7.5%), Food Preparation & Serving (579 | 7.3%), Healthcare Support (287 | 3.6%), Personal Care & Service (121 | 1.5%), and Security & Protection (74 | 0.9%).
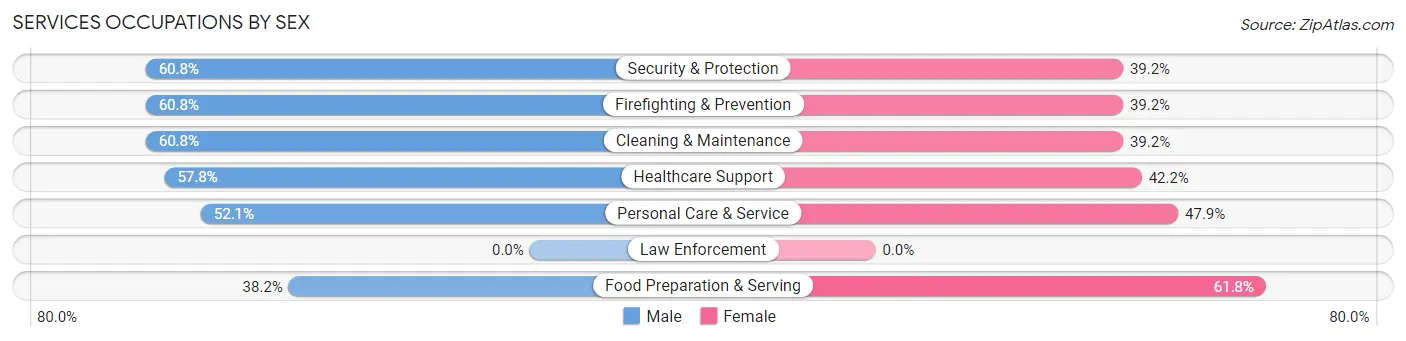
Services Occupations by Sex
Within the Services occupations in Easton, the most male-oriented occupations are Security & Protection (60.8%), Firefighting & Prevention (60.8%), and Cleaning & Maintenance (60.8%), while the most female-oriented occupations are Food Preparation & Serving (61.8%), Personal Care & Service (47.9%), and Healthcare Support (42.2%).
| Occupation | Male | Female |
| Healthcare Support | 166 (57.8%) | 121 (42.2%) |
| Security & Protection | 45 (60.8%) | 29 (39.2%) |
| Firefighting & Prevention | 45 (60.8%) | 29 (39.2%) |
| Law Enforcement | 0 (0.0%) | 0 (0.0%) |
| Food Preparation & Serving | 221 (38.2%) | 358 (61.8%) |
| Cleaning & Maintenance | 363 (60.8%) | 234 (39.2%) |
| Personal Care & Service | 63 (52.1%) | 58 (47.9%) |
| Total (Category) | 858 (51.7%) | 800 (48.2%) |
| Total (Overall) | 3,987 (50.4%) | 3,920 (49.6%) |
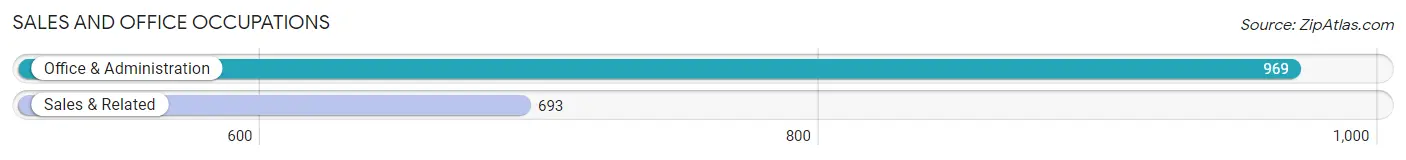
Sales and Office Occupations
The most common Sales and Office occupations in Easton are Office & Administration (969 | 12.2%), and Sales & Related (693 | 8.8%).
Sales and Office Occupations by Sex
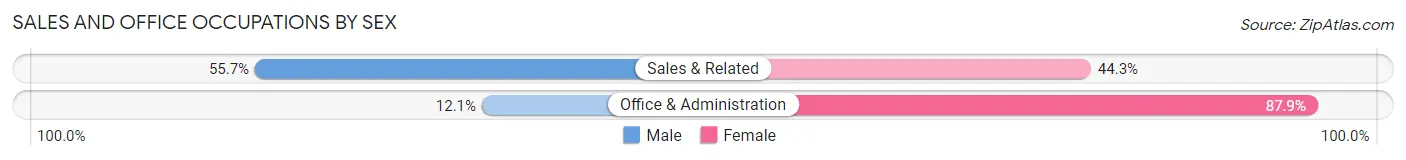
| Occupation | Male | Female |
| Sales & Related | 386 (55.7%) | 307 (44.3%) |
| Office & Administration | 117 (12.1%) | 852 (87.9%) |
| Total (Category) | 503 (30.3%) | 1,159 (69.7%) |
| Total (Overall) | 3,987 (50.4%) | 3,920 (49.6%) |
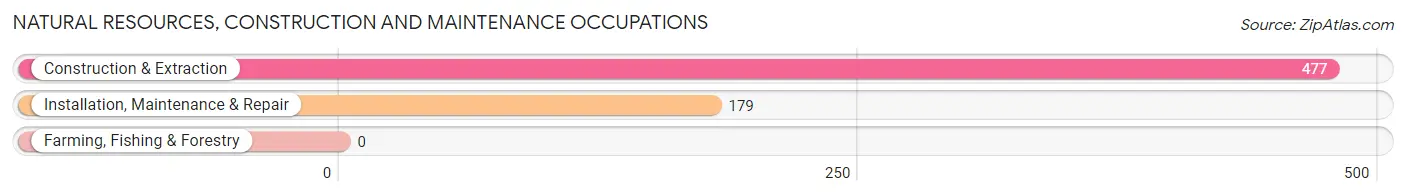
Natural Resources, Construction and Maintenance Occupations
The most common Natural Resources, Construction and Maintenance occupations in Easton are Construction & Extraction (477 | 6.0%), and Installation, Maintenance & Repair (179 | 2.3%).
Natural Resources, Construction and Maintenance Occupations by Sex
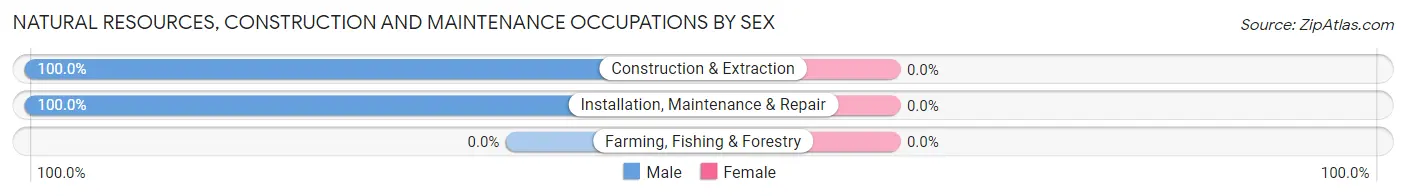
| Occupation | Male | Female |
| Farming, Fishing & Forestry | 0 (0.0%) | 0 (0.0%) |
| Construction & Extraction | 477 (100.0%) | 0 (0.0%) |
| Installation, Maintenance & Repair | 179 (100.0%) | 0 (0.0%) |
| Total (Category) | 656 (100.0%) | 0 (0.0%) |
| Total (Overall) | 3,987 (50.4%) | 3,920 (49.6%) |
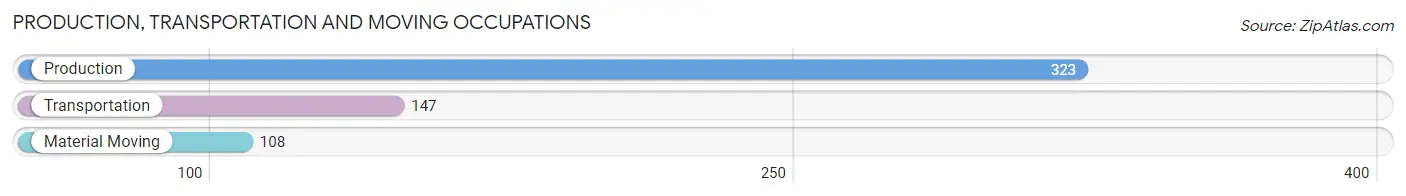
Production, Transportation and Moving Occupations
The most common Production, Transportation and Moving occupations in Easton are Production (323 | 4.1%), Transportation (147 | 1.9%), and Material Moving (108 | 1.4%).
Production, Transportation and Moving Occupations by Sex
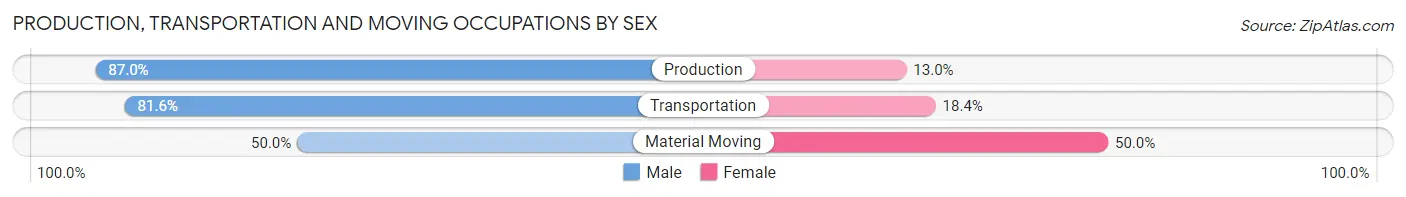
| Occupation | Male | Female |
| Production | 281 (87.0%) | 42 (13.0%) |
| Transportation | 120 (81.6%) | 27 (18.4%) |
| Material Moving | 54 (50.0%) | 54 (50.0%) |
| Total (Category) | 455 (78.7%) | 123 (21.3%) |
| Total (Overall) | 3,987 (50.4%) | 3,920 (49.6%) |
Employment Industries by Sex in Easton
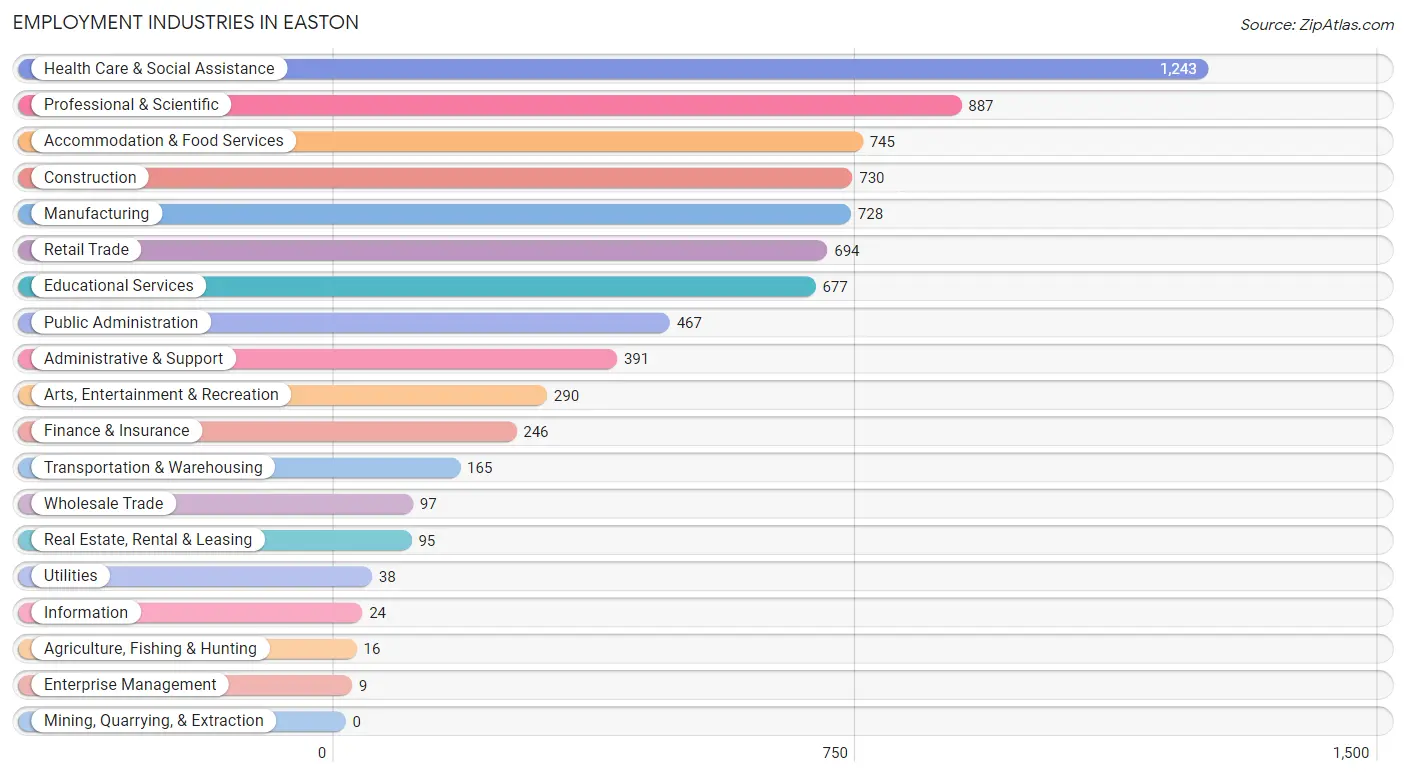
Employment Industries in Easton
The major employment industries in Easton include Health Care & Social Assistance (1,243 | 15.7%), Professional & Scientific (887 | 11.2%), Accommodation & Food Services (745 | 9.4%), Construction (730 | 9.2%), and Manufacturing (728 | 9.2%).
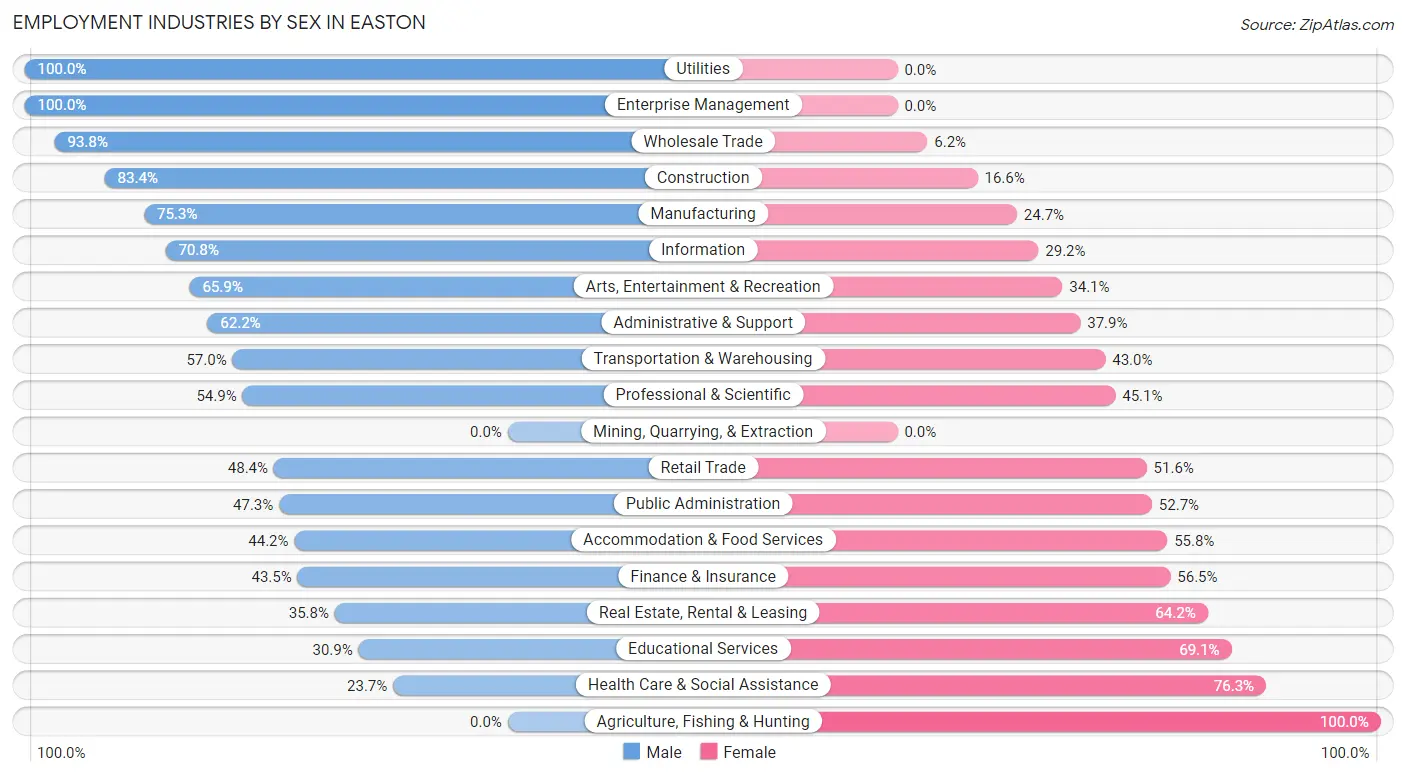
Employment Industries by Sex in Easton
The Easton industries that see more men than women are Utilities (100.0%), Enterprise Management (100.0%), and Wholesale Trade (93.8%), whereas the industries that tend to have a higher number of women are Agriculture, Fishing & Hunting (100.0%), Health Care & Social Assistance (76.3%), and Educational Services (69.1%).
| Industry | Male | Female |
| Agriculture, Fishing & Hunting | 0 (0.0%) | 16 (100.0%) |
| Mining, Quarrying, & Extraction | 0 (0.0%) | 0 (0.0%) |
| Construction | 609 (83.4%) | 121 (16.6%) |
| Manufacturing | 548 (75.3%) | 180 (24.7%) |
| Wholesale Trade | 91 (93.8%) | 6 (6.2%) |
| Retail Trade | 336 (48.4%) | 358 (51.6%) |
| Transportation & Warehousing | 94 (57.0%) | 71 (43.0%) |
| Utilities | 38 (100.0%) | 0 (0.0%) |
| Information | 17 (70.8%) | 7 (29.2%) |
| Finance & Insurance | 107 (43.5%) | 139 (56.5%) |
| Real Estate, Rental & Leasing | 34 (35.8%) | 61 (64.2%) |
| Professional & Scientific | 487 (54.9%) | 400 (45.1%) |
| Enterprise Management | 9 (100.0%) | 0 (0.0%) |
| Administrative & Support | 243 (62.2%) | 148 (37.9%) |
| Educational Services | 209 (30.9%) | 468 (69.1%) |
| Health Care & Social Assistance | 295 (23.7%) | 948 (76.3%) |
| Arts, Entertainment & Recreation | 191 (65.9%) | 99 (34.1%) |
| Accommodation & Food Services | 329 (44.2%) | 416 (55.8%) |
| Public Administration | 221 (47.3%) | 246 (52.7%) |
| Total | 3,987 (50.4%) | 3,920 (49.6%) |
Education in Easton
School Enrollment in Easton
The most common levels of schooling among the 3,698 students in Easton are elementary school (868 | 23.5%), middle school (868 | 23.5%), and college / undergraduate (709 | 19.2%).
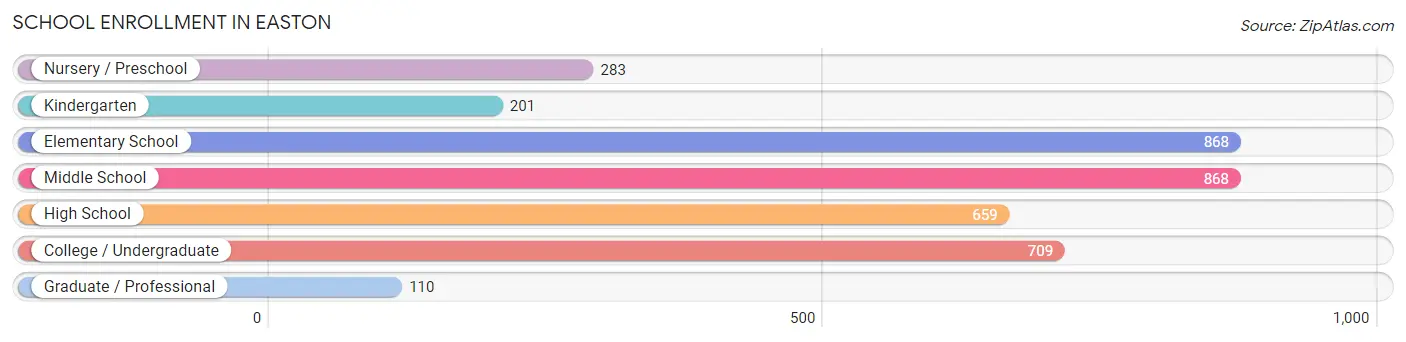
| School Level | # Students | % Students |
| Nursery / Preschool | 283 | 7.6% |
| Kindergarten | 201 | 5.4% |
| Elementary School | 868 | 23.5% |
| Middle School | 868 | 23.5% |
| High School | 659 | 17.8% |
| College / Undergraduate | 709 | 19.2% |
| Graduate / Professional | 110 | 3.0% |
| Total | 3,698 | 100.0% |
School Enrollment by Age by Funding Source in Easton
Out of a total of 3,698 students who are enrolled in schools in Easton, 799 (21.6%) attend a private institution, while the remaining 2,899 (78.4%) are enrolled in public schools. The age group of 20 to 24 year olds has the highest likelihood of being enrolled in private schools, with 128 (47.4% in the age bracket) enrolled. Conversely, the age group of 25 to 34 year olds has the lowest likelihood of being enrolled in a private school, with 163 (100.0% in the age bracket) attending a public institution.
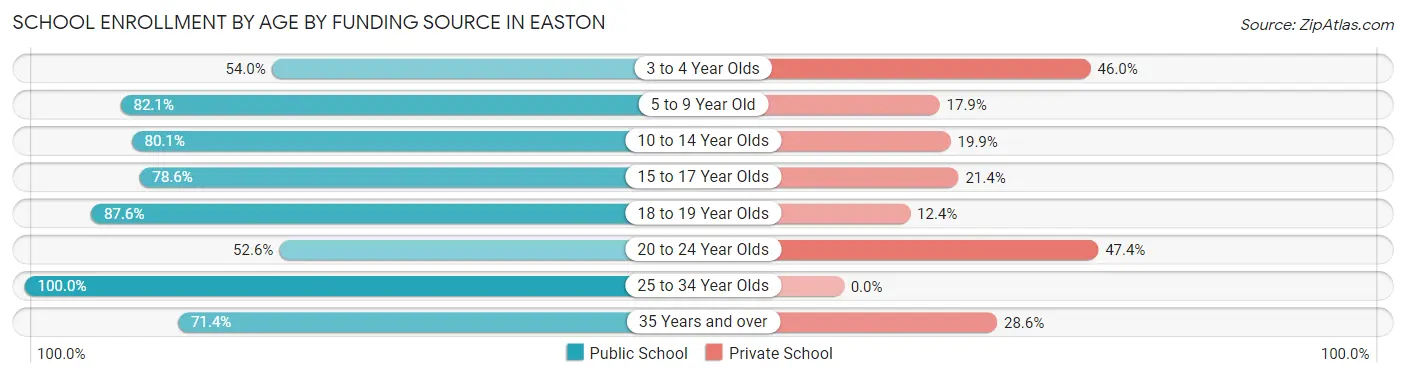
| Age Bracket | Public School | Private School |
| 3 to 4 Year Olds | 54 (54.0%) | 46 (46.0%) |
| 5 to 9 Year Old | 910 (82.1%) | 198 (17.9%) |
| 10 to 14 Year Olds | 824 (80.1%) | 205 (19.9%) |
| 15 to 17 Year Olds | 441 (78.6%) | 120 (21.4%) |
| 18 to 19 Year Olds | 170 (87.6%) | 24 (12.4%) |
| 20 to 24 Year Olds | 142 (52.6%) | 128 (47.4%) |
| 25 to 34 Year Olds | 163 (100.0%) | 0 (0.0%) |
| 35 Years and over | 195 (71.4%) | 78 (28.6%) |
| Total | 2,899 (78.4%) | 799 (21.6%) |
Educational Attainment by Field of Study in Easton
Business (803 | 14.8%), education (733 | 13.5%), science & technology (491 | 9.1%), literature & languages (483 | 8.9%), and liberal arts & history (475 | 8.8%) are the most common fields of study among 5,416 individuals in Easton who have obtained a bachelor's degree or higher.
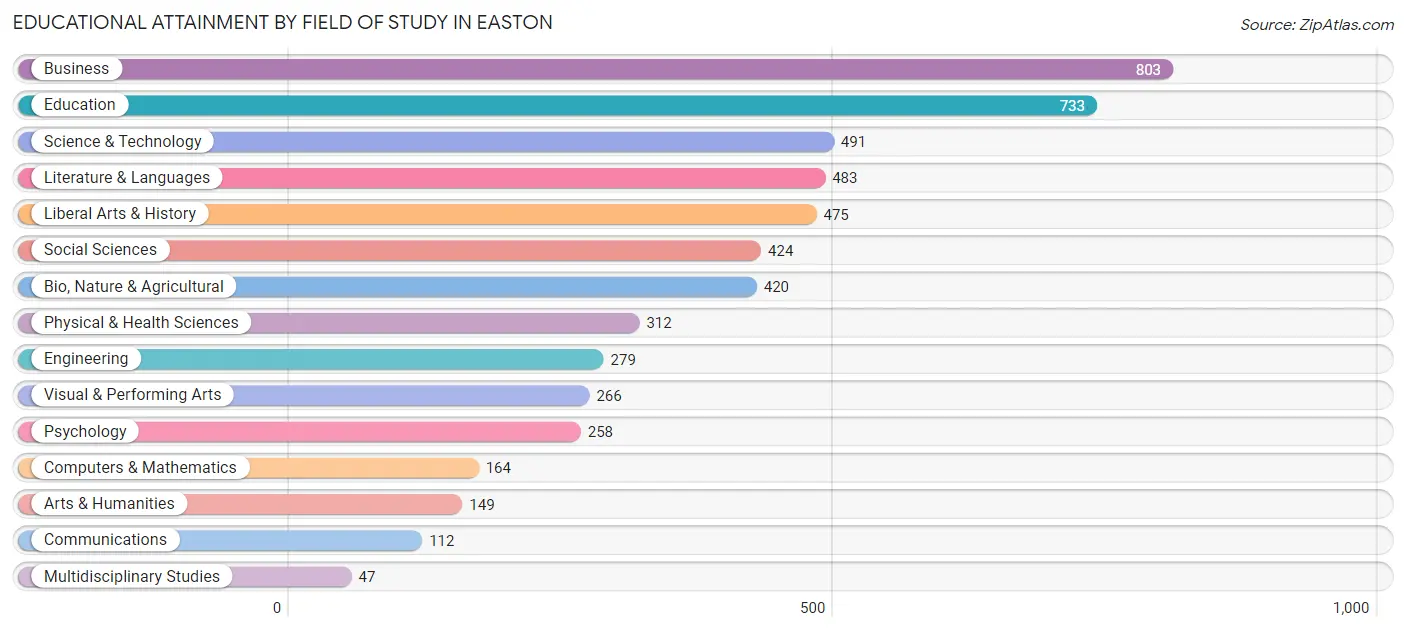
| Field of Study | # Graduates | % Graduates |
| Computers & Mathematics | 164 | 3.0% |
| Bio, Nature & Agricultural | 420 | 7.7% |
| Physical & Health Sciences | 312 | 5.8% |
| Psychology | 258 | 4.8% |
| Social Sciences | 424 | 7.8% |
| Engineering | 279 | 5.1% |
| Multidisciplinary Studies | 47 | 0.9% |
| Science & Technology | 491 | 9.1% |
| Business | 803 | 14.8% |
| Education | 733 | 13.5% |
| Literature & Languages | 483 | 8.9% |
| Liberal Arts & History | 475 | 8.8% |
| Visual & Performing Arts | 266 | 4.9% |
| Communications | 112 | 2.1% |
| Arts & Humanities | 149 | 2.8% |
| Total | 5,416 | 100.0% |
Transportation & Commute in Easton
Vehicle Availability by Sex in Easton
The most prevalent vehicle ownership categories in Easton are males with 2 vehicles (1,804, accounting for 45.5%) and females with 2 vehicles (1,473, making up 46.8%).
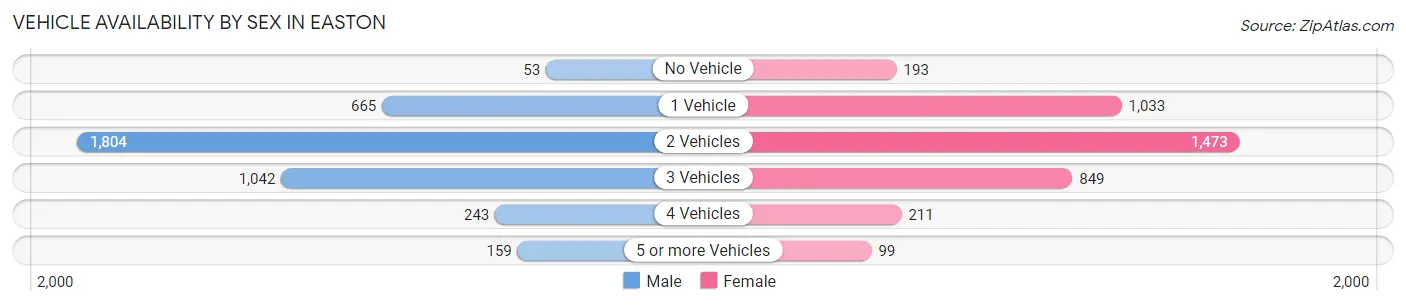
| Vehicles Available | Male | Female |
| No Vehicle | 53 (1.3%) | 193 (5.0%) |
| 1 Vehicle | 665 (16.8%) | 1,033 (26.8%) |
| 2 Vehicles | 1,804 (45.5%) | 1,473 (38.2%) |
| 3 Vehicles | 1,042 (26.3%) | 849 (22.0%) |
| 4 Vehicles | 243 (6.1%) | 211 (5.5%) |
| 5 or more Vehicles | 159 (4.0%) | 99 (2.6%) |
| Total | 3,966 (100.0%) | 3,858 (100.0%) |
Commute Time in Easton
The most frequently occuring commute durations in Easton are 5 to 9 minutes (1,413 commuters, 20.7%), 10 to 14 minutes (1,377 commuters, 20.2%), and 15 to 19 minutes (793 commuters, 11.6%).
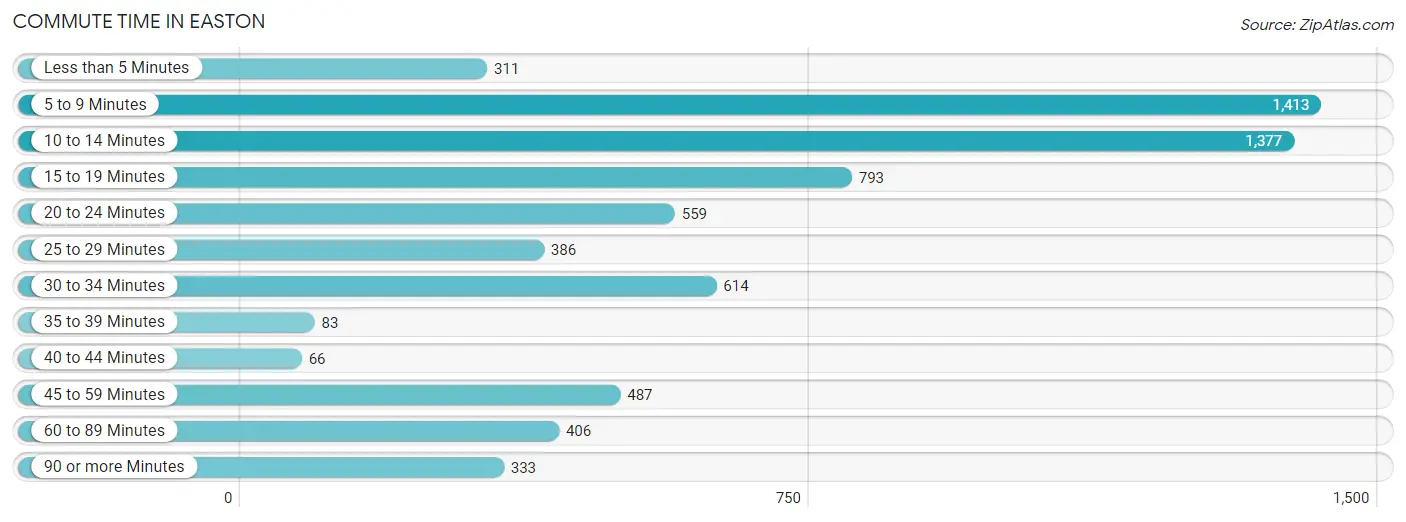
| Commute Time | # Commuters | % Commuters |
| Less than 5 Minutes | 311 | 4.5% |
| 5 to 9 Minutes | 1,413 | 20.7% |
| 10 to 14 Minutes | 1,377 | 20.2% |
| 15 to 19 Minutes | 793 | 11.6% |
| 20 to 24 Minutes | 559 | 8.2% |
| 25 to 29 Minutes | 386 | 5.7% |
| 30 to 34 Minutes | 614 | 9.0% |
| 35 to 39 Minutes | 83 | 1.2% |
| 40 to 44 Minutes | 66 | 1.0% |
| 45 to 59 Minutes | 487 | 7.1% |
| 60 to 89 Minutes | 406 | 5.9% |
| 90 or more Minutes | 333 | 4.9% |
Commute Time by Sex in Easton
The most common commute times in Easton are 5 to 9 minutes (476 commuters, 13.6%) for males and 5 to 9 minutes (937 commuters, 28.3%) for females.
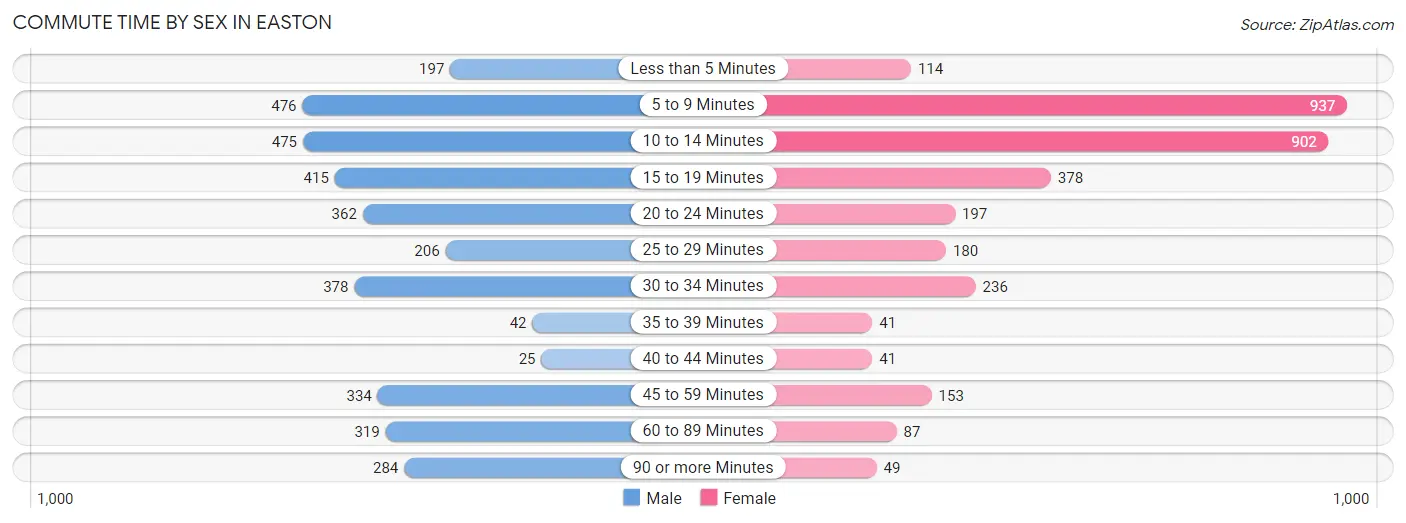
| Commute Time | Male | Female |
| Less than 5 Minutes | 197 (5.6%) | 114 (3.4%) |
| 5 to 9 Minutes | 476 (13.6%) | 937 (28.3%) |
| 10 to 14 Minutes | 475 (13.5%) | 902 (27.2%) |
| 15 to 19 Minutes | 415 (11.8%) | 378 (11.4%) |
| 20 to 24 Minutes | 362 (10.3%) | 197 (5.9%) |
| 25 to 29 Minutes | 206 (5.9%) | 180 (5.4%) |
| 30 to 34 Minutes | 378 (10.8%) | 236 (7.1%) |
| 35 to 39 Minutes | 42 (1.2%) | 41 (1.2%) |
| 40 to 44 Minutes | 25 (0.7%) | 41 (1.2%) |
| 45 to 59 Minutes | 334 (9.5%) | 153 (4.6%) |
| 60 to 89 Minutes | 319 (9.1%) | 87 (2.6%) |
| 90 or more Minutes | 284 (8.1%) | 49 (1.5%) |
Time of Departure to Work by Sex in Easton
The most frequent times of departure to work in Easton are 7:30 AM to 7:59 AM (543, 15.5%) for males and 7:30 AM to 7:59 AM (739, 22.3%) for females.
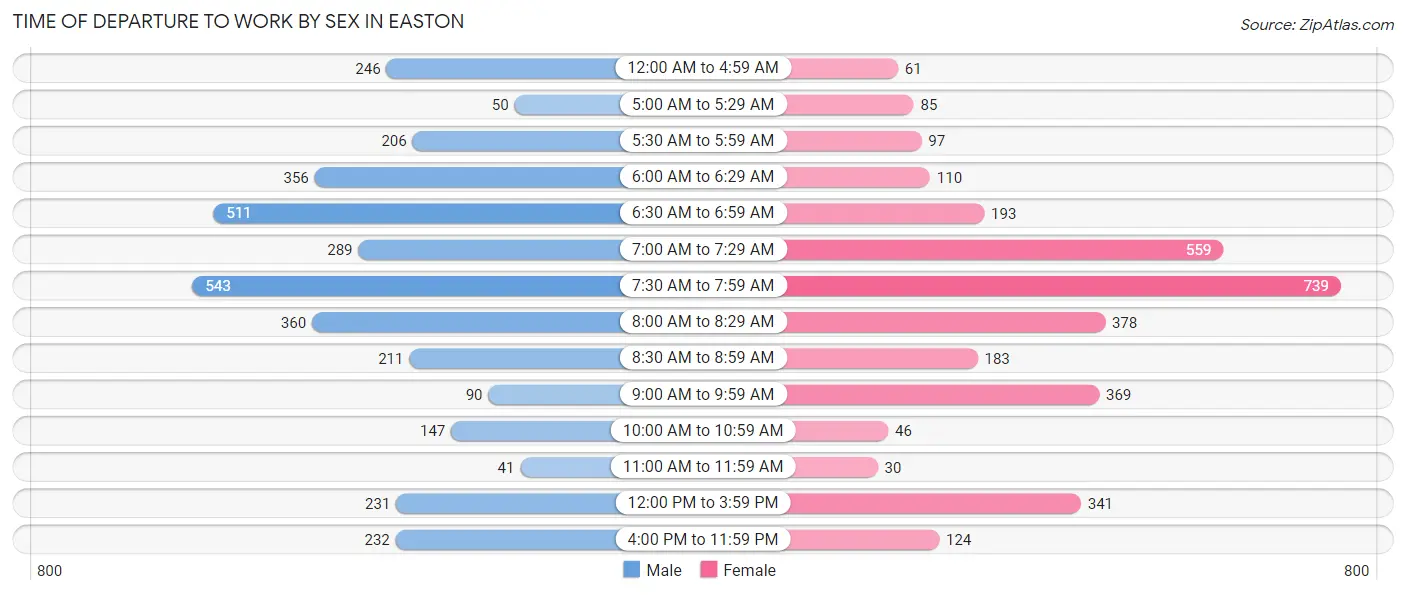
| Time of Departure | Male | Female |
| 12:00 AM to 4:59 AM | 246 (7.0%) | 61 (1.8%) |
| 5:00 AM to 5:29 AM | 50 (1.4%) | 85 (2.6%) |
| 5:30 AM to 5:59 AM | 206 (5.9%) | 97 (2.9%) |
| 6:00 AM to 6:29 AM | 356 (10.1%) | 110 (3.3%) |
| 6:30 AM to 6:59 AM | 511 (14.5%) | 193 (5.8%) |
| 7:00 AM to 7:29 AM | 289 (8.2%) | 559 (16.9%) |
| 7:30 AM to 7:59 AM | 543 (15.5%) | 739 (22.3%) |
| 8:00 AM to 8:29 AM | 360 (10.2%) | 378 (11.4%) |
| 8:30 AM to 8:59 AM | 211 (6.0%) | 183 (5.5%) |
| 9:00 AM to 9:59 AM | 90 (2.6%) | 369 (11.1%) |
| 10:00 AM to 10:59 AM | 147 (4.2%) | 46 (1.4%) |
| 11:00 AM to 11:59 AM | 41 (1.2%) | 30 (0.9%) |
| 12:00 PM to 3:59 PM | 231 (6.6%) | 341 (10.3%) |
| 4:00 PM to 11:59 PM | 232 (6.6%) | 124 (3.7%) |
| Total | 3,513 (100.0%) | 3,315 (100.0%) |
Housing Occupancy in Easton
Occupancy by Ownership in Easton
Of the total 7,195 dwellings in Easton, owner-occupied units account for 4,241 (58.9%), while renter-occupied units make up 2,954 (41.1%).
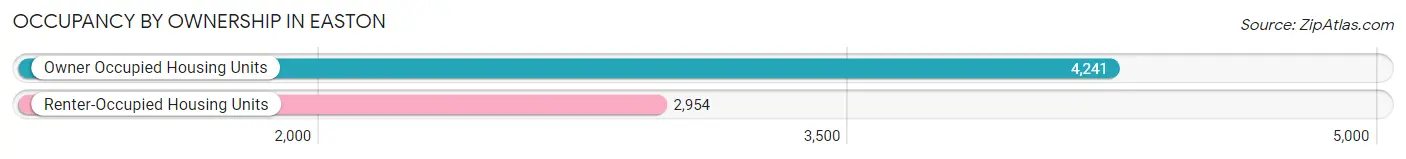
| Occupancy | # Housing Units | % Housing Units |
| Owner Occupied Housing Units | 4,241 | 58.9% |
| Renter-Occupied Housing Units | 2,954 | 41.1% |
| Total Occupied Housing Units | 7,195 | 100.0% |
Occupancy by Household Size in Easton
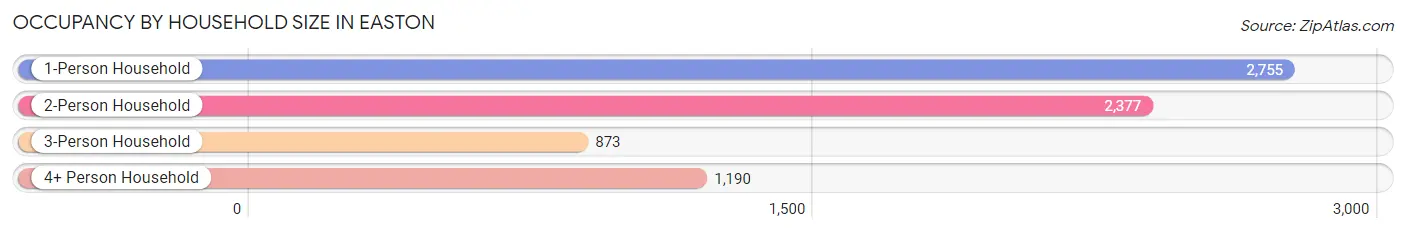
| Household Size | # Housing Units | % Housing Units |
| 1-Person Household | 2,755 | 38.3% |
| 2-Person Household | 2,377 | 33.0% |
| 3-Person Household | 873 | 12.1% |
| 4+ Person Household | 1,190 | 16.5% |
| Total Housing Units | 7,195 | 100.0% |
Occupancy by Ownership by Household Size in Easton
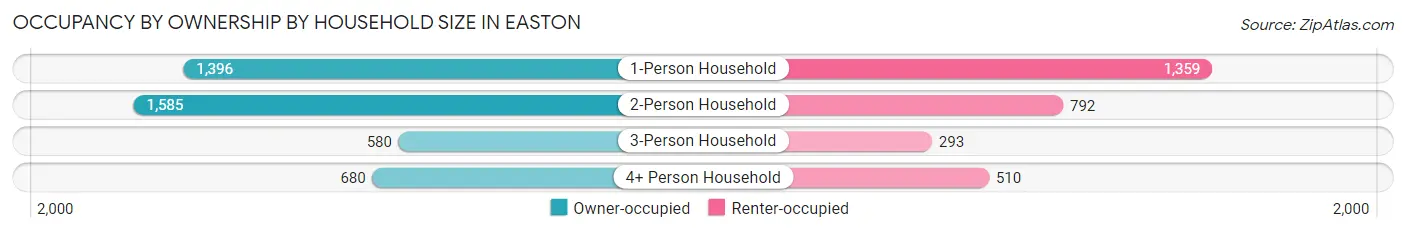
| Household Size | Owner-occupied | Renter-occupied |
| 1-Person Household | 1,396 (50.7%) | 1,359 (49.3%) |
| 2-Person Household | 1,585 (66.7%) | 792 (33.3%) |
| 3-Person Household | 580 (66.4%) | 293 (33.6%) |
| 4+ Person Household | 680 (57.1%) | 510 (42.9%) |
| Total Housing Units | 4,241 (58.9%) | 2,954 (41.1%) |
Occupancy by Educational Attainment in Easton
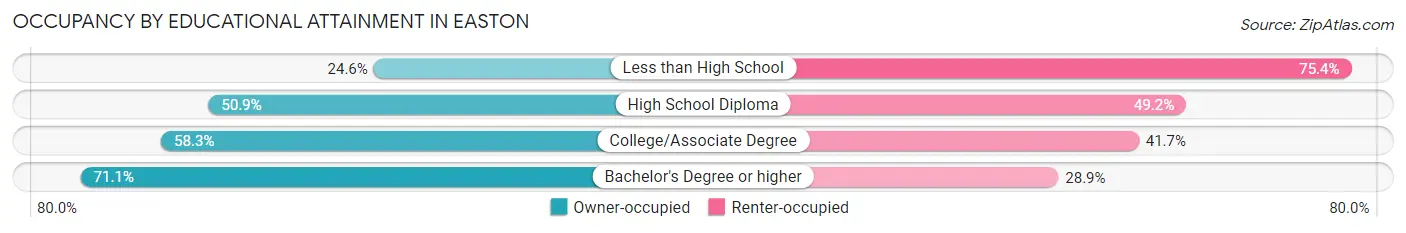
| Household Size | Owner-occupied | Renter-occupied |
| Less than High School | 156 (24.6%) | 477 (75.4%) |
| High School Diploma | 863 (50.8%) | 834 (49.1%) |
| College/Associate Degree | 1,084 (58.3%) | 774 (41.7%) |
| Bachelor's Degree or higher | 2,138 (71.1%) | 869 (28.9%) |
Occupancy by Age of Householder in Easton
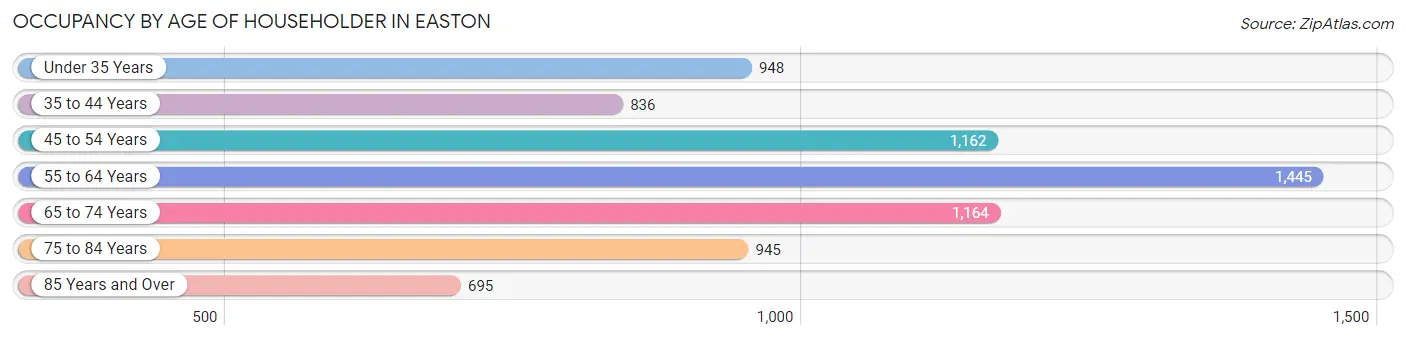
| Age Bracket | # Households | % Households |
| Under 35 Years | 948 | 13.2% |
| 35 to 44 Years | 836 | 11.6% |
| 45 to 54 Years | 1,162 | 16.2% |
| 55 to 64 Years | 1,445 | 20.1% |
| 65 to 74 Years | 1,164 | 16.2% |
| 75 to 84 Years | 945 | 13.1% |
| 85 Years and Over | 695 | 9.7% |
| Total | 7,195 | 100.0% |
Housing Finances in Easton
Median Income by Occupancy in Easton
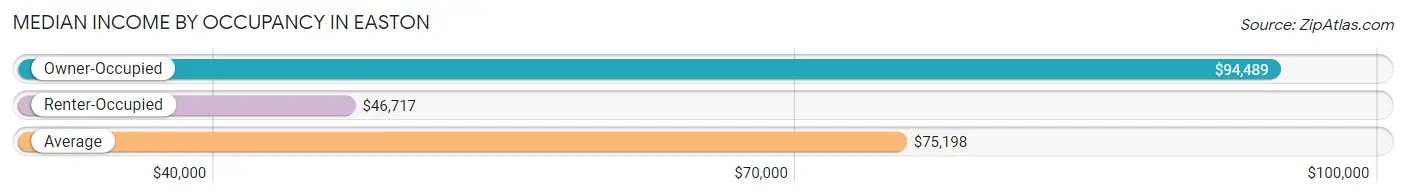
| Occupancy Type | # Households | Median Income |
| Owner-Occupied | 4,241 (58.9%) | $94,489 |
| Renter-Occupied | 2,954 (41.1%) | $46,717 |
| Average | 7,195 (100.0%) | $75,198 |
Occupancy by Householder Income Bracket in Easton
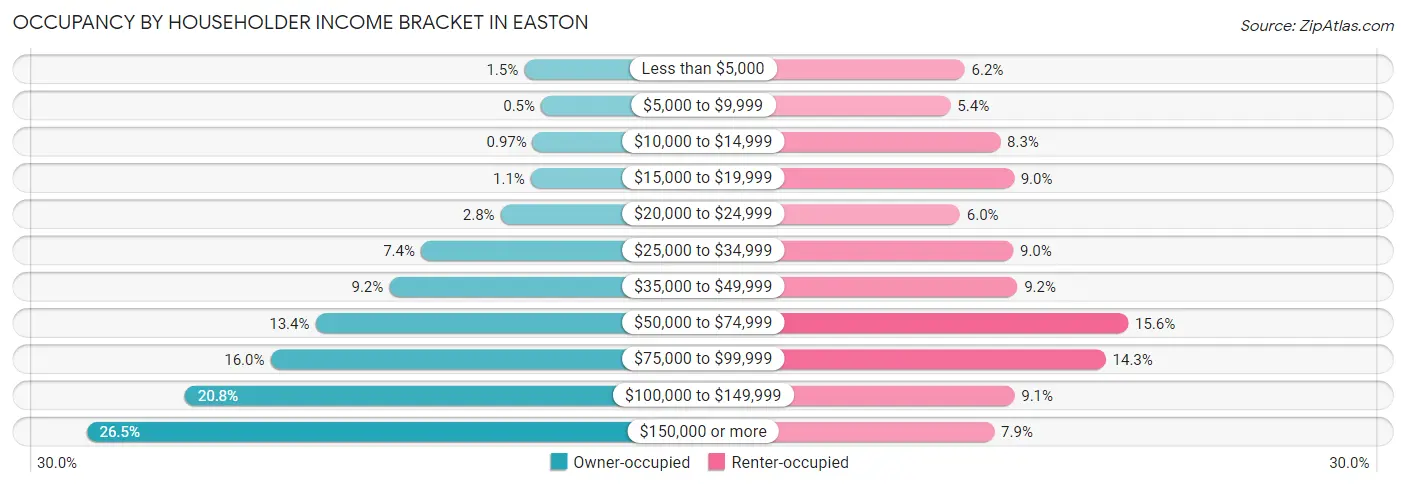
| Income Bracket | Owner-occupied | Renter-occupied |
| Less than $5,000 | 62 (1.5%) | 184 (6.2%) |
| $5,000 to $9,999 | 21 (0.5%) | 160 (5.4%) |
| $10,000 to $14,999 | 41 (1.0%) | 244 (8.3%) |
| $15,000 to $19,999 | 46 (1.1%) | 267 (9.0%) |
| $20,000 to $24,999 | 119 (2.8%) | 176 (6.0%) |
| $25,000 to $34,999 | 312 (7.4%) | 266 (9.0%) |
| $35,000 to $49,999 | 389 (9.2%) | 273 (9.2%) |
| $50,000 to $74,999 | 568 (13.4%) | 460 (15.6%) |
| $75,000 to $99,999 | 677 (16.0%) | 422 (14.3%) |
| $100,000 to $149,999 | 884 (20.8%) | 268 (9.1%) |
| $150,000 or more | 1,122 (26.5%) | 234 (7.9%) |
| Total | 4,241 (100.0%) | 2,954 (100.0%) |
Monthly Housing Cost Tiers in Easton
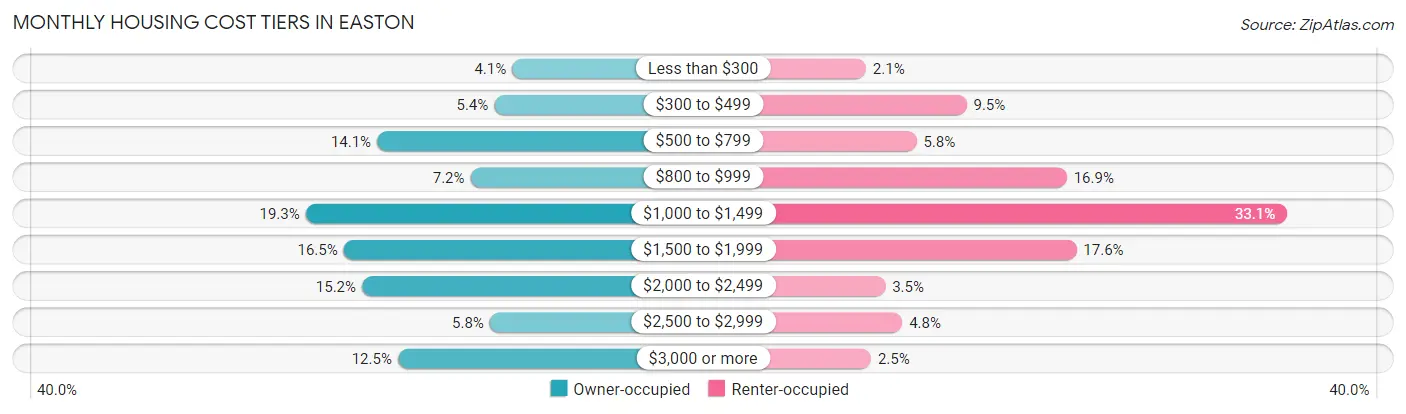
| Monthly Cost | Owner-occupied | Renter-occupied |
| Less than $300 | 174 (4.1%) | 62 (2.1%) |
| $300 to $499 | 230 (5.4%) | 281 (9.5%) |
| $500 to $799 | 596 (14.1%) | 172 (5.8%) |
| $800 to $999 | 304 (7.2%) | 499 (16.9%) |
| $1,000 to $1,499 | 819 (19.3%) | 978 (33.1%) |
| $1,500 to $1,999 | 700 (16.5%) | 520 (17.6%) |
| $2,000 to $2,499 | 643 (15.2%) | 104 (3.5%) |
| $2,500 to $2,999 | 244 (5.8%) | 141 (4.8%) |
| $3,000 or more | 531 (12.5%) | 73 (2.5%) |
| Total | 4,241 (100.0%) | 2,954 (100.0%) |
Physical Housing Characteristics in Easton
Housing Structures in Easton
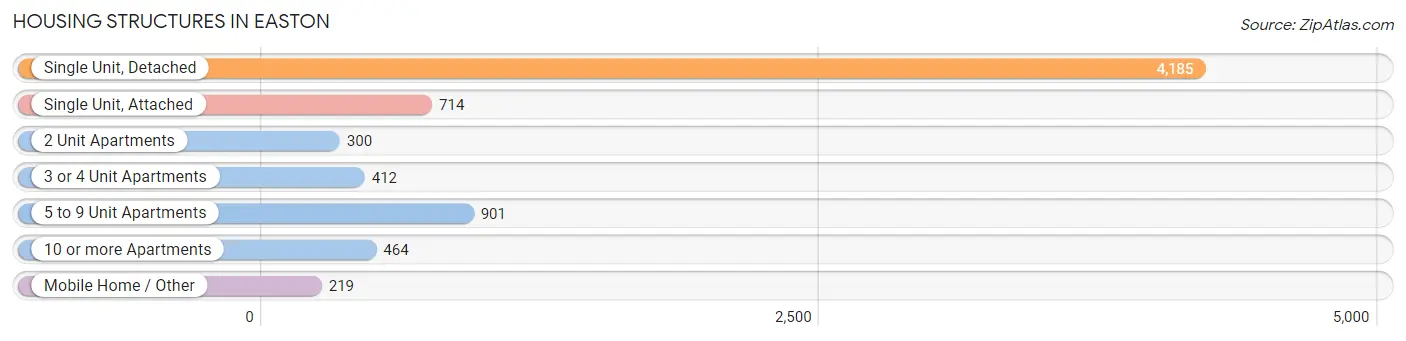
| Structure Type | # Housing Units | % Housing Units |
| Single Unit, Detached | 4,185 | 58.2% |
| Single Unit, Attached | 714 | 9.9% |
| 2 Unit Apartments | 300 | 4.2% |
| 3 or 4 Unit Apartments | 412 | 5.7% |
| 5 to 9 Unit Apartments | 901 | 12.5% |
| 10 or more Apartments | 464 | 6.5% |
| Mobile Home / Other | 219 | 3.0% |
| Total | 7,195 | 100.0% |
Housing Structures by Occupancy in Easton
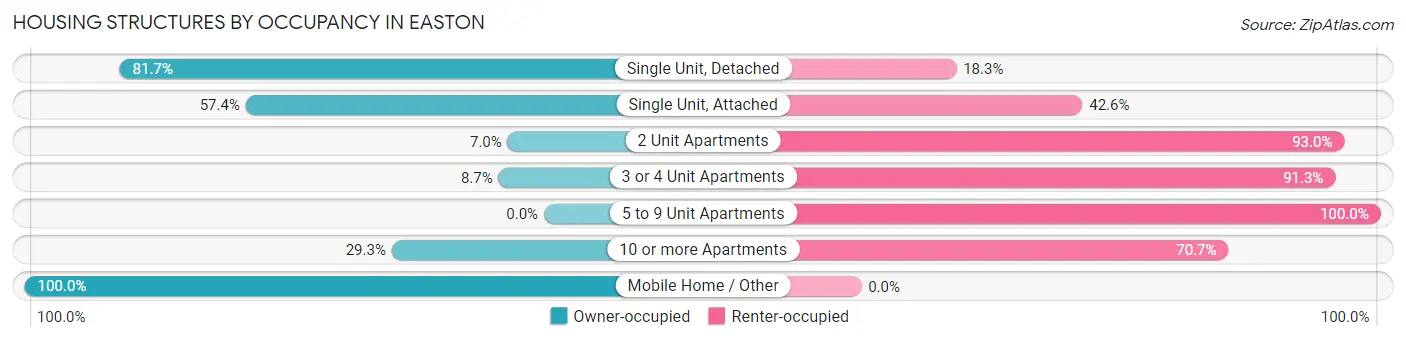
| Structure Type | Owner-occupied | Renter-occupied |
| Single Unit, Detached | 3,419 (81.7%) | 766 (18.3%) |
| Single Unit, Attached | 410 (57.4%) | 304 (42.6%) |
| 2 Unit Apartments | 21 (7.0%) | 279 (93.0%) |
| 3 or 4 Unit Apartments | 36 (8.7%) | 376 (91.3%) |
| 5 to 9 Unit Apartments | 0 (0.0%) | 901 (100.0%) |
| 10 or more Apartments | 136 (29.3%) | 328 (70.7%) |
| Mobile Home / Other | 219 (100.0%) | 0 (0.0%) |
| Total | 4,241 (58.9%) | 2,954 (41.1%) |
Housing Structures by Number of Rooms in Easton
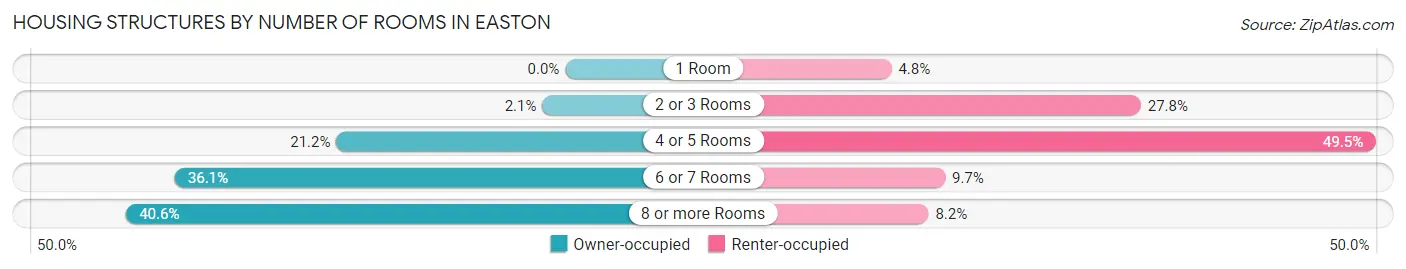
| Number of Rooms | Owner-occupied | Renter-occupied |
| 1 Room | 0 (0.0%) | 141 (4.8%) |
| 2 or 3 Rooms | 90 (2.1%) | 822 (27.8%) |
| 4 or 5 Rooms | 898 (21.2%) | 1,462 (49.5%) |
| 6 or 7 Rooms | 1,531 (36.1%) | 287 (9.7%) |
| 8 or more Rooms | 1,722 (40.6%) | 242 (8.2%) |
| Total | 4,241 (100.0%) | 2,954 (100.0%) |
Housing Structure by Heating Type in Easton
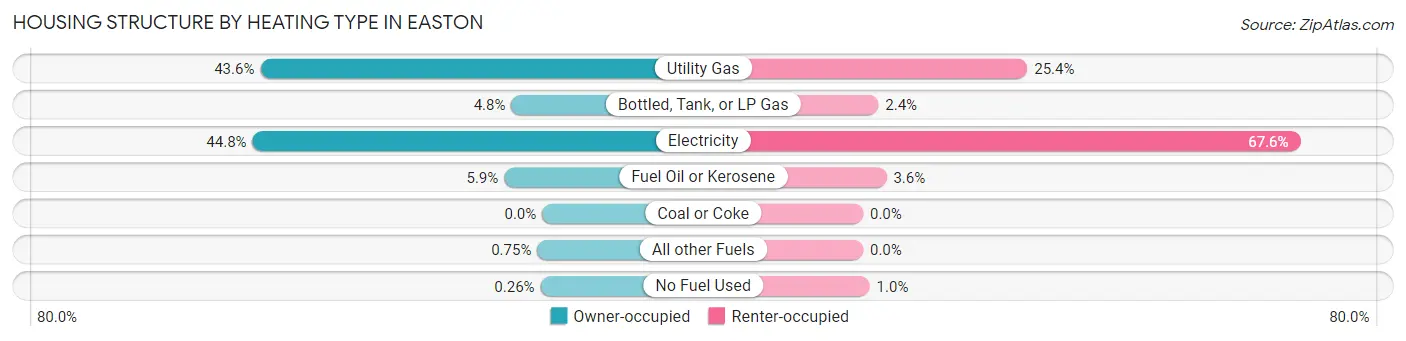
| Heating Type | Owner-occupied | Renter-occupied |
| Utility Gas | 1,848 (43.6%) | 750 (25.4%) |
| Bottled, Tank, or LP Gas | 202 (4.8%) | 70 (2.4%) |
| Electricity | 1,899 (44.8%) | 1,997 (67.6%) |
| Fuel Oil or Kerosene | 249 (5.9%) | 107 (3.6%) |
| Coal or Coke | 0 (0.0%) | 0 (0.0%) |
| All other Fuels | 32 (0.7%) | 0 (0.0%) |
| No Fuel Used | 11 (0.3%) | 30 (1.0%) |
| Total | 4,241 (100.0%) | 2,954 (100.0%) |
Household Vehicle Usage in Easton
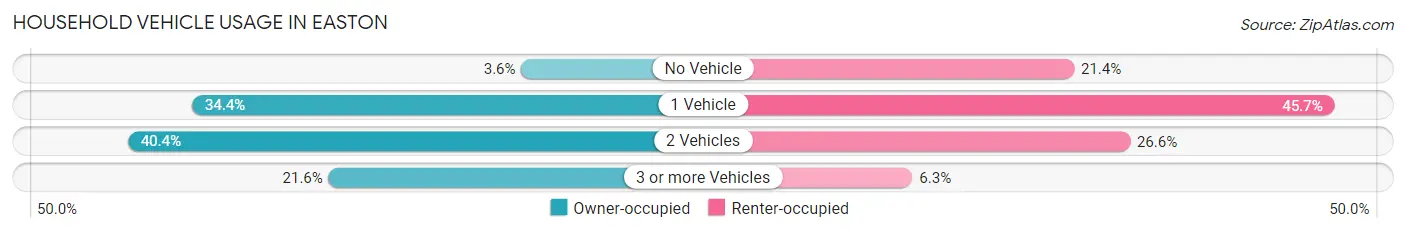
| Vehicles per Household | Owner-occupied | Renter-occupied |
| No Vehicle | 154 (3.6%) | 632 (21.4%) |
| 1 Vehicle | 1,458 (34.4%) | 1,350 (45.7%) |
| 2 Vehicles | 1,712 (40.4%) | 786 (26.6%) |
| 3 or more Vehicles | 917 (21.6%) | 186 (6.3%) |
| Total | 4,241 (100.0%) | 2,954 (100.0%) |
Real Estate & Mortgages in Easton
Real Estate and Mortgage Overview in Easton
| Characteristic | Without Mortgage | With Mortgage |
| Housing Units | 1,526 | 2,715 |
| Median Property Value | $298,400 | $342,000 |
| Median Household Income | $67,800 | $771 |
| Monthly Housing Costs | $734 | $407 |
| Real Estate Taxes | $2,719 | $65 |
Property Value by Mortgage Status in Easton
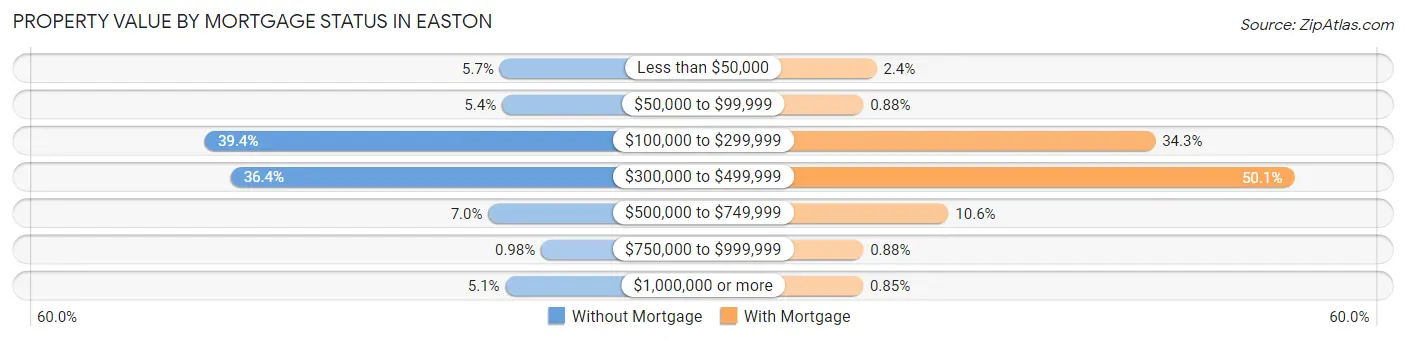
| Property Value | Without Mortgage | With Mortgage |
| Less than $50,000 | 87 (5.7%) | 65 (2.4%) |
| $50,000 to $99,999 | 83 (5.4%) | 24 (0.9%) |
| $100,000 to $299,999 | 601 (39.4%) | 930 (34.3%) |
| $300,000 to $499,999 | 556 (36.4%) | 1,361 (50.1%) |
| $500,000 to $749,999 | 107 (7.0%) | 288 (10.6%) |
| $750,000 to $999,999 | 15 (1.0%) | 24 (0.9%) |
| $1,000,000 or more | 77 (5.1%) | 23 (0.9%) |
| Total | 1,526 (100.0%) | 2,715 (100.0%) |
Household Income by Mortgage Status in Easton
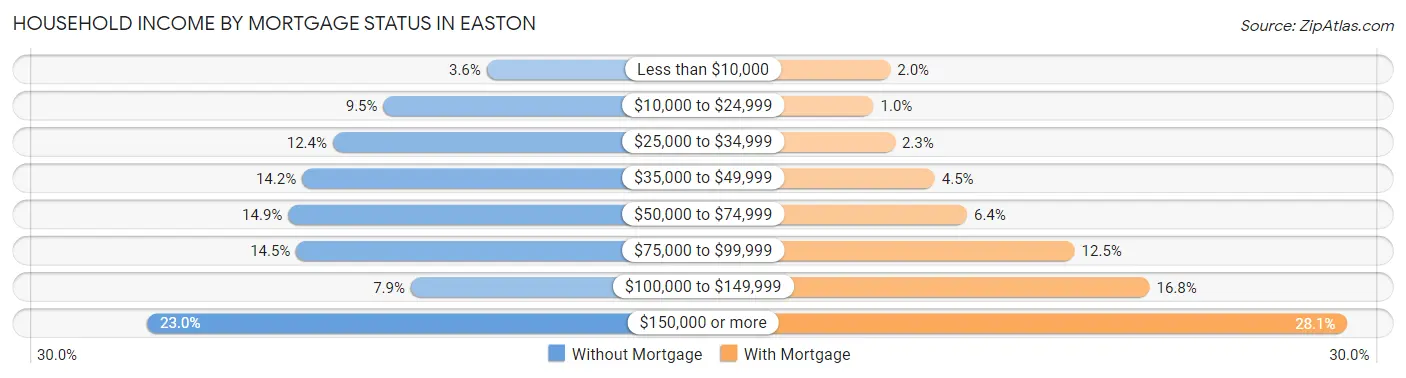
| Household Income | Without Mortgage | With Mortgage |
| Less than $10,000 | 55 (3.6%) | 54 (2.0%) |
| $10,000 to $24,999 | 145 (9.5%) | 28 (1.0%) |
| $25,000 to $34,999 | 189 (12.4%) | 61 (2.2%) |
| $35,000 to $49,999 | 216 (14.1%) | 123 (4.5%) |
| $50,000 to $74,999 | 228 (14.9%) | 173 (6.4%) |
| $75,000 to $99,999 | 221 (14.5%) | 340 (12.5%) |
| $100,000 to $149,999 | 121 (7.9%) | 456 (16.8%) |
| $150,000 or more | 351 (23.0%) | 763 (28.1%) |
| Total | 1,526 (100.0%) | 2,715 (100.0%) |
Property Value to Household Income Ratio in Easton
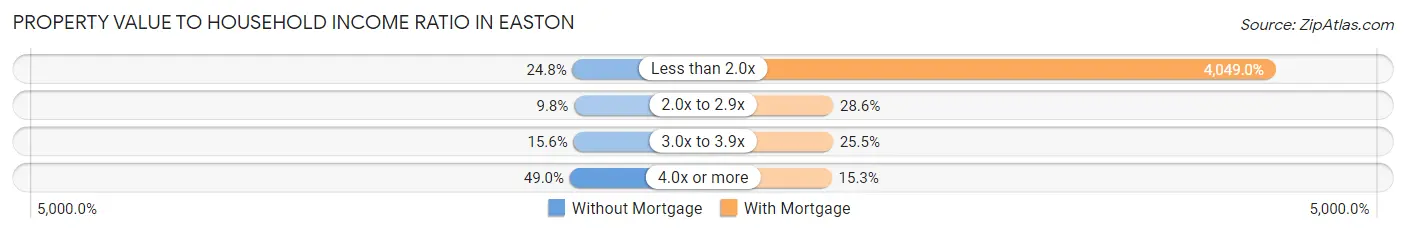
| Value-to-Income Ratio | Without Mortgage | With Mortgage |
| Less than 2.0x | 378 (24.8%) | 109,931 (4,049.0%) |
| 2.0x to 2.9x | 150 (9.8%) | 775 (28.5%) |
| 3.0x to 3.9x | 238 (15.6%) | 692 (25.5%) |
| 4.0x or more | 747 (48.9%) | 416 (15.3%) |
| Total | 1,526 (100.0%) | 2,715 (100.0%) |
Real Estate Taxes by Mortgage Status in Easton
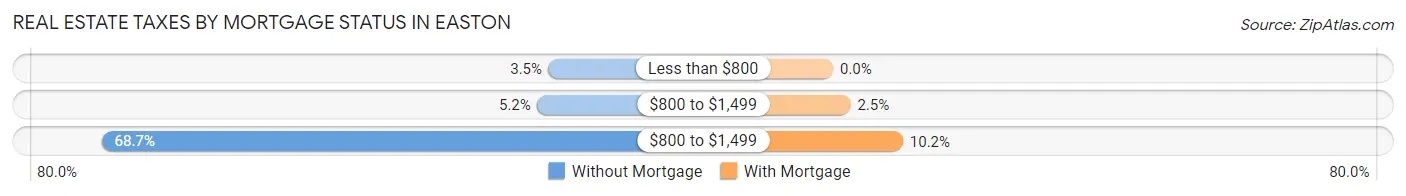
| Property Taxes | Without Mortgage | With Mortgage |
| Less than $800 | 54 (3.5%) | 0 (0.0%) |
| $800 to $1,499 | 79 (5.2%) | 69 (2.5%) |
| $800 to $1,499 | 1,049 (68.7%) | 277 (10.2%) |
| Total | 1,526 (100.0%) | 2,715 (100.0%) |
Health & Disability in Easton
Health Insurance Coverage by Age in Easton

| Age Bracket | With Coverage | Without Coverage |
| Under 6 Years | 1,179 (97.9%) | 25 (2.1%) |
| 6 to 18 Years | 2,493 (95.2%) | 126 (4.8%) |
| 19 to 25 Years | 833 (93.5%) | 58 (6.5%) |
| 26 to 34 Years | 1,792 (87.0%) | 267 (13.0%) |
| 35 to 44 Years | 1,533 (93.4%) | 109 (6.6%) |
| 45 to 54 Years | 1,786 (91.6%) | 163 (8.4%) |
| 55 to 64 Years | 1,951 (96.1%) | 80 (3.9%) |
| 65 to 74 Years | 1,819 (99.4%) | 11 (0.6%) |
| 75 Years and older | 2,506 (100.0%) | 0 (0.0%) |
| Total | 15,892 (95.0%) | 839 (5.0%) |
Health Insurance Coverage by Citizenship Status in Easton
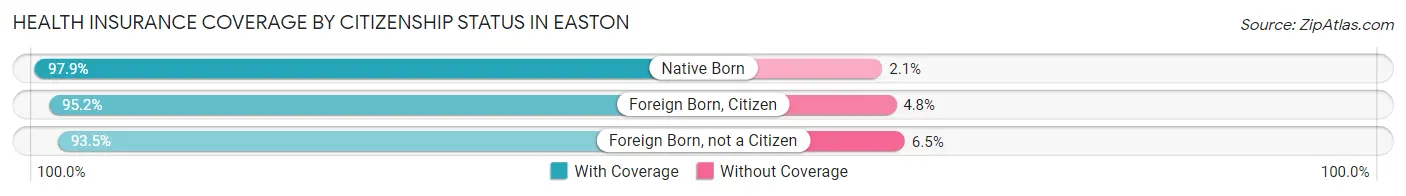
| Citizenship Status | With Coverage | Without Coverage |
| Native Born | 1,179 (97.9%) | 25 (2.1%) |
| Foreign Born, Citizen | 2,493 (95.2%) | 126 (4.8%) |
| Foreign Born, not a Citizen | 833 (93.5%) | 58 (6.5%) |
Health Insurance Coverage by Household Income in Easton
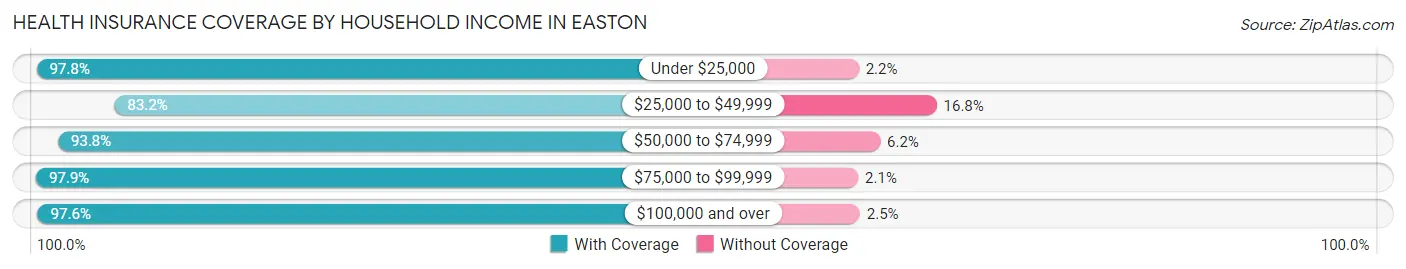
| Household Income | With Coverage | Without Coverage |
| Under $25,000 | 1,929 (97.8%) | 44 (2.2%) |
| $25,000 to $49,999 | 2,021 (83.2%) | 409 (16.8%) |
| $50,000 to $74,999 | 2,254 (93.8%) | 150 (6.2%) |
| $75,000 to $99,999 | 2,065 (97.9%) | 45 (2.1%) |
| $100,000 and over | 7,552 (97.6%) | 190 (2.5%) |
Public vs Private Health Insurance Coverage by Age in Easton
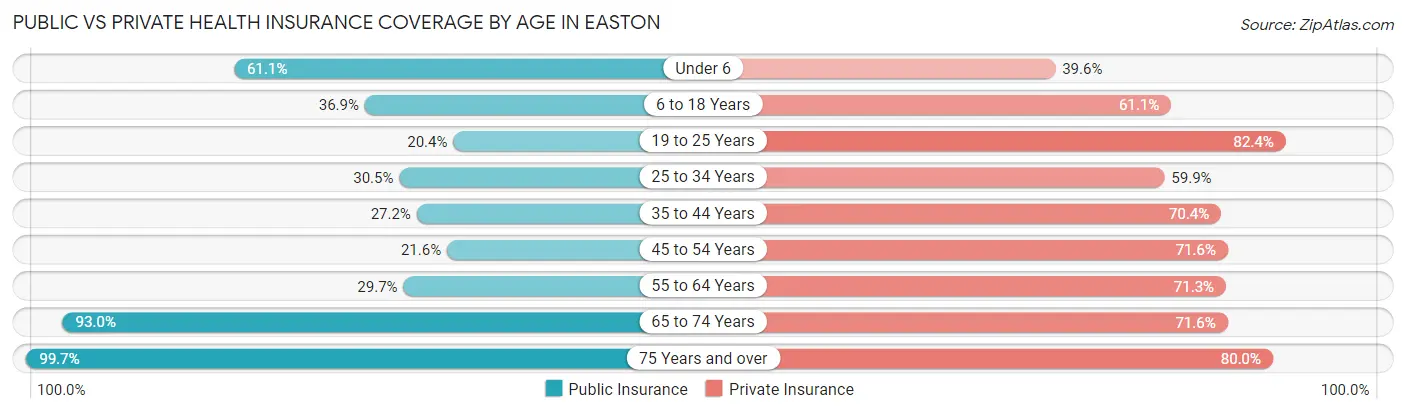
| Age Bracket | Public Insurance | Private Insurance |
| Under 6 | 736 (61.1%) | 477 (39.6%) |
| 6 to 18 Years | 965 (36.8%) | 1,601 (61.1%) |
| 19 to 25 Years | 182 (20.4%) | 734 (82.4%) |
| 25 to 34 Years | 627 (30.4%) | 1,233 (59.9%) |
| 35 to 44 Years | 447 (27.2%) | 1,156 (70.4%) |
| 45 to 54 Years | 421 (21.6%) | 1,396 (71.6%) |
| 55 to 64 Years | 603 (29.7%) | 1,448 (71.3%) |
| 65 to 74 Years | 1,701 (92.9%) | 1,310 (71.6%) |
| 75 Years and over | 2,498 (99.7%) | 2,005 (80.0%) |
| Total | 8,180 (48.9%) | 11,360 (67.9%) |
Disability Status by Sex by Age in Easton
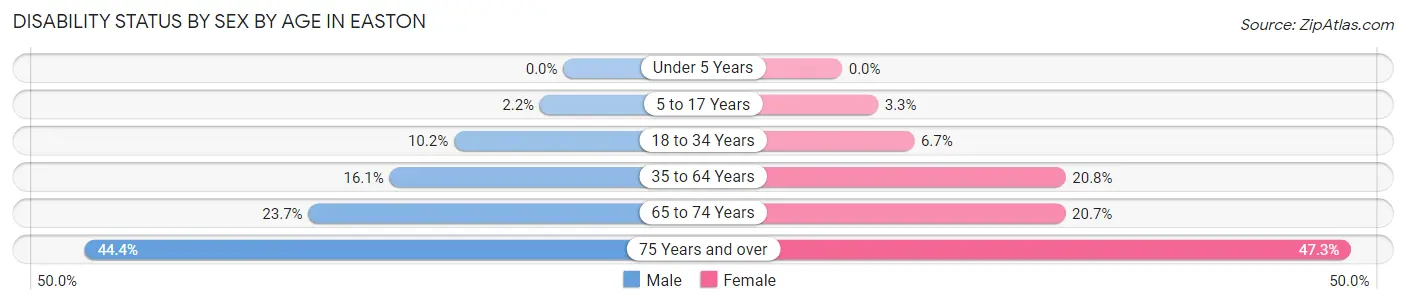
| Age Bracket | Male | Female |
| Under 5 Years | 0 (0.0%) | 0 (0.0%) |
| 5 to 17 Years | 33 (2.2%) | 44 (3.3%) |
| 18 to 34 Years | 152 (10.2%) | 104 (6.7%) |
| 35 to 64 Years | 400 (16.1%) | 652 (20.7%) |
| 65 to 74 Years | 199 (23.7%) | 205 (20.7%) |
| 75 Years and over | 414 (44.4%) | 744 (47.3%) |
Disability Class by Sex by Age in Easton
Disability Class: Hearing Difficulty
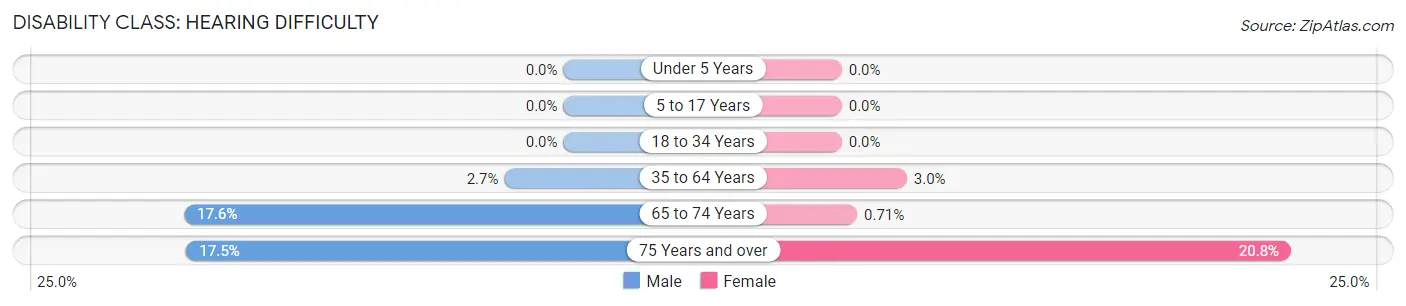
| Age Bracket | Male | Female |
| Under 5 Years | 0 (0.0%) | 0 (0.0%) |
| 5 to 17 Years | 0 (0.0%) | 0 (0.0%) |
| 18 to 34 Years | 0 (0.0%) | 0 (0.0%) |
| 35 to 64 Years | 68 (2.7%) | 95 (3.0%) |
| 65 to 74 Years | 148 (17.6%) | 7 (0.7%) |
| 75 Years and over | 163 (17.5%) | 328 (20.8%) |
Disability Class: Vision Difficulty
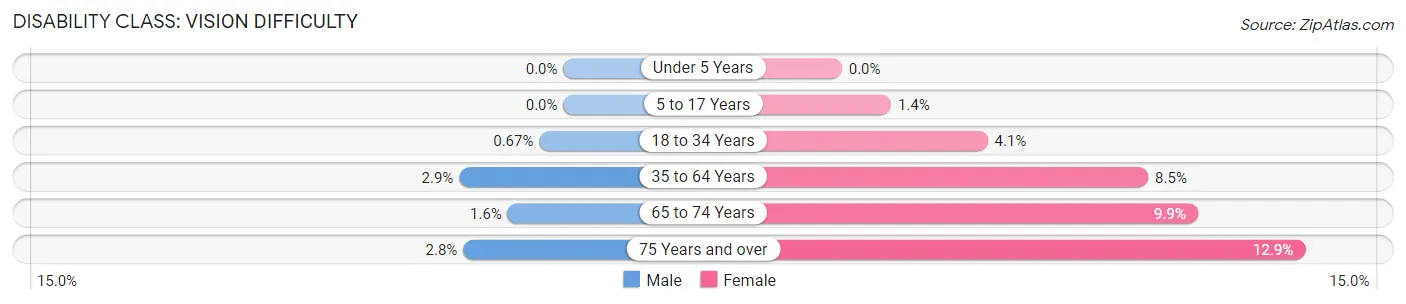
| Age Bracket | Male | Female |
| Under 5 Years | 0 (0.0%) | 0 (0.0%) |
| 5 to 17 Years | 0 (0.0%) | 18 (1.4%) |
| 18 to 34 Years | 10 (0.7%) | 63 (4.1%) |
| 35 to 64 Years | 72 (2.9%) | 268 (8.5%) |
| 65 to 74 Years | 13 (1.5%) | 98 (9.9%) |
| 75 Years and over | 26 (2.8%) | 203 (12.9%) |
Disability Class: Cognitive Difficulty
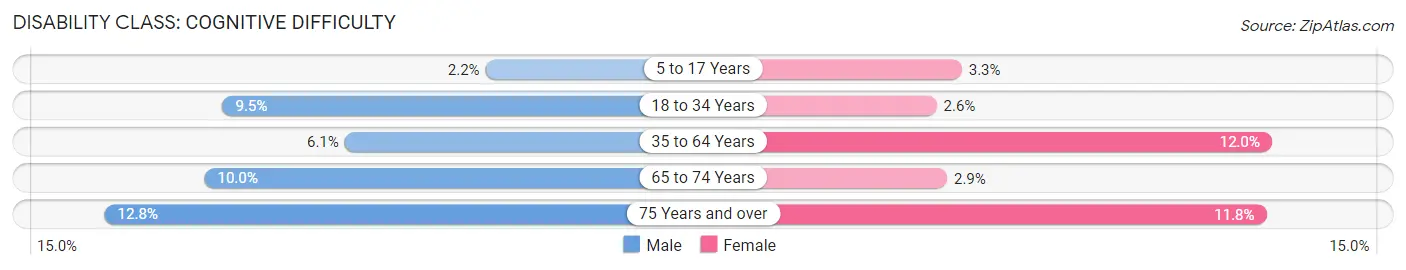
| Age Bracket | Male | Female |
| 5 to 17 Years | 33 (2.2%) | 44 (3.3%) |
| 18 to 34 Years | 142 (9.5%) | 41 (2.6%) |
| 35 to 64 Years | 151 (6.1%) | 376 (12.0%) |
| 65 to 74 Years | 84 (10.0%) | 29 (2.9%) |
| 75 Years and over | 119 (12.8%) | 186 (11.8%) |
Disability Class: Ambulatory Difficulty
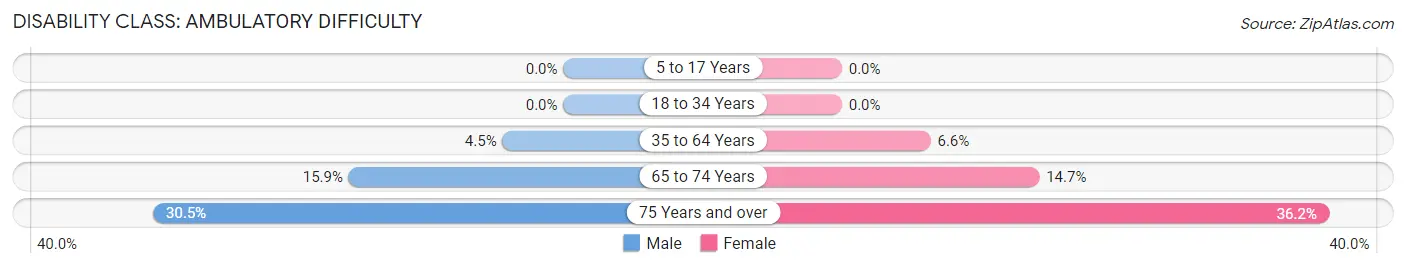
| Age Bracket | Male | Female |
| 5 to 17 Years | 0 (0.0%) | 0 (0.0%) |
| 18 to 34 Years | 0 (0.0%) | 0 (0.0%) |
| 35 to 64 Years | 112 (4.5%) | 207 (6.6%) |
| 65 to 74 Years | 134 (15.9%) | 145 (14.7%) |
| 75 Years and over | 284 (30.5%) | 569 (36.1%) |
Disability Class: Self-Care Difficulty
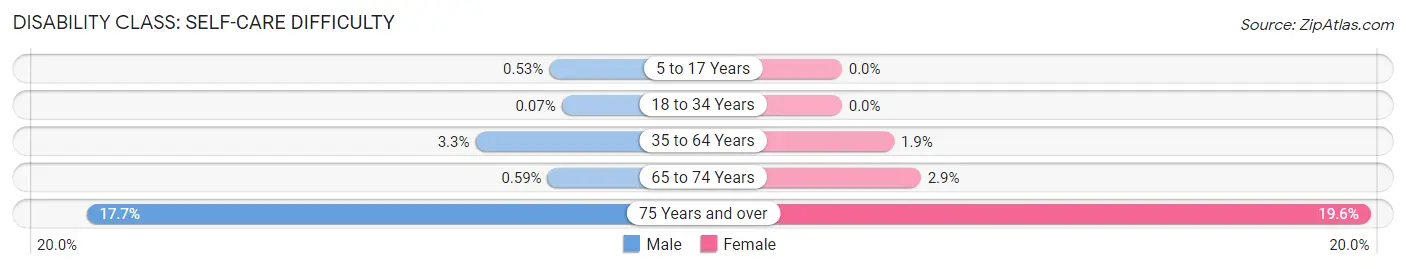
| Age Bracket | Male | Female |
| 5 to 17 Years | 8 (0.5%) | 0 (0.0%) |
| 18 to 34 Years | 1 (0.1%) | 0 (0.0%) |
| 35 to 64 Years | 81 (3.3%) | 61 (1.9%) |
| 65 to 74 Years | 5 (0.6%) | 29 (2.9%) |
| 75 Years and over | 165 (17.7%) | 309 (19.6%) |
Technology Access in Easton
Computing Device Access in Easton
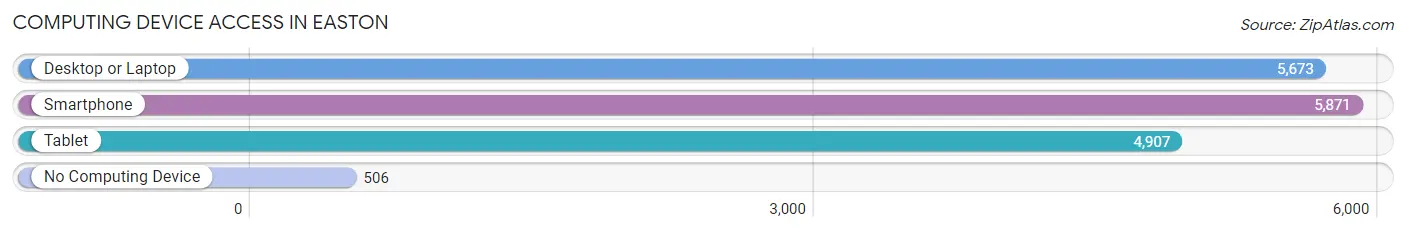
| Device Type | # Households | % Households |
| Desktop or Laptop | 5,673 | 78.8% |
| Smartphone | 5,871 | 81.6% |
| Tablet | 4,907 | 68.2% |
| No Computing Device | 506 | 7.0% |
| Total | 7,195 | 100.0% |
Internet Access in Easton
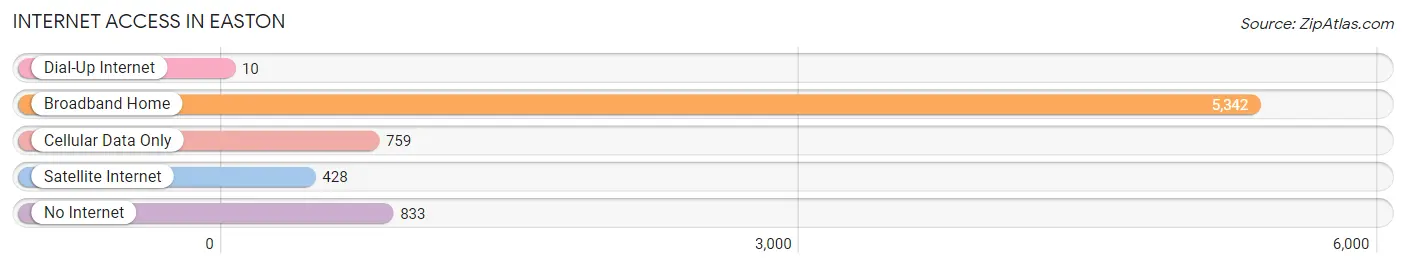
| Internet Type | # Households | % Households |
| Dial-Up Internet | 10 | 0.1% |
| Broadband Home | 5,342 | 74.3% |
| Cellular Data Only | 759 | 10.5% |
| Satellite Internet | 428 | 5.9% |
| No Internet | 833 | 11.6% |
| Total | 7,195 | 100.0% |
Easton Summary
Easton, Maryland is a small town located in Talbot County on the Eastern Shore of Maryland. It is situated on the banks of the Tred Avon River, about 30 miles east of Annapolis and about 90 miles east of Washington, D.C. Easton is the county seat of Talbot County and is the largest town in the county. The town has a population of 15,945 as of the 2010 census.
History
Easton was founded in 1710 by William Talbot, a member of the Maryland colonial assembly. The town was named after Talbot's family estate in England. Easton was officially incorporated in 1788 and became the county seat of Talbot County in 1790.
Easton was an important port town in the 18th and 19th centuries. It was a major center for the Chesapeake Bay oyster industry and was home to several shipbuilding companies. The town was also a major center for the slave trade in the early 19th century.
Easton was an important stop on the Underground Railroad and was home to several prominent abolitionists, including Harriet Tubman. The town was also the site of the first public school in Talbot County, which was established in 1805.
Geography
Easton is located in Talbot County on the Eastern Shore of Maryland. The town is situated on the banks of the Tred Avon River, about 30 miles east of Annapolis and about 90 miles east of Washington, D.C.
Easton has a total area of 5.2 square miles, all of which is land. The town is located in a humid subtropical climate zone and has hot, humid summers and mild winters.
Economy
Easton's economy is largely based on tourism and services. The town is home to several historic sites, including the Talbot County Courthouse, the Third Haven Friends Meeting House, and the Tidewater Inn. The town is also home to several museums, including the Talbot Historical Society Museum and the Academy Art Museum.
Easton is also home to several large employers, including the Easton Airport, the Easton Utilities Commission, and the Easton-based health care provider, University of Maryland Shore Regional Health.
Demographics
As of the 2010 census, Easton had a population of 15,945. The racial makeup of the town was 79.2% White, 15.3% African American, 0.4% Native American, 1.7% Asian, 0.1% Pacific Islander, 1.2% from other races, and 2.1% from two or more races. Hispanic or Latino of any race were 3.3% of the population.
The median household income in Easton was $50,945 in 2018. The median age of the town's population was 43.7 years. The town's population is well-educated, with over 40% of the population having a bachelor's degree or higher.
Common Questions
What is Per Capita Income in Easton?
Per Capita income in Easton is $43,844.
What is the Median Family Income in Easton?
Median Family Income in Easton is $102,776.
What is the Median Household income in Easton?
Median Household Income in Easton is $75,198.
What is Income or Wage Gap in Easton?
Income or Wage Gap in Easton is 23.3%.
Women in Easton earn 76.7 cents for every dollar earned by a man.
What is Family Income Deficit in Easton?
Family Income Deficit in Easton is $7,895.
Families that are below poverty line in Easton earn $7,895 less on average than the poverty threshold level.
What is Inequality or Gini Index in Easton?
Inequality or Gini Index in Easton is 0.48.
What is the Total Population of Easton?
Total Population of Easton is 17,118.
What is the Total Male Population of Easton?
Total Male Population of Easton is 7,941.
What is the Total Female Population of Easton?
Total Female Population of Easton is 9,177.
What is the Ratio of Males per 100 Females in Easton?
There are 86.53 Males per 100 Females in Easton.
What is the Ratio of Females per 100 Males in Easton?
There are 115.56 Females per 100 Males in Easton.
What is the Median Population Age in Easton?
Median Population Age in Easton is 45.4 Years.
What is the Average Family Size in Easton
Average Family Size in Easton is 3.1 People.
What is the Average Household Size in Easton
Average Household Size in Easton is 2.3 People.
How Large is the Labor Force in Easton?
There are 8,060 People in the Labor Forcein in Easton.
What is the Percentage of People in the Labor Force in Easton?
58.5% of People are in the Labor Force in Easton.
What is the Unemployment Rate in Easton?
Unemployment Rate in Easton is 1.5%.