Eldersburg, MD Map & Demographics
Eldersburg Map
Eldersburg Overview
$57,788
PER CAPITA INCOME
$164,350
AVG FAMILY INCOME
$143,148
AVG HOUSEHOLD INCOME
28.4%
WAGE / INCOME GAP [ % ]
71.6¢/ $1
WAGE / INCOME GAP [ $ ]
0.37
INEQUALITY / GINI INDEX
30,357
TOTAL POPULATION
15,140
MALE POPULATION
15,217
FEMALE POPULATION
99.49
MALES / 100 FEMALES
100.51
FEMALES / 100 MALES
40.4
MEDIAN AGE
3.2
AVG FAMILY SIZE
2.8
AVG HOUSEHOLD SIZE
16,672
LABOR FORCE [ PEOPLE ]
68.7%
PERCENT IN LABOR FORCE
2.6%
UNEMPLOYMENT RATE
Income in Eldersburg
Income Overview in Eldersburg
Per Capita Income in Eldersburg is $57,788, while median incomes of families and households are $164,350 and $143,148 respectively.
| Characteristic | Number | Measure |
| Per Capita Income | 30,357 | $57,788 |
| Median Family Income | 8,309 | $164,350 |
| Mean Family Income | 8,309 | $182,192 |
| Median Household Income | 10,575 | $143,148 |
| Mean Household Income | 10,575 | $164,282 |
| Income Deficit | 8,309 | $0 |
| Wage / Income Gap (%) | 30,357 | 28.38% |
| Wage / Income Gap ($) | 30,357 | 71.62¢ per $1 |
| Gini / Inequality Index | 30,357 | 0.37 |
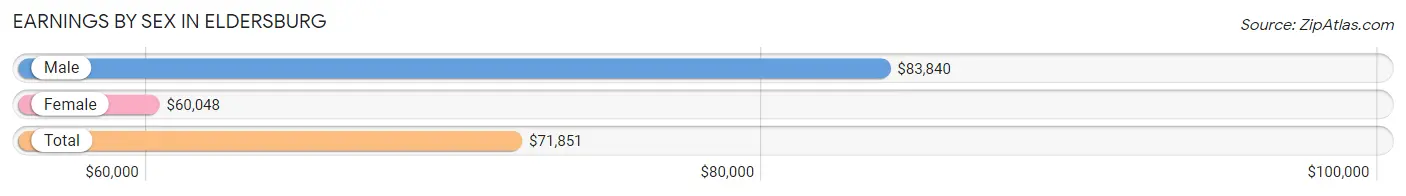
Earnings by Sex in Eldersburg
Average Earnings in Eldersburg are $71,851, $83,840 for men and $60,048 for women, a difference of 28.4%.
| Sex | Number | Average Earnings |
| Male | 9,110 (52.0%) | $83,840 |
| Female | 8,422 (48.0%) | $60,048 |
| Total | 17,532 (100.0%) | $71,851 |
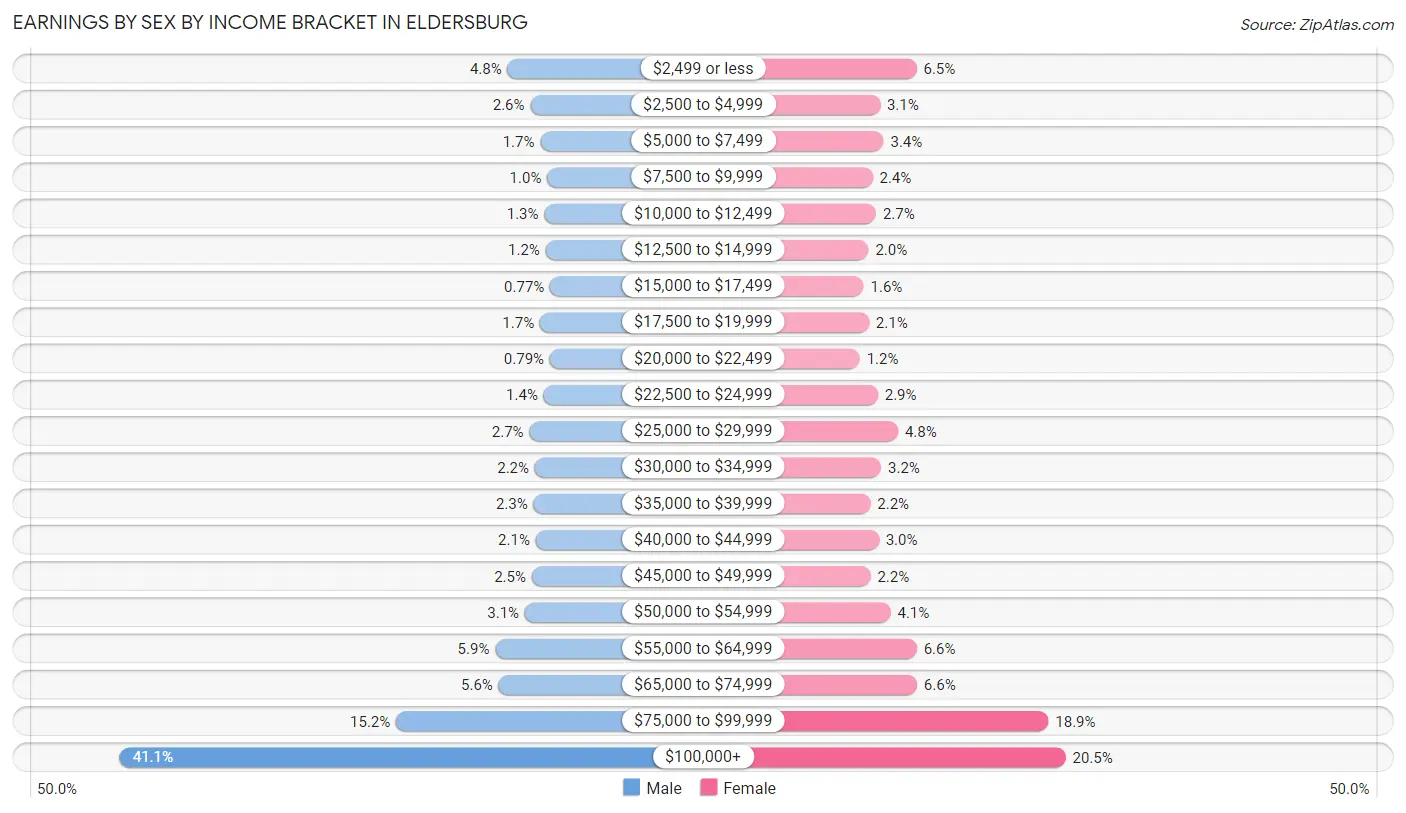
Earnings by Sex by Income Bracket in Eldersburg
The most common earnings brackets in Eldersburg are $100,000+ for men (3,742 | 41.1%) and $100,000+ for women (1,726 | 20.5%).
| Income | Male | Female |
| $2,499 or less | 434 (4.8%) | 550 (6.5%) |
| $2,500 to $4,999 | 239 (2.6%) | 262 (3.1%) |
| $5,000 to $7,499 | 154 (1.7%) | 290 (3.4%) |
| $7,500 to $9,999 | 95 (1.0%) | 203 (2.4%) |
| $10,000 to $12,499 | 119 (1.3%) | 230 (2.7%) |
| $12,500 to $14,999 | 108 (1.2%) | 171 (2.0%) |
| $15,000 to $17,499 | 70 (0.8%) | 132 (1.6%) |
| $17,500 to $19,999 | 157 (1.7%) | 174 (2.1%) |
| $20,000 to $22,499 | 72 (0.8%) | 102 (1.2%) |
| $22,500 to $24,999 | 125 (1.4%) | 244 (2.9%) |
| $25,000 to $29,999 | 247 (2.7%) | 403 (4.8%) |
| $30,000 to $34,999 | 200 (2.2%) | 270 (3.2%) |
| $35,000 to $39,999 | 211 (2.3%) | 186 (2.2%) |
| $40,000 to $44,999 | 193 (2.1%) | 252 (3.0%) |
| $45,000 to $49,999 | 227 (2.5%) | 187 (2.2%) |
| $50,000 to $54,999 | 285 (3.1%) | 345 (4.1%) |
| $55,000 to $64,999 | 538 (5.9%) | 552 (6.6%) |
| $65,000 to $74,999 | 509 (5.6%) | 553 (6.6%) |
| $75,000 to $99,999 | 1,385 (15.2%) | 1,590 (18.9%) |
| $100,000+ | 3,742 (41.1%) | 1,726 (20.5%) |
| Total | 9,110 (100.0%) | 8,422 (100.0%) |
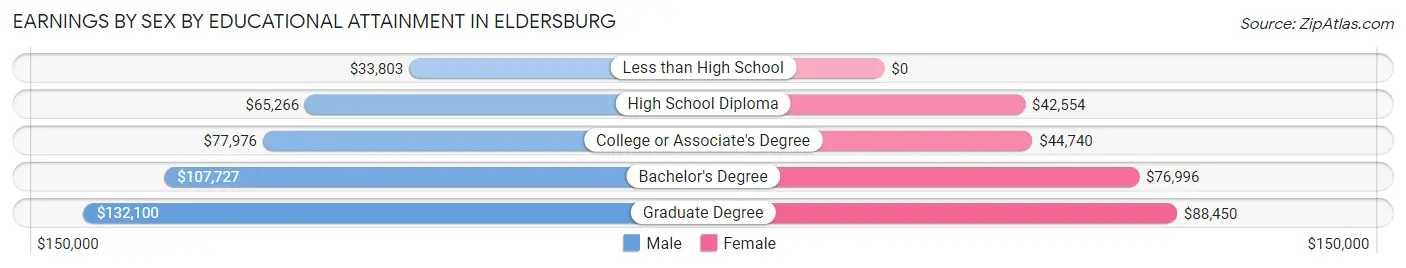
Earnings by Sex by Educational Attainment in Eldersburg
Average earnings in Eldersburg are $95,163 for men and $69,413 for women, a difference of 27.1%. Men with an educational attainment of graduate degree enjoy the highest average annual earnings of $132,100, while those with less than high school education earn the least with $33,803. Women with an educational attainment of graduate degree earn the most with the average annual earnings of $88,450, while those with high school diploma education have the smallest earnings of $42,554.
| Educational Attainment | Male Income | Female Income |
| Less than High School | $33,803 | $0 |
| High School Diploma | $65,266 | $42,554 |
| College or Associate's Degree | $77,976 | $44,740 |
| Bachelor's Degree | $107,727 | $76,996 |
| Graduate Degree | $132,100 | $88,450 |
| Total | $95,163 | $69,413 |
Family Income in Eldersburg
Family Income Brackets in Eldersburg
According to the Eldersburg family income data, there are 2,941 families falling into the $200,000+ income range, which is the most common income bracket and makes up 35.4% of all families. Conversely, the $10,000 to $14,999 income bracket is the least frequent group with only 25 families (0.3%) belonging to this category.
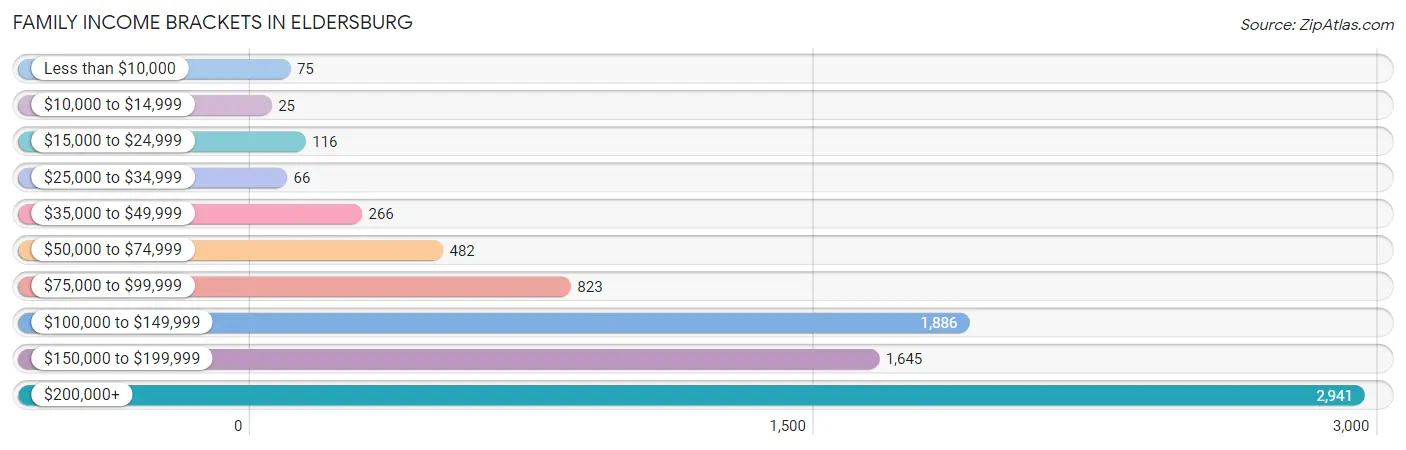
| Income Bracket | # Families | % Families |
| Less than $10,000 | 75 | 0.9% |
| $10,000 to $14,999 | 25 | 0.3% |
| $15,000 to $24,999 | 116 | 1.4% |
| $25,000 to $34,999 | 66 | 0.8% |
| $35,000 to $49,999 | 266 | 3.2% |
| $50,000 to $74,999 | 482 | 5.8% |
| $75,000 to $99,999 | 823 | 9.9% |
| $100,000 to $149,999 | 1,886 | 22.7% |
| $150,000 to $199,999 | 1,645 | 19.8% |
| $200,000+ | 2,941 | 35.4% |
Family Income by Famaliy Size in Eldersburg
7+ person families (46 | 0.5%) account for the highest median family income in Eldersburg with $199,688 per family, while 2-person families (3,162 | 38.1%) have the highest median income of $67,168 per family member.
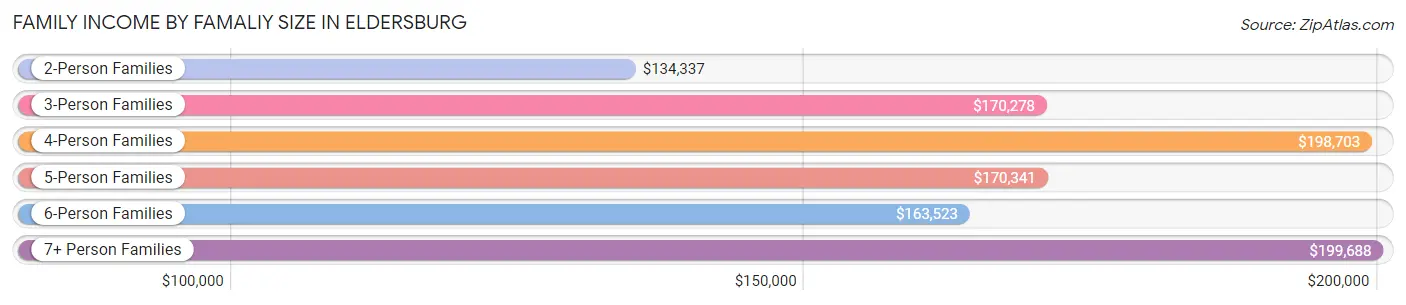
| Income Bracket | # Families | Median Income |
| 2-Person Families | 3,162 (38.1%) | $134,337 |
| 3-Person Families | 2,108 (25.4%) | $170,278 |
| 4-Person Families | 2,055 (24.7%) | $198,703 |
| 5-Person Families | 683 (8.2%) | $170,341 |
| 6-Person Families | 255 (3.1%) | $163,523 |
| 7+ Person Families | 46 (0.5%) | $199,688 |
| Total | 8,309 (100.0%) | $164,350 |
Family Income by Number of Earners in Eldersburg
The median family income in Eldersburg is $164,350, with families comprising 3+ earners (1,396) having the highest median family income of $224,063, while families with no earners (793) have the lowest median family income of $78,450, accounting for 16.8% and 9.5% of families, respectively.
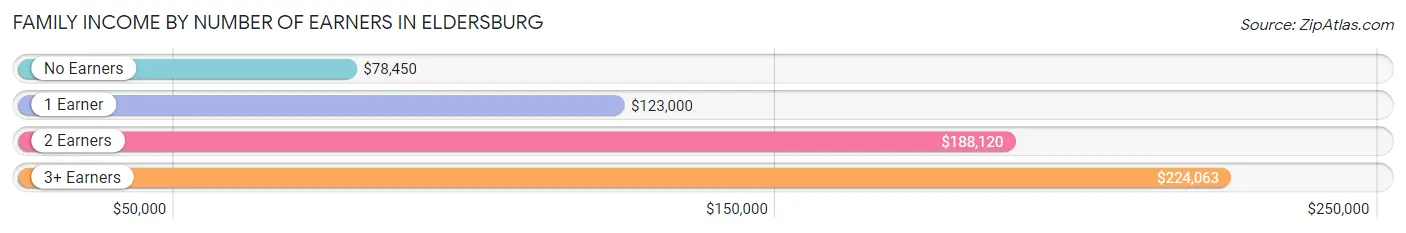
| Number of Earners | # Families | Median Income |
| No Earners | 793 (9.5%) | $78,450 |
| 1 Earner | 1,810 (21.8%) | $123,000 |
| 2 Earners | 4,310 (51.9%) | $188,120 |
| 3+ Earners | 1,396 (16.8%) | $224,063 |
| Total | 8,309 (100.0%) | $164,350 |
Household Income in Eldersburg
Household Income Brackets in Eldersburg
With 3,183 households falling in the category, the $200,000+ income range is the most frequent in Eldersburg, accounting for 30.1% of all households. In contrast, only 74 households (0.7%) fall into the $10,000 to $14,999 income bracket, making it the least populous group.
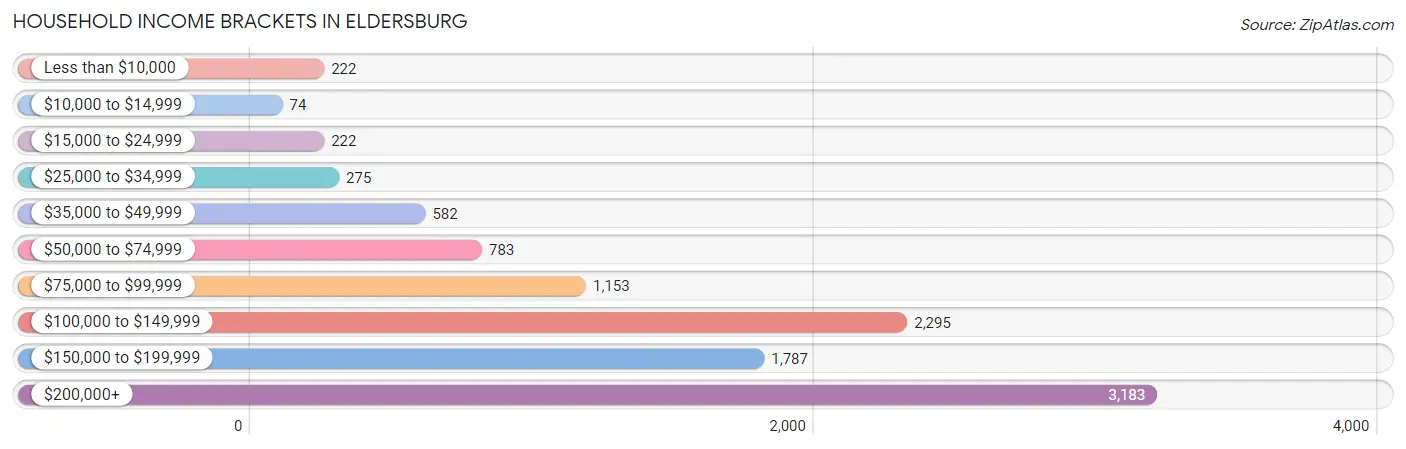
| Income Bracket | # Households | % Households |
| Less than $10,000 | 222 | 2.1% |
| $10,000 to $14,999 | 74 | 0.7% |
| $15,000 to $24,999 | 222 | 2.1% |
| $25,000 to $34,999 | 275 | 2.6% |
| $35,000 to $49,999 | 582 | 5.5% |
| $50,000 to $74,999 | 783 | 7.4% |
| $75,000 to $99,999 | 1,153 | 10.9% |
| $100,000 to $149,999 | 2,295 | 21.7% |
| $150,000 to $199,999 | 1,787 | 16.9% |
| $200,000+ | 3,183 | 30.1% |
Household Income by Householder Age in Eldersburg
The median household income in Eldersburg is $143,148, with the highest median household income of $168,097 found in the 45 to 64 years age bracket for the primary householder. A total of 4,765 households (45.1%) fall into this category. Meanwhile, the 65+ years age bracket for the primary householder has the lowest median household income of $86,071, with 2,542 households (24.0%) in this group.
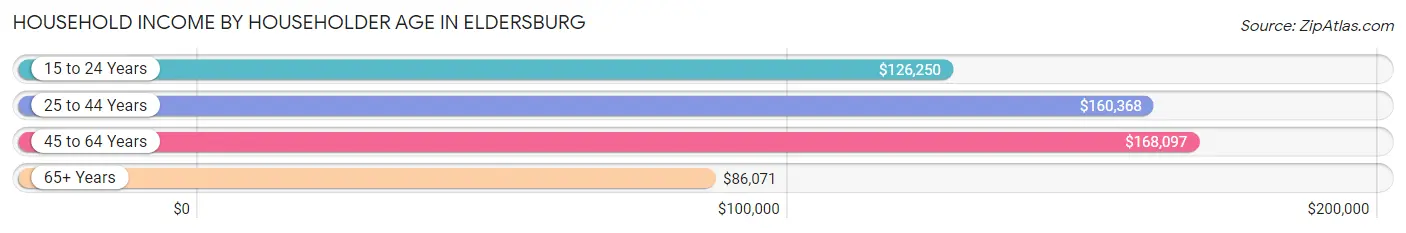
| Income Bracket | # Households | Median Income |
| 15 to 24 Years | 39 (0.4%) | $126,250 |
| 25 to 44 Years | 3,229 (30.5%) | $160,368 |
| 45 to 64 Years | 4,765 (45.1%) | $168,097 |
| 65+ Years | 2,542 (24.0%) | $86,071 |
| Total | 10,575 (100.0%) | $143,148 |
Poverty in Eldersburg
Income Below Poverty by Sex and Age in Eldersburg
With 3.3% poverty level for males and 4.0% for females among the residents of Eldersburg, 5 year old males and 75 year old and over females are the most vulnerable to poverty, with 18 males (10.4%) and 97 females (8.7%) in their respective age groups living below the poverty level.
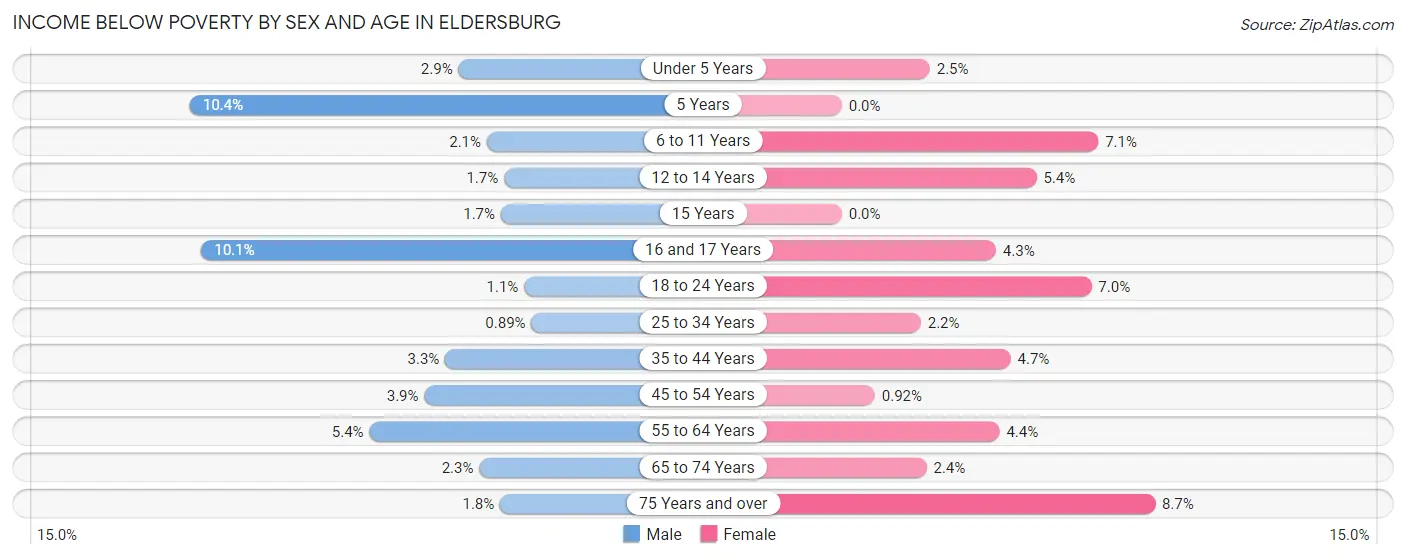
| Age Bracket | Male | Female |
| Under 5 Years | 24 (2.9%) | 20 (2.5%) |
| 5 Years | 18 (10.4%) | 0 (0.0%) |
| 6 to 11 Years | 25 (2.1%) | 72 (7.1%) |
| 12 to 14 Years | 11 (1.7%) | 37 (5.4%) |
| 15 Years | 4 (1.7%) | 0 (0.0%) |
| 16 and 17 Years | 49 (10.1%) | 21 (4.3%) |
| 18 to 24 Years | 10 (1.1%) | 79 (7.0%) |
| 25 to 34 Years | 13 (0.9%) | 39 (2.2%) |
| 35 to 44 Years | 68 (3.3%) | 94 (4.7%) |
| 45 to 54 Years | 90 (3.9%) | 20 (0.9%) |
| 55 to 64 Years | 121 (5.4%) | 92 (4.4%) |
| 65 to 74 Years | 28 (2.3%) | 31 (2.4%) |
| 75 Years and over | 13 (1.8%) | 97 (8.7%) |
| Total | 474 (3.3%) | 602 (4.0%) |
Income Above Poverty by Sex and Age in Eldersburg
According to the poverty statistics in Eldersburg, males aged 25 to 34 years and females aged 5 years are the age groups that are most secure financially, with 99.1% of males and 100.0% of females in these age groups living above the poverty line.
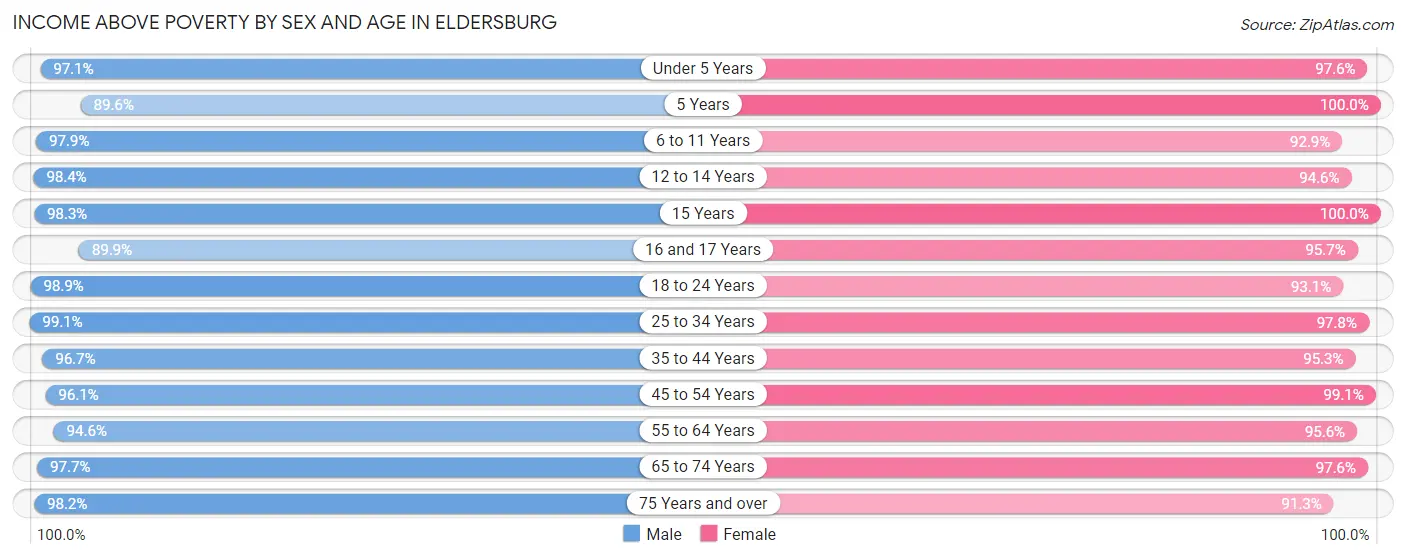
| Age Bracket | Male | Female |
| Under 5 Years | 798 (97.1%) | 796 (97.6%) |
| 5 Years | 155 (89.6%) | 290 (100.0%) |
| 6 to 11 Years | 1,149 (97.9%) | 936 (92.9%) |
| 12 to 14 Years | 656 (98.4%) | 646 (94.6%) |
| 15 Years | 226 (98.3%) | 151 (100.0%) |
| 16 and 17 Years | 437 (89.9%) | 469 (95.7%) |
| 18 to 24 Years | 908 (98.9%) | 1,057 (93.0%) |
| 25 to 34 Years | 1,454 (99.1%) | 1,734 (97.8%) |
| 35 to 44 Years | 2,000 (96.7%) | 1,907 (95.3%) |
| 45 to 54 Years | 2,238 (96.1%) | 2,159 (99.1%) |
| 55 to 64 Years | 2,119 (94.6%) | 2,006 (95.6%) |
| 65 to 74 Years | 1,169 (97.7%) | 1,284 (97.6%) |
| 75 Years and over | 727 (98.2%) | 1,015 (91.3%) |
| Total | 14,036 (96.7%) | 14,450 (96.0%) |
Income Below Poverty Among Married-Couple Families in Eldersburg
The poverty statistics for married-couple families in Eldersburg show that 1.0% or 71 of the total 7,328 families live below the poverty line. Families with 3 or 4 children have the highest poverty rate of 7.1%, comprising of 39 families. On the other hand, families with 5 or more children have the lowest poverty rate of 0.0%, which includes 0 families.
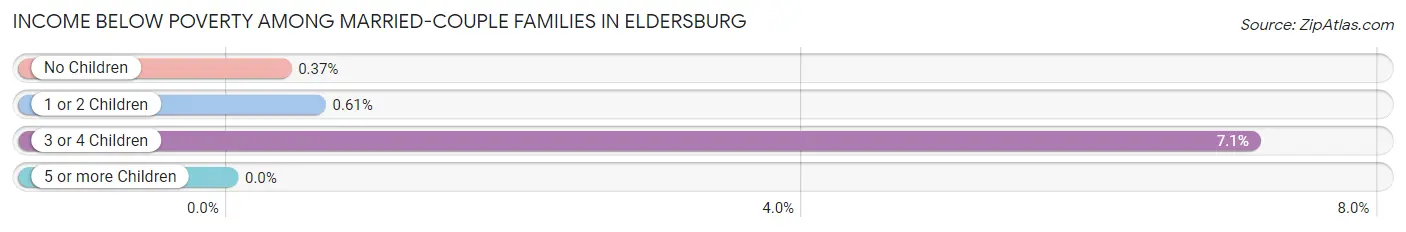
| Children | Above Poverty | Below Poverty |
| No Children | 3,797 (99.6%) | 14 (0.4%) |
| 1 or 2 Children | 2,940 (99.4%) | 18 (0.6%) |
| 3 or 4 Children | 509 (92.9%) | 39 (7.1%) |
| 5 or more Children | 11 (100.0%) | 0 (0.0%) |
| Total | 7,257 (99.0%) | 71 (1.0%) |
Income Below Poverty Among Single-Parent Households in Eldersburg
According to the poverty data in Eldersburg, 8.5% or 27 single-father households and 11.0% or 73 single-mother households are living below the poverty line. Among single-father households, those with 1 or 2 children have the highest poverty rate, with 27 households (13.7%) experiencing poverty. Likewise, among single-mother households, those with 1 or 2 children have the highest poverty rate, with 52 households (14.8%) falling below the poverty line.
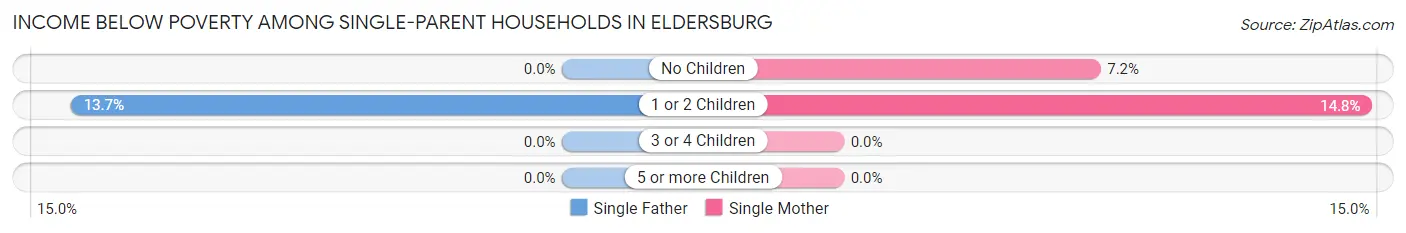
| Children | Single Father | Single Mother |
| No Children | 0 (0.0%) | 21 (7.2%) |
| 1 or 2 Children | 27 (13.7%) | 52 (14.8%) |
| 3 or 4 Children | 0 (0.0%) | 0 (0.0%) |
| 5 or more Children | 0 (0.0%) | 0 (0.0%) |
| Total | 27 (8.5%) | 73 (11.0%) |
Income Below Poverty Among Married-Couple vs Single-Parent Households in Eldersburg
The poverty data for Eldersburg shows that 71 of the married-couple family households (1.0%) and 100 of the single-parent households (10.2%) are living below the poverty level. Within the married-couple family households, those with 3 or 4 children have the highest poverty rate, with 39 households (7.1%) falling below the poverty line. Among the single-parent households, those with 1 or 2 children have the highest poverty rate, with 79 household (14.4%) living below poverty.
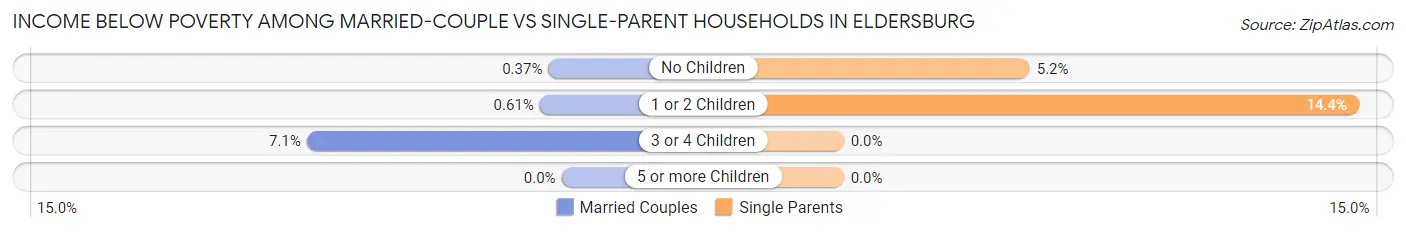
| Children | Married-Couple Families | Single-Parent Households |
| No Children | 14 (0.4%) | 21 (5.2%) |
| 1 or 2 Children | 18 (0.6%) | 79 (14.4%) |
| 3 or 4 Children | 39 (7.1%) | 0 (0.0%) |
| 5 or more Children | 0 (0.0%) | 0 (0.0%) |
| Total | 71 (1.0%) | 100 (10.2%) |
Race in Eldersburg
The most populous races in Eldersburg are White / Caucasian (25,326 | 83.4%), Black / African American (1,751 | 5.8%), and Two or more Races (1,455 | 4.8%).
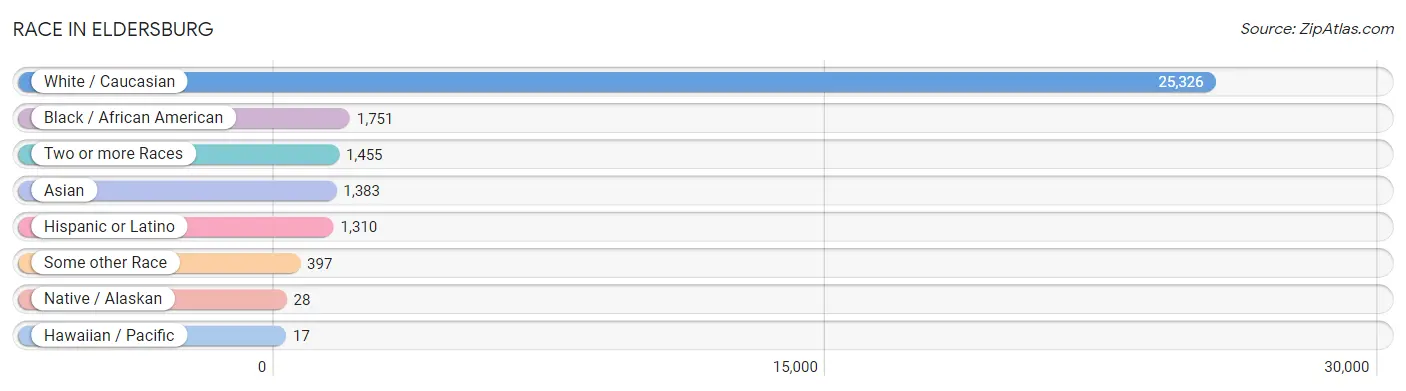
| Race | # Population | % Population |
| Asian | 1,383 | 4.6% |
| Black / African American | 1,751 | 5.8% |
| Hawaiian / Pacific | 17 | 0.1% |
| Hispanic or Latino | 1,310 | 4.3% |
| Native / Alaskan | 28 | 0.1% |
| White / Caucasian | 25,326 | 83.4% |
| Two or more Races | 1,455 | 4.8% |
| Some other Race | 397 | 1.3% |
| Total | 30,357 | 100.0% |
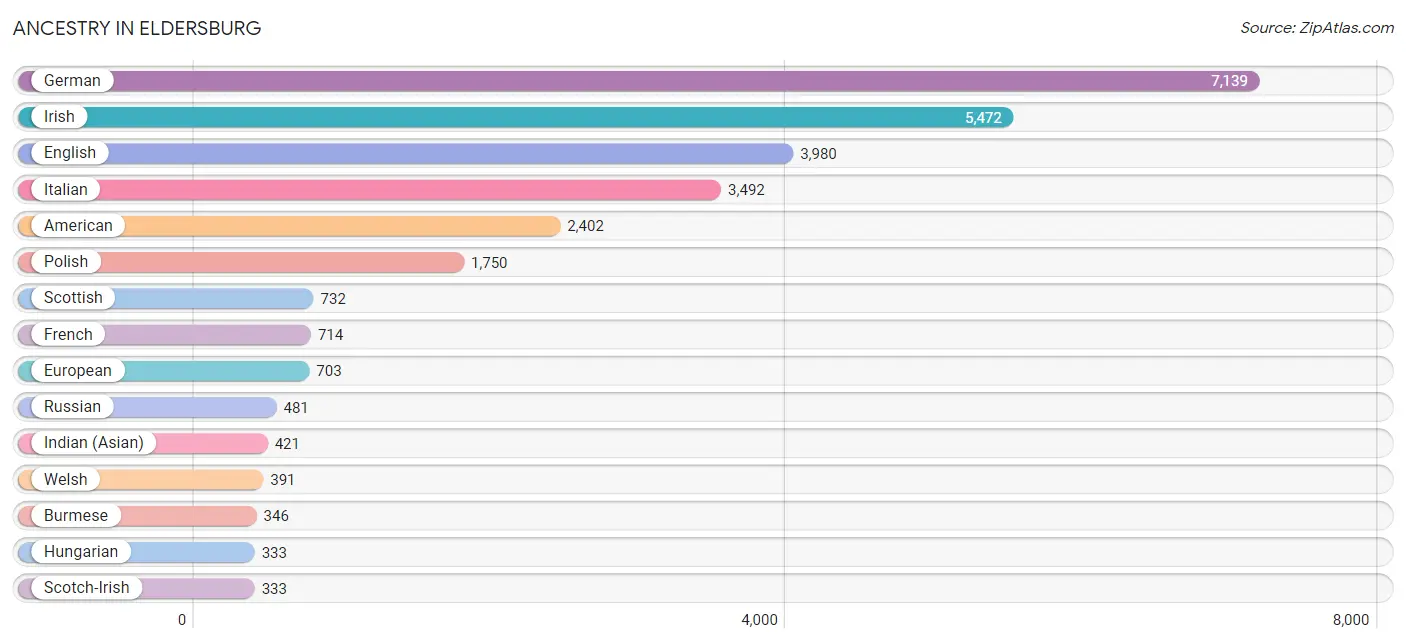
Ancestry in Eldersburg
The most populous ancestries reported in Eldersburg are German (7,139 | 23.5%), Irish (5,472 | 18.0%), English (3,980 | 13.1%), Italian (3,492 | 11.5%), and American (2,402 | 7.9%), together accounting for 74.1% of all Eldersburg residents.
| Ancestry | # Population | % Population |
| Afghan | 22 | 0.1% |
| African | 195 | 0.6% |
| American | 2,402 | 7.9% |
| Arab | 25 | 0.1% |
| Argentinean | 5 | 0.0% |
| Armenian | 21 | 0.1% |
| Australian | 13 | 0.0% |
| Austrian | 36 | 0.1% |
| Bhutanese | 108 | 0.4% |
| Blackfeet | 26 | 0.1% |
| Bolivian | 41 | 0.1% |
| British | 283 | 0.9% |
| Burmese | 346 | 1.1% |
| Canadian | 75 | 0.3% |
| Celtic | 67 | 0.2% |
| Central American | 224 | 0.7% |
| Central American Indian | 21 | 0.1% |
| Cherokee | 27 | 0.1% |
| Cheyenne | 8 | 0.0% |
| Chilean | 9 | 0.0% |
| Colombian | 4 | 0.0% |
| Croatian | 27 | 0.1% |
| Cuban | 105 | 0.4% |
| Czech | 133 | 0.4% |
| Czechoslovakian | 19 | 0.1% |
| Danish | 41 | 0.1% |
| Dominican | 55 | 0.2% |
| Dutch | 277 | 0.9% |
| Eastern European | 225 | 0.7% |
| Ecuadorian | 94 | 0.3% |
| Egyptian | 9 | 0.0% |
| English | 3,980 | 13.1% |
| European | 703 | 2.3% |
| Filipino | 18 | 0.1% |
| Finnish | 30 | 0.1% |
| French | 714 | 2.4% |
| French Canadian | 144 | 0.5% |
| German | 7,139 | 23.5% |
| Greek | 209 | 0.7% |
| Guatemalan | 34 | 0.1% |
| Haitian | 13 | 0.0% |
| Hungarian | 333 | 1.1% |
| Indian (Asian) | 421 | 1.4% |
| Indonesian | 26 | 0.1% |
| Irish | 5,472 | 18.0% |
| Israeli | 50 | 0.2% |
| Italian | 3,492 | 11.5% |
| Jamaican | 17 | 0.1% |
| Japanese | 20 | 0.1% |
| Korean | 319 | 1.1% |
| Laotian | 79 | 0.3% |
| Latvian | 19 | 0.1% |
| Lebanese | 9 | 0.0% |
| Lithuanian | 214 | 0.7% |
| Mexican | 325 | 1.1% |
| Nicaraguan | 27 | 0.1% |
| Nigerian | 49 | 0.2% |
| Northern European | 65 | 0.2% |
| Norwegian | 56 | 0.2% |
| Pennsylvania German | 14 | 0.1% |
| Peruvian | 58 | 0.2% |
| Polish | 1,750 | 5.8% |
| Portuguese | 86 | 0.3% |
| Potawatomi | 5 | 0.0% |
| Puerto Rican | 231 | 0.8% |
| Romanian | 35 | 0.1% |
| Russian | 481 | 1.6% |
| Salvadoran | 163 | 0.5% |
| Scandinavian | 92 | 0.3% |
| Scotch-Irish | 333 | 1.1% |
| Scottish | 732 | 2.4% |
| Serbian | 25 | 0.1% |
| Slavic | 25 | 0.1% |
| Slovak | 211 | 0.7% |
| South African | 17 | 0.1% |
| South American | 236 | 0.8% |
| Spaniard | 117 | 0.4% |
| Spanish | 11 | 0.0% |
| Sri Lankan | 94 | 0.3% |
| Subsaharan African | 297 | 1.0% |
| Swedish | 289 | 0.9% |
| Swiss | 10 | 0.0% |
| Thai | 321 | 1.1% |
| Tongan | 17 | 0.1% |
| Turkish | 82 | 0.3% |
| Ukrainian | 163 | 0.5% |
| Venezuelan | 25 | 0.1% |
| Welsh | 391 | 1.3% | View All 88 Rows |
Immigrants in Eldersburg
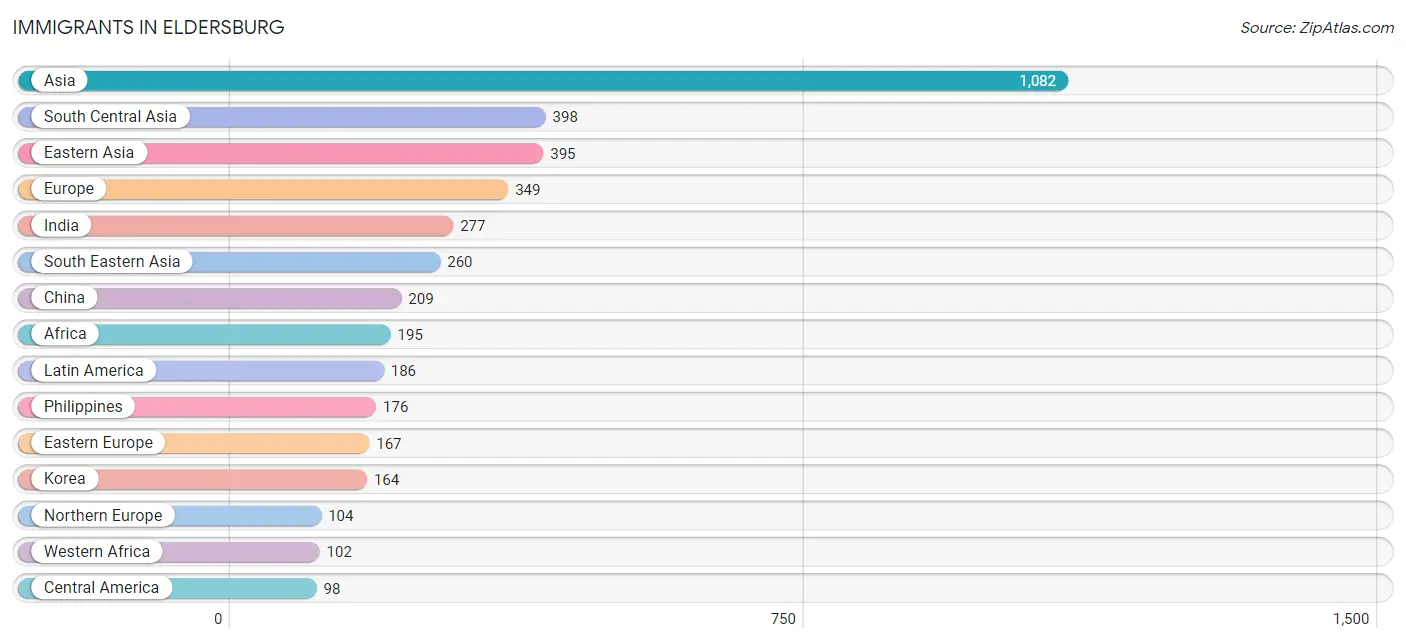
The most numerous immigrant groups reported in Eldersburg came from Asia (1,082 | 3.6%), South Central Asia (398 | 1.3%), Eastern Asia (395 | 1.3%), Europe (349 | 1.1%), and India (277 | 0.9%), together accounting for 8.2% of all Eldersburg residents.
| Immigration Origin | # Population | % Population |
| Afghanistan | 11 | 0.0% |
| Africa | 195 | 0.6% |
| Argentina | 5 | 0.0% |
| Asia | 1,082 | 3.6% |
| Bolivia | 15 | 0.1% |
| Brazil | 6 | 0.0% |
| Cameroon | 36 | 0.1% |
| Canada | 82 | 0.3% |
| Caribbean | 7 | 0.0% |
| Central America | 98 | 0.3% |
| Chile | 5 | 0.0% |
| China | 209 | 0.7% |
| Colombia | 25 | 0.1% |
| Czechoslovakia | 34 | 0.1% |
| Eastern Asia | 395 | 1.3% |
| Eastern Europe | 167 | 0.5% |
| Egypt | 40 | 0.1% |
| El Salvador | 88 | 0.3% |
| England | 66 | 0.2% |
| Europe | 349 | 1.1% |
| Germany | 37 | 0.1% |
| Greece | 30 | 0.1% |
| Guatemala | 10 | 0.0% |
| India | 277 | 0.9% |
| Indonesia | 33 | 0.1% |
| Iran | 25 | 0.1% |
| Ireland | 18 | 0.1% |
| Japan | 22 | 0.1% |
| Korea | 164 | 0.5% |
| Latin America | 186 | 0.6% |
| Liberia | 3 | 0.0% |
| Middle Africa | 36 | 0.1% |
| Moldova | 8 | 0.0% |
| Nigeria | 70 | 0.2% |
| Northern Africa | 40 | 0.1% |
| Northern Europe | 104 | 0.3% |
| Pakistan | 85 | 0.3% |
| Philippines | 176 | 0.6% |
| Poland | 17 | 0.1% |
| Russia | 71 | 0.2% |
| Sierra Leone | 29 | 0.1% |
| South Africa | 17 | 0.1% |
| South America | 81 | 0.3% |
| South Central Asia | 398 | 1.3% |
| South Eastern Asia | 260 | 0.9% |
| Southern Europe | 41 | 0.1% |
| Spain | 11 | 0.0% |
| Sweden | 7 | 0.0% |
| Taiwan | 22 | 0.1% |
| Trinidad and Tobago | 7 | 0.0% |
| Turkey | 29 | 0.1% |
| Ukraine | 37 | 0.1% |
| Venezuela | 25 | 0.1% |
| Vietnam | 25 | 0.1% |
| Western Africa | 102 | 0.3% |
| Western Asia | 29 | 0.1% |
| Western Europe | 37 | 0.1% | View All 57 Rows |
Sex and Age in Eldersburg
Sex and Age in Eldersburg
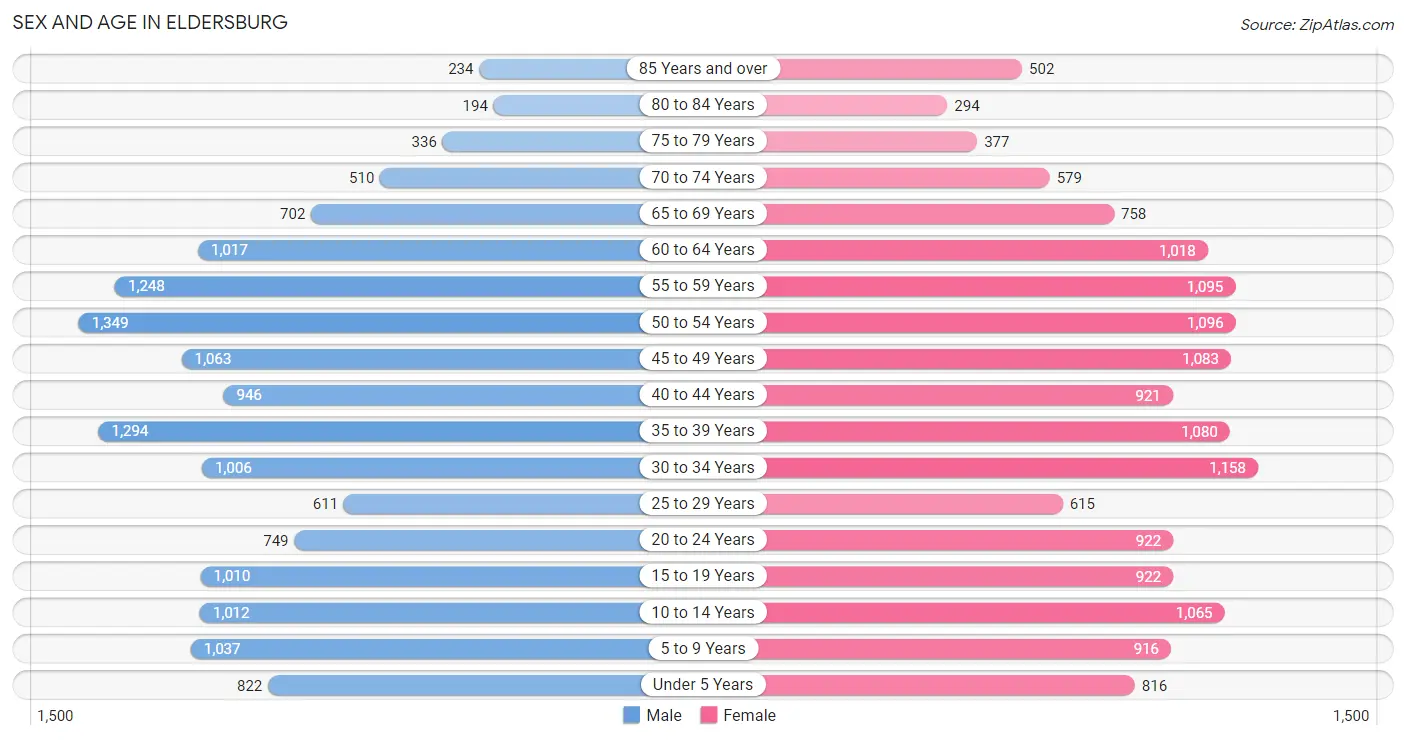
The most populous age groups in Eldersburg are 50 to 54 Years (1,349 | 8.9%) for men and 30 to 34 Years (1,158 | 7.6%) for women.
| Age Bracket | Male | Female |
| Under 5 Years | 822 (5.4%) | 816 (5.4%) |
| 5 to 9 Years | 1,037 (6.9%) | 916 (6.0%) |
| 10 to 14 Years | 1,012 (6.7%) | 1,065 (7.0%) |
| 15 to 19 Years | 1,010 (6.7%) | 922 (6.1%) |
| 20 to 24 Years | 749 (5.0%) | 922 (6.1%) |
| 25 to 29 Years | 611 (4.0%) | 615 (4.0%) |
| 30 to 34 Years | 1,006 (6.6%) | 1,158 (7.6%) |
| 35 to 39 Years | 1,294 (8.6%) | 1,080 (7.1%) |
| 40 to 44 Years | 946 (6.2%) | 921 (6.0%) |
| 45 to 49 Years | 1,063 (7.0%) | 1,083 (7.1%) |
| 50 to 54 Years | 1,349 (8.9%) | 1,096 (7.2%) |
| 55 to 59 Years | 1,248 (8.2%) | 1,095 (7.2%) |
| 60 to 64 Years | 1,017 (6.7%) | 1,018 (6.7%) |
| 65 to 69 Years | 702 (4.6%) | 758 (5.0%) |
| 70 to 74 Years | 510 (3.4%) | 579 (3.8%) |
| 75 to 79 Years | 336 (2.2%) | 377 (2.5%) |
| 80 to 84 Years | 194 (1.3%) | 294 (1.9%) |
| 85 Years and over | 234 (1.5%) | 502 (3.3%) |
| Total | 15,140 (100.0%) | 15,217 (100.0%) |
Families and Households in Eldersburg
Median Family Size in Eldersburg
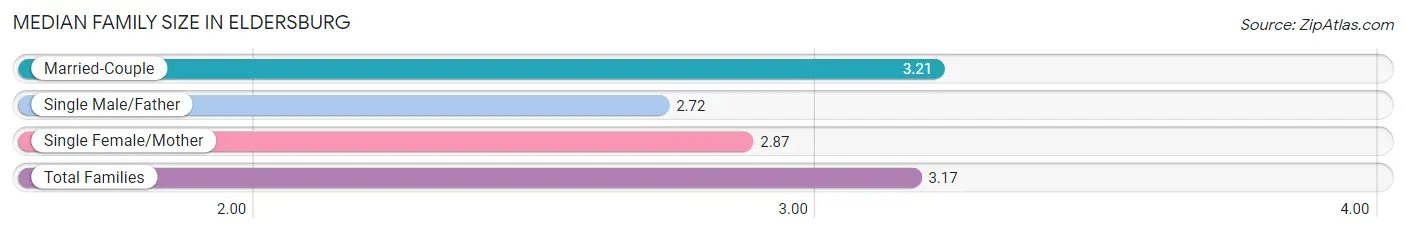
The median family size in Eldersburg is 3.17 persons per family, with married-couple families (7,328 | 88.2%) accounting for the largest median family size of 3.21 persons per family. On the other hand, single male/father families (318 | 3.8%) represent the smallest median family size with 2.72 persons per family.
| Family Type | # Families | Family Size |
| Married-Couple | 7,328 (88.2%) | 3.21 |
| Single Male/Father | 318 (3.8%) | 2.72 |
| Single Female/Mother | 663 (8.0%) | 2.87 |
| Total Families | 8,309 (100.0%) | 3.17 |
Median Household Size in Eldersburg
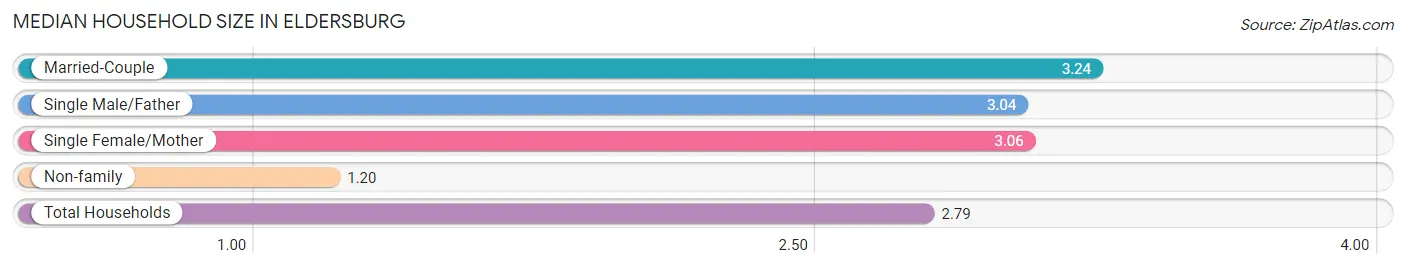
The median household size in Eldersburg is 2.79 persons per household, with married-couple households (7,328 | 69.3%) accounting for the largest median household size of 3.24 persons per household. non-family households (2,266 | 21.4%) represent the smallest median household size with 1.20 persons per household.
| Household Type | # Households | Household Size |
| Married-Couple | 7,328 (69.3%) | 3.24 |
| Single Male/Father | 318 (3.0%) | 3.04 |
| Single Female/Mother | 663 (6.3%) | 3.06 |
| Non-family | 2,266 (21.4%) | 1.20 |
| Total Households | 10,575 (100.0%) | 2.79 |
Household Size by Marriage Status in Eldersburg
Out of a total of 10,575 households in Eldersburg, 8,309 (78.6%) are family households, while 2,266 (21.4%) are nonfamily households. The most numerous type of family households are 2-person households, comprising 3,029, and the most common type of nonfamily households are 1-person households, comprising 1,870.
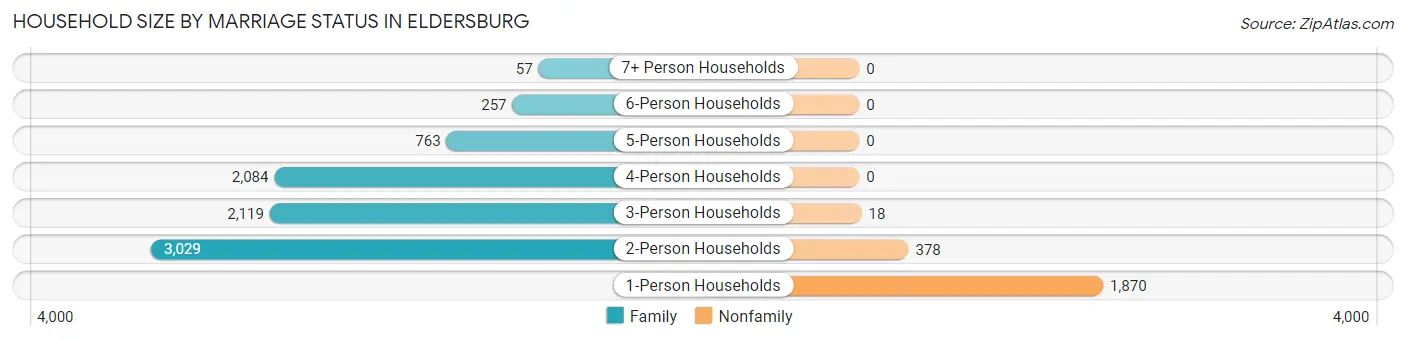
| Household Size | Family Households | Nonfamily Households |
| 1-Person Households | - | 1,870 (17.7%) |
| 2-Person Households | 3,029 (28.6%) | 378 (3.6%) |
| 3-Person Households | 2,119 (20.0%) | 18 (0.2%) |
| 4-Person Households | 2,084 (19.7%) | 0 (0.0%) |
| 5-Person Households | 763 (7.2%) | 0 (0.0%) |
| 6-Person Households | 257 (2.4%) | 0 (0.0%) |
| 7+ Person Households | 57 (0.5%) | 0 (0.0%) |
| Total | 8,309 (78.6%) | 2,266 (21.4%) |
Female Fertility in Eldersburg
Fertility by Age in Eldersburg
Average fertility rate in Eldersburg is 52.0 births per 1,000 women. Women in the age bracket of 20 to 34 years have the highest fertility rate with 97.0 births per 1,000 women. Women in the age bracket of 20 to 34 years acount for 72.6% of all women with births.
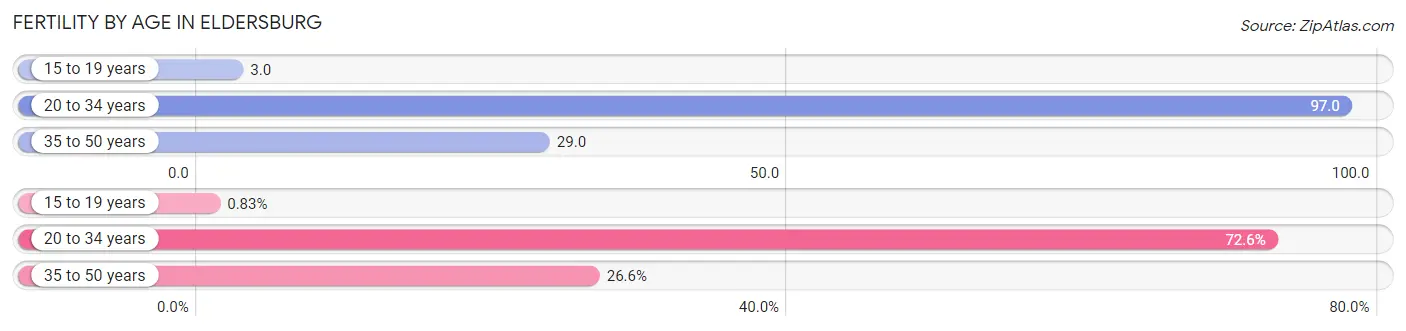
| Age Bracket | Women with Births | Births / 1,000 Women |
| 15 to 19 years | 3 (0.8%) | 3.0 |
| 20 to 34 years | 262 (72.6%) | 97.0 |
| 35 to 50 years | 96 (26.6%) | 29.0 |
| Total | 361 (100.0%) | 52.0 |
Fertility by Age by Marriage Status in Eldersburg
67.9% of women with births (361) in Eldersburg are married. The highest percentage of unmarried women with births falls into 15 to 19 years age bracket with 100.0% of them unmarried at the time of birth, while the lowest percentage of unmarried women with births belong to 35 to 50 years age bracket with 13.5% of them unmarried.
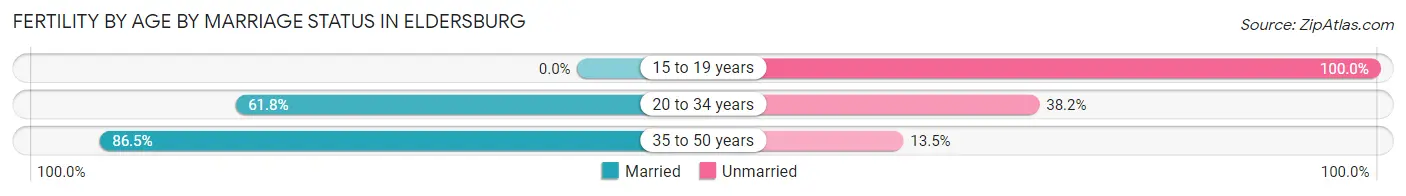
| Age Bracket | Married | Unmarried |
| 15 to 19 years | 0 (0.0%) | 3 (100.0%) |
| 20 to 34 years | 162 (61.8%) | 100 (38.2%) |
| 35 to 50 years | 83 (86.5%) | 13 (13.5%) |
| Total | 245 (67.9%) | 116 (32.1%) |
Fertility by Education in Eldersburg
Average fertility rate in Eldersburg is 52.0 births per 1,000 women. Women with the education attainment of graduate degree have the highest fertility rate of 108.0 births per 1,000 women, while women with the education attainment of less than high school have the lowest fertility at 4.0 births per 1,000 women. Women with the education attainment of graduate degree represent 43.2% of all women with births.
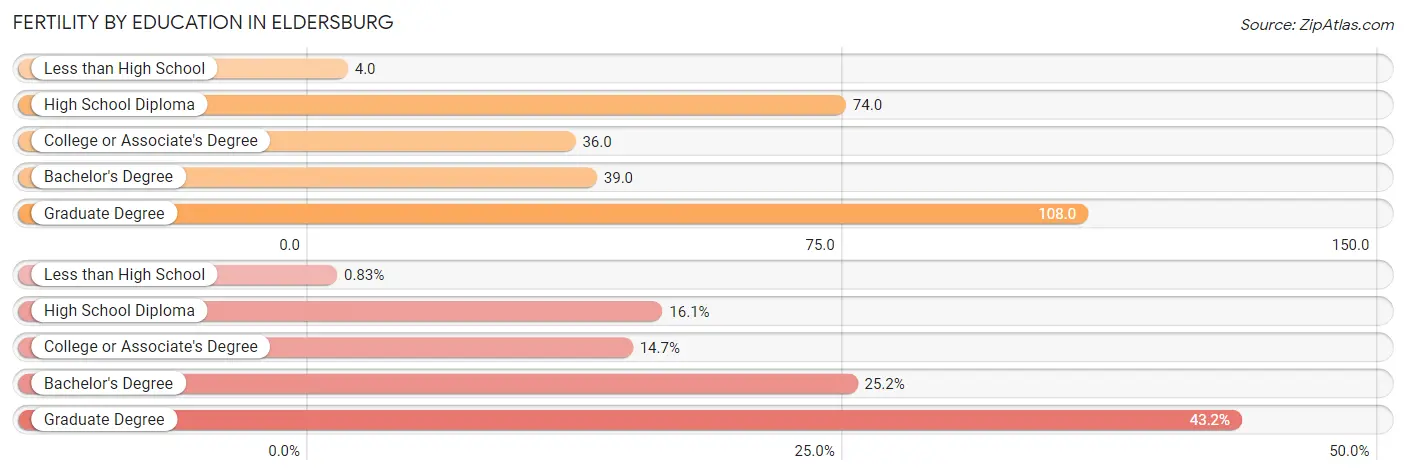
| Educational Attainment | Women with Births | Births / 1,000 Women |
| Less than High School | 3 (0.8%) | 4.0 |
| High School Diploma | 58 (16.1%) | 74.0 |
| College or Associate's Degree | 53 (14.7%) | 36.0 |
| Bachelor's Degree | 91 (25.2%) | 39.0 |
| Graduate Degree | 156 (43.2%) | 108.0 |
| Total | 361 (100.0%) | 52.0 |
Fertility by Education by Marriage Status in Eldersburg
32.1% of women with births in Eldersburg are unmarried. Women with the educational attainment of graduate degree are most likely to be married with 100.0% of them married at childbirth, while women with the educational attainment of less than high school are least likely to be married with 100.0% of them unmarried at childbirth.
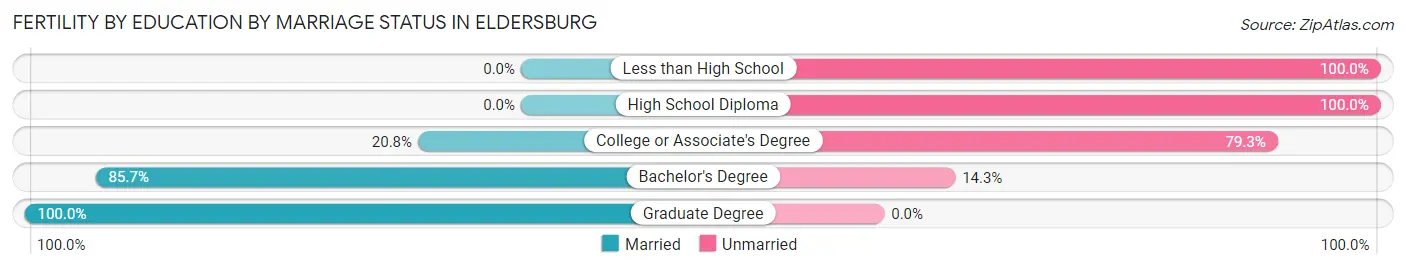
| Educational Attainment | Married | Unmarried |
| Less than High School | 0 (0.0%) | 3 (100.0%) |
| High School Diploma | 0 (0.0%) | 58 (100.0%) |
| College or Associate's Degree | 11 (20.7%) | 42 (79.2%) |
| Bachelor's Degree | 78 (85.7%) | 13 (14.3%) |
| Graduate Degree | 156 (100.0%) | 0 (0.0%) |
| Total | 245 (67.9%) | 116 (32.1%) |
Employment Characteristics in Eldersburg
Employment by Class of Employer in Eldersburg
Among the 15,970 employed individuals in Eldersburg, private company employees (9,577 | 60.0%), federal government employees (1,581 | 9.9%), and local government employees (1,447 | 9.1%) make up the most common classes of employment.
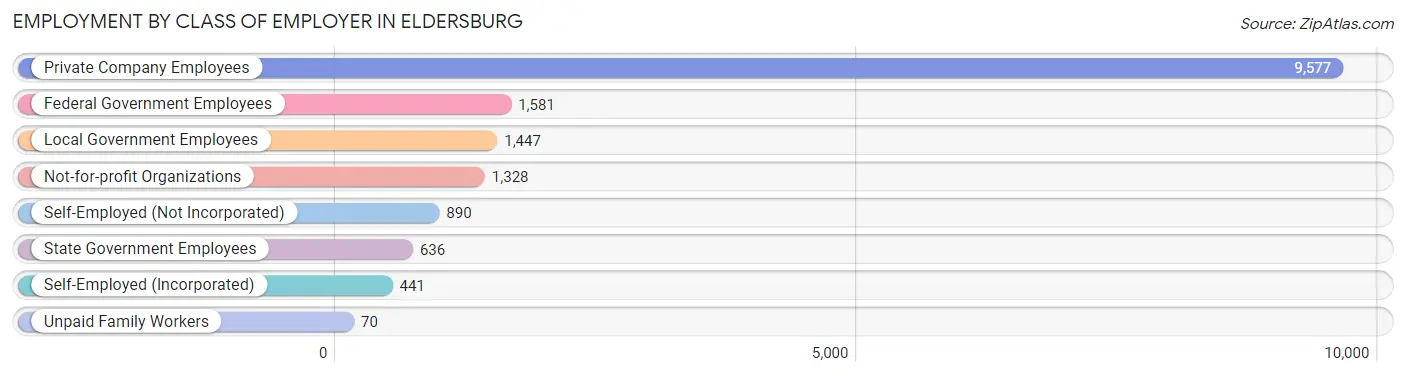
| Employer Class | # Employees | % Employees |
| Private Company Employees | 9,577 | 60.0% |
| Self-Employed (Incorporated) | 441 | 2.8% |
| Self-Employed (Not Incorporated) | 890 | 5.6% |
| Not-for-profit Organizations | 1,328 | 8.3% |
| Local Government Employees | 1,447 | 9.1% |
| State Government Employees | 636 | 4.0% |
| Federal Government Employees | 1,581 | 9.9% |
| Unpaid Family Workers | 70 | 0.4% |
| Total | 15,970 | 100.0% |
Employment Status by Age in Eldersburg
According to the labor force statistics for Eldersburg, out of the total population over 16 years of age (24,268), 68.7% or 16,672 individuals are in the labor force, with 2.6% or 433 of them unemployed. The age group with the highest labor force participation rate is 45 to 54 years, with 90.5% or 4,155 individuals in the labor force. Within the labor force, the 16 to 19 years age range has the highest percentage of unemployed individuals, with 8.9% or 48 of them being unemployed.
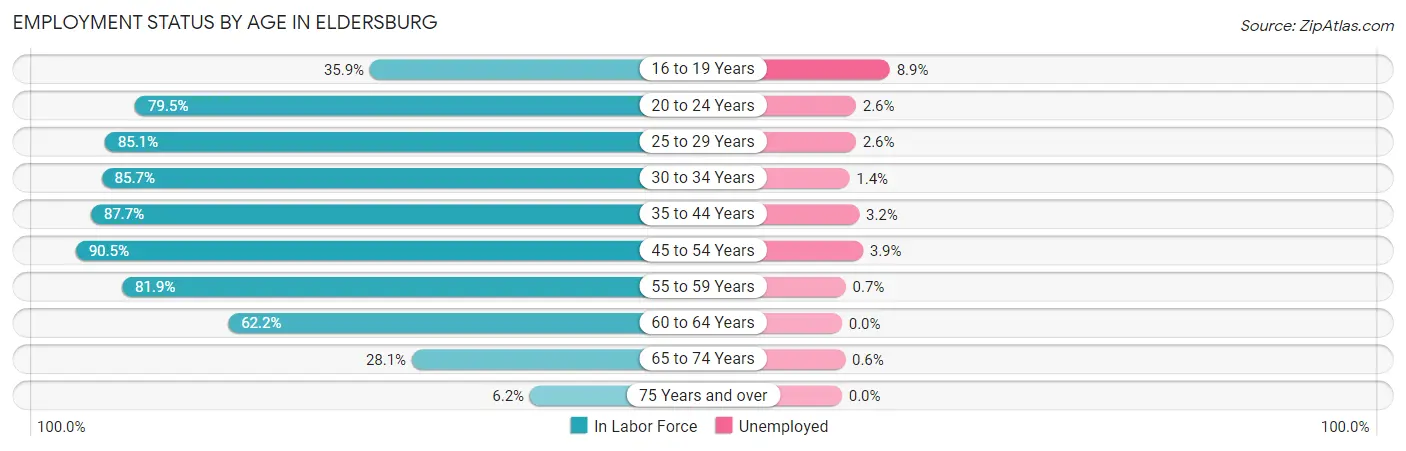
| Age Bracket | In Labor Force | Unemployed |
| 16 to 19 Years | 542 (35.9%) | 48 (8.9%) |
| 20 to 24 Years | 1,328 (79.5%) | 35 (2.6%) |
| 25 to 29 Years | 1,043 (85.1%) | 27 (2.6%) |
| 30 to 34 Years | 1,855 (85.7%) | 26 (1.4%) |
| 35 to 44 Years | 3,719 (87.7%) | 119 (3.2%) |
| 45 to 54 Years | 4,155 (90.5%) | 162 (3.9%) |
| 55 to 59 Years | 1,919 (81.9%) | 13 (0.7%) |
| 60 to 64 Years | 1,266 (62.2%) | 0 (0.0%) |
| 65 to 74 Years | 716 (28.1%) | 4 (0.6%) |
| 75 Years and over | 120 (6.2%) | 0 (0.0%) |
| Total | 16,672 (68.7%) | 433 (2.6%) |
Employment Status by Educational Attainment in Eldersburg
According to labor force statistics for Eldersburg, 84.1% of individuals (13,961) out of the total population between 25 and 64 years of age (16,600) are in the labor force, with 2.5% or 349 of them being unemployed. The group with the highest labor force participation rate are those with the educational attainment of bachelor's degree or higher, with 90.8% or 8,530 individuals in the labor force. Within the labor force, individuals with less than high school education have the highest percentage of unemployment, with 8.7% or 34 of them being unemployed.
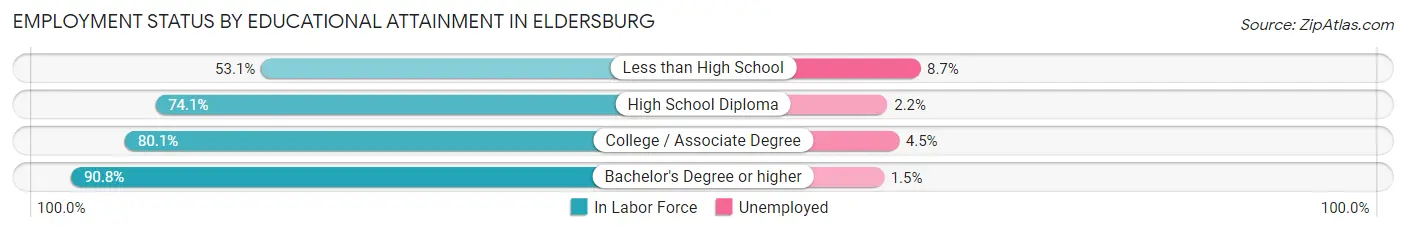
| Educational Attainment | In Labor Force | Unemployed |
| Less than High School | 393 (53.1%) | 64 (8.7%) |
| High School Diploma | 1,784 (74.1%) | 53 (2.2%) |
| College / Associate Degree | 3,251 (80.1%) | 183 (4.5%) |
| Bachelor's Degree or higher | 8,530 (90.8%) | 141 (1.5%) |
| Total | 13,961 (84.1%) | 415 (2.5%) |
Employment Occupations by Sex in Eldersburg
Management, Business, Science and Arts Occupations
The most common Management, Business, Science and Arts occupations in Eldersburg are Management (2,836 | 17.6%), Computers, Engineering & Science (2,145 | 13.4%), Community & Social Service (2,095 | 13.0%), Education Instruction & Library (1,359 | 8.5%), and Business & Financial (1,329 | 8.3%).
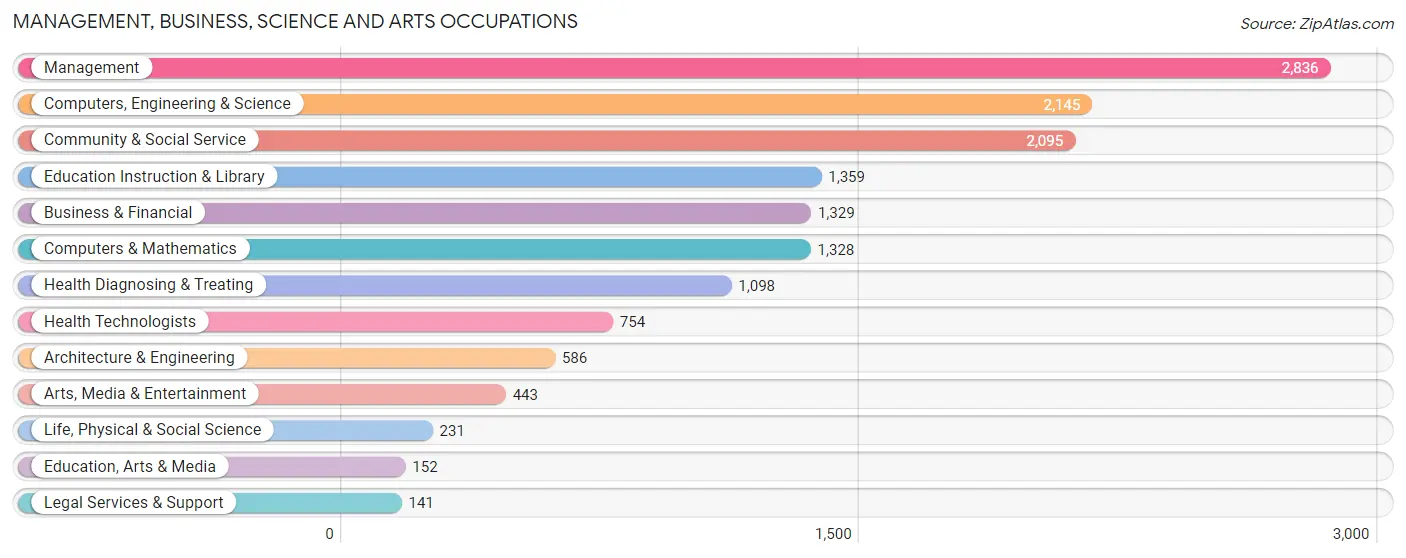
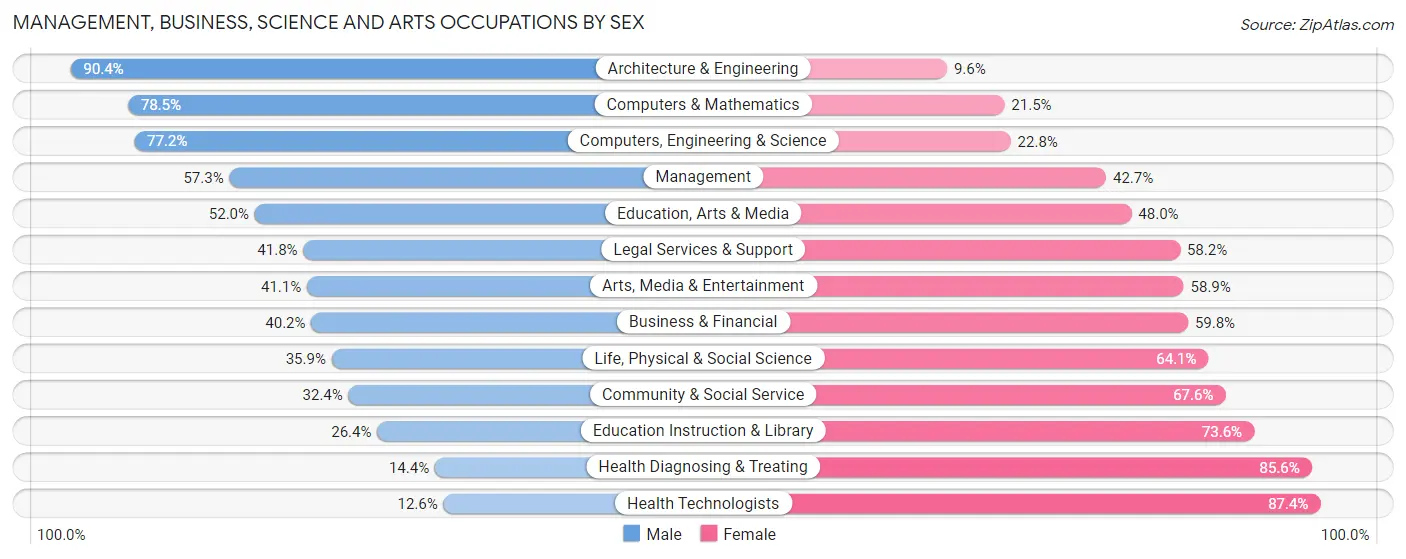
Management, Business, Science and Arts Occupations by Sex
Within the Management, Business, Science and Arts occupations in Eldersburg, the most male-oriented occupations are Architecture & Engineering (90.4%), Computers & Mathematics (78.5%), and Computers, Engineering & Science (77.2%), while the most female-oriented occupations are Health Technologists (87.4%), Health Diagnosing & Treating (85.6%), and Education Instruction & Library (73.6%).
| Occupation | Male | Female |
| Management | 1,624 (57.3%) | 1,212 (42.7%) |
| Business & Financial | 534 (40.2%) | 795 (59.8%) |
| Computers, Engineering & Science | 1,655 (77.2%) | 490 (22.8%) |
| Computers & Mathematics | 1,042 (78.5%) | 286 (21.5%) |
| Architecture & Engineering | 530 (90.4%) | 56 (9.6%) |
| Life, Physical & Social Science | 83 (35.9%) | 148 (64.1%) |
| Community & Social Service | 679 (32.4%) | 1,416 (67.6%) |
| Education, Arts & Media | 79 (52.0%) | 73 (48.0%) |
| Legal Services & Support | 59 (41.8%) | 82 (58.2%) |
| Education Instruction & Library | 359 (26.4%) | 1,000 (73.6%) |
| Arts, Media & Entertainment | 182 (41.1%) | 261 (58.9%) |
| Health Diagnosing & Treating | 158 (14.4%) | 940 (85.6%) |
| Health Technologists | 95 (12.6%) | 659 (87.4%) |
| Total (Category) | 4,650 (48.9%) | 4,853 (51.1%) |
| Total (Overall) | 8,372 (52.1%) | 7,700 (47.9%) |
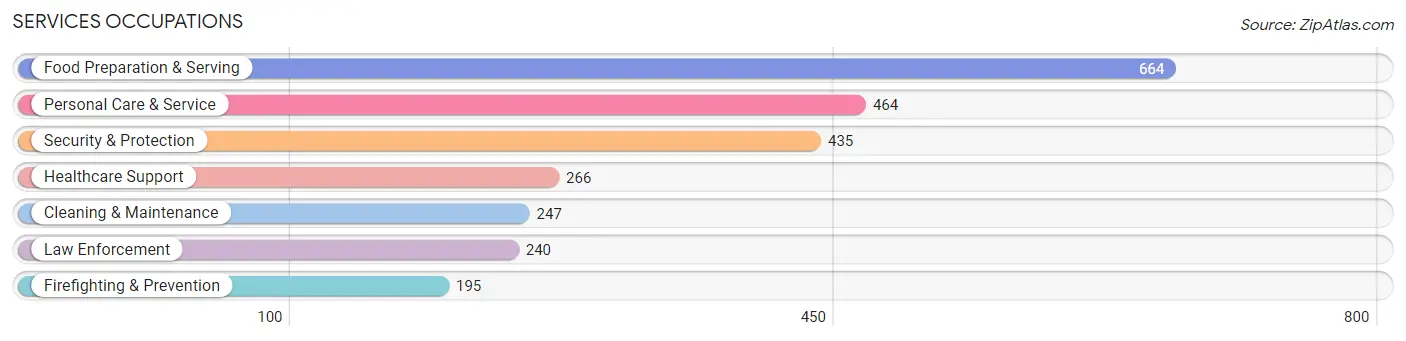
Services Occupations
The most common Services occupations in Eldersburg are Food Preparation & Serving (664 | 4.1%), Personal Care & Service (464 | 2.9%), Security & Protection (435 | 2.7%), Healthcare Support (266 | 1.7%), and Cleaning & Maintenance (247 | 1.5%).
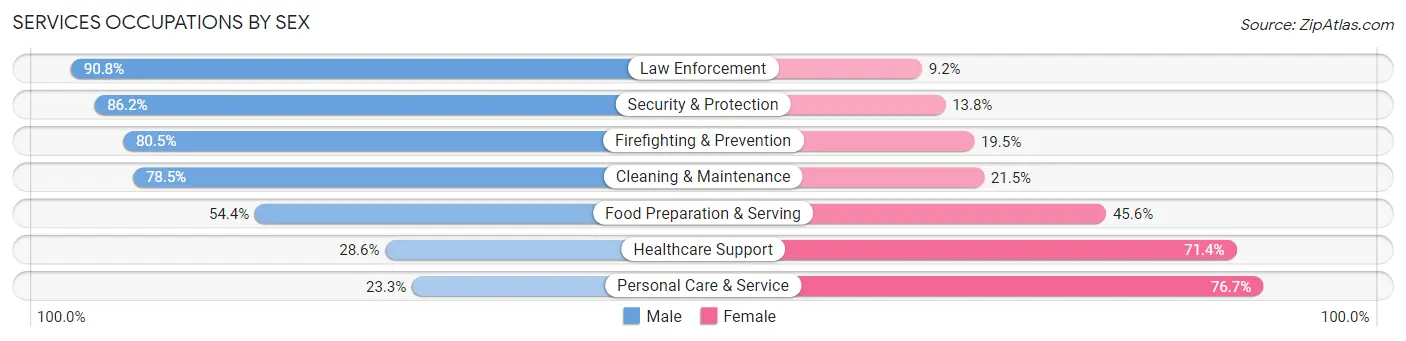
Services Occupations by Sex
Within the Services occupations in Eldersburg, the most male-oriented occupations are Law Enforcement (90.8%), Security & Protection (86.2%), and Firefighting & Prevention (80.5%), while the most female-oriented occupations are Personal Care & Service (76.7%), Healthcare Support (71.4%), and Food Preparation & Serving (45.6%).
| Occupation | Male | Female |
| Healthcare Support | 76 (28.6%) | 190 (71.4%) |
| Security & Protection | 375 (86.2%) | 60 (13.8%) |
| Firefighting & Prevention | 157 (80.5%) | 38 (19.5%) |
| Law Enforcement | 218 (90.8%) | 22 (9.2%) |
| Food Preparation & Serving | 361 (54.4%) | 303 (45.6%) |
| Cleaning & Maintenance | 194 (78.5%) | 53 (21.5%) |
| Personal Care & Service | 108 (23.3%) | 356 (76.7%) |
| Total (Category) | 1,114 (53.7%) | 962 (46.3%) |
| Total (Overall) | 8,372 (52.1%) | 7,700 (47.9%) |
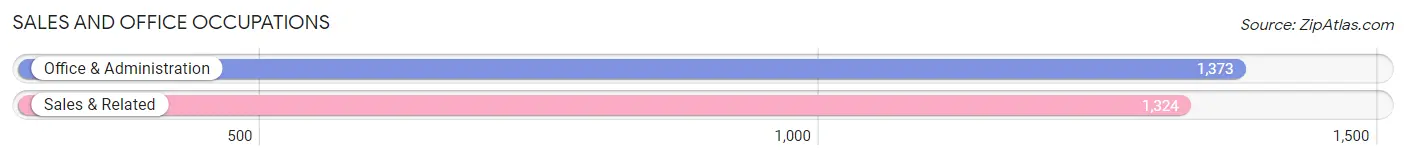
Sales and Office Occupations
The most common Sales and Office occupations in Eldersburg are Office & Administration (1,373 | 8.5%), and Sales & Related (1,324 | 8.2%).
Sales and Office Occupations by Sex
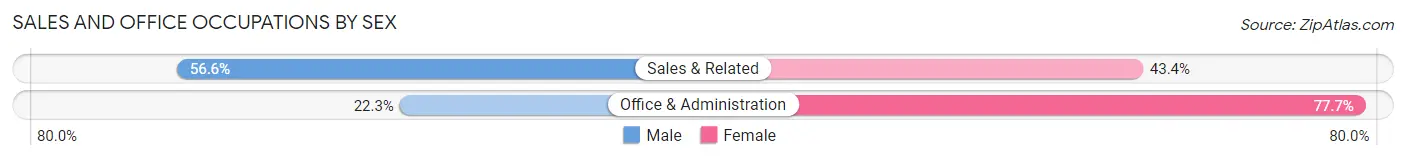
| Occupation | Male | Female |
| Sales & Related | 749 (56.6%) | 575 (43.4%) |
| Office & Administration | 306 (22.3%) | 1,067 (77.7%) |
| Total (Category) | 1,055 (39.1%) | 1,642 (60.9%) |
| Total (Overall) | 8,372 (52.1%) | 7,700 (47.9%) |
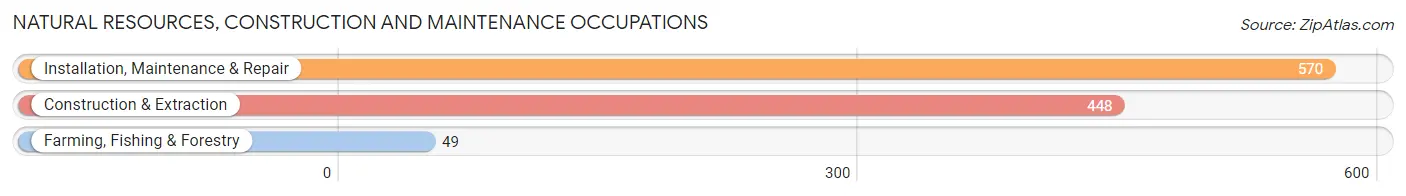
Natural Resources, Construction and Maintenance Occupations
The most common Natural Resources, Construction and Maintenance occupations in Eldersburg are Installation, Maintenance & Repair (570 | 3.5%), Construction & Extraction (448 | 2.8%), and Farming, Fishing & Forestry (49 | 0.3%).
Natural Resources, Construction and Maintenance Occupations by Sex
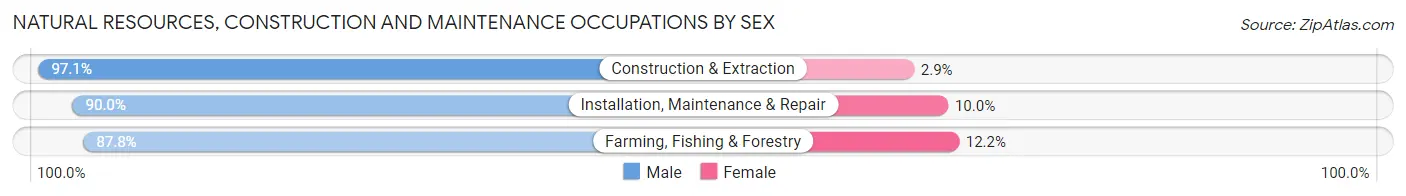
| Occupation | Male | Female |
| Farming, Fishing & Forestry | 43 (87.8%) | 6 (12.2%) |
| Construction & Extraction | 435 (97.1%) | 13 (2.9%) |
| Installation, Maintenance & Repair | 513 (90.0%) | 57 (10.0%) |
| Total (Category) | 991 (92.9%) | 76 (7.1%) |
| Total (Overall) | 8,372 (52.1%) | 7,700 (47.9%) |
Production, Transportation and Moving Occupations
The most common Production, Transportation and Moving occupations in Eldersburg are Production (379 | 2.4%), Material Moving (200 | 1.2%), and Transportation (150 | 0.9%).
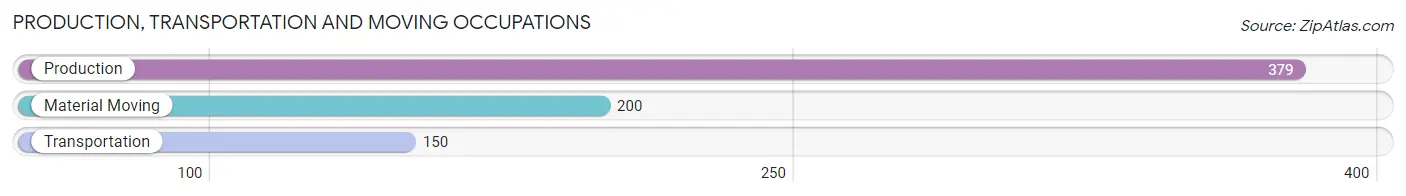
Production, Transportation and Moving Occupations by Sex
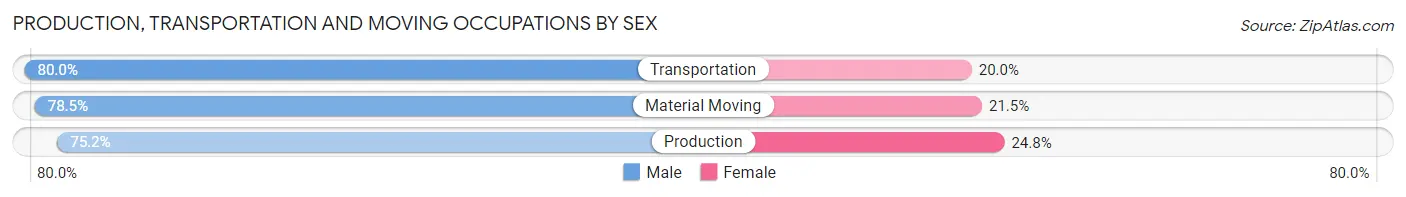
| Occupation | Male | Female |
| Production | 285 (75.2%) | 94 (24.8%) |
| Transportation | 120 (80.0%) | 30 (20.0%) |
| Material Moving | 157 (78.5%) | 43 (21.5%) |
| Total (Category) | 562 (77.1%) | 167 (22.9%) |
| Total (Overall) | 8,372 (52.1%) | 7,700 (47.9%) |
Employment Industries by Sex in Eldersburg
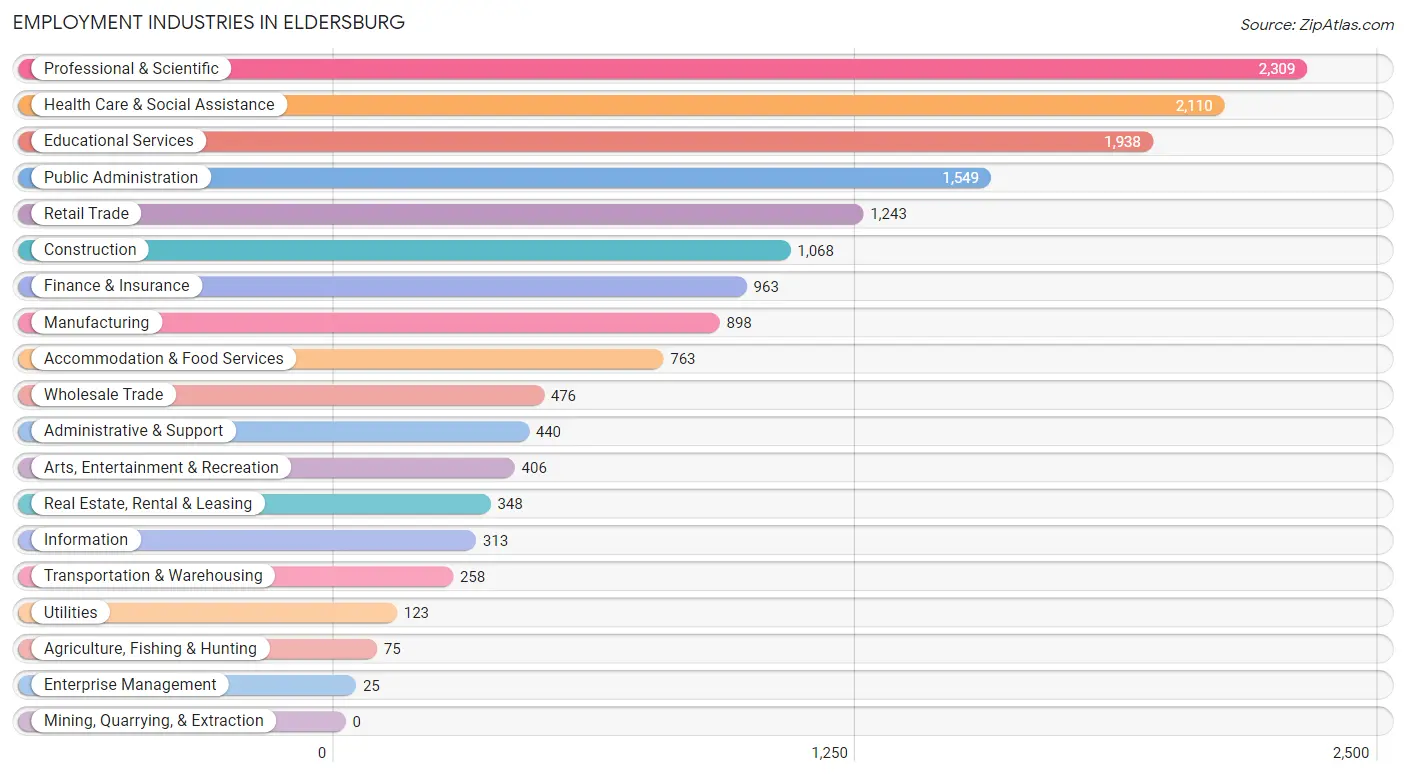
Employment Industries in Eldersburg
The major employment industries in Eldersburg include Professional & Scientific (2,309 | 14.4%), Health Care & Social Assistance (2,110 | 13.1%), Educational Services (1,938 | 12.1%), Public Administration (1,549 | 9.6%), and Retail Trade (1,243 | 7.7%).
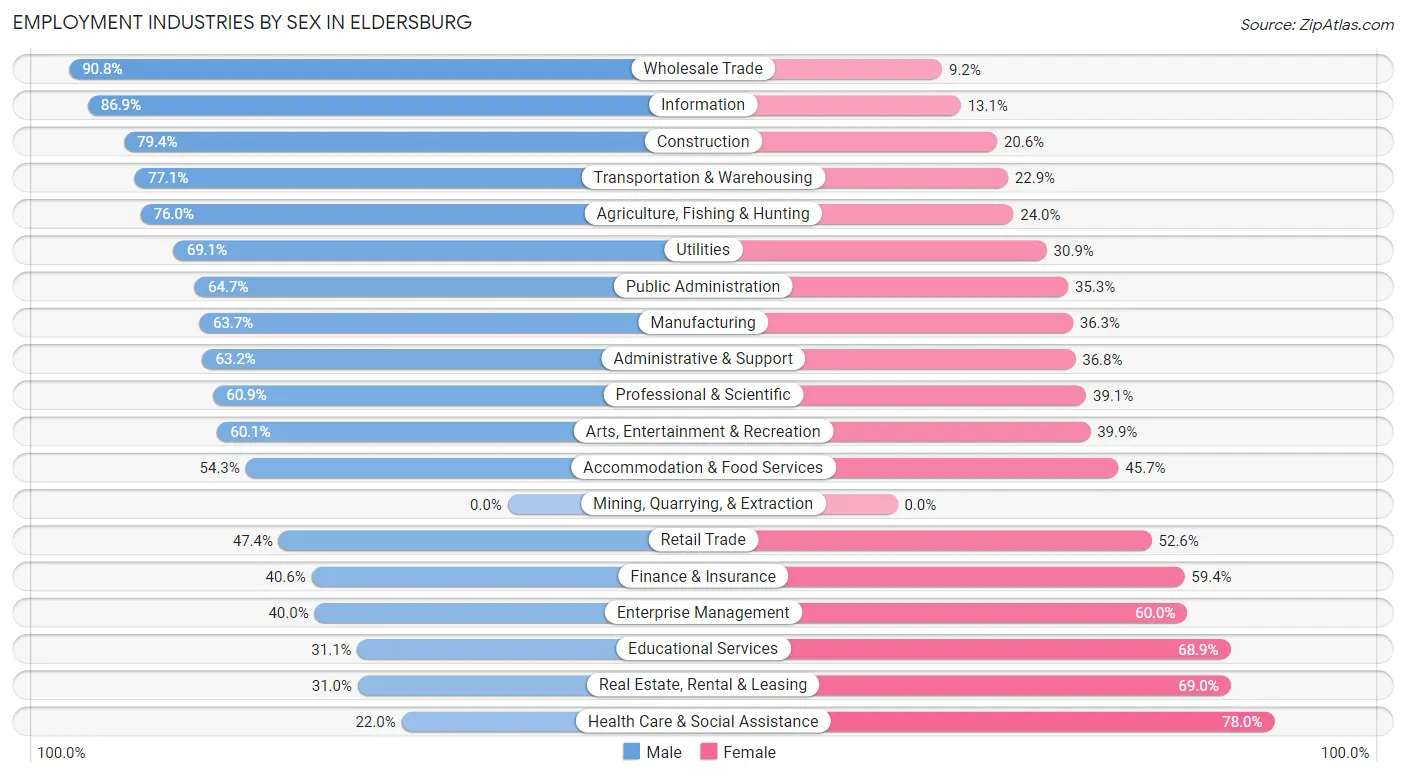
Employment Industries by Sex in Eldersburg
The Eldersburg industries that see more men than women are Wholesale Trade (90.8%), Information (86.9%), and Construction (79.4%), whereas the industries that tend to have a higher number of women are Health Care & Social Assistance (78.0%), Real Estate, Rental & Leasing (69.0%), and Educational Services (68.9%).
| Industry | Male | Female |
| Agriculture, Fishing & Hunting | 57 (76.0%) | 18 (24.0%) |
| Mining, Quarrying, & Extraction | 0 (0.0%) | 0 (0.0%) |
| Construction | 848 (79.4%) | 220 (20.6%) |
| Manufacturing | 572 (63.7%) | 326 (36.3%) |
| Wholesale Trade | 432 (90.8%) | 44 (9.2%) |
| Retail Trade | 589 (47.4%) | 654 (52.6%) |
| Transportation & Warehousing | 199 (77.1%) | 59 (22.9%) |
| Utilities | 85 (69.1%) | 38 (30.9%) |
| Information | 272 (86.9%) | 41 (13.1%) |
| Finance & Insurance | 391 (40.6%) | 572 (59.4%) |
| Real Estate, Rental & Leasing | 108 (31.0%) | 240 (69.0%) |
| Professional & Scientific | 1,407 (60.9%) | 902 (39.1%) |
| Enterprise Management | 10 (40.0%) | 15 (60.0%) |
| Administrative & Support | 278 (63.2%) | 162 (36.8%) |
| Educational Services | 603 (31.1%) | 1,335 (68.9%) |
| Health Care & Social Assistance | 464 (22.0%) | 1,646 (78.0%) |
| Arts, Entertainment & Recreation | 244 (60.1%) | 162 (39.9%) |
| Accommodation & Food Services | 414 (54.3%) | 349 (45.7%) |
| Public Administration | 1,002 (64.7%) | 547 (35.3%) |
| Total | 8,372 (52.1%) | 7,700 (47.9%) |
Education in Eldersburg
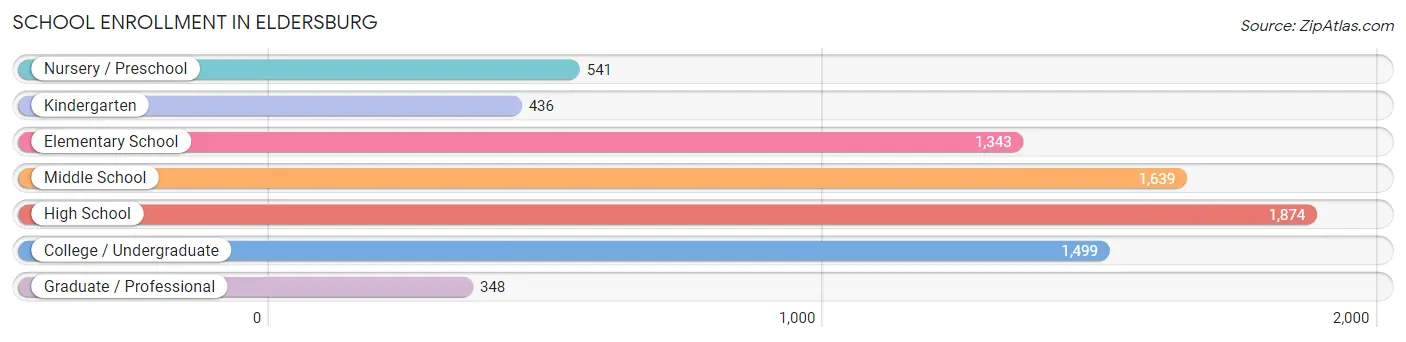
School Enrollment in Eldersburg
The most common levels of schooling among the 7,680 students in Eldersburg are high school (1,874 | 24.4%), middle school (1,639 | 21.3%), and college / undergraduate (1,499 | 19.5%).
| School Level | # Students | % Students |
| Nursery / Preschool | 541 | 7.0% |
| Kindergarten | 436 | 5.7% |
| Elementary School | 1,343 | 17.5% |
| Middle School | 1,639 | 21.3% |
| High School | 1,874 | 24.4% |
| College / Undergraduate | 1,499 | 19.5% |
| Graduate / Professional | 348 | 4.5% |
| Total | 7,680 | 100.0% |
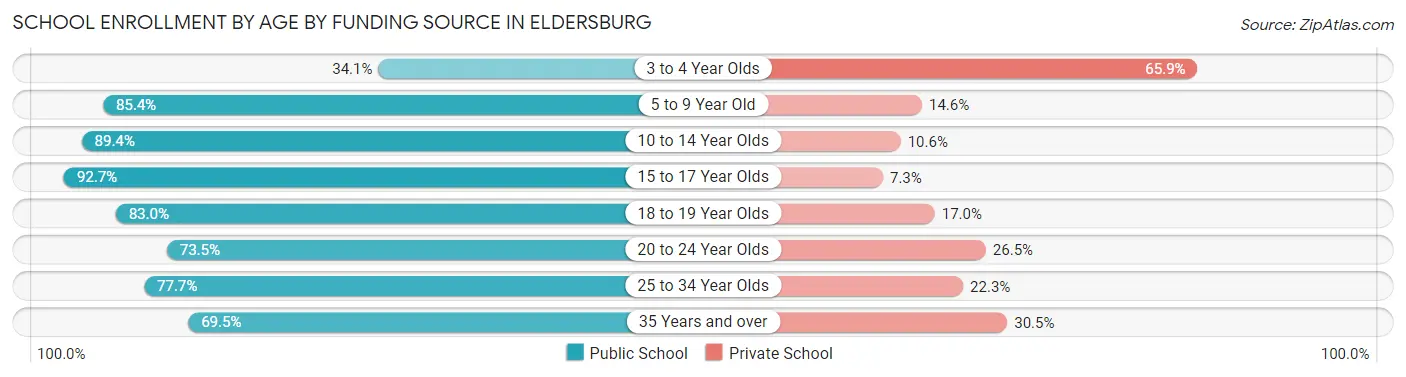
School Enrollment by Age by Funding Source in Eldersburg
Out of a total of 7,680 students who are enrolled in schools in Eldersburg, 1,375 (17.9%) attend a private institution, while the remaining 6,305 (82.1%) are enrolled in public schools. The age group of 3 to 4 year olds has the highest likelihood of being enrolled in private schools, with 280 (65.9% in the age bracket) enrolled. Conversely, the age group of 15 to 17 year olds has the lowest likelihood of being enrolled in a private school, with 1,251 (92.7% in the age bracket) attending a public institution.
| Age Bracket | Public School | Private School |
| 3 to 4 Year Olds | 145 (34.1%) | 280 (65.9%) |
| 5 to 9 Year Old | 1,538 (85.4%) | 263 (14.6%) |
| 10 to 14 Year Olds | 1,765 (89.4%) | 210 (10.6%) |
| 15 to 17 Year Olds | 1,251 (92.7%) | 99 (7.3%) |
| 18 to 19 Year Olds | 401 (83.0%) | 82 (17.0%) |
| 20 to 24 Year Olds | 630 (73.5%) | 227 (26.5%) |
| 25 to 34 Year Olds | 241 (77.7%) | 69 (22.3%) |
| 35 Years and over | 333 (69.5%) | 146 (30.5%) |
| Total | 6,305 (82.1%) | 1,375 (17.9%) |
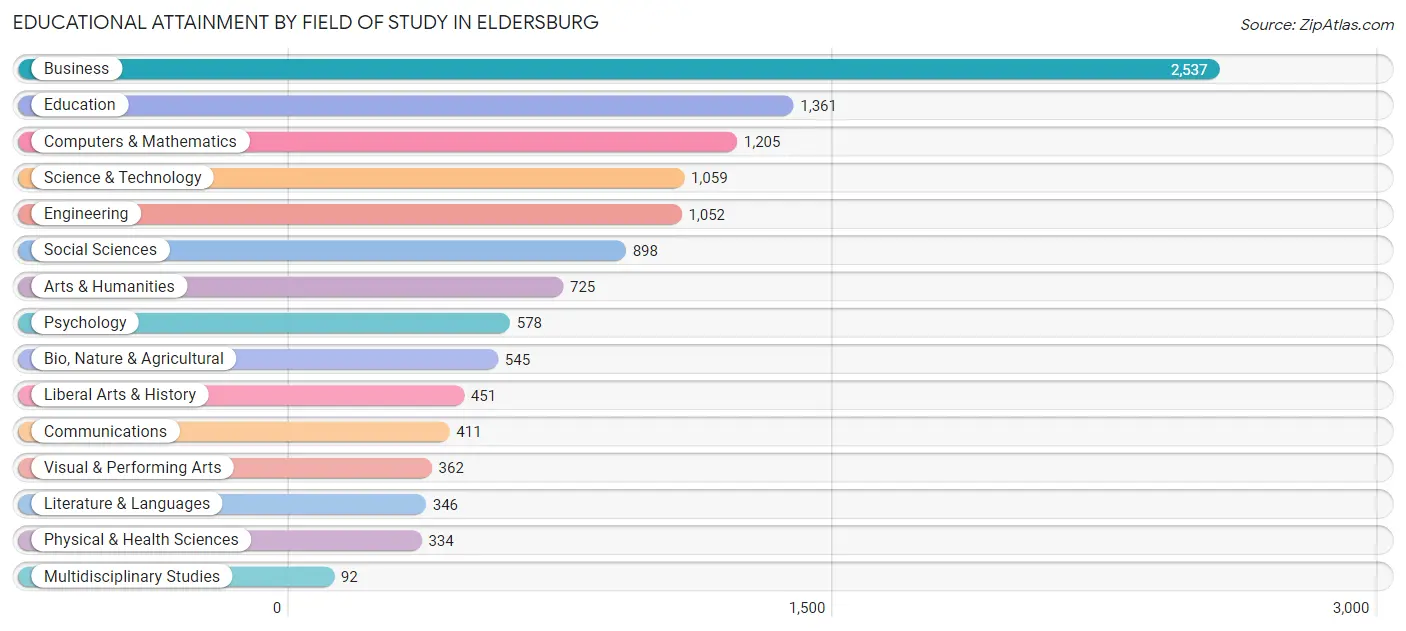
Educational Attainment by Field of Study in Eldersburg
Business (2,537 | 21.2%), education (1,361 | 11.4%), computers & mathematics (1,205 | 10.1%), science & technology (1,059 | 8.9%), and engineering (1,052 | 8.8%) are the most common fields of study among 11,956 individuals in Eldersburg who have obtained a bachelor's degree or higher.
| Field of Study | # Graduates | % Graduates |
| Computers & Mathematics | 1,205 | 10.1% |
| Bio, Nature & Agricultural | 545 | 4.6% |
| Physical & Health Sciences | 334 | 2.8% |
| Psychology | 578 | 4.8% |
| Social Sciences | 898 | 7.5% |
| Engineering | 1,052 | 8.8% |
| Multidisciplinary Studies | 92 | 0.8% |
| Science & Technology | 1,059 | 8.9% |
| Business | 2,537 | 21.2% |
| Education | 1,361 | 11.4% |
| Literature & Languages | 346 | 2.9% |
| Liberal Arts & History | 451 | 3.8% |
| Visual & Performing Arts | 362 | 3.0% |
| Communications | 411 | 3.4% |
| Arts & Humanities | 725 | 6.1% |
| Total | 11,956 | 100.0% |
Transportation & Commute in Eldersburg
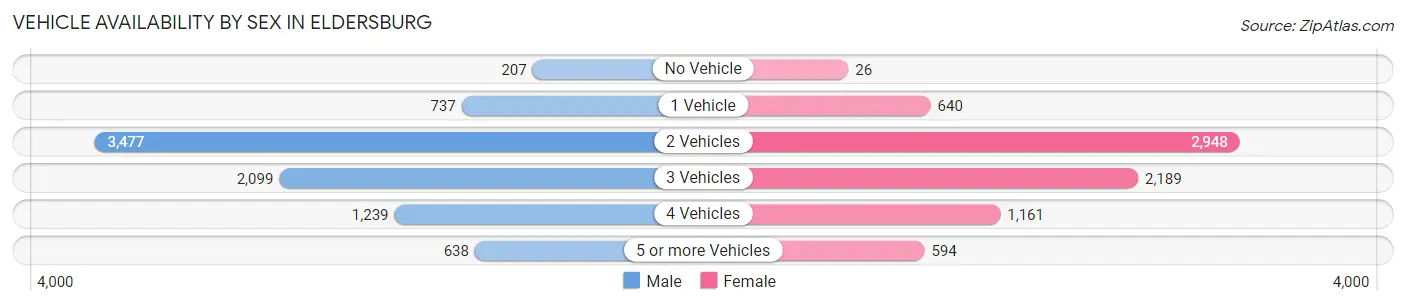
Vehicle Availability by Sex in Eldersburg
The most prevalent vehicle ownership categories in Eldersburg are males with 2 vehicles (3,477, accounting for 41.4%) and females with 2 vehicles (2,948, making up 46.0%).
| Vehicles Available | Male | Female |
| No Vehicle | 207 (2.5%) | 26 (0.3%) |
| 1 Vehicle | 737 (8.8%) | 640 (8.5%) |
| 2 Vehicles | 3,477 (41.4%) | 2,948 (39.0%) |
| 3 Vehicles | 2,099 (25.0%) | 2,189 (29.0%) |
| 4 Vehicles | 1,239 (14.8%) | 1,161 (15.4%) |
| 5 or more Vehicles | 638 (7.6%) | 594 (7.9%) |
| Total | 8,397 (100.0%) | 7,558 (100.0%) |
Commute Time in Eldersburg
The most frequently occuring commute durations in Eldersburg are 45 to 59 minutes (2,558 commuters, 19.9%), 30 to 34 minutes (1,709 commuters, 13.3%), and 40 to 44 minutes (1,371 commuters, 10.6%).
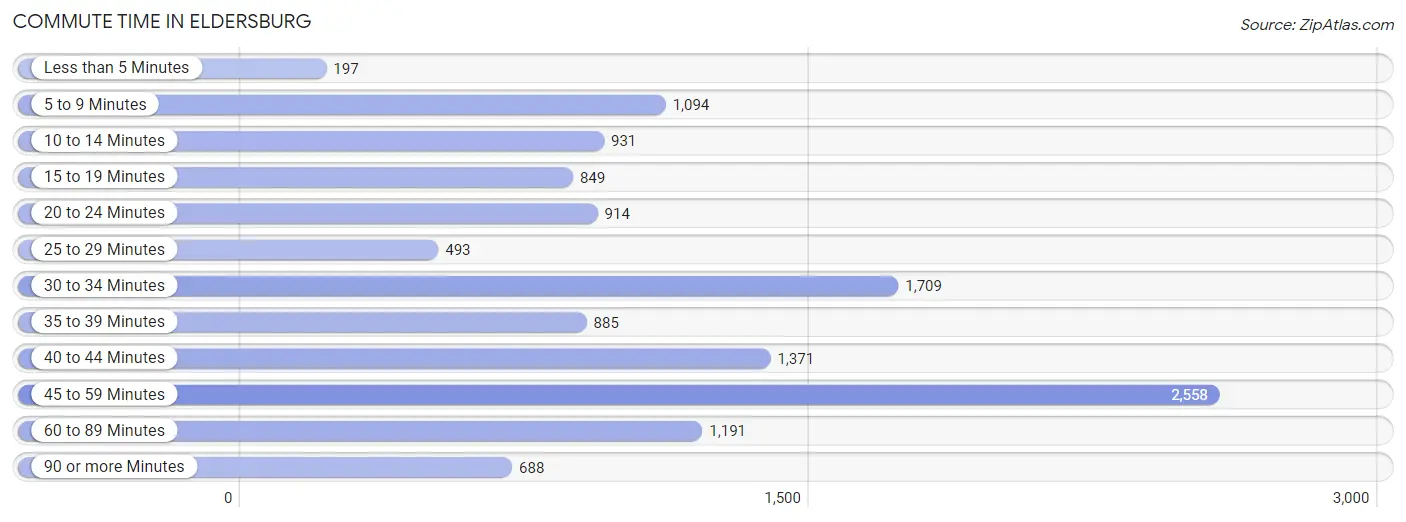
| Commute Time | # Commuters | % Commuters |
| Less than 5 Minutes | 197 | 1.5% |
| 5 to 9 Minutes | 1,094 | 8.5% |
| 10 to 14 Minutes | 931 | 7.2% |
| 15 to 19 Minutes | 849 | 6.6% |
| 20 to 24 Minutes | 914 | 7.1% |
| 25 to 29 Minutes | 493 | 3.8% |
| 30 to 34 Minutes | 1,709 | 13.3% |
| 35 to 39 Minutes | 885 | 6.9% |
| 40 to 44 Minutes | 1,371 | 10.6% |
| 45 to 59 Minutes | 2,558 | 19.9% |
| 60 to 89 Minutes | 1,191 | 9.2% |
| 90 or more Minutes | 688 | 5.3% |
Commute Time by Sex in Eldersburg
The most common commute times in Eldersburg are 45 to 59 minutes (1,472 commuters, 21.0%) for males and 45 to 59 minutes (1,086 commuters, 18.5%) for females.
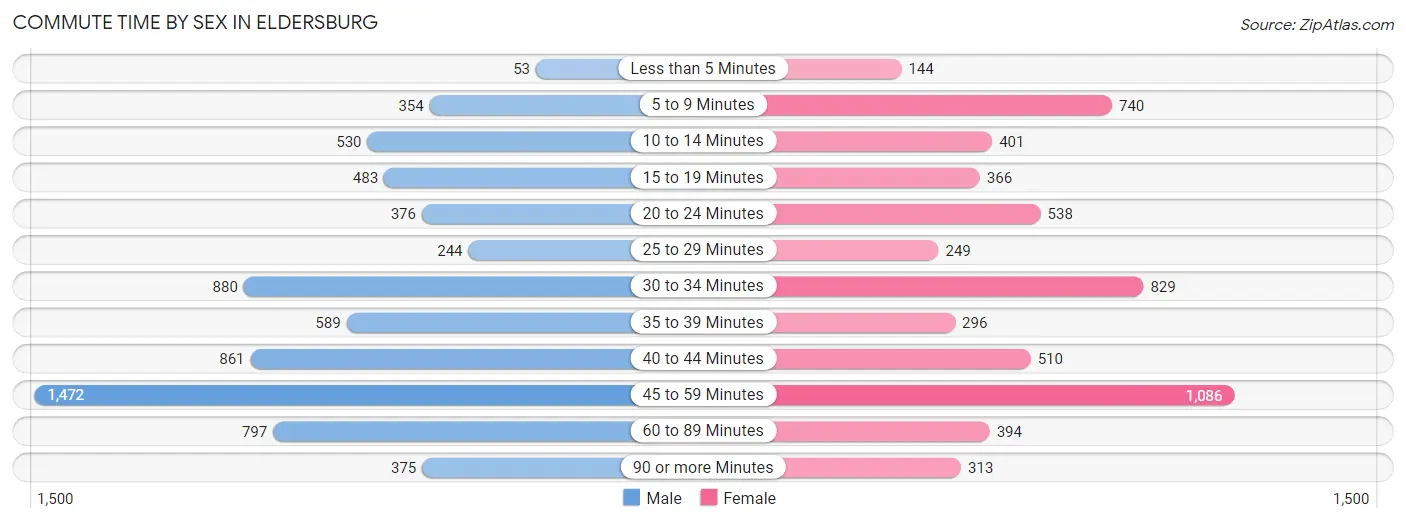
| Commute Time | Male | Female |
| Less than 5 Minutes | 53 (0.8%) | 144 (2.5%) |
| 5 to 9 Minutes | 354 (5.1%) | 740 (12.6%) |
| 10 to 14 Minutes | 530 (7.6%) | 401 (6.8%) |
| 15 to 19 Minutes | 483 (6.9%) | 366 (6.2%) |
| 20 to 24 Minutes | 376 (5.4%) | 538 (9.2%) |
| 25 to 29 Minutes | 244 (3.5%) | 249 (4.2%) |
| 30 to 34 Minutes | 880 (12.6%) | 829 (14.1%) |
| 35 to 39 Minutes | 589 (8.4%) | 296 (5.1%) |
| 40 to 44 Minutes | 861 (12.3%) | 510 (8.7%) |
| 45 to 59 Minutes | 1,472 (21.0%) | 1,086 (18.5%) |
| 60 to 89 Minutes | 797 (11.4%) | 394 (6.7%) |
| 90 or more Minutes | 375 (5.3%) | 313 (5.3%) |
Time of Departure to Work by Sex in Eldersburg
The most frequent times of departure to work in Eldersburg are 7:00 AM to 7:29 AM (1,110, 15.8%) for males and 8:00 AM to 8:29 AM (1,004, 17.1%) for females.
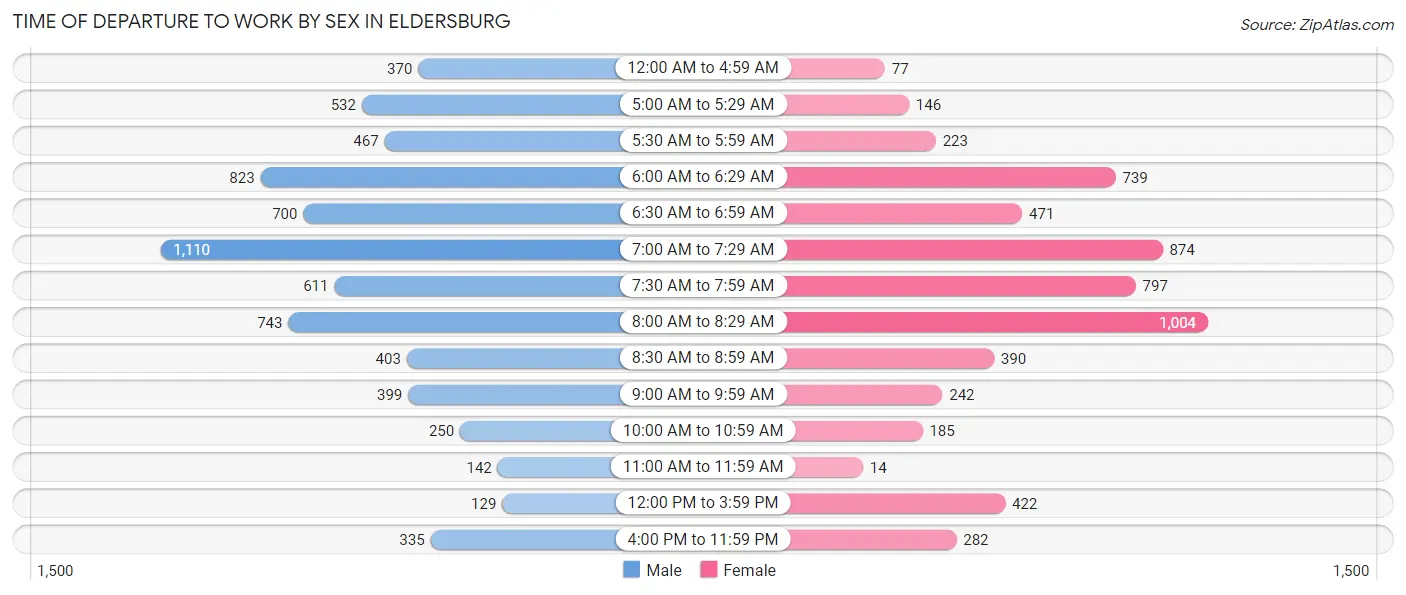
| Time of Departure | Male | Female |
| 12:00 AM to 4:59 AM | 370 (5.3%) | 77 (1.3%) |
| 5:00 AM to 5:29 AM | 532 (7.6%) | 146 (2.5%) |
| 5:30 AM to 5:59 AM | 467 (6.7%) | 223 (3.8%) |
| 6:00 AM to 6:29 AM | 823 (11.7%) | 739 (12.6%) |
| 6:30 AM to 6:59 AM | 700 (10.0%) | 471 (8.0%) |
| 7:00 AM to 7:29 AM | 1,110 (15.8%) | 874 (14.9%) |
| 7:30 AM to 7:59 AM | 611 (8.7%) | 797 (13.6%) |
| 8:00 AM to 8:29 AM | 743 (10.6%) | 1,004 (17.1%) |
| 8:30 AM to 8:59 AM | 403 (5.8%) | 390 (6.7%) |
| 9:00 AM to 9:59 AM | 399 (5.7%) | 242 (4.1%) |
| 10:00 AM to 10:59 AM | 250 (3.6%) | 185 (3.2%) |
| 11:00 AM to 11:59 AM | 142 (2.0%) | 14 (0.2%) |
| 12:00 PM to 3:59 PM | 129 (1.8%) | 422 (7.2%) |
| 4:00 PM to 11:59 PM | 335 (4.8%) | 282 (4.8%) |
| Total | 7,014 (100.0%) | 5,866 (100.0%) |
Housing Occupancy in Eldersburg
Occupancy by Ownership in Eldersburg
Of the total 10,575 dwellings in Eldersburg, owner-occupied units account for 9,414 (89.0%), while renter-occupied units make up 1,161 (11.0%).
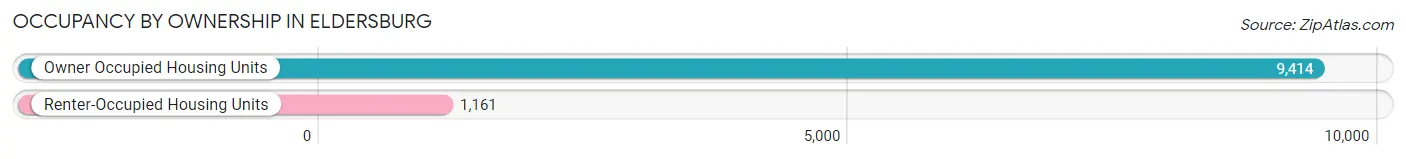
| Occupancy | # Housing Units | % Housing Units |
| Owner Occupied Housing Units | 9,414 | 89.0% |
| Renter-Occupied Housing Units | 1,161 | 11.0% |
| Total Occupied Housing Units | 10,575 | 100.0% |
Occupancy by Household Size in Eldersburg
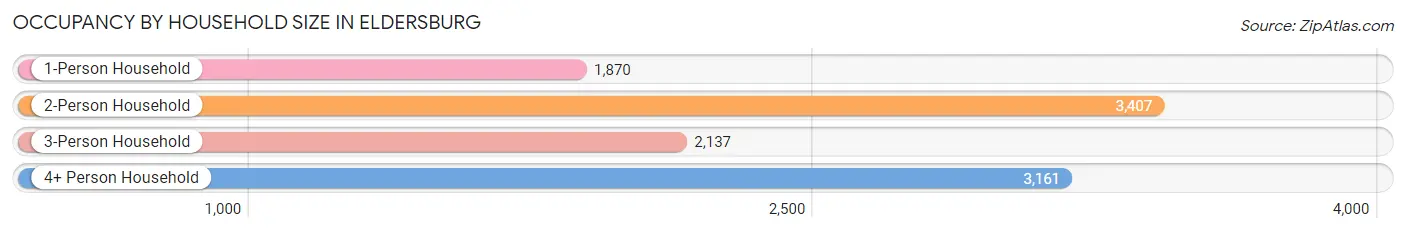
| Household Size | # Housing Units | % Housing Units |
| 1-Person Household | 1,870 | 17.7% |
| 2-Person Household | 3,407 | 32.2% |
| 3-Person Household | 2,137 | 20.2% |
| 4+ Person Household | 3,161 | 29.9% |
| Total Housing Units | 10,575 | 100.0% |
Occupancy by Ownership by Household Size in Eldersburg
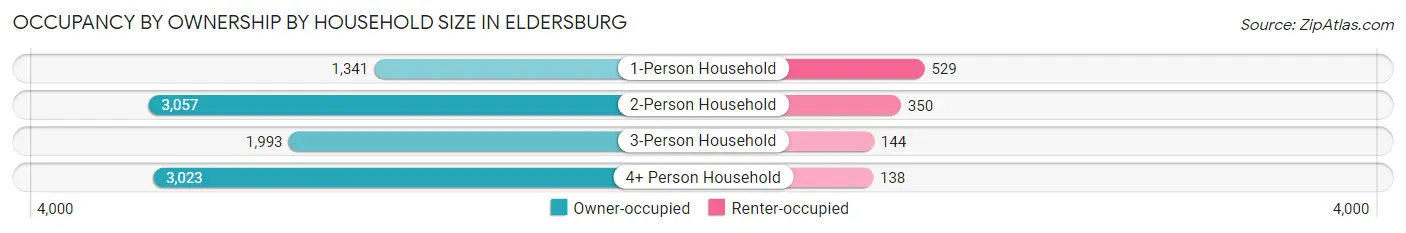
| Household Size | Owner-occupied | Renter-occupied |
| 1-Person Household | 1,341 (71.7%) | 529 (28.3%) |
| 2-Person Household | 3,057 (89.7%) | 350 (10.3%) |
| 3-Person Household | 1,993 (93.3%) | 144 (6.7%) |
| 4+ Person Household | 3,023 (95.6%) | 138 (4.4%) |
| Total Housing Units | 9,414 (89.0%) | 1,161 (11.0%) |
Occupancy by Educational Attainment in Eldersburg
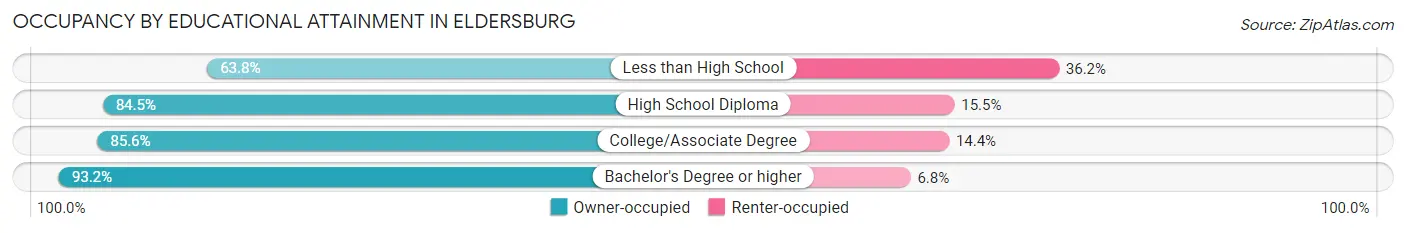
| Household Size | Owner-occupied | Renter-occupied |
| Less than High School | 206 (63.8%) | 117 (36.2%) |
| High School Diploma | 1,260 (84.5%) | 231 (15.5%) |
| College/Associate Degree | 2,438 (85.6%) | 411 (14.4%) |
| Bachelor's Degree or higher | 5,510 (93.2%) | 402 (6.8%) |
Occupancy by Age of Householder in Eldersburg
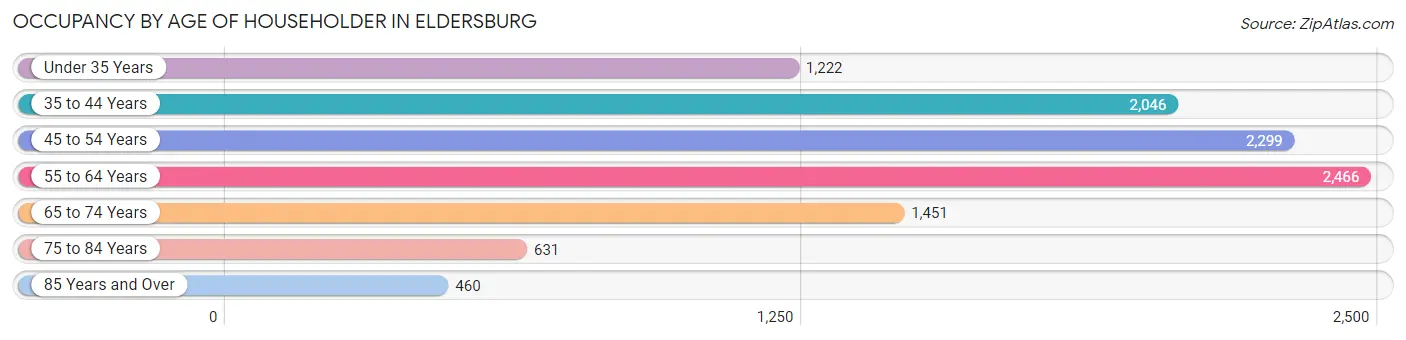
| Age Bracket | # Households | % Households |
| Under 35 Years | 1,222 | 11.6% |
| 35 to 44 Years | 2,046 | 19.4% |
| 45 to 54 Years | 2,299 | 21.7% |
| 55 to 64 Years | 2,466 | 23.3% |
| 65 to 74 Years | 1,451 | 13.7% |
| 75 to 84 Years | 631 | 6.0% |
| 85 Years and Over | 460 | 4.3% |
| Total | 10,575 | 100.0% |
Housing Finances in Eldersburg
Median Income by Occupancy in Eldersburg
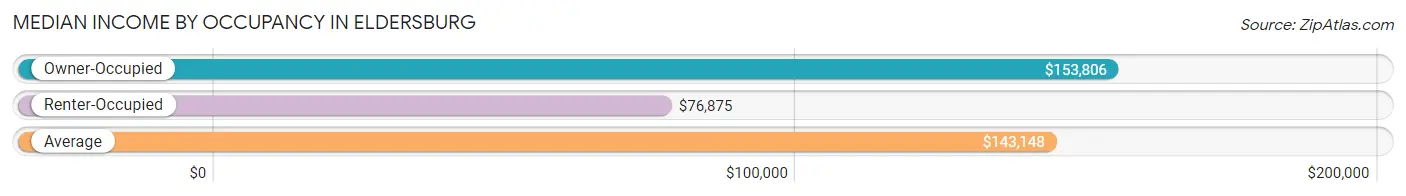
| Occupancy Type | # Households | Median Income |
| Owner-Occupied | 9,414 (89.0%) | $153,806 |
| Renter-Occupied | 1,161 (11.0%) | $76,875 |
| Average | 10,575 (100.0%) | $143,148 |
Occupancy by Householder Income Bracket in Eldersburg
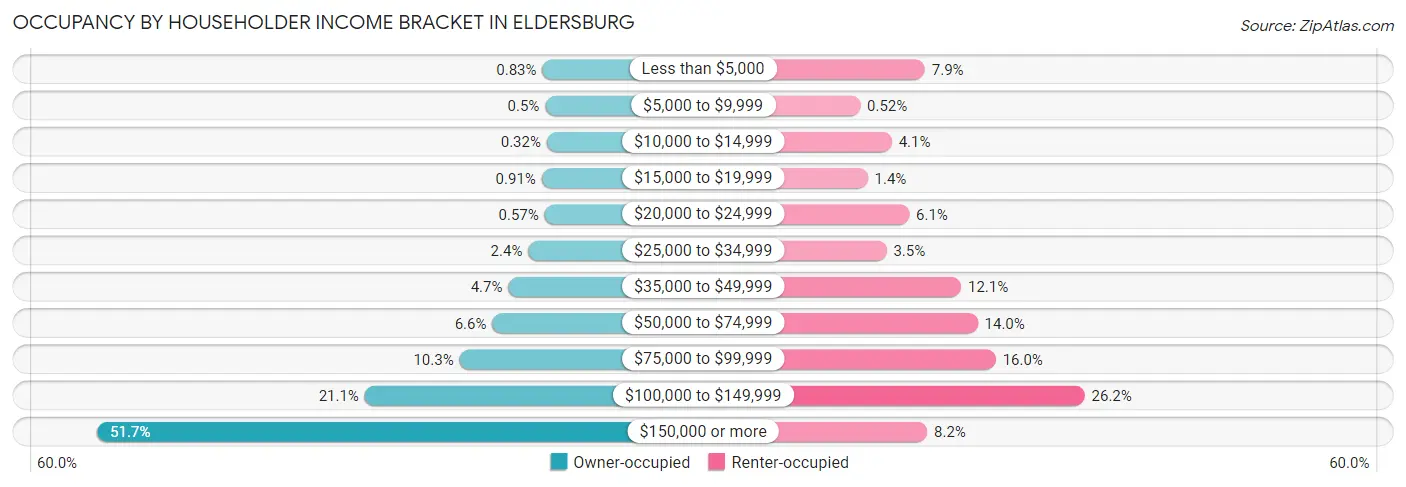
| Income Bracket | Owner-occupied | Renter-occupied |
| Less than $5,000 | 78 (0.8%) | 92 (7.9%) |
| $5,000 to $9,999 | 47 (0.5%) | 6 (0.5%) |
| $10,000 to $14,999 | 30 (0.3%) | 48 (4.1%) |
| $15,000 to $19,999 | 86 (0.9%) | 16 (1.4%) |
| $20,000 to $24,999 | 54 (0.6%) | 71 (6.1%) |
| $25,000 to $34,999 | 230 (2.4%) | 41 (3.5%) |
| $35,000 to $49,999 | 444 (4.7%) | 140 (12.1%) |
| $50,000 to $74,999 | 617 (6.6%) | 162 (14.0%) |
| $75,000 to $99,999 | 970 (10.3%) | 186 (16.0%) |
| $100,000 to $149,999 | 1,989 (21.1%) | 304 (26.2%) |
| $150,000 or more | 4,869 (51.7%) | 95 (8.2%) |
| Total | 9,414 (100.0%) | 1,161 (100.0%) |
Monthly Housing Cost Tiers in Eldersburg
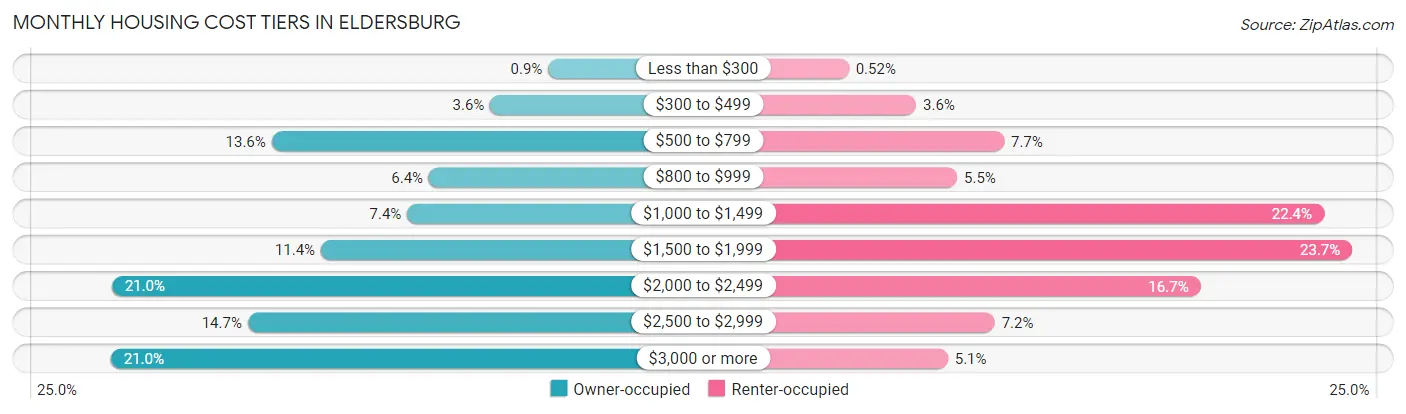
| Monthly Cost | Owner-occupied | Renter-occupied |
| Less than $300 | 85 (0.9%) | 6 (0.5%) |
| $300 to $499 | 336 (3.6%) | 42 (3.6%) |
| $500 to $799 | 1,283 (13.6%) | 89 (7.7%) |
| $800 to $999 | 602 (6.4%) | 64 (5.5%) |
| $1,000 to $1,499 | 696 (7.4%) | 260 (22.4%) |
| $1,500 to $1,999 | 1,069 (11.4%) | 275 (23.7%) |
| $2,000 to $2,499 | 1,976 (21.0%) | 194 (16.7%) |
| $2,500 to $2,999 | 1,387 (14.7%) | 84 (7.2%) |
| $3,000 or more | 1,980 (21.0%) | 59 (5.1%) |
| Total | 9,414 (100.0%) | 1,161 (100.0%) |
Physical Housing Characteristics in Eldersburg
Housing Structures in Eldersburg
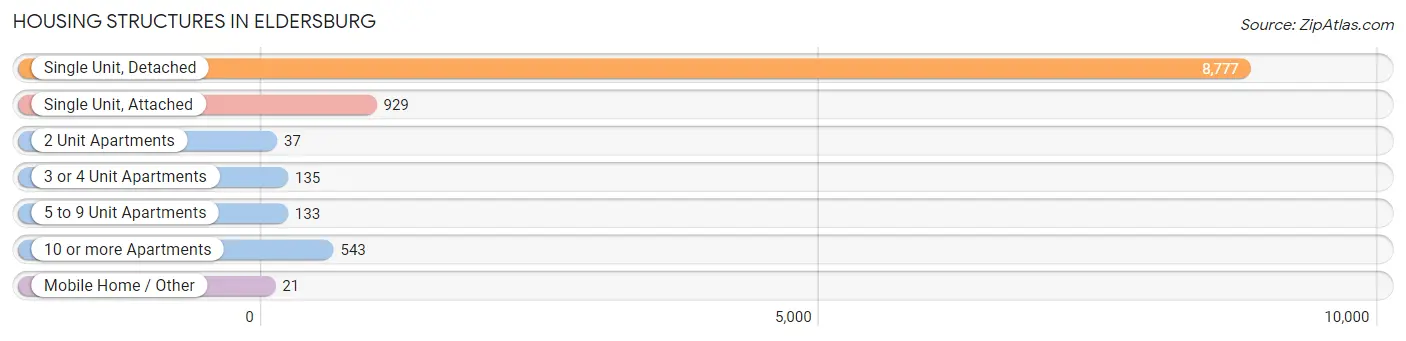
| Structure Type | # Housing Units | % Housing Units |
| Single Unit, Detached | 8,777 | 83.0% |
| Single Unit, Attached | 929 | 8.8% |
| 2 Unit Apartments | 37 | 0.4% |
| 3 or 4 Unit Apartments | 135 | 1.3% |
| 5 to 9 Unit Apartments | 133 | 1.3% |
| 10 or more Apartments | 543 | 5.1% |
| Mobile Home / Other | 21 | 0.2% |
| Total | 10,575 | 100.0% |
Housing Structures by Occupancy in Eldersburg
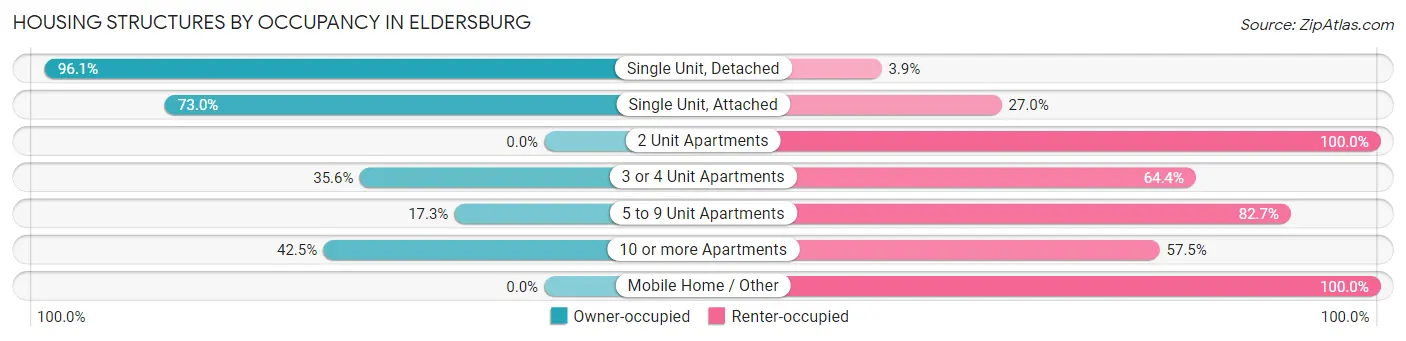
| Structure Type | Owner-occupied | Renter-occupied |
| Single Unit, Detached | 8,434 (96.1%) | 343 (3.9%) |
| Single Unit, Attached | 678 (73.0%) | 251 (27.0%) |
| 2 Unit Apartments | 0 (0.0%) | 37 (100.0%) |
| 3 or 4 Unit Apartments | 48 (35.6%) | 87 (64.4%) |
| 5 to 9 Unit Apartments | 23 (17.3%) | 110 (82.7%) |
| 10 or more Apartments | 231 (42.5%) | 312 (57.5%) |
| Mobile Home / Other | 0 (0.0%) | 21 (100.0%) |
| Total | 9,414 (89.0%) | 1,161 (11.0%) |
Housing Structures by Number of Rooms in Eldersburg
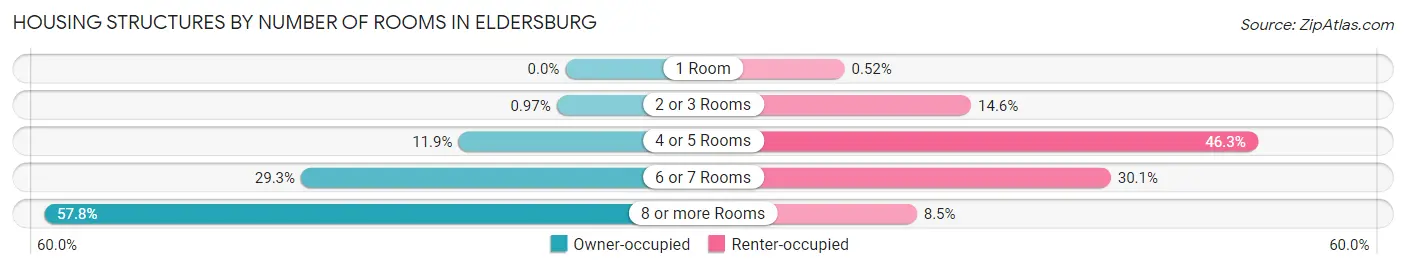
| Number of Rooms | Owner-occupied | Renter-occupied |
| 1 Room | 0 (0.0%) | 6 (0.5%) |
| 2 or 3 Rooms | 91 (1.0%) | 169 (14.6%) |
| 4 or 5 Rooms | 1,117 (11.9%) | 538 (46.3%) |
| 6 or 7 Rooms | 2,762 (29.3%) | 349 (30.1%) |
| 8 or more Rooms | 5,444 (57.8%) | 99 (8.5%) |
| Total | 9,414 (100.0%) | 1,161 (100.0%) |
Housing Structure by Heating Type in Eldersburg
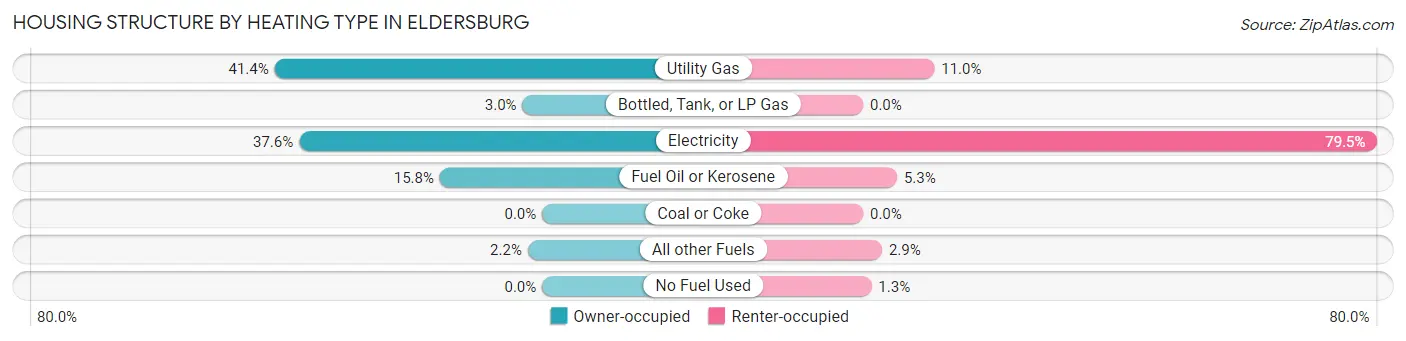
| Heating Type | Owner-occupied | Renter-occupied |
| Utility Gas | 3,894 (41.4%) | 128 (11.0%) |
| Bottled, Tank, or LP Gas | 286 (3.0%) | 0 (0.0%) |
| Electricity | 3,537 (37.6%) | 923 (79.5%) |
| Fuel Oil or Kerosene | 1,488 (15.8%) | 61 (5.2%) |
| Coal or Coke | 0 (0.0%) | 0 (0.0%) |
| All other Fuels | 209 (2.2%) | 34 (2.9%) |
| No Fuel Used | 0 (0.0%) | 15 (1.3%) |
| Total | 9,414 (100.0%) | 1,161 (100.0%) |
Household Vehicle Usage in Eldersburg
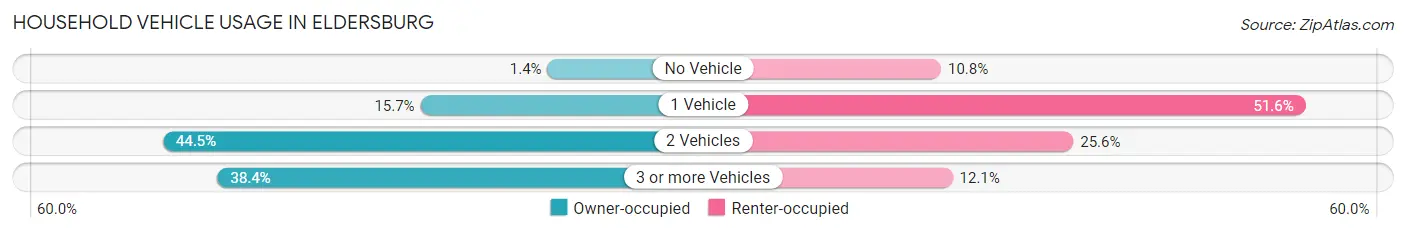
| Vehicles per Household | Owner-occupied | Renter-occupied |
| No Vehicle | 135 (1.4%) | 125 (10.8%) |
| 1 Vehicle | 1,474 (15.7%) | 599 (51.6%) |
| 2 Vehicles | 4,190 (44.5%) | 297 (25.6%) |
| 3 or more Vehicles | 3,615 (38.4%) | 140 (12.1%) |
| Total | 9,414 (100.0%) | 1,161 (100.0%) |
Real Estate & Mortgages in Eldersburg
Real Estate and Mortgage Overview in Eldersburg
| Characteristic | Without Mortgage | With Mortgage |
| Housing Units | 2,444 | 6,970 |
| Median Property Value | $426,800 | $472,100 |
| Median Household Income | $107,836 | $4,074 |
| Monthly Housing Costs | $690 | $1,960 |
| Real Estate Taxes | $4,030 | $22 |
Property Value by Mortgage Status in Eldersburg
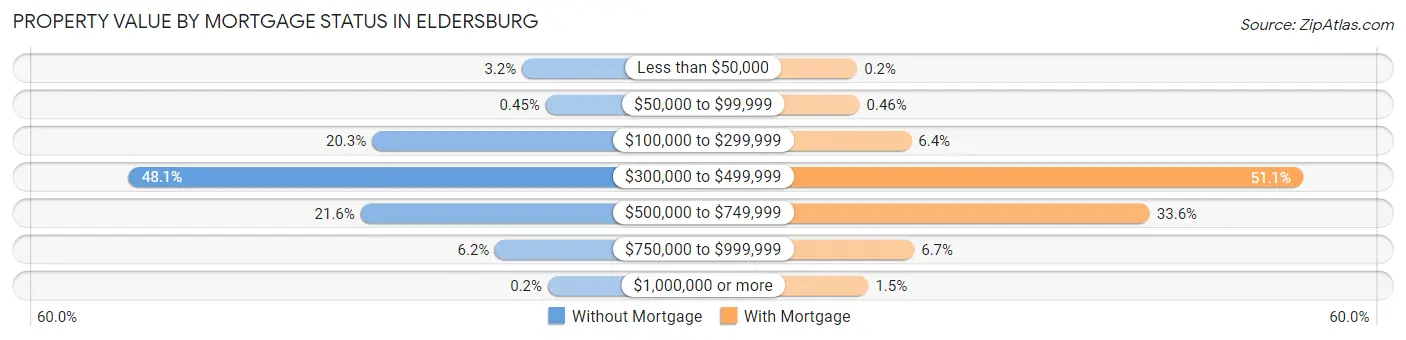
| Property Value | Without Mortgage | With Mortgage |
| Less than $50,000 | 77 (3.2%) | 14 (0.2%) |
| $50,000 to $99,999 | 11 (0.4%) | 32 (0.5%) |
| $100,000 to $299,999 | 496 (20.3%) | 445 (6.4%) |
| $300,000 to $499,999 | 1,175 (48.1%) | 3,563 (51.1%) |
| $500,000 to $749,999 | 528 (21.6%) | 2,345 (33.6%) |
| $750,000 to $999,999 | 152 (6.2%) | 468 (6.7%) |
| $1,000,000 or more | 5 (0.2%) | 103 (1.5%) |
| Total | 2,444 (100.0%) | 6,970 (100.0%) |
Household Income by Mortgage Status in Eldersburg
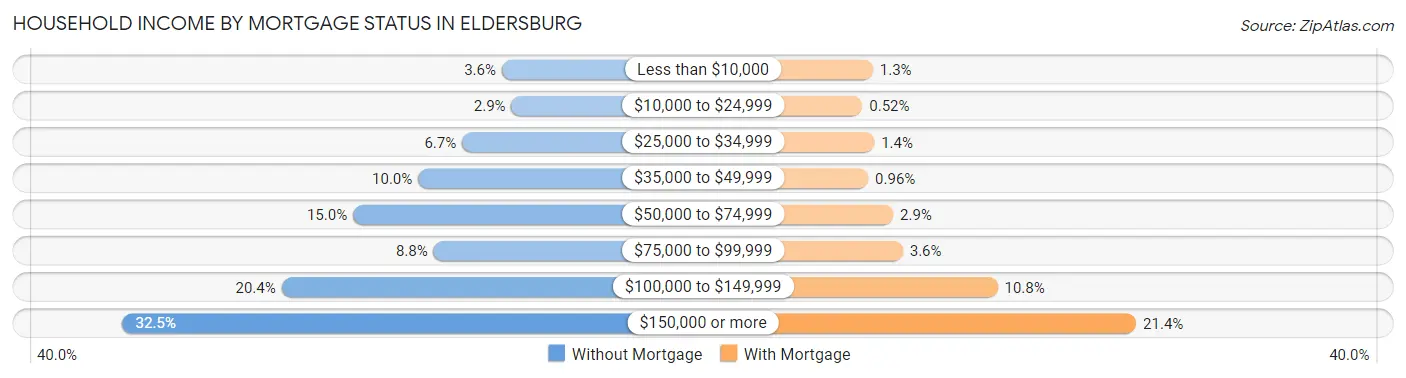
| Household Income | Without Mortgage | With Mortgage |
| Less than $10,000 | 89 (3.6%) | 92 (1.3%) |
| $10,000 to $24,999 | 71 (2.9%) | 36 (0.5%) |
| $25,000 to $34,999 | 163 (6.7%) | 99 (1.4%) |
| $35,000 to $49,999 | 245 (10.0%) | 67 (1.0%) |
| $50,000 to $74,999 | 366 (15.0%) | 199 (2.9%) |
| $75,000 to $99,999 | 216 (8.8%) | 251 (3.6%) |
| $100,000 to $149,999 | 499 (20.4%) | 754 (10.8%) |
| $150,000 or more | 795 (32.5%) | 1,490 (21.4%) |
| Total | 2,444 (100.0%) | 6,970 (100.0%) |
Property Value to Household Income Ratio in Eldersburg
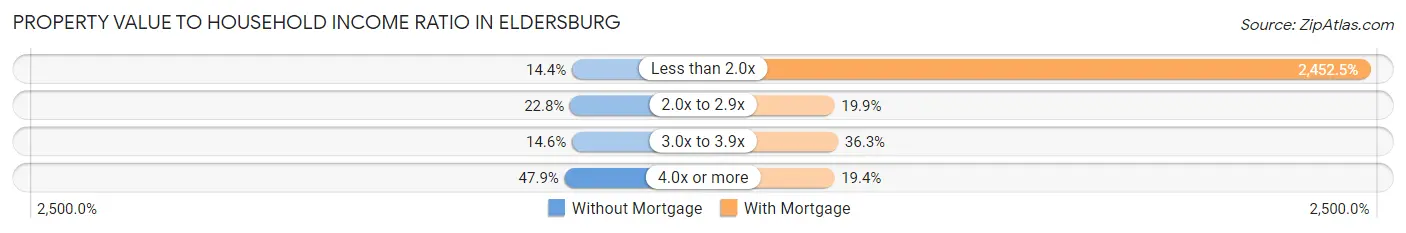
| Value-to-Income Ratio | Without Mortgage | With Mortgage |
| Less than 2.0x | 353 (14.4%) | 170,938 (2,452.5%) |
| 2.0x to 2.9x | 558 (22.8%) | 1,384 (19.9%) |
| 3.0x to 3.9x | 357 (14.6%) | 2,528 (36.3%) |
| 4.0x or more | 1,171 (47.9%) | 1,349 (19.4%) |
| Total | 2,444 (100.0%) | 6,970 (100.0%) |
Real Estate Taxes by Mortgage Status in Eldersburg
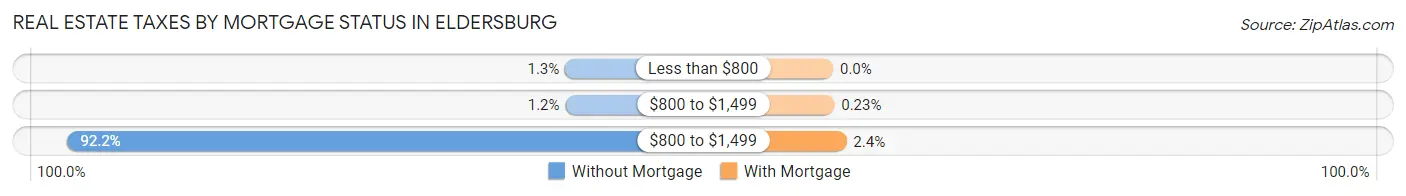
| Property Taxes | Without Mortgage | With Mortgage |
| Less than $800 | 31 (1.3%) | 0 (0.0%) |
| $800 to $1,499 | 30 (1.2%) | 16 (0.2%) |
| $800 to $1,499 | 2,253 (92.2%) | 170 (2.4%) |
| Total | 2,444 (100.0%) | 6,970 (100.0%) |
Health & Disability in Eldersburg
Health Insurance Coverage by Age in Eldersburg
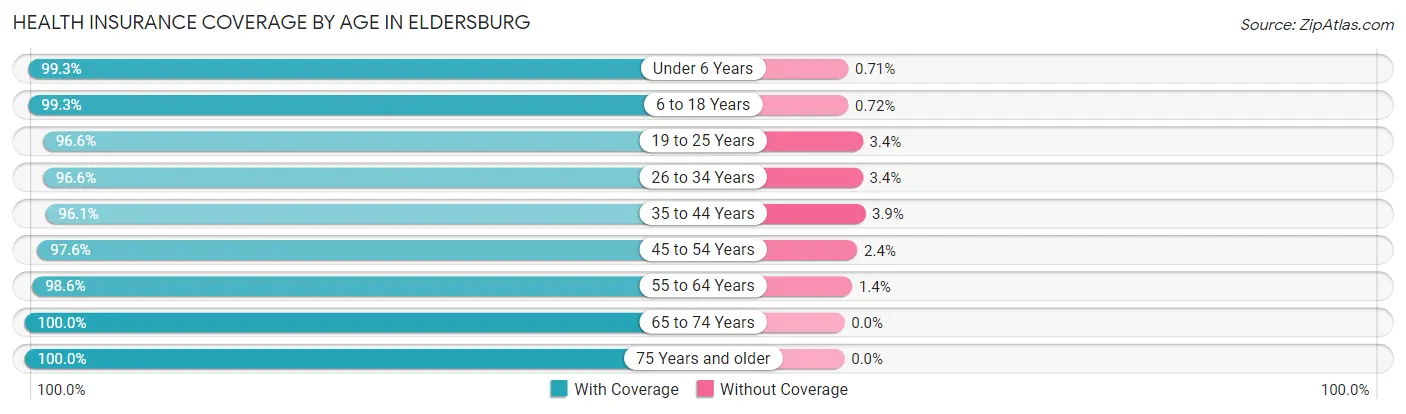
| Age Bracket | With Coverage | Without Coverage |
| Under 6 Years | 2,086 (99.3%) | 15 (0.7%) |
| 6 to 18 Years | 5,216 (99.3%) | 38 (0.7%) |
| 19 to 25 Years | 1,909 (96.6%) | 67 (3.4%) |
| 26 to 34 Years | 2,898 (96.6%) | 102 (3.4%) |
| 35 to 44 Years | 3,798 (96.1%) | 153 (3.9%) |
| 45 to 54 Years | 4,399 (97.6%) | 108 (2.4%) |
| 55 to 64 Years | 4,276 (98.6%) | 62 (1.4%) |
| 65 to 74 Years | 2,512 (100.0%) | 0 (0.0%) |
| 75 Years and older | 1,852 (100.0%) | 0 (0.0%) |
| Total | 28,946 (98.2%) | 545 (1.8%) |
Health Insurance Coverage by Citizenship Status in Eldersburg
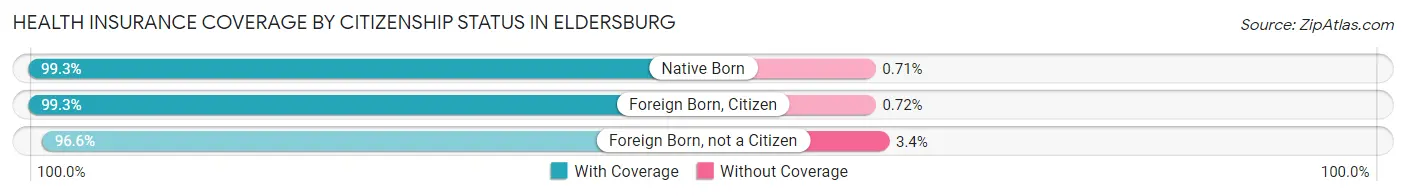
| Citizenship Status | With Coverage | Without Coverage |
| Native Born | 2,086 (99.3%) | 15 (0.7%) |
| Foreign Born, Citizen | 5,216 (99.3%) | 38 (0.7%) |
| Foreign Born, not a Citizen | 1,909 (96.6%) | 67 (3.4%) |
Health Insurance Coverage by Household Income in Eldersburg
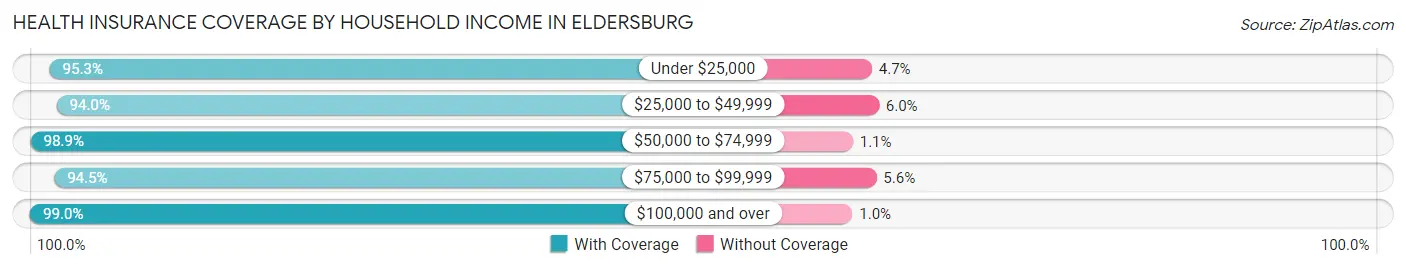
| Household Income | With Coverage | Without Coverage |
| Under $25,000 | 873 (95.3%) | 43 (4.7%) |
| $25,000 to $49,999 | 1,473 (94.0%) | 94 (6.0%) |
| $50,000 to $74,999 | 1,497 (98.9%) | 17 (1.1%) |
| $75,000 to $99,999 | 2,653 (94.5%) | 156 (5.6%) |
| $100,000 and over | 22,278 (99.0%) | 235 (1.0%) |
Public vs Private Health Insurance Coverage by Age in Eldersburg
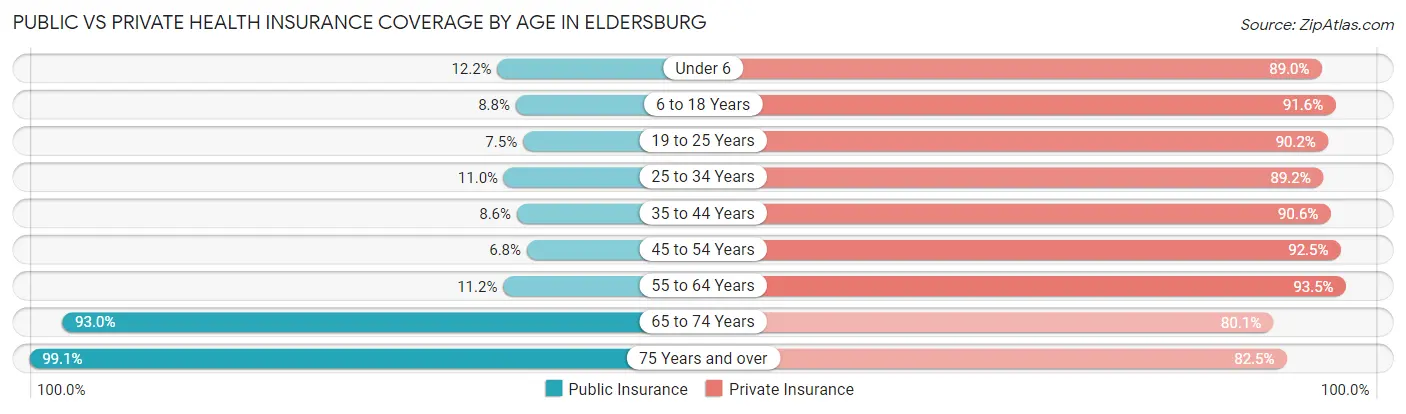
| Age Bracket | Public Insurance | Private Insurance |
| Under 6 | 257 (12.2%) | 1,870 (89.0%) |
| 6 to 18 Years | 464 (8.8%) | 4,810 (91.5%) |
| 19 to 25 Years | 148 (7.5%) | 1,782 (90.2%) |
| 25 to 34 Years | 331 (11.0%) | 2,677 (89.2%) |
| 35 to 44 Years | 341 (8.6%) | 3,581 (90.6%) |
| 45 to 54 Years | 305 (6.8%) | 4,170 (92.5%) |
| 55 to 64 Years | 484 (11.2%) | 4,055 (93.5%) |
| 65 to 74 Years | 2,337 (93.0%) | 2,011 (80.1%) |
| 75 Years and over | 1,836 (99.1%) | 1,528 (82.5%) |
| Total | 6,503 (22.1%) | 26,484 (89.8%) |
Disability Status by Sex by Age in Eldersburg
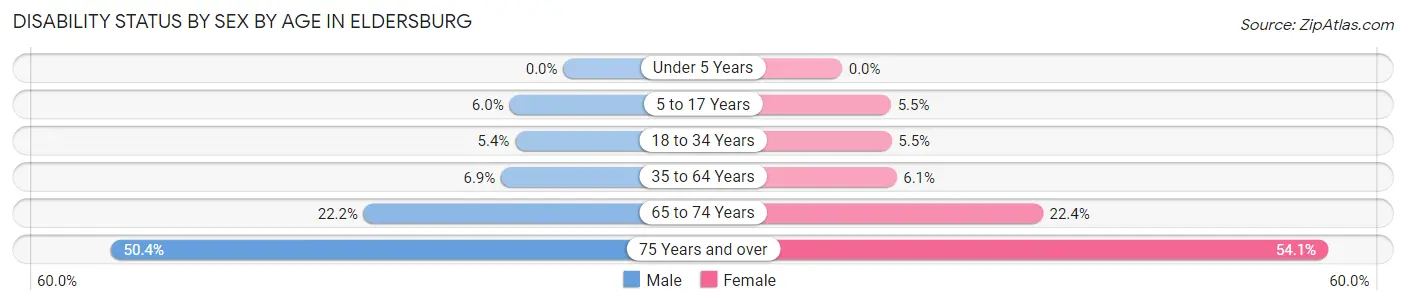
| Age Bracket | Male | Female |
| Under 5 Years | 0 (0.0%) | 0 (0.0%) |
| 5 to 17 Years | 166 (6.0%) | 143 (5.4%) |
| 18 to 34 Years | 127 (5.4%) | 162 (5.5%) |
| 35 to 64 Years | 457 (6.9%) | 377 (6.1%) |
| 65 to 74 Years | 266 (22.2%) | 294 (22.4%) |
| 75 Years and over | 373 (50.4%) | 602 (54.1%) |
Disability Class by Sex by Age in Eldersburg
Disability Class: Hearing Difficulty
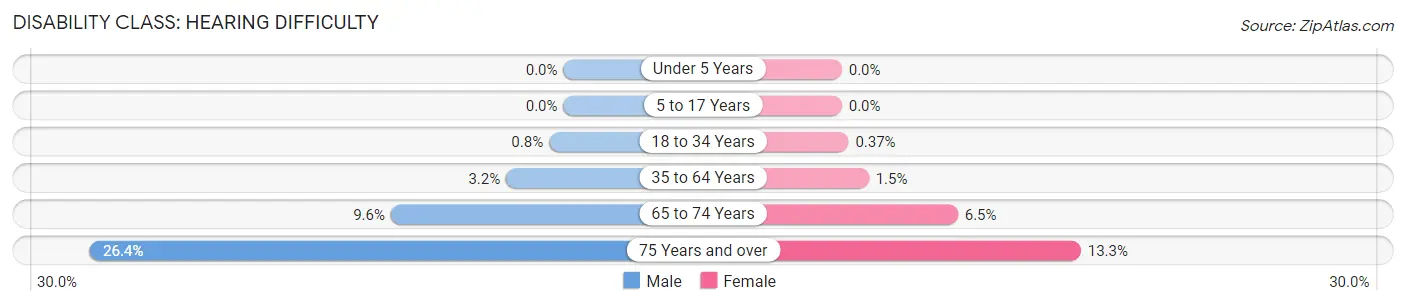
| Age Bracket | Male | Female |
| Under 5 Years | 0 (0.0%) | 0 (0.0%) |
| 5 to 17 Years | 0 (0.0%) | 0 (0.0%) |
| 18 to 34 Years | 19 (0.8%) | 11 (0.4%) |
| 35 to 64 Years | 210 (3.2%) | 93 (1.5%) |
| 65 to 74 Years | 115 (9.6%) | 85 (6.5%) |
| 75 Years and over | 195 (26.4%) | 148 (13.3%) |
Disability Class: Vision Difficulty
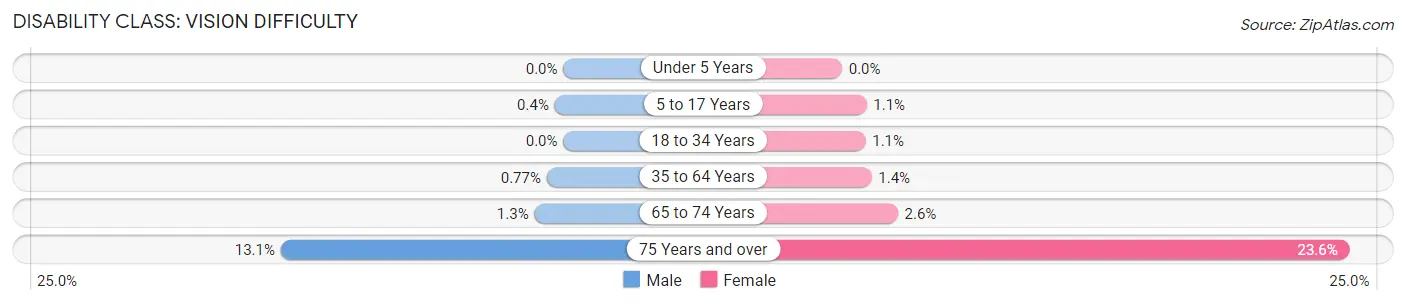
| Age Bracket | Male | Female |
| Under 5 Years | 0 (0.0%) | 0 (0.0%) |
| 5 to 17 Years | 11 (0.4%) | 30 (1.1%) |
| 18 to 34 Years | 0 (0.0%) | 32 (1.1%) |
| 35 to 64 Years | 51 (0.8%) | 85 (1.4%) |
| 65 to 74 Years | 16 (1.3%) | 34 (2.6%) |
| 75 Years and over | 97 (13.1%) | 262 (23.6%) |
Disability Class: Cognitive Difficulty
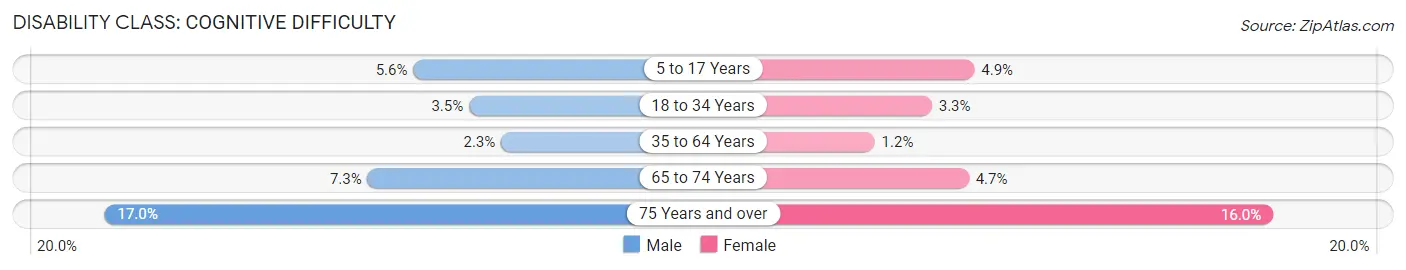
| Age Bracket | Male | Female |
| 5 to 17 Years | 154 (5.6%) | 129 (4.9%) |
| 18 to 34 Years | 83 (3.5%) | 98 (3.3%) |
| 35 to 64 Years | 152 (2.3%) | 76 (1.2%) |
| 65 to 74 Years | 87 (7.3%) | 62 (4.7%) |
| 75 Years and over | 126 (17.0%) | 178 (16.0%) |
Disability Class: Ambulatory Difficulty
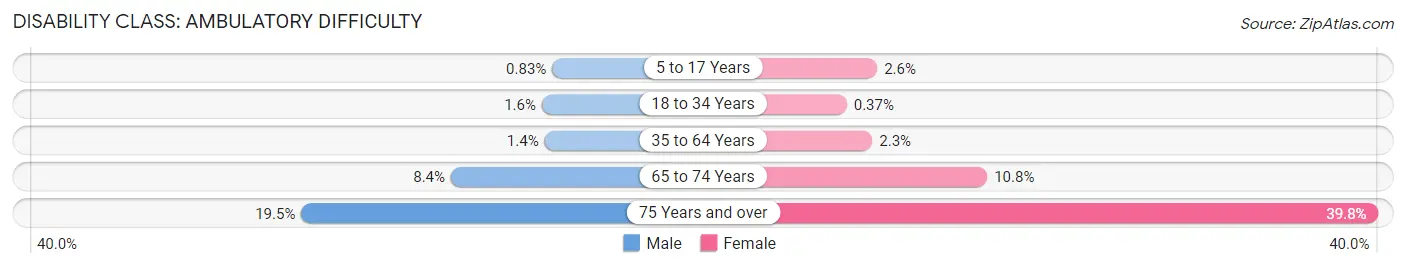
| Age Bracket | Male | Female |
| 5 to 17 Years | 23 (0.8%) | 69 (2.6%) |
| 18 to 34 Years | 38 (1.6%) | 11 (0.4%) |
| 35 to 64 Years | 92 (1.4%) | 141 (2.3%) |
| 65 to 74 Years | 100 (8.4%) | 142 (10.8%) |
| 75 Years and over | 144 (19.5%) | 443 (39.8%) |
Disability Class: Self-Care Difficulty
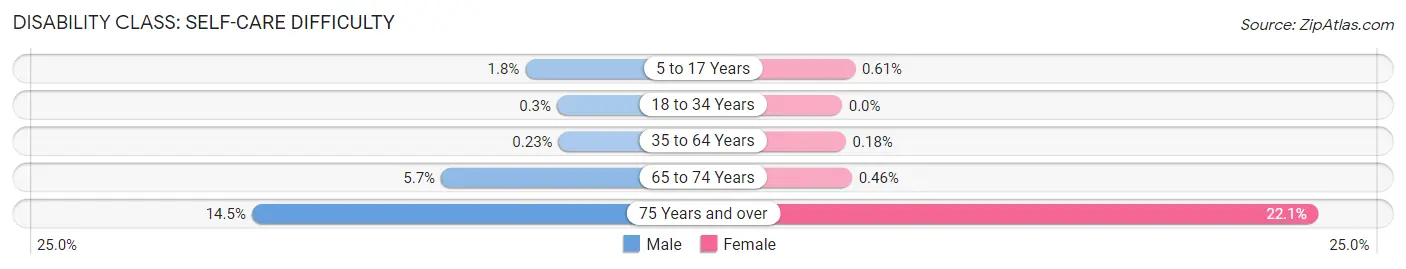
| Age Bracket | Male | Female |
| 5 to 17 Years | 49 (1.8%) | 16 (0.6%) |
| 18 to 34 Years | 7 (0.3%) | 0 (0.0%) |
| 35 to 64 Years | 15 (0.2%) | 11 (0.2%) |
| 65 to 74 Years | 68 (5.7%) | 6 (0.5%) |
| 75 Years and over | 107 (14.5%) | 246 (22.1%) |
Technology Access in Eldersburg
Computing Device Access in Eldersburg
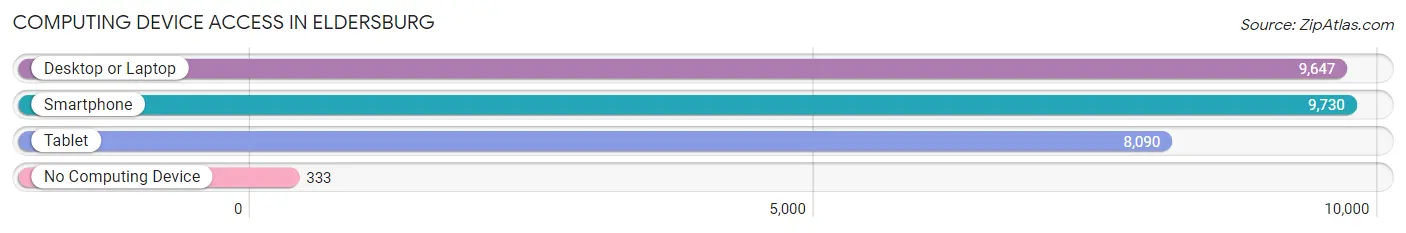
| Device Type | # Households | % Households |
| Desktop or Laptop | 9,647 | 91.2% |
| Smartphone | 9,730 | 92.0% |
| Tablet | 8,090 | 76.5% |
| No Computing Device | 333 | 3.2% |
| Total | 10,575 | 100.0% |
Internet Access in Eldersburg
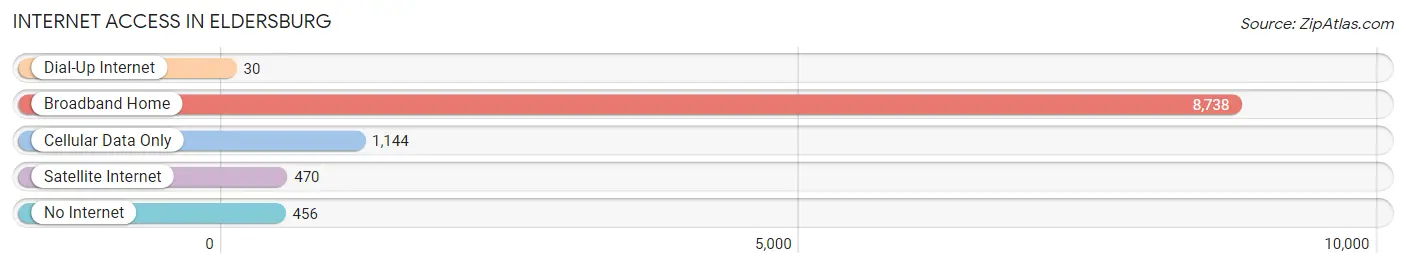
| Internet Type | # Households | % Households |
| Dial-Up Internet | 30 | 0.3% |
| Broadband Home | 8,738 | 82.6% |
| Cellular Data Only | 1,144 | 10.8% |
| Satellite Internet | 470 | 4.4% |
| No Internet | 456 | 4.3% |
| Total | 10,575 | 100.0% |
Eldersburg Summary
Eldersburg is an unincorporated community located in Carroll County, Maryland, United States. It is situated in the northern part of the county, approximately 20 miles northwest of Baltimore and 40 miles northeast of Washington, D.C. The population of Eldersburg was estimated to be 30,566 in 2019.
History
The area that is now Eldersburg was first settled in the late 1700s by German and English immigrants. The town was originally known as "Hoffman's Crossroads" after the Hoffman family, who owned a large farm in the area. In 1837, the town was renamed "Eldersburg" after the Elder family, who had purchased the Hoffman farm.
The town grew slowly over the next century, with the construction of a post office in 1851 and a railroad station in 1872. The town was officially incorporated in 1874.
In the early 20th century, Eldersburg began to experience rapid growth due to its proximity to Baltimore and Washington, D.C. The town was home to several large farms and businesses, including a canning factory, a brickyard, and a dairy.
Geography
Eldersburg is located in northern Carroll County, approximately 20 miles northwest of Baltimore and 40 miles northeast of Washington, D.C. The town is situated in the Piedmont region of Maryland, with rolling hills and valleys. The Patapsco River forms the eastern boundary of the town.
The climate in Eldersburg is temperate, with hot summers and cold winters. The average annual temperature is 54°F, and the average annual precipitation is 43 inches.
Economy
Eldersburg is primarily a residential community, with a few small businesses located in the town. The largest employers in the area are Carroll County Public Schools, Carroll Hospital Center, and the University of Maryland Medical Center.
The town is also home to several large retail stores, including Walmart, Target, and Home Depot. There are also several restaurants and bars in the area.
Demographics
As of 2019, the population of Eldersburg was estimated to be 30,566. The racial makeup of the town was 87.3% White, 6.2% African American, 2.2% Asian, and 1.3% Hispanic or Latino. The median household income was $90,945, and the median home value was $346,000.
The town is served by the Carroll County Public Schools system, which includes seven elementary schools, two middle schools, and two high schools. The town is also home to several private schools, including St. John's Catholic School and the Carroll Christian Academy.
Common Questions
What is Per Capita Income in Eldersburg?
Per Capita income in Eldersburg is $57,788.
What is the Median Family Income in Eldersburg?
Median Family Income in Eldersburg is $164,350.
What is the Median Household income in Eldersburg?
Median Household Income in Eldersburg is $143,148.
What is Income or Wage Gap in Eldersburg?
Income or Wage Gap in Eldersburg is 28.4%.
Women in Eldersburg earn 71.6 cents for every dollar earned by a man.
What is Inequality or Gini Index in Eldersburg?
Inequality or Gini Index in Eldersburg is 0.37.
What is the Total Population of Eldersburg?
Total Population of Eldersburg is 30,357.
What is the Total Male Population of Eldersburg?
Total Male Population of Eldersburg is 15,140.
What is the Total Female Population of Eldersburg?
Total Female Population of Eldersburg is 15,217.
What is the Ratio of Males per 100 Females in Eldersburg?
There are 99.49 Males per 100 Females in Eldersburg.
What is the Ratio of Females per 100 Males in Eldersburg?
There are 100.51 Females per 100 Males in Eldersburg.
What is the Median Population Age in Eldersburg?
Median Population Age in Eldersburg is 40.4 Years.
What is the Average Family Size in Eldersburg
Average Family Size in Eldersburg is 3.2 People.
What is the Average Household Size in Eldersburg
Average Household Size in Eldersburg is 2.8 People.
How Large is the Labor Force in Eldersburg?
There are 16,672 People in the Labor Forcein in Eldersburg.
What is the Percentage of People in the Labor Force in Eldersburg?
68.7% of People are in the Labor Force in Eldersburg.
What is the Unemployment Rate in Eldersburg?
Unemployment Rate in Eldersburg is 2.6%.