Parkville, MD Map & Demographics
Parkville Map
Parkville Overview
$39,550
PER CAPITA INCOME
$95,735
AVG FAMILY INCOME
$79,661
AVG HOUSEHOLD INCOME
27.1%
WAGE / INCOME GAP [ % ]
72.9¢/ $1
WAGE / INCOME GAP [ $ ]
$10,547
FAMILY INCOME DEFICIT
0.38
INEQUALITY / GINI INDEX
30,520
TOTAL POPULATION
13,988
MALE POPULATION
16,532
FEMALE POPULATION
84.61
MALES / 100 FEMALES
118.19
FEMALES / 100 MALES
37.6
MEDIAN AGE
3.0
AVG FAMILY SIZE
2.4
AVG HOUSEHOLD SIZE
17,425
LABOR FORCE [ PEOPLE ]
70.7%
PERCENT IN LABOR FORCE
5.7%
UNEMPLOYMENT RATE
Parkville Zip Codes
Income in Parkville
Income Overview in Parkville
Per Capita Income in Parkville is $39,550, while median incomes of families and households are $95,735 and $79,661 respectively.
| Characteristic | Number | Measure |
| Per Capita Income | 30,520 | $39,550 |
| Median Family Income | 7,667 | $95,735 |
| Mean Family Income | 7,667 | $105,733 |
| Median Household Income | 12,442 | $79,661 |
| Mean Household Income | 12,442 | $94,308 |
| Income Deficit | 7,667 | $10,547 |
| Wage / Income Gap (%) | 30,520 | 27.15% |
| Wage / Income Gap ($) | 30,520 | 72.85¢ per $1 |
| Gini / Inequality Index | 30,520 | 0.38 |
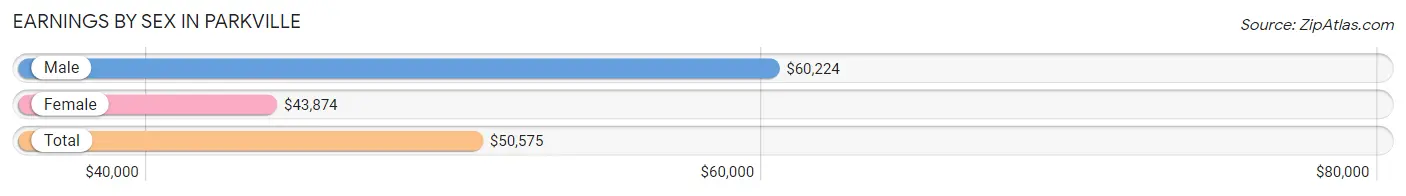
Earnings by Sex in Parkville
Average Earnings in Parkville are $50,575, $60,224 for men and $43,874 for women, a difference of 27.2%.
| Sex | Number | Average Earnings |
| Male | 8,022 (45.4%) | $60,224 |
| Female | 9,665 (54.6%) | $43,874 |
| Total | 17,687 (100.0%) | $50,575 |
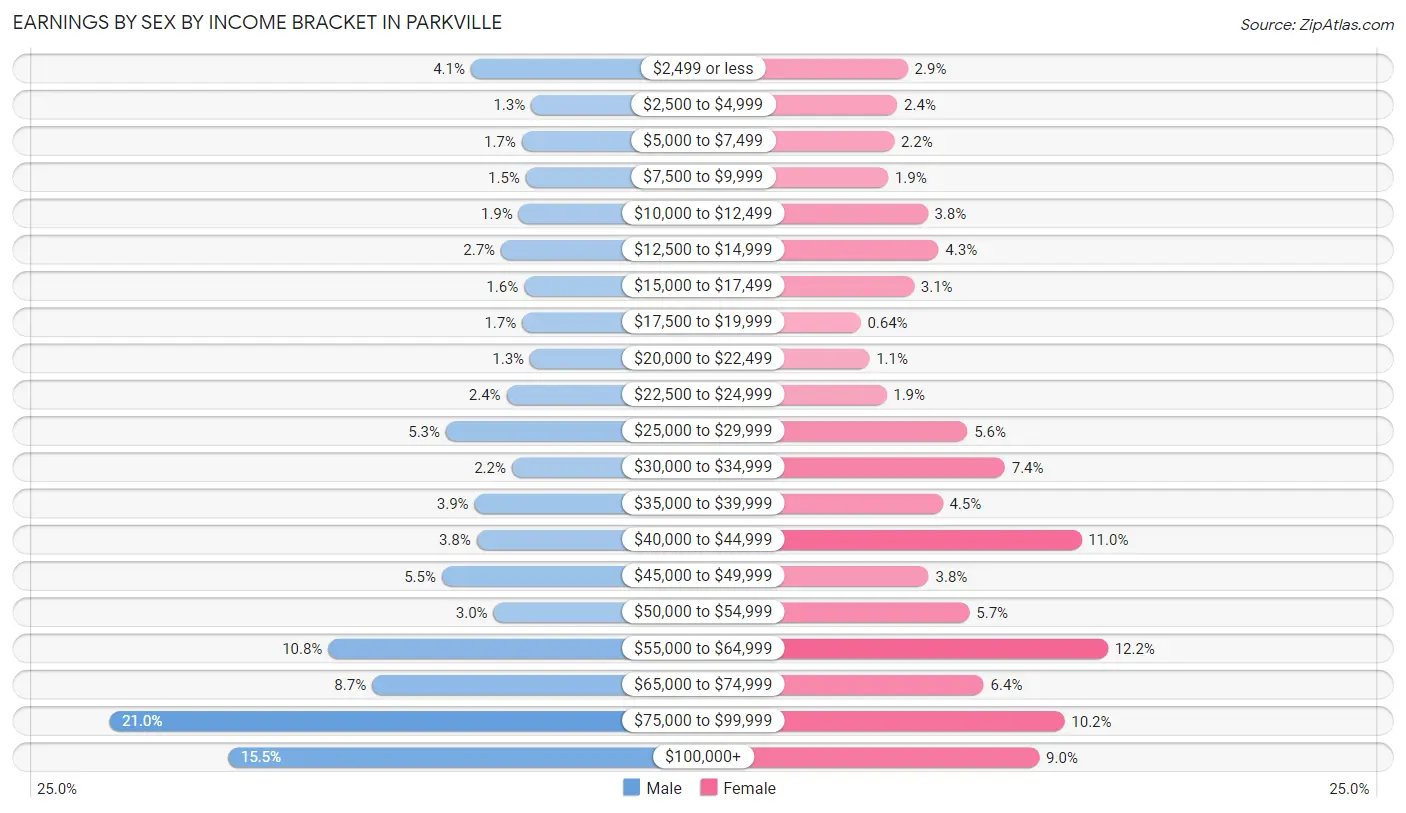
Earnings by Sex by Income Bracket in Parkville
The most common earnings brackets in Parkville are $75,000 to $99,999 for men (1,688 | 21.0%) and $55,000 to $64,999 for women (1,181 | 12.2%).
| Income | Male | Female |
| $2,499 or less | 329 (4.1%) | 275 (2.9%) |
| $2,500 to $4,999 | 103 (1.3%) | 228 (2.4%) |
| $5,000 to $7,499 | 138 (1.7%) | 214 (2.2%) |
| $7,500 to $9,999 | 123 (1.5%) | 187 (1.9%) |
| $10,000 to $12,499 | 149 (1.9%) | 365 (3.8%) |
| $12,500 to $14,999 | 216 (2.7%) | 415 (4.3%) |
| $15,000 to $17,499 | 129 (1.6%) | 303 (3.1%) |
| $17,500 to $19,999 | 136 (1.7%) | 62 (0.6%) |
| $20,000 to $22,499 | 107 (1.3%) | 101 (1.1%) |
| $22,500 to $24,999 | 195 (2.4%) | 179 (1.8%) |
| $25,000 to $29,999 | 423 (5.3%) | 545 (5.6%) |
| $30,000 to $34,999 | 175 (2.2%) | 715 (7.4%) |
| $35,000 to $39,999 | 315 (3.9%) | 433 (4.5%) |
| $40,000 to $44,999 | 307 (3.8%) | 1,061 (11.0%) |
| $45,000 to $49,999 | 438 (5.5%) | 370 (3.8%) |
| $50,000 to $54,999 | 244 (3.0%) | 555 (5.7%) |
| $55,000 to $64,999 | 865 (10.8%) | 1,181 (12.2%) |
| $65,000 to $74,999 | 700 (8.7%) | 620 (6.4%) |
| $75,000 to $99,999 | 1,688 (21.0%) | 985 (10.2%) |
| $100,000+ | 1,242 (15.5%) | 871 (9.0%) |
| Total | 8,022 (100.0%) | 9,665 (100.0%) |
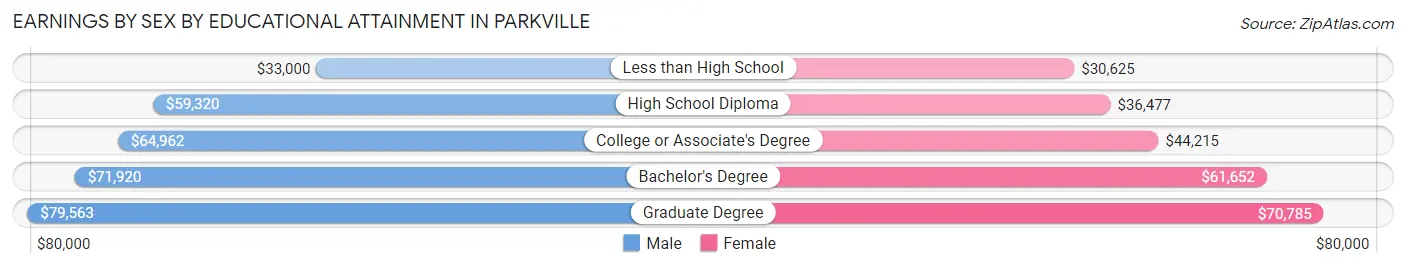
Earnings by Sex by Educational Attainment in Parkville
Average earnings in Parkville are $65,448 for men and $49,174 for women, a difference of 24.9%. Men with an educational attainment of graduate degree enjoy the highest average annual earnings of $79,563, while those with less than high school education earn the least with $33,000. Women with an educational attainment of graduate degree earn the most with the average annual earnings of $70,785, while those with less than high school education have the smallest earnings of $30,625.
| Educational Attainment | Male Income | Female Income |
| Less than High School | $33,000 | $30,625 |
| High School Diploma | $59,320 | $36,477 |
| College or Associate's Degree | $64,962 | $44,215 |
| Bachelor's Degree | $71,920 | $61,652 |
| Graduate Degree | $79,563 | $70,785 |
| Total | $65,448 | $49,174 |
Family Income in Parkville
Family Income Brackets in Parkville
According to the Parkville family income data, there are 2,193 families falling into the $100,000 to $149,999 income range, which is the most common income bracket and makes up 28.6% of all families. Conversely, the less than $10,000 income bracket is the least frequent group with only 84 families (1.1%) belonging to this category.
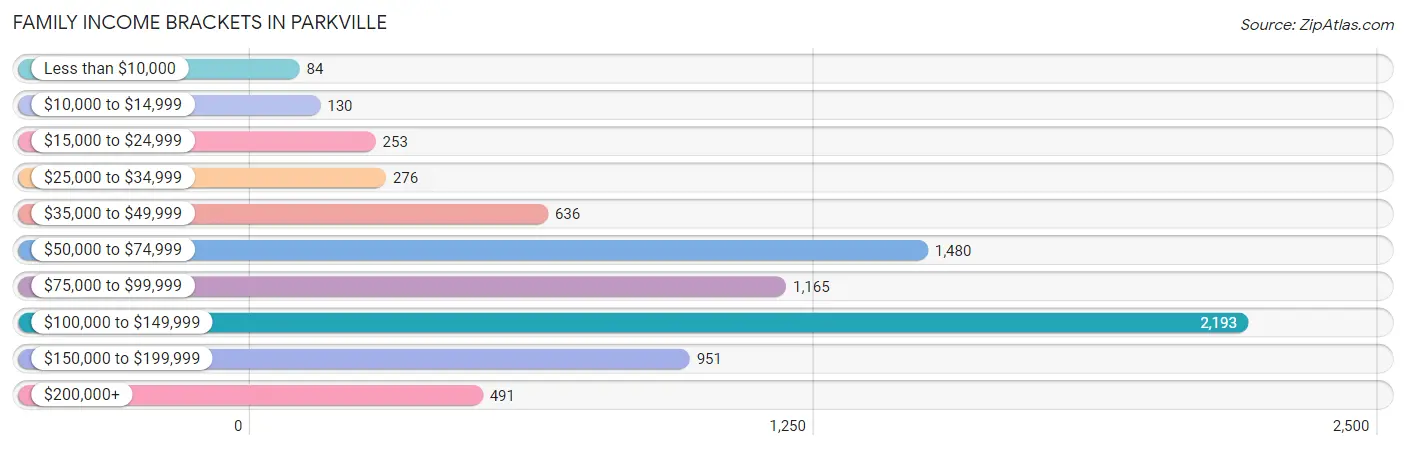
| Income Bracket | # Families | % Families |
| Less than $10,000 | 84 | 1.1% |
| $10,000 to $14,999 | 130 | 1.7% |
| $15,000 to $24,999 | 253 | 3.3% |
| $25,000 to $34,999 | 276 | 3.6% |
| $35,000 to $49,999 | 636 | 8.3% |
| $50,000 to $74,999 | 1,480 | 19.3% |
| $75,000 to $99,999 | 1,165 | 15.2% |
| $100,000 to $149,999 | 2,193 | 28.6% |
| $150,000 to $199,999 | 951 | 12.4% |
| $200,000+ | 491 | 6.4% |
Family Income by Famaliy Size in Parkville
5-person families (400 | 5.2%) account for the highest median family income in Parkville with $123,100 per family, while 2-person families (3,458 | 45.1%) have the highest median income of $40,454 per family member.
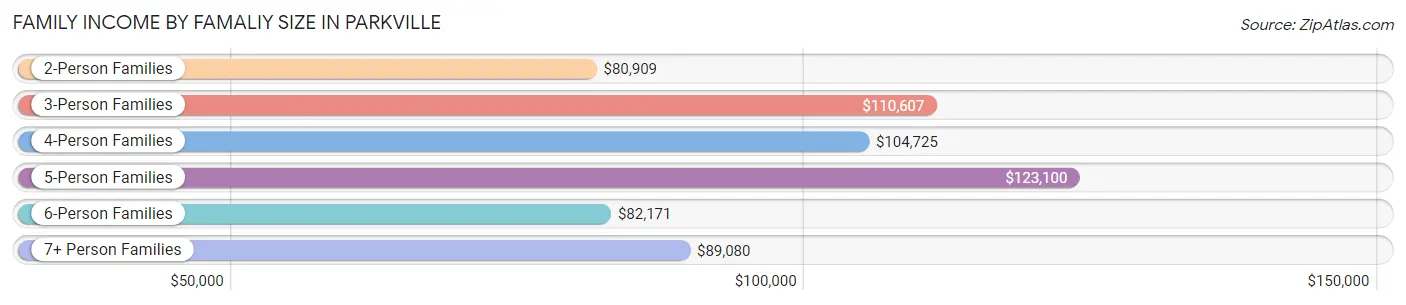
| Income Bracket | # Families | Median Income |
| 2-Person Families | 3,458 (45.1%) | $80,909 |
| 3-Person Families | 2,216 (28.9%) | $110,607 |
| 4-Person Families | 1,399 (18.2%) | $104,725 |
| 5-Person Families | 400 (5.2%) | $123,100 |
| 6-Person Families | 127 (1.7%) | $82,171 |
| 7+ Person Families | 67 (0.9%) | $89,080 |
| Total | 7,667 (100.0%) | $95,735 |
Family Income by Number of Earners in Parkville
The median family income in Parkville is $95,735, with families comprising 3+ earners (905) having the highest median family income of $134,338, while families with no earners (697) have the lowest median family income of $60,694, accounting for 11.8% and 9.1% of families, respectively.
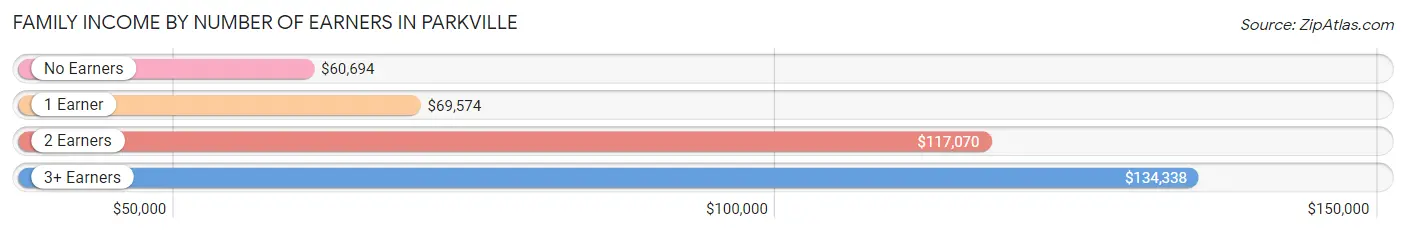
| Number of Earners | # Families | Median Income |
| No Earners | 697 (9.1%) | $60,694 |
| 1 Earner | 2,697 (35.2%) | $69,574 |
| 2 Earners | 3,368 (43.9%) | $117,070 |
| 3+ Earners | 905 (11.8%) | $134,338 |
| Total | 7,667 (100.0%) | $95,735 |
Household Income in Parkville
Household Income Brackets in Parkville
With 2,887 households falling in the category, the $100,000 to $149,999 income range is the most frequent in Parkville, accounting for 23.2% of all households. In contrast, only 336 households (2.7%) fall into the $10,000 to $14,999 income bracket, making it the least populous group.
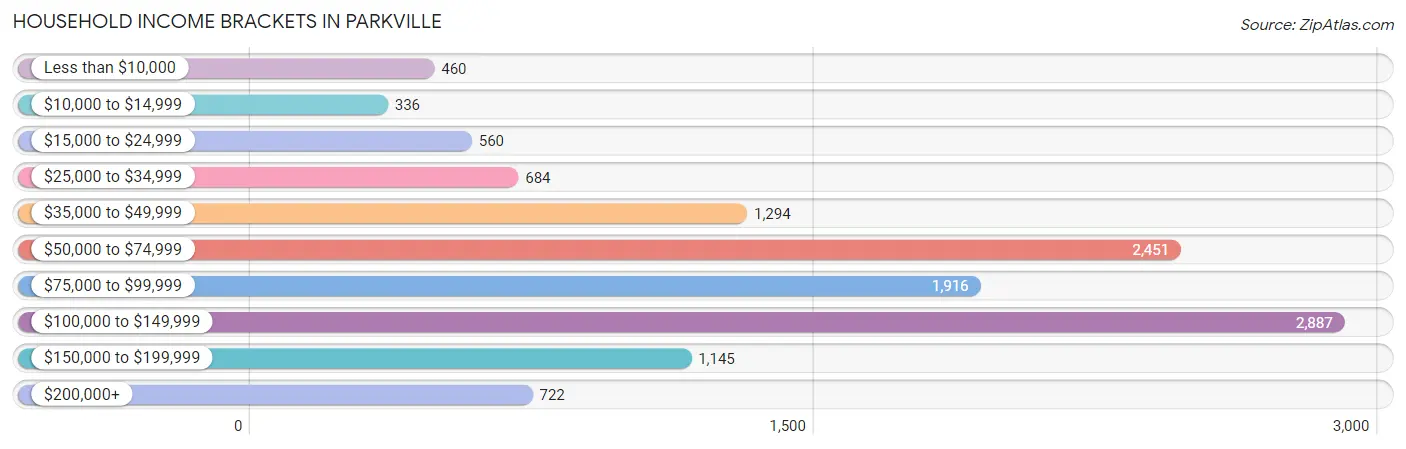
| Income Bracket | # Households | % Households |
| Less than $10,000 | 460 | 3.7% |
| $10,000 to $14,999 | 336 | 2.7% |
| $15,000 to $24,999 | 560 | 4.5% |
| $25,000 to $34,999 | 684 | 5.5% |
| $35,000 to $49,999 | 1,294 | 10.4% |
| $50,000 to $74,999 | 2,451 | 19.7% |
| $75,000 to $99,999 | 1,916 | 15.4% |
| $100,000 to $149,999 | 2,887 | 23.2% |
| $150,000 to $199,999 | 1,145 | 9.2% |
| $200,000+ | 722 | 5.8% |
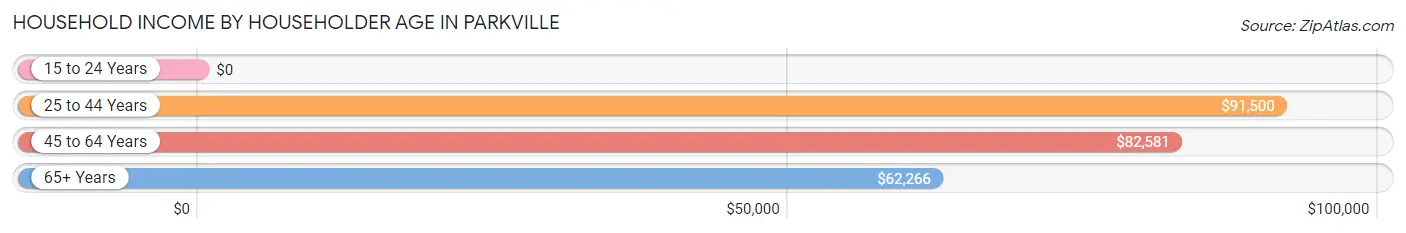
Household Income by Householder Age in Parkville
The median household income in Parkville is $79,661, with the highest median household income of $91,500 found in the 25 to 44 years age bracket for the primary householder. A total of 4,292 households (34.5%) fall into this category. Meanwhile, the 15 to 24 years age bracket for the primary householder has the lowest median household income of $0, with 300 households (2.4%) in this group.
| Income Bracket | # Households | Median Income |
| 15 to 24 Years | 300 (2.4%) | $0 |
| 25 to 44 Years | 4,292 (34.5%) | $91,500 |
| 45 to 64 Years | 5,146 (41.4%) | $82,581 |
| 65+ Years | 2,704 (21.7%) | $62,266 |
| Total | 12,442 (100.0%) | $79,661 |
Poverty in Parkville
Income Below Poverty by Sex and Age in Parkville
With 6.1% poverty level for males and 9.0% for females among the residents of Parkville, 15 year old males and 6 to 11 year old females are the most vulnerable to poverty, with 33 males (19.8%) and 181 females (18.3%) in their respective age groups living below the poverty level.
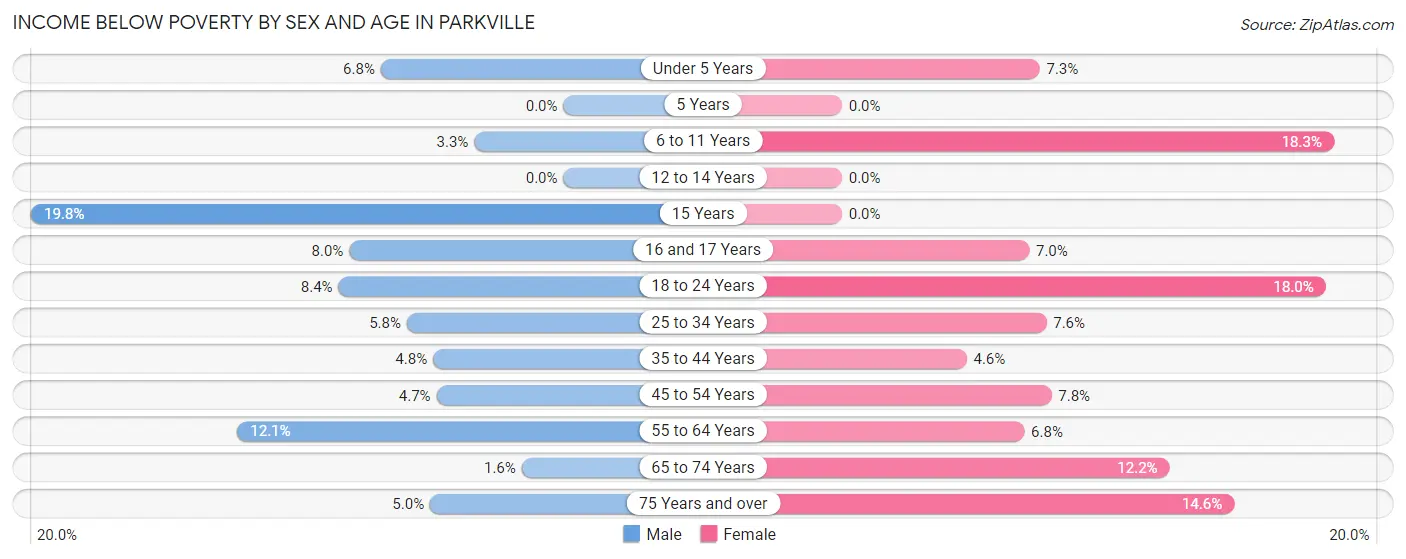
| Age Bracket | Male | Female |
| Under 5 Years | 62 (6.8%) | 79 (7.3%) |
| 5 Years | 0 (0.0%) | 0 (0.0%) |
| 6 to 11 Years | 37 (3.3%) | 181 (18.3%) |
| 12 to 14 Years | 0 (0.0%) | 0 (0.0%) |
| 15 Years | 33 (19.8%) | 0 (0.0%) |
| 16 and 17 Years | 35 (8.0%) | 34 (7.0%) |
| 18 to 24 Years | 76 (8.4%) | 257 (18.0%) |
| 25 to 34 Years | 106 (5.8%) | 214 (7.6%) |
| 35 to 44 Years | 102 (4.8%) | 102 (4.6%) |
| 45 to 54 Years | 87 (4.7%) | 171 (7.8%) |
| 55 to 64 Years | 255 (12.1%) | 132 (6.8%) |
| 65 to 74 Years | 19 (1.5%) | 164 (12.2%) |
| 75 Years and over | 27 (5.0%) | 131 (14.6%) |
| Total | 839 (6.1%) | 1,465 (9.0%) |
Income Above Poverty by Sex and Age in Parkville
According to the poverty statistics in Parkville, males aged 5 years and females aged 5 years are the age groups that are most secure financially, with 100.0% of males and 100.0% of females in these age groups living above the poverty line.
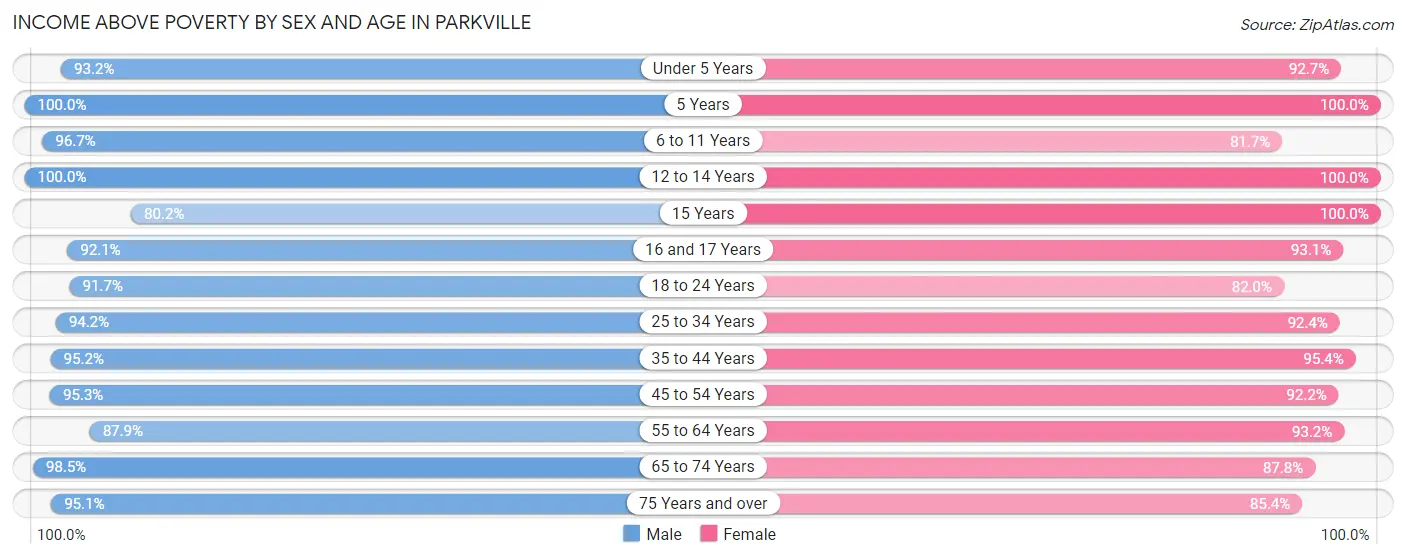
| Age Bracket | Male | Female |
| Under 5 Years | 852 (93.2%) | 998 (92.7%) |
| 5 Years | 148 (100.0%) | 295 (100.0%) |
| 6 to 11 Years | 1,081 (96.7%) | 810 (81.7%) |
| 12 to 14 Years | 477 (100.0%) | 372 (100.0%) |
| 15 Years | 134 (80.2%) | 234 (100.0%) |
| 16 and 17 Years | 405 (92.0%) | 455 (93.0%) |
| 18 to 24 Years | 834 (91.6%) | 1,174 (82.0%) |
| 25 to 34 Years | 1,720 (94.2%) | 2,604 (92.4%) |
| 35 to 44 Years | 2,005 (95.2%) | 2,099 (95.4%) |
| 45 to 54 Years | 1,759 (95.3%) | 2,027 (92.2%) |
| 55 to 64 Years | 1,852 (87.9%) | 1,818 (93.2%) |
| 65 to 74 Years | 1,206 (98.5%) | 1,185 (87.8%) |
| 75 Years and over | 519 (95.1%) | 769 (85.4%) |
| Total | 12,992 (93.9%) | 14,840 (91.0%) |
Income Below Poverty Among Married-Couple Families in Parkville
The poverty statistics for married-couple families in Parkville show that 1.3% or 57 of the total 4,531 families live below the poverty line. Families with no children have the highest poverty rate of 2.3%, comprising of 57 families. On the other hand, families with 1 or 2 children have the lowest poverty rate of 0.0%, which includes 0 families.
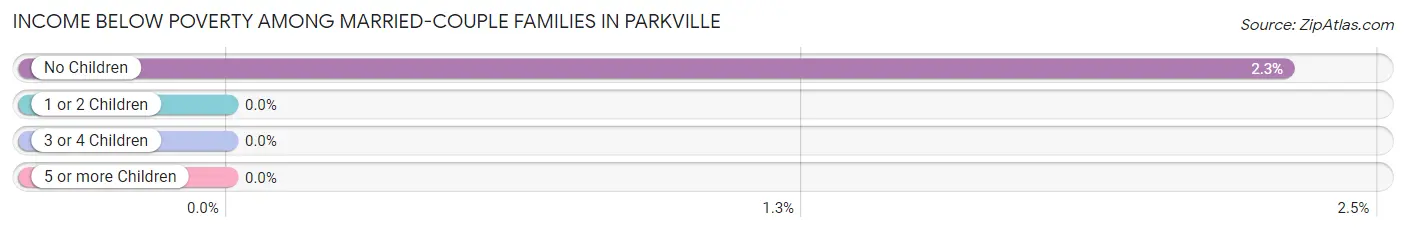
| Children | Above Poverty | Below Poverty |
| No Children | 2,416 (97.7%) | 57 (2.3%) |
| 1 or 2 Children | 1,761 (100.0%) | 0 (0.0%) |
| 3 or 4 Children | 297 (100.0%) | 0 (0.0%) |
| 5 or more Children | 0 (0.0%) | 0 (0.0%) |
| Total | 4,474 (98.7%) | 57 (1.3%) |
Income Below Poverty Among Single-Parent Households in Parkville
According to the poverty data in Parkville, 12.0% or 107 single-father households and 7.2% or 161 single-mother households are living below the poverty line. Among single-father households, those with 3 or 4 children have the highest poverty rate, with 44 households (63.8%) experiencing poverty. Likewise, among single-mother households, those with 1 or 2 children have the highest poverty rate, with 161 households (11.8%) falling below the poverty line.
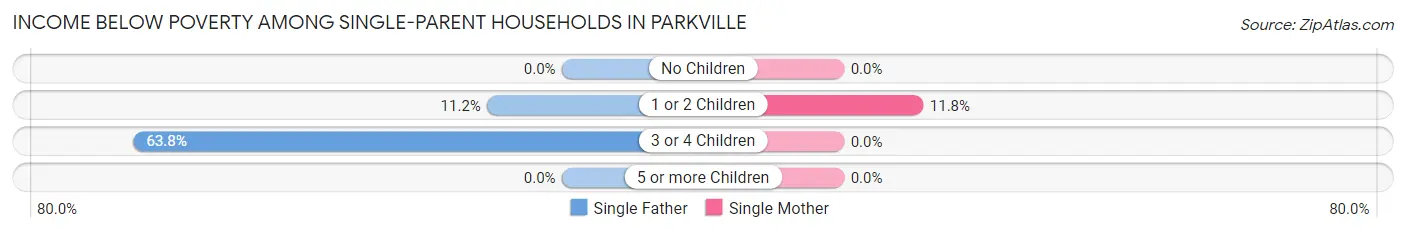
| Children | Single Father | Single Mother |
| No Children | 0 (0.0%) | 0 (0.0%) |
| 1 or 2 Children | 63 (11.2%) | 161 (11.8%) |
| 3 or 4 Children | 44 (63.8%) | 0 (0.0%) |
| 5 or more Children | 0 (0.0%) | 0 (0.0%) |
| Total | 107 (12.0%) | 161 (7.2%) |
Income Below Poverty Among Married-Couple vs Single-Parent Households in Parkville
The poverty data for Parkville shows that 57 of the married-couple family households (1.3%) and 268 of the single-parent households (8.6%) are living below the poverty level. Within the married-couple family households, those with no children have the highest poverty rate, with 57 households (2.3%) falling below the poverty line. Among the single-parent households, those with 3 or 4 children have the highest poverty rate, with 44 household (31.2%) living below poverty.
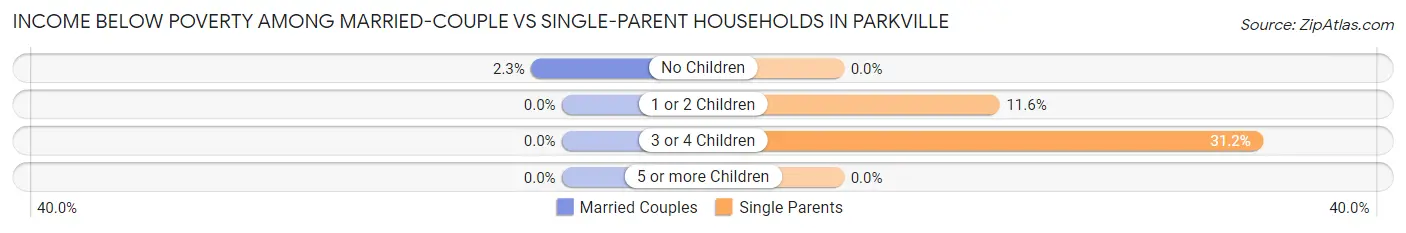
| Children | Married-Couple Families | Single-Parent Households |
| No Children | 57 (2.3%) | 0 (0.0%) |
| 1 or 2 Children | 0 (0.0%) | 224 (11.6%) |
| 3 or 4 Children | 0 (0.0%) | 44 (31.2%) |
| 5 or more Children | 0 (0.0%) | 0 (0.0%) |
| Total | 57 (1.3%) | 268 (8.6%) |
Race in Parkville
The most populous races in Parkville are White / Caucasian (16,567 | 54.3%), Black / African American (11,217 | 36.7%), and Hispanic or Latino (1,229 | 4.0%).
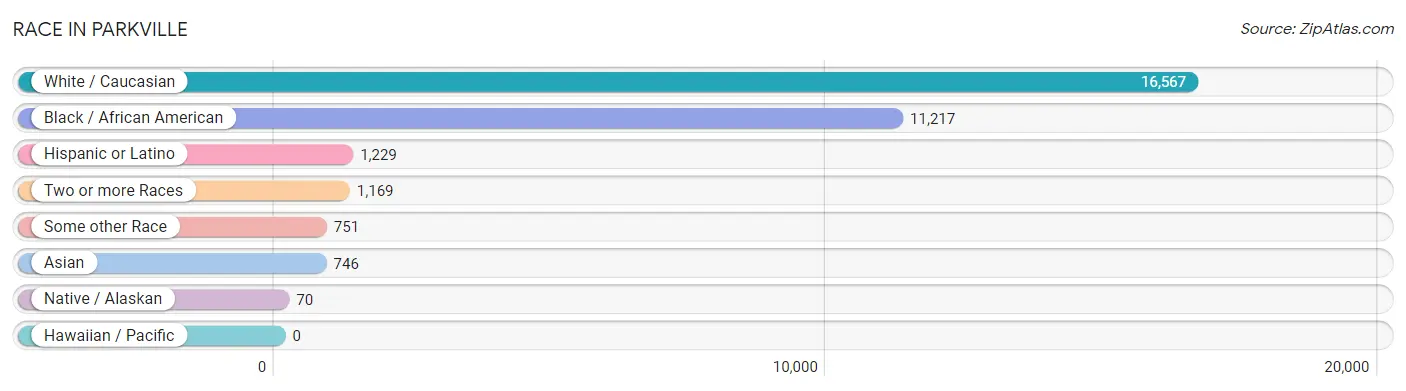
| Race | # Population | % Population |
| Asian | 746 | 2.4% |
| Black / African American | 11,217 | 36.7% |
| Hawaiian / Pacific | 0 | 0.0% |
| Hispanic or Latino | 1,229 | 4.0% |
| Native / Alaskan | 70 | 0.2% |
| White / Caucasian | 16,567 | 54.3% |
| Two or more Races | 1,169 | 3.8% |
| Some other Race | 751 | 2.5% |
| Total | 30,520 | 100.0% |
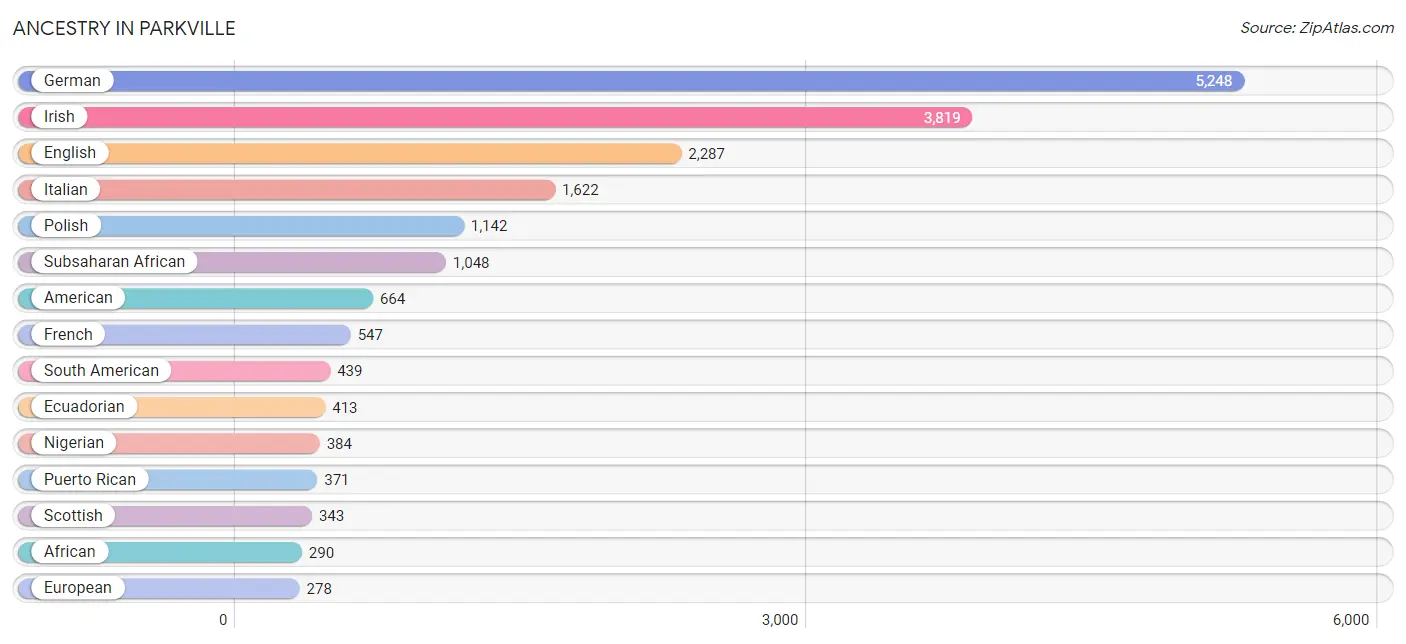
Ancestry in Parkville
The most populous ancestries reported in Parkville are German (5,248 | 17.2%), Irish (3,819 | 12.5%), English (2,287 | 7.5%), Italian (1,622 | 5.3%), and Polish (1,142 | 3.7%), together accounting for 46.2% of all Parkville residents.
| Ancestry | # Population | % Population |
| African | 290 | 0.9% |
| American | 664 | 2.2% |
| Arab | 54 | 0.2% |
| Argentinean | 7 | 0.0% |
| Armenian | 6 | 0.0% |
| Austrian | 28 | 0.1% |
| Barbadian | 12 | 0.0% |
| Belizean | 1 | 0.0% |
| Bhutanese | 157 | 0.5% |
| British | 90 | 0.3% |
| Canadian | 9 | 0.0% |
| Central American | 229 | 0.7% |
| Central American Indian | 61 | 0.2% |
| Cherokee | 42 | 0.1% |
| Cuban | 30 | 0.1% |
| Czech | 83 | 0.3% |
| Danish | 30 | 0.1% |
| Dominican | 14 | 0.1% |
| Dutch | 158 | 0.5% |
| Eastern European | 8 | 0.0% |
| Ecuadorian | 413 | 1.3% |
| English | 2,287 | 7.5% |
| Ethiopian | 19 | 0.1% |
| European | 278 | 0.9% |
| Finnish | 43 | 0.1% |
| French | 547 | 1.8% |
| French Canadian | 36 | 0.1% |
| German | 5,248 | 17.2% |
| Ghanaian | 93 | 0.3% |
| Greek | 144 | 0.5% |
| Guatemalan | 82 | 0.3% |
| Haitian | 12 | 0.0% |
| Houma | 10 | 0.0% |
| Hungarian | 9 | 0.0% |
| Indian (Asian) | 212 | 0.7% |
| Iranian | 43 | 0.1% |
| Irish | 3,819 | 12.5% |
| Italian | 1,622 | 5.3% |
| Jamaican | 122 | 0.4% |
| Japanese | 41 | 0.1% |
| Jordanian | 5 | 0.0% |
| Kenyan | 69 | 0.2% |
| Korean | 227 | 0.7% |
| Lebanese | 10 | 0.0% |
| Lithuanian | 42 | 0.1% |
| Lumbee | 47 | 0.2% |
| Mexican | 59 | 0.2% |
| Mexican American Indian | 16 | 0.1% |
| Moroccan | 29 | 0.1% |
| Nicaraguan | 34 | 0.1% |
| Nigerian | 384 | 1.3% |
| Norwegian | 69 | 0.2% |
| Pakistani | 20 | 0.1% |
| Palestinian | 10 | 0.0% |
| Peruvian | 19 | 0.1% |
| Polish | 1,142 | 3.7% |
| Portuguese | 41 | 0.1% |
| Puerto Rican | 371 | 1.2% |
| Romanian | 21 | 0.1% |
| Russian | 146 | 0.5% |
| Salvadoran | 113 | 0.4% |
| Scandinavian | 16 | 0.1% |
| Scotch-Irish | 147 | 0.5% |
| Scottish | 343 | 1.1% |
| Senegalese | 14 | 0.1% |
| Serbian | 4 | 0.0% |
| Slovak | 193 | 0.6% |
| South American | 439 | 1.4% |
| South American Indian | 19 | 0.1% |
| Spaniard | 26 | 0.1% |
| Sri Lankan | 45 | 0.2% |
| Subsaharan African | 1,048 | 3.4% |
| Swedish | 127 | 0.4% |
| Swiss | 81 | 0.3% |
| Thai | 139 | 0.5% |
| Trinidadian and Tobagonian | 218 | 0.7% |
| Ukrainian | 46 | 0.2% |
| Welsh | 135 | 0.4% |
| West Indian | 4 | 0.0% |
| Yugoslavian | 4 | 0.0% | View All 80 Rows |
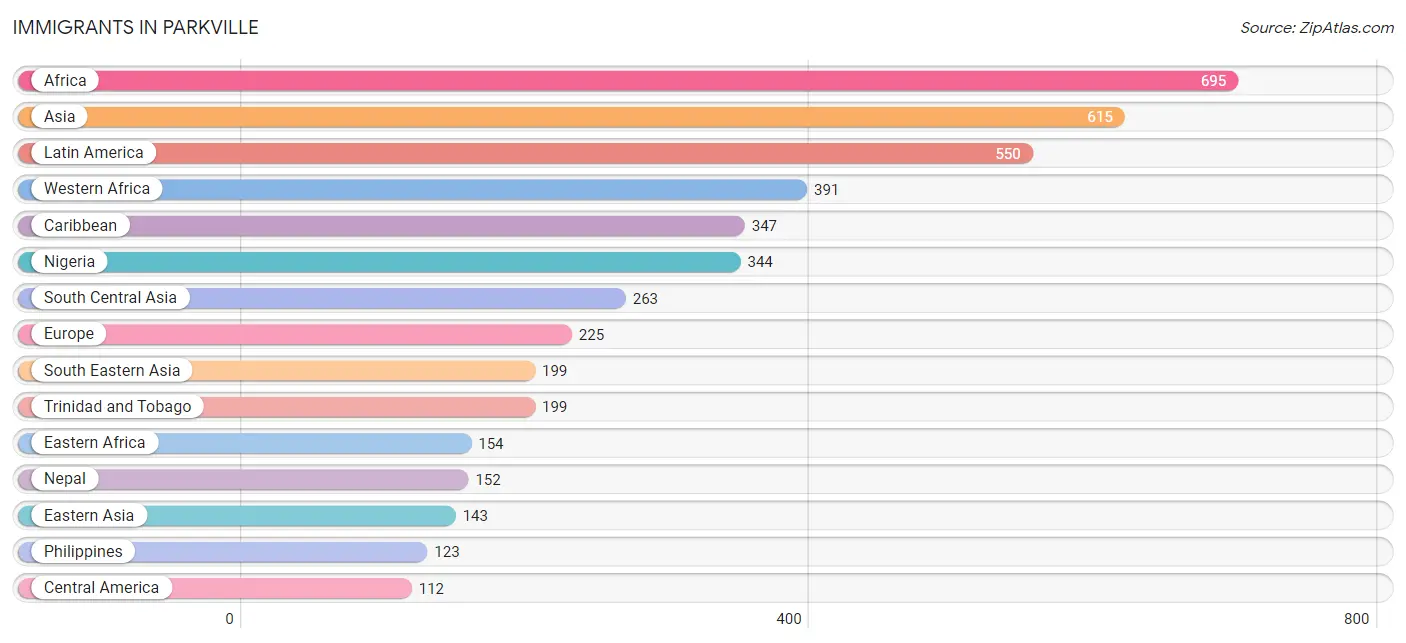
Immigrants in Parkville
The most numerous immigrant groups reported in Parkville came from Africa (695 | 2.3%), Asia (615 | 2.0%), Latin America (550 | 1.8%), Western Africa (391 | 1.3%), and Caribbean (347 | 1.1%), together accounting for 8.5% of all Parkville residents.
| Immigration Origin | # Population | % Population |
| Africa | 695 | 2.3% |
| Argentina | 7 | 0.0% |
| Asia | 615 | 2.0% |
| Barbados | 10 | 0.0% |
| Belgium | 20 | 0.1% |
| Belize | 1 | 0.0% |
| Bosnia and Herzegovina | 4 | 0.0% |
| Brazil | 12 | 0.0% |
| Cambodia | 31 | 0.1% |
| Cameroon | 78 | 0.3% |
| Canada | 21 | 0.1% |
| Caribbean | 347 | 1.1% |
| Central America | 112 | 0.4% |
| China | 86 | 0.3% |
| Cuba | 22 | 0.1% |
| Dominican Republic | 11 | 0.0% |
| Eastern Africa | 154 | 0.5% |
| Eastern Asia | 143 | 0.5% |
| Eastern Europe | 110 | 0.4% |
| Ecuador | 53 | 0.2% |
| El Salvador | 65 | 0.2% |
| Eritrea | 9 | 0.0% |
| Europe | 225 | 0.7% |
| Germany | 43 | 0.1% |
| Ghana | 33 | 0.1% |
| Greece | 5 | 0.0% |
| Guatemala | 45 | 0.2% |
| India | 66 | 0.2% |
| Iran | 36 | 0.1% |
| Ireland | 46 | 0.2% |
| Jamaica | 87 | 0.3% |
| Japan | 57 | 0.2% |
| Kenya | 90 | 0.3% |
| Latin America | 550 | 1.8% |
| Lebanon | 10 | 0.0% |
| Mexico | 1 | 0.0% |
| Middle Africa | 82 | 0.3% |
| Morocco | 33 | 0.1% |
| Nepal | 152 | 0.5% |
| Nigeria | 344 | 1.1% |
| Northern Africa | 33 | 0.1% |
| Northern Europe | 46 | 0.2% |
| Peru | 19 | 0.1% |
| Philippines | 123 | 0.4% |
| Poland | 51 | 0.2% |
| Romania | 12 | 0.0% |
| Russia | 39 | 0.1% |
| Senegal | 14 | 0.1% |
| Serbia | 4 | 0.0% |
| South America | 91 | 0.3% |
| South Central Asia | 263 | 0.9% |
| South Eastern Asia | 199 | 0.6% |
| Southern Europe | 6 | 0.0% |
| Spain | 1 | 0.0% |
| Sri Lanka | 9 | 0.0% |
| Trinidad and Tobago | 199 | 0.6% |
| Uganda | 1 | 0.0% |
| Vietnam | 45 | 0.2% |
| West Indies | 18 | 0.1% |
| Western Africa | 391 | 1.3% |
| Western Asia | 10 | 0.0% |
| Western Europe | 63 | 0.2% | View All 62 Rows |
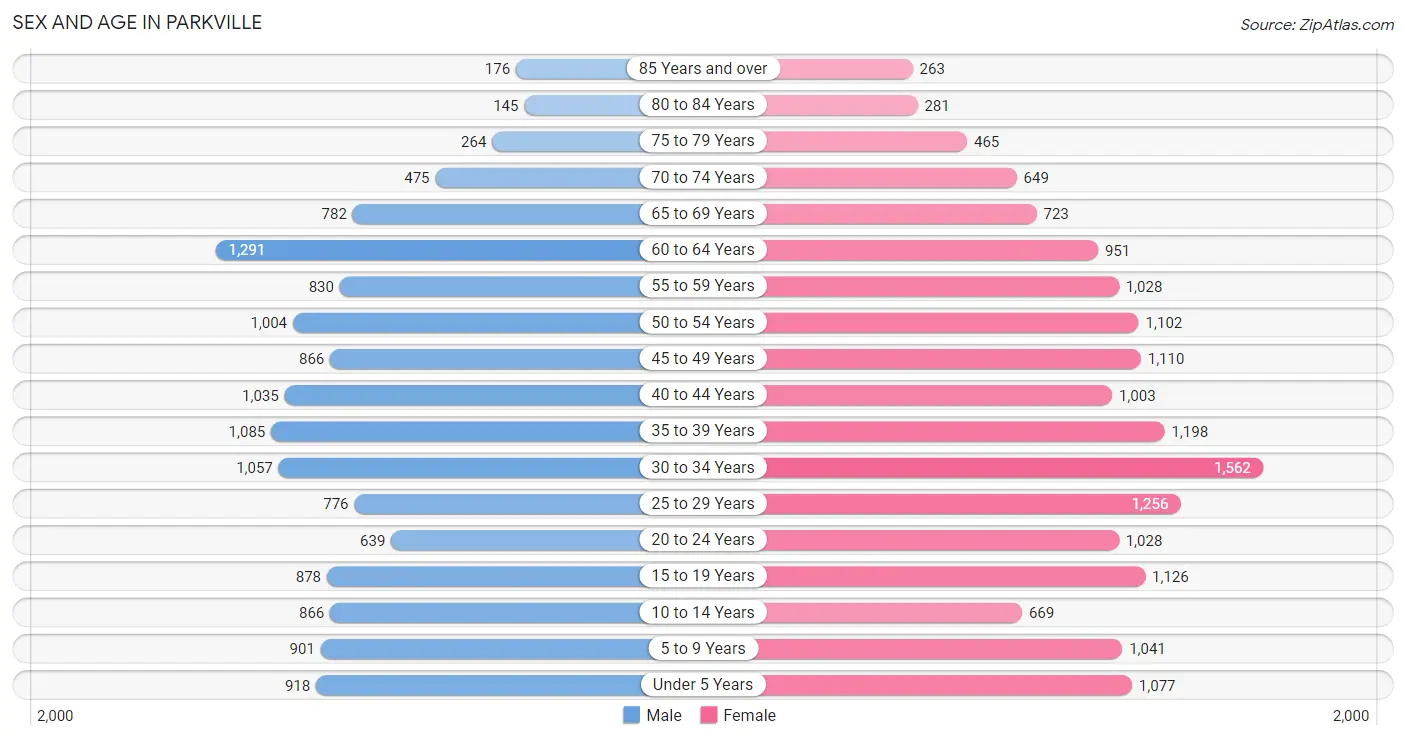
Sex and Age in Parkville
Sex and Age in Parkville
The most populous age groups in Parkville are 60 to 64 Years (1,291 | 9.2%) for men and 30 to 34 Years (1,562 | 9.5%) for women.
| Age Bracket | Male | Female |
| Under 5 Years | 918 (6.6%) | 1,077 (6.5%) |
| 5 to 9 Years | 901 (6.4%) | 1,041 (6.3%) |
| 10 to 14 Years | 866 (6.2%) | 669 (4.1%) |
| 15 to 19 Years | 878 (6.3%) | 1,126 (6.8%) |
| 20 to 24 Years | 639 (4.6%) | 1,028 (6.2%) |
| 25 to 29 Years | 776 (5.6%) | 1,256 (7.6%) |
| 30 to 34 Years | 1,057 (7.6%) | 1,562 (9.5%) |
| 35 to 39 Years | 1,085 (7.8%) | 1,198 (7.2%) |
| 40 to 44 Years | 1,035 (7.4%) | 1,003 (6.1%) |
| 45 to 49 Years | 866 (6.2%) | 1,110 (6.7%) |
| 50 to 54 Years | 1,004 (7.2%) | 1,102 (6.7%) |
| 55 to 59 Years | 830 (5.9%) | 1,028 (6.2%) |
| 60 to 64 Years | 1,291 (9.2%) | 951 (5.8%) |
| 65 to 69 Years | 782 (5.6%) | 723 (4.4%) |
| 70 to 74 Years | 475 (3.4%) | 649 (3.9%) |
| 75 to 79 Years | 264 (1.9%) | 465 (2.8%) |
| 80 to 84 Years | 145 (1.0%) | 281 (1.7%) |
| 85 Years and over | 176 (1.3%) | 263 (1.6%) |
| Total | 13,988 (100.0%) | 16,532 (100.0%) |
Families and Households in Parkville
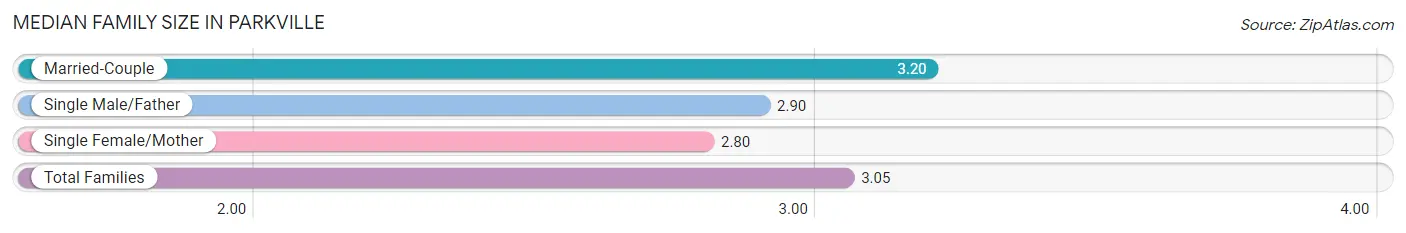
Median Family Size in Parkville
The median family size in Parkville is 3.05 persons per family, with married-couple families (4,531 | 59.1%) accounting for the largest median family size of 3.2 persons per family. On the other hand, single female/mother families (2,247 | 29.3%) represent the smallest median family size with 2.80 persons per family.
| Family Type | # Families | Family Size |
| Married-Couple | 4,531 (59.1%) | 3.20 |
| Single Male/Father | 889 (11.6%) | 2.90 |
| Single Female/Mother | 2,247 (29.3%) | 2.80 |
| Total Families | 7,667 (100.0%) | 3.05 |
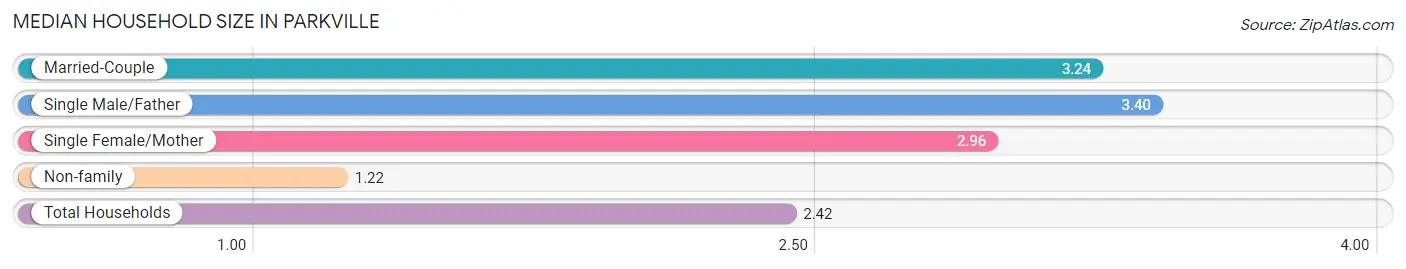
Median Household Size in Parkville
The median household size in Parkville is 2.42 persons per household, with single male/father households (889 | 7.1%) accounting for the largest median household size of 3.4 persons per household. non-family households (4,775 | 38.4%) represent the smallest median household size with 1.22 persons per household.
| Household Type | # Households | Household Size |
| Married-Couple | 4,531 (36.4%) | 3.24 |
| Single Male/Father | 889 (7.1%) | 3.40 |
| Single Female/Mother | 2,247 (18.1%) | 2.96 |
| Non-family | 4,775 (38.4%) | 1.22 |
| Total Households | 12,442 (100.0%) | 2.42 |
Household Size by Marriage Status in Parkville
Out of a total of 12,442 households in Parkville, 7,667 (61.6%) are family households, while 4,775 (38.4%) are nonfamily households. The most numerous type of family households are 2-person households, comprising 3,170, and the most common type of nonfamily households are 1-person households, comprising 4,058.
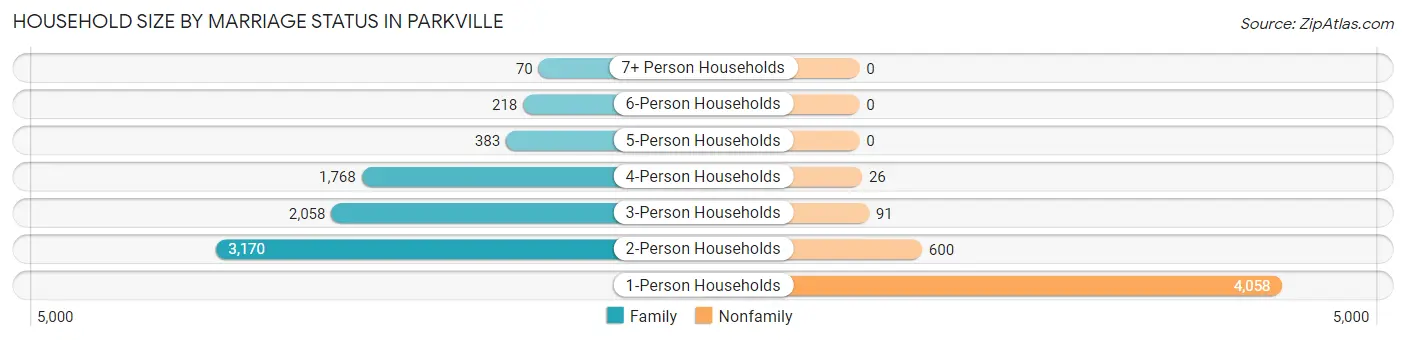
| Household Size | Family Households | Nonfamily Households |
| 1-Person Households | - | 4,058 (32.6%) |
| 2-Person Households | 3,170 (25.5%) | 600 (4.8%) |
| 3-Person Households | 2,058 (16.5%) | 91 (0.7%) |
| 4-Person Households | 1,768 (14.2%) | 26 (0.2%) |
| 5-Person Households | 383 (3.1%) | 0 (0.0%) |
| 6-Person Households | 218 (1.8%) | 0 (0.0%) |
| 7+ Person Households | 70 (0.6%) | 0 (0.0%) |
| Total | 7,667 (61.6%) | 4,775 (38.4%) |
Female Fertility in Parkville
Fertility by Age in Parkville
Average fertility rate in Parkville is 46.0 births per 1,000 women. Women in the age bracket of 20 to 34 years have the highest fertility rate with 66.0 births per 1,000 women. Women in the age bracket of 20 to 34 years acount for 65.5% of all women with births.
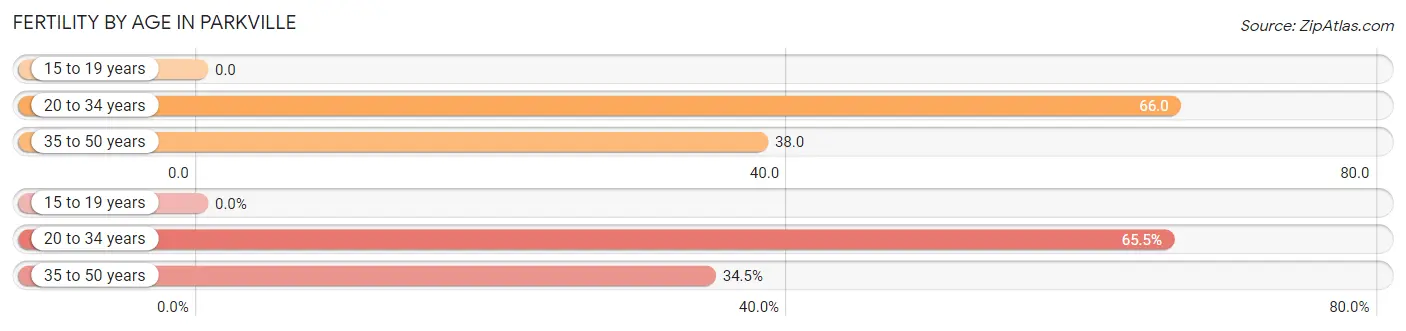
| Age Bracket | Women with Births | Births / 1,000 Women |
| 15 to 19 years | 0 (0.0%) | 0.0 |
| 20 to 34 years | 253 (65.5%) | 66.0 |
| 35 to 50 years | 133 (34.5%) | 38.0 |
| Total | 386 (100.0%) | 46.0 |
Fertility by Age by Marriage Status in Parkville
68.7% of women with births (386) in Parkville are married. The highest percentage of unmarried women with births falls into 20 to 34 years age bracket with 45.9% of them unmarried at the time of birth, while the lowest percentage of unmarried women with births belong to 35 to 50 years age bracket with 3.8% of them unmarried.
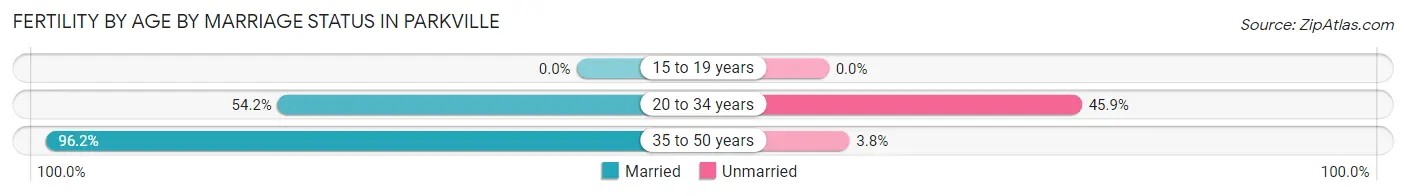
| Age Bracket | Married | Unmarried |
| 15 to 19 years | 0 (0.0%) | 0 (0.0%) |
| 20 to 34 years | 137 (54.1%) | 116 (45.9%) |
| 35 to 50 years | 128 (96.2%) | 5 (3.8%) |
| Total | 265 (68.6%) | 121 (31.4%) |
Fertility by Education in Parkville
Average fertility rate in Parkville is 46.0 births per 1,000 women. Women with the education attainment of graduate degree have the highest fertility rate of 74.0 births per 1,000 women, while women with the education attainment of less than high school have the lowest fertility at 12.0 births per 1,000 women. Women with the education attainment of college or associate's degree represent 44.6% of all women with births.
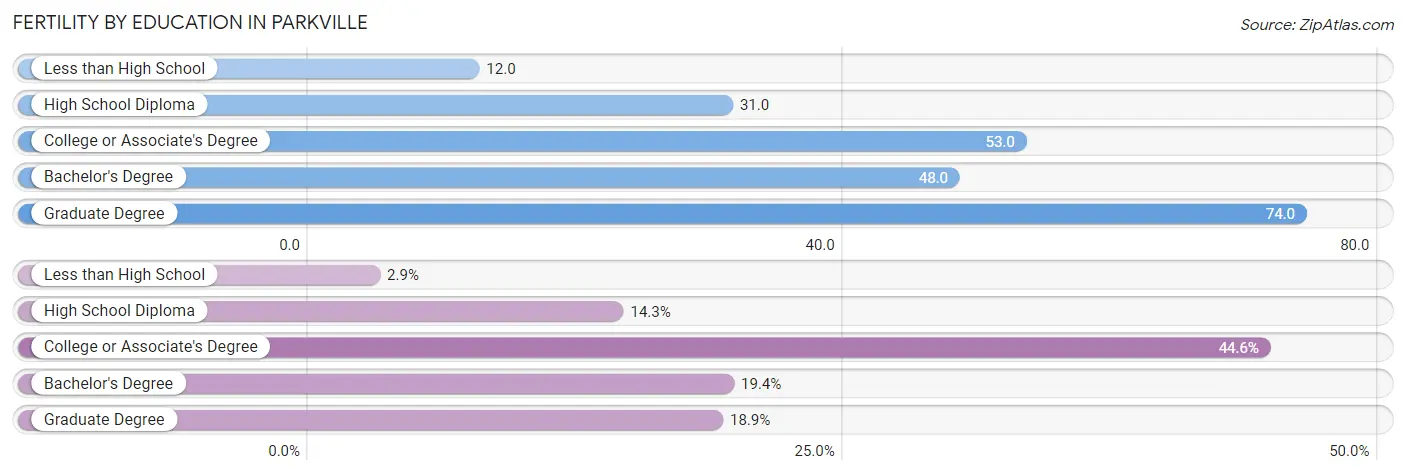
| Educational Attainment | Women with Births | Births / 1,000 Women |
| Less than High School | 11 (2.9%) | 12.0 |
| High School Diploma | 55 (14.2%) | 31.0 |
| College or Associate's Degree | 172 (44.6%) | 53.0 |
| Bachelor's Degree | 75 (19.4%) | 48.0 |
| Graduate Degree | 73 (18.9%) | 74.0 |
| Total | 386 (100.0%) | 46.0 |
Fertility by Education by Marriage Status in Parkville
31.4% of women with births in Parkville are unmarried. Women with the educational attainment of less than high school are most likely to be married with 100.0% of them married at childbirth, while women with the educational attainment of high school diploma are least likely to be married with 45.5% of them unmarried at childbirth.
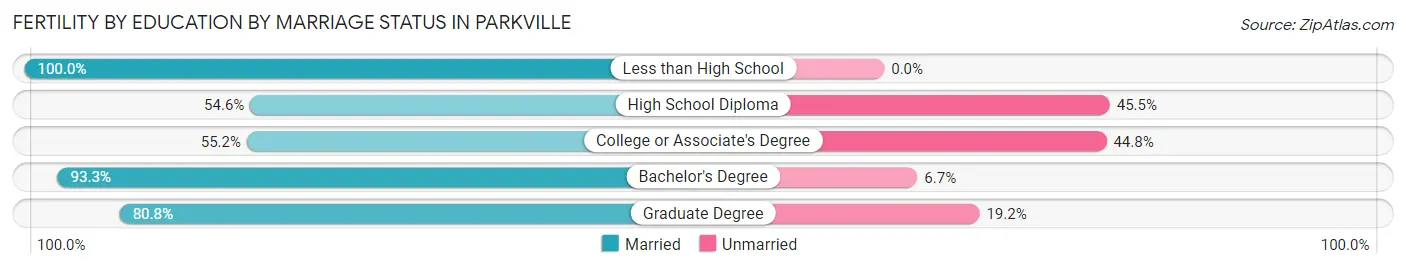
| Educational Attainment | Married | Unmarried |
| Less than High School | 11 (100.0%) | 0 (0.0%) |
| High School Diploma | 30 (54.5%) | 25 (45.5%) |
| College or Associate's Degree | 95 (55.2%) | 77 (44.8%) |
| Bachelor's Degree | 70 (93.3%) | 5 (6.7%) |
| Graduate Degree | 59 (80.8%) | 14 (19.2%) |
| Total | 265 (68.6%) | 121 (31.4%) |
Employment Characteristics in Parkville
Employment by Class of Employer in Parkville
Among the 16,084 employed individuals in Parkville, private company employees (10,434 | 64.9%), not-for-profit organizations (1,712 | 10.6%), and state government employees (1,200 | 7.5%) make up the most common classes of employment.
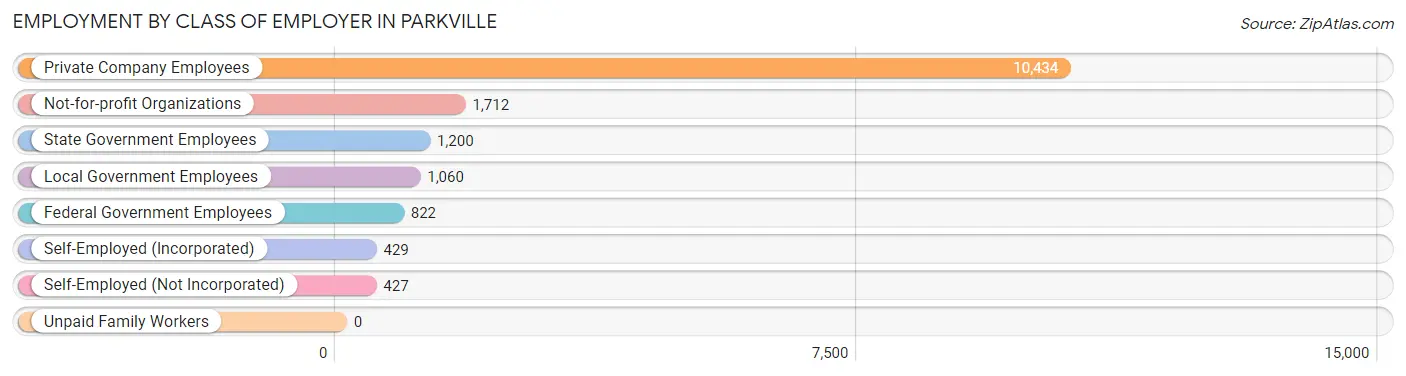
| Employer Class | # Employees | % Employees |
| Private Company Employees | 10,434 | 64.9% |
| Self-Employed (Incorporated) | 429 | 2.7% |
| Self-Employed (Not Incorporated) | 427 | 2.6% |
| Not-for-profit Organizations | 1,712 | 10.6% |
| Local Government Employees | 1,060 | 6.6% |
| State Government Employees | 1,200 | 7.5% |
| Federal Government Employees | 822 | 5.1% |
| Unpaid Family Workers | 0 | 0.0% |
| Total | 16,084 | 100.0% |
Employment Status by Age in Parkville
According to the labor force statistics for Parkville, out of the total population over 16 years of age (24,647), 70.7% or 17,425 individuals are in the labor force, with 5.7% or 993 of them unemployed. The age group with the highest labor force participation rate is 45 to 54 years, with 91.8% or 3,747 individuals in the labor force. Within the labor force, the 16 to 19 years age range has the highest percentage of unemployed individuals, with 16.3% or 124 of them being unemployed.
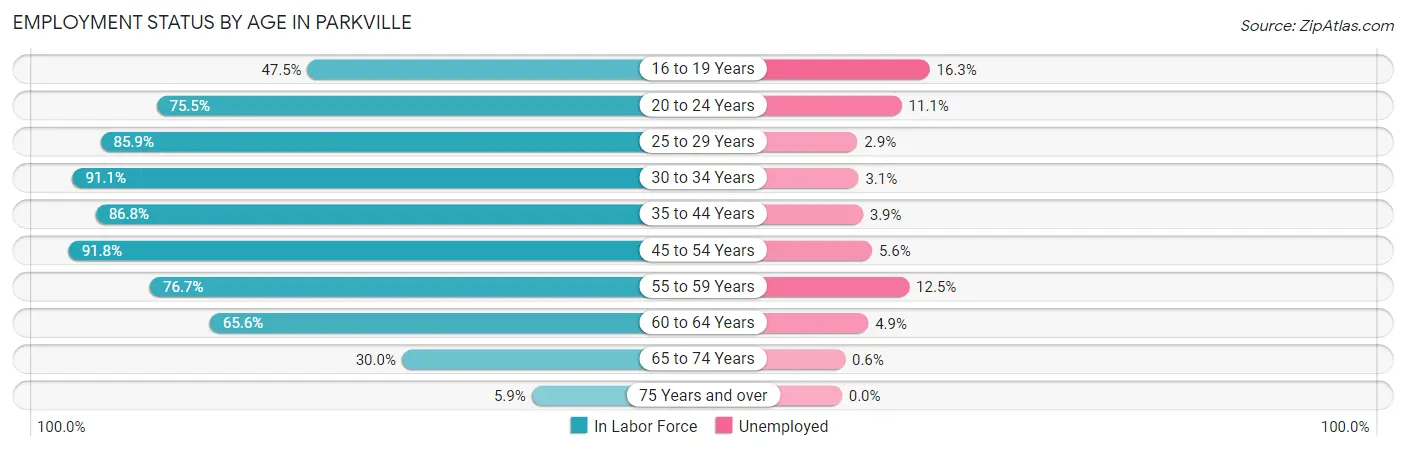
| Age Bracket | In Labor Force | Unemployed |
| 16 to 19 Years | 761 (47.5%) | 124 (16.3%) |
| 20 to 24 Years | 1,259 (75.5%) | 140 (11.1%) |
| 25 to 29 Years | 1,745 (85.9%) | 51 (2.9%) |
| 30 to 34 Years | 2,386 (91.1%) | 74 (3.1%) |
| 35 to 44 Years | 3,751 (86.8%) | 146 (3.9%) |
| 45 to 54 Years | 3,747 (91.8%) | 210 (5.6%) |
| 55 to 59 Years | 1,425 (76.7%) | 178 (12.5%) |
| 60 to 64 Years | 1,471 (65.6%) | 72 (4.9%) |
| 65 to 74 Years | 789 (30.0%) | 5 (0.6%) |
| 75 Years and over | 94 (5.9%) | 0 (0.0%) |
| Total | 17,425 (70.7%) | 993 (5.7%) |
Employment Status by Educational Attainment in Parkville
According to labor force statistics for Parkville, 84.7% of individuals (14,529) out of the total population between 25 and 64 years of age (17,154) are in the labor force, with 5.0% or 726 of them being unemployed. The group with the highest labor force participation rate are those with the educational attainment of bachelor's degree or higher, with 90.3% or 5,191 individuals in the labor force. Within the labor force, individuals with less than high school education have the highest percentage of unemployment, with 18.0% or 110 of them being unemployed.
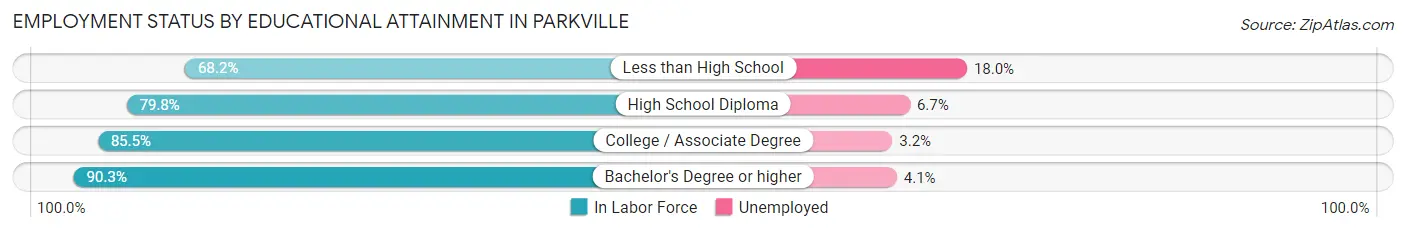
| Educational Attainment | In Labor Force | Unemployed |
| Less than High School | 612 (68.2%) | 161 (18.0%) |
| High School Diploma | 3,617 (79.8%) | 304 (6.7%) |
| College / Associate Degree | 5,109 (85.5%) | 191 (3.2%) |
| Bachelor's Degree or higher | 5,191 (90.3%) | 236 (4.1%) |
| Total | 14,529 (84.7%) | 858 (5.0%) |
Employment Occupations by Sex in Parkville
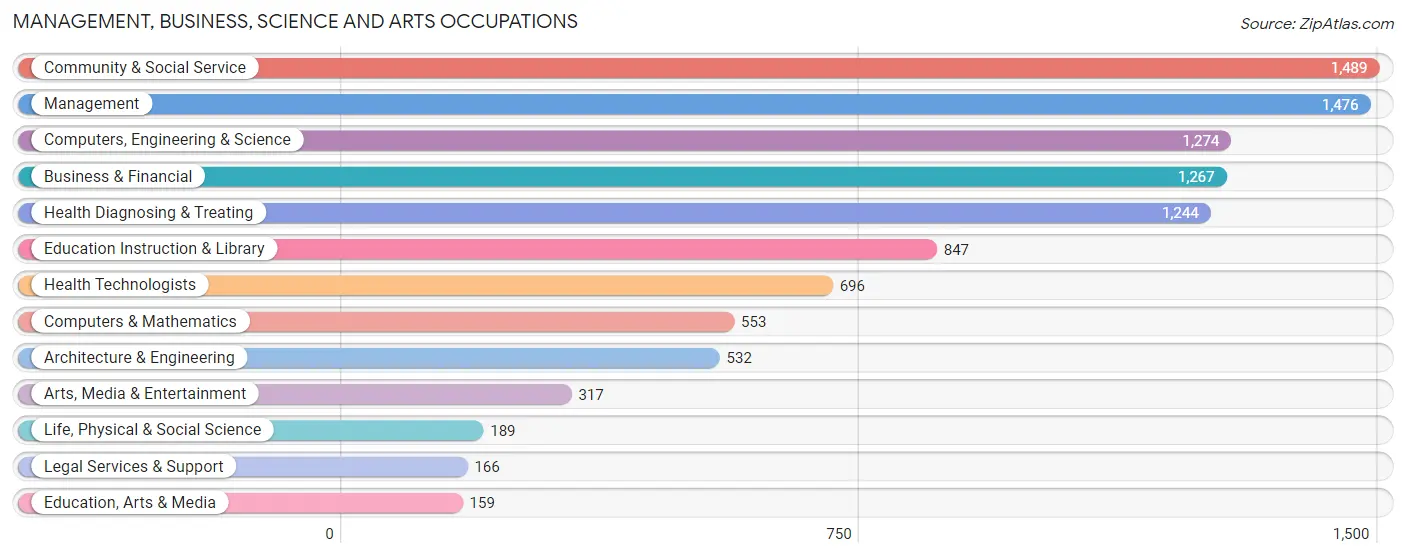
Management, Business, Science and Arts Occupations
The most common Management, Business, Science and Arts occupations in Parkville are Community & Social Service (1,489 | 9.1%), Management (1,476 | 9.0%), Computers, Engineering & Science (1,274 | 7.8%), Business & Financial (1,267 | 7.7%), and Health Diagnosing & Treating (1,244 | 7.6%).
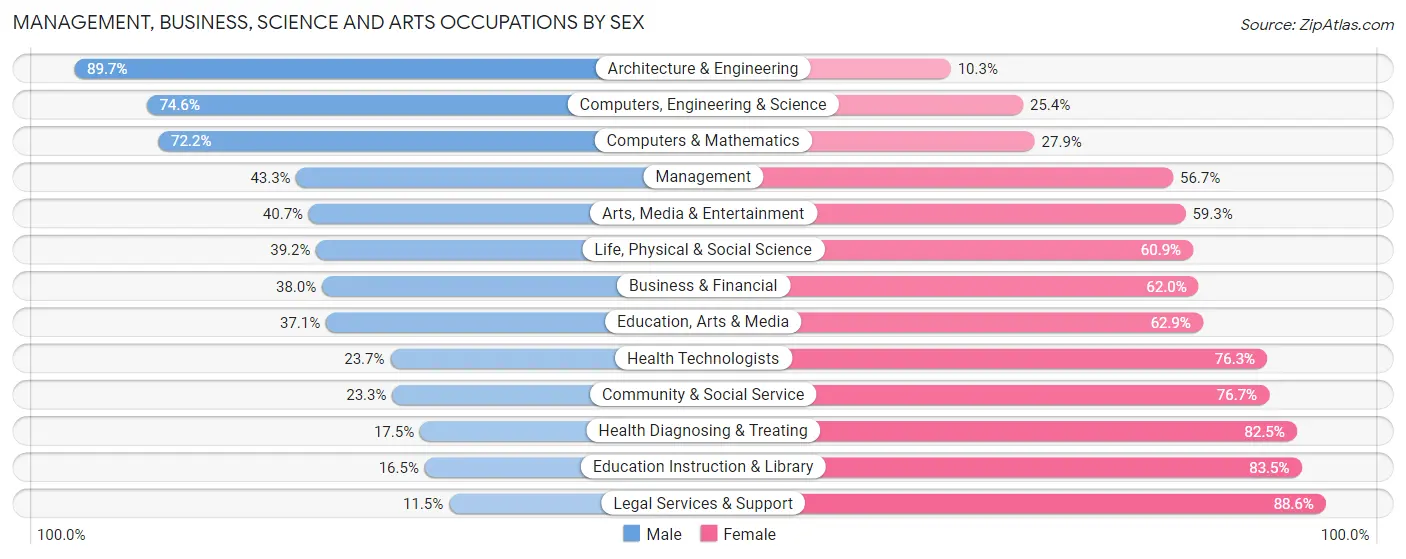
Management, Business, Science and Arts Occupations by Sex
Within the Management, Business, Science and Arts occupations in Parkville, the most male-oriented occupations are Architecture & Engineering (89.7%), Computers, Engineering & Science (74.6%), and Computers & Mathematics (72.2%), while the most female-oriented occupations are Legal Services & Support (88.5%), Education Instruction & Library (83.5%), and Health Diagnosing & Treating (82.5%).
| Occupation | Male | Female |
| Management | 639 (43.3%) | 837 (56.7%) |
| Business & Financial | 481 (38.0%) | 786 (62.0%) |
| Computers, Engineering & Science | 950 (74.6%) | 324 (25.4%) |
| Computers & Mathematics | 399 (72.2%) | 154 (27.9%) |
| Architecture & Engineering | 477 (89.7%) | 55 (10.3%) |
| Life, Physical & Social Science | 74 (39.2%) | 115 (60.9%) |
| Community & Social Service | 347 (23.3%) | 1,142 (76.7%) |
| Education, Arts & Media | 59 (37.1%) | 100 (62.9%) |
| Legal Services & Support | 19 (11.5%) | 147 (88.5%) |
| Education Instruction & Library | 140 (16.5%) | 707 (83.5%) |
| Arts, Media & Entertainment | 129 (40.7%) | 188 (59.3%) |
| Health Diagnosing & Treating | 218 (17.5%) | 1,026 (82.5%) |
| Health Technologists | 165 (23.7%) | 531 (76.3%) |
| Total (Category) | 2,635 (39.0%) | 4,115 (61.0%) |
| Total (Overall) | 7,327 (44.7%) | 9,063 (55.3%) |
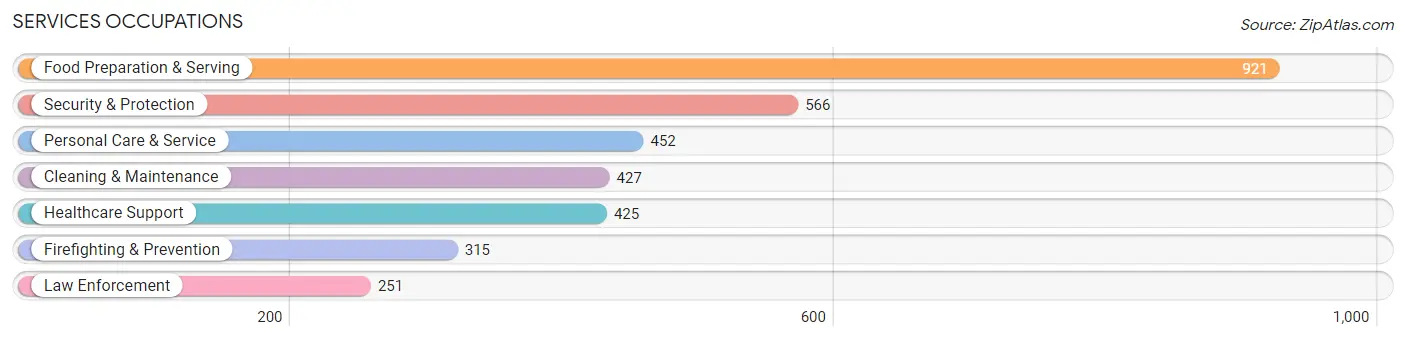
Services Occupations
The most common Services occupations in Parkville are Food Preparation & Serving (921 | 5.6%), Security & Protection (566 | 3.5%), Personal Care & Service (452 | 2.8%), Cleaning & Maintenance (427 | 2.6%), and Healthcare Support (425 | 2.6%).
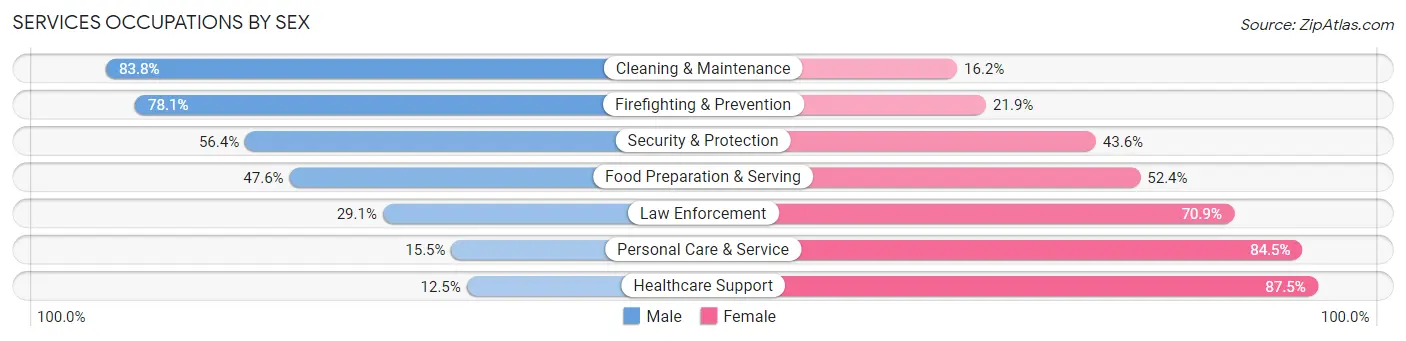
Services Occupations by Sex
Within the Services occupations in Parkville, the most male-oriented occupations are Cleaning & Maintenance (83.8%), Firefighting & Prevention (78.1%), and Security & Protection (56.4%), while the most female-oriented occupations are Healthcare Support (87.5%), Personal Care & Service (84.5%), and Law Enforcement (70.9%).
| Occupation | Male | Female |
| Healthcare Support | 53 (12.5%) | 372 (87.5%) |
| Security & Protection | 319 (56.4%) | 247 (43.6%) |
| Firefighting & Prevention | 246 (78.1%) | 69 (21.9%) |
| Law Enforcement | 73 (29.1%) | 178 (70.9%) |
| Food Preparation & Serving | 438 (47.6%) | 483 (52.4%) |
| Cleaning & Maintenance | 358 (83.8%) | 69 (16.2%) |
| Personal Care & Service | 70 (15.5%) | 382 (84.5%) |
| Total (Category) | 1,238 (44.4%) | 1,553 (55.6%) |
| Total (Overall) | 7,327 (44.7%) | 9,063 (55.3%) |
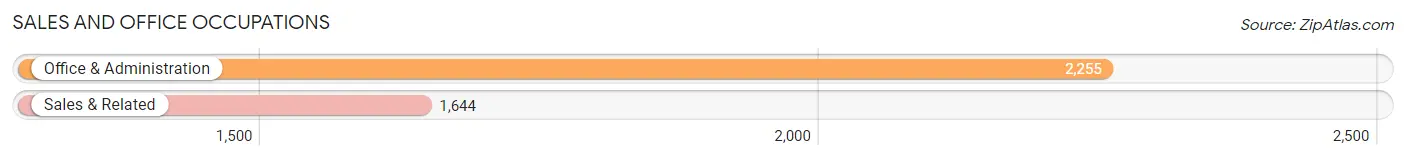
Sales and Office Occupations
The most common Sales and Office occupations in Parkville are Office & Administration (2,255 | 13.8%), and Sales & Related (1,644 | 10.0%).
Sales and Office Occupations by Sex
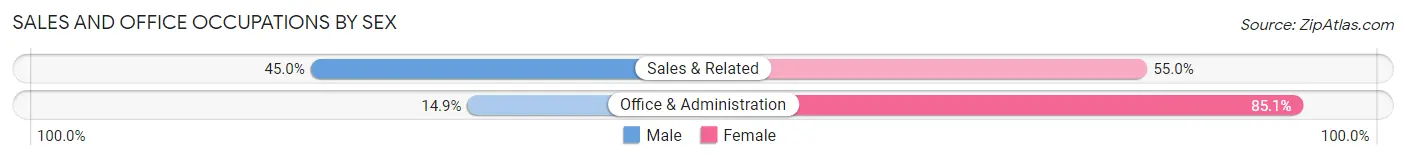
| Occupation | Male | Female |
| Sales & Related | 740 (45.0%) | 904 (55.0%) |
| Office & Administration | 335 (14.9%) | 1,920 (85.1%) |
| Total (Category) | 1,075 (27.6%) | 2,824 (72.4%) |
| Total (Overall) | 7,327 (44.7%) | 9,063 (55.3%) |
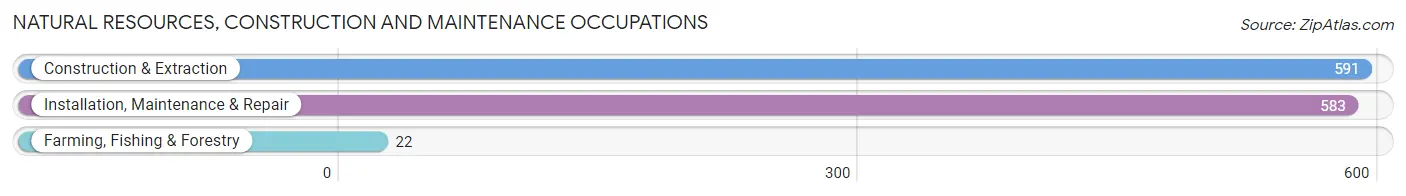
Natural Resources, Construction and Maintenance Occupations
The most common Natural Resources, Construction and Maintenance occupations in Parkville are Construction & Extraction (591 | 3.6%), Installation, Maintenance & Repair (583 | 3.6%), and Farming, Fishing & Forestry (22 | 0.1%).
Natural Resources, Construction and Maintenance Occupations by Sex
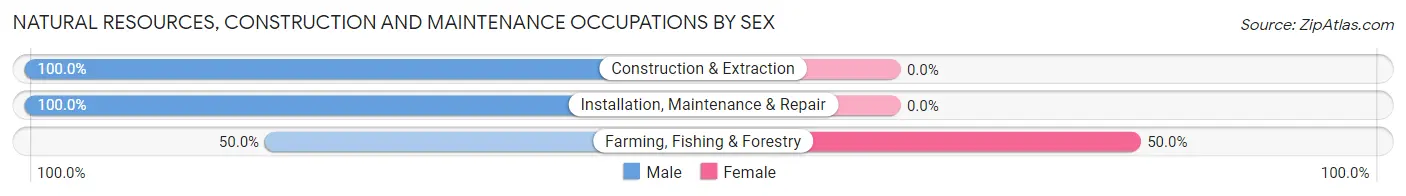
| Occupation | Male | Female |
| Farming, Fishing & Forestry | 11 (50.0%) | 11 (50.0%) |
| Construction & Extraction | 591 (100.0%) | 0 (0.0%) |
| Installation, Maintenance & Repair | 583 (100.0%) | 0 (0.0%) |
| Total (Category) | 1,185 (99.1%) | 11 (0.9%) |
| Total (Overall) | 7,327 (44.7%) | 9,063 (55.3%) |
Production, Transportation and Moving Occupations
The most common Production, Transportation and Moving occupations in Parkville are Material Moving (654 | 4.0%), Production (566 | 3.5%), and Transportation (534 | 3.3%).
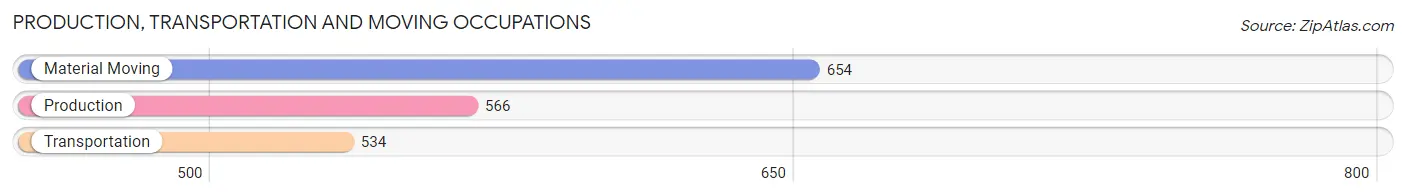
Production, Transportation and Moving Occupations by Sex
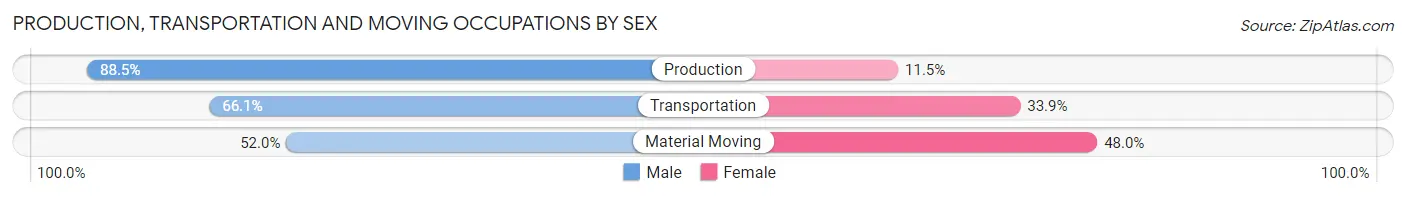
| Occupation | Male | Female |
| Production | 501 (88.5%) | 65 (11.5%) |
| Transportation | 353 (66.1%) | 181 (33.9%) |
| Material Moving | 340 (52.0%) | 314 (48.0%) |
| Total (Category) | 1,194 (68.1%) | 560 (31.9%) |
| Total (Overall) | 7,327 (44.7%) | 9,063 (55.3%) |
Employment Industries by Sex in Parkville
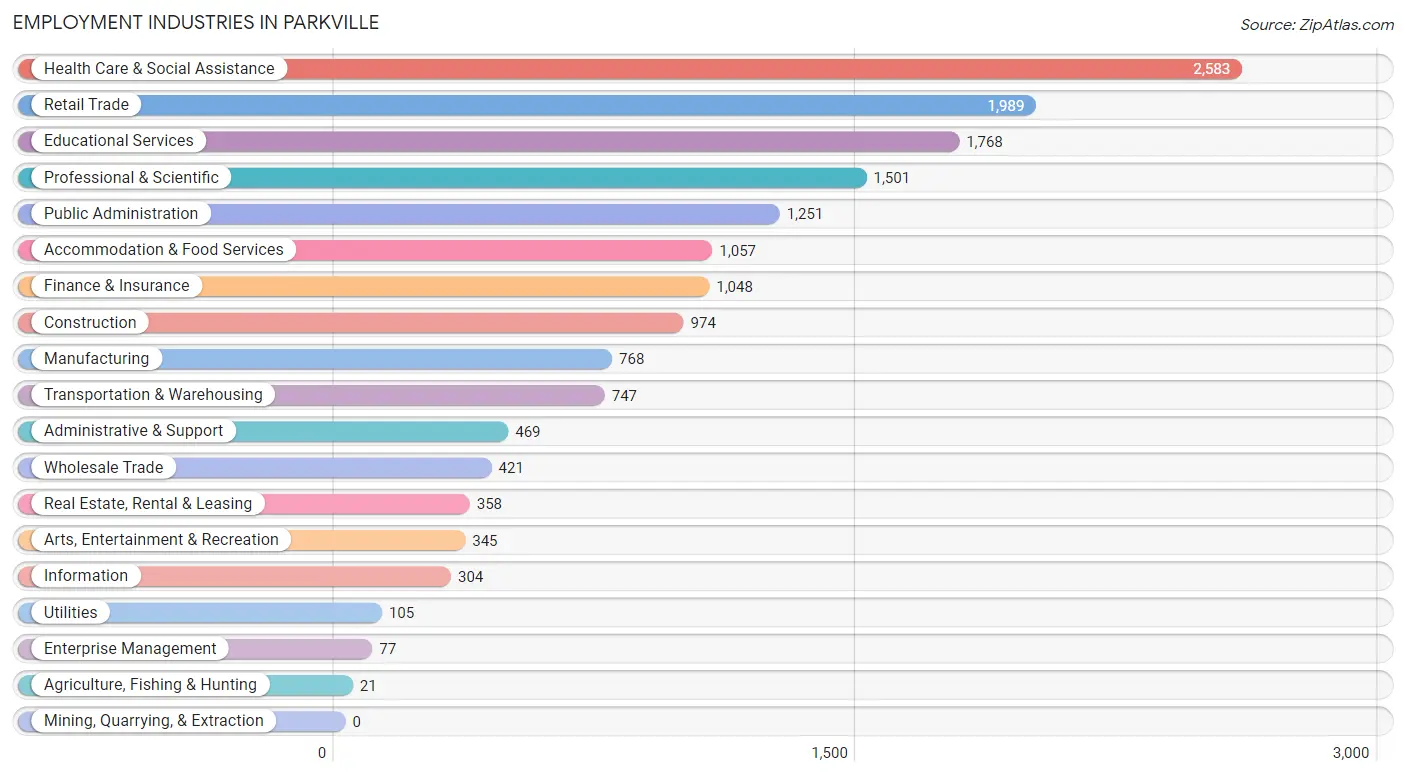
Employment Industries in Parkville
The major employment industries in Parkville include Health Care & Social Assistance (2,583 | 15.8%), Retail Trade (1,989 | 12.1%), Educational Services (1,768 | 10.8%), Professional & Scientific (1,501 | 9.2%), and Public Administration (1,251 | 7.6%).
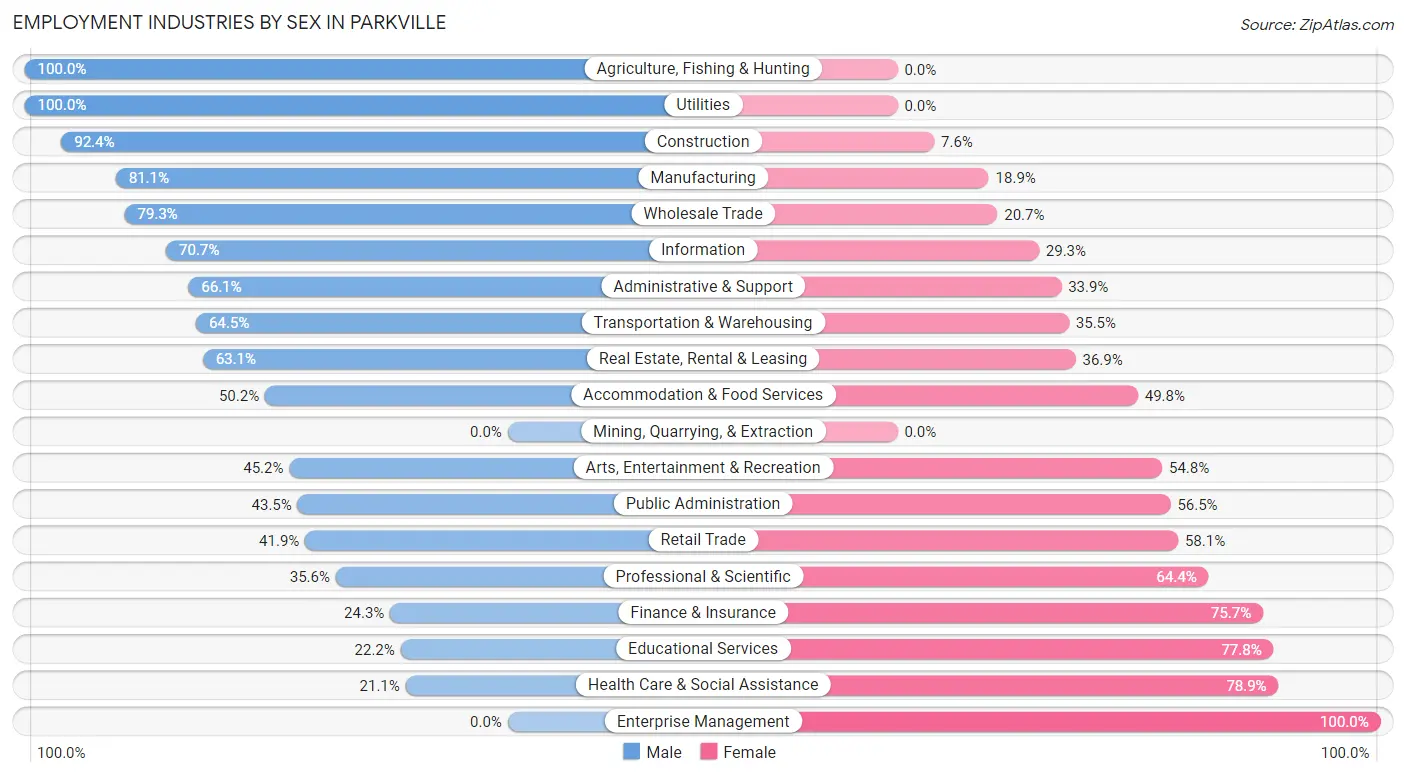
Employment Industries by Sex in Parkville
The Parkville industries that see more men than women are Agriculture, Fishing & Hunting (100.0%), Utilities (100.0%), and Construction (92.4%), whereas the industries that tend to have a higher number of women are Enterprise Management (100.0%), Health Care & Social Assistance (78.9%), and Educational Services (77.8%).
| Industry | Male | Female |
| Agriculture, Fishing & Hunting | 21 (100.0%) | 0 (0.0%) |
| Mining, Quarrying, & Extraction | 0 (0.0%) | 0 (0.0%) |
| Construction | 900 (92.4%) | 74 (7.6%) |
| Manufacturing | 623 (81.1%) | 145 (18.9%) |
| Wholesale Trade | 334 (79.3%) | 87 (20.7%) |
| Retail Trade | 834 (41.9%) | 1,155 (58.1%) |
| Transportation & Warehousing | 482 (64.5%) | 265 (35.5%) |
| Utilities | 105 (100.0%) | 0 (0.0%) |
| Information | 215 (70.7%) | 89 (29.3%) |
| Finance & Insurance | 255 (24.3%) | 793 (75.7%) |
| Real Estate, Rental & Leasing | 226 (63.1%) | 132 (36.9%) |
| Professional & Scientific | 534 (35.6%) | 967 (64.4%) |
| Enterprise Management | 0 (0.0%) | 77 (100.0%) |
| Administrative & Support | 310 (66.1%) | 159 (33.9%) |
| Educational Services | 392 (22.2%) | 1,376 (77.8%) |
| Health Care & Social Assistance | 546 (21.1%) | 2,037 (78.9%) |
| Arts, Entertainment & Recreation | 156 (45.2%) | 189 (54.8%) |
| Accommodation & Food Services | 531 (50.2%) | 526 (49.8%) |
| Public Administration | 544 (43.5%) | 707 (56.5%) |
| Total | 7,327 (44.7%) | 9,063 (55.3%) |
Education in Parkville
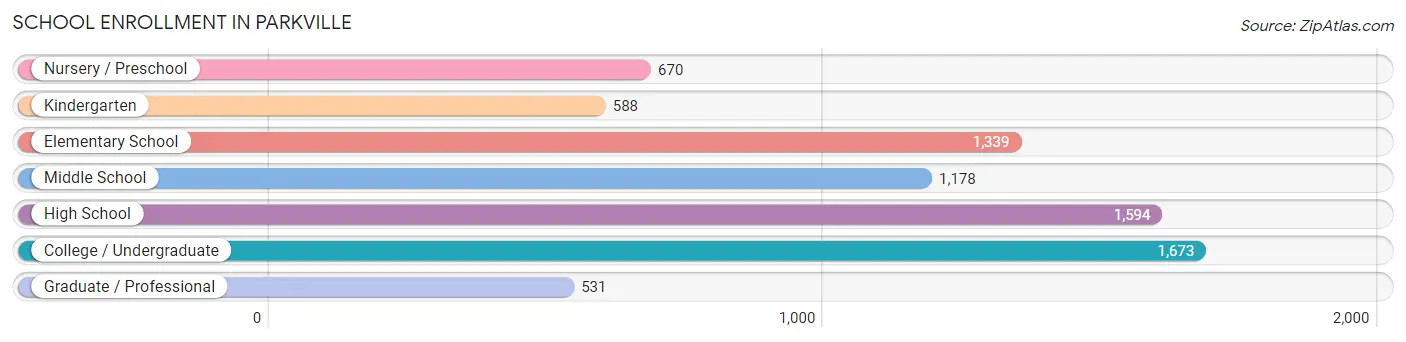
School Enrollment in Parkville
The most common levels of schooling among the 7,573 students in Parkville are college / undergraduate (1,673 | 22.1%), high school (1,594 | 21.0%), and elementary school (1,339 | 17.7%).
| School Level | # Students | % Students |
| Nursery / Preschool | 670 | 8.8% |
| Kindergarten | 588 | 7.8% |
| Elementary School | 1,339 | 17.7% |
| Middle School | 1,178 | 15.6% |
| High School | 1,594 | 21.0% |
| College / Undergraduate | 1,673 | 22.1% |
| Graduate / Professional | 531 | 7.0% |
| Total | 7,573 | 100.0% |
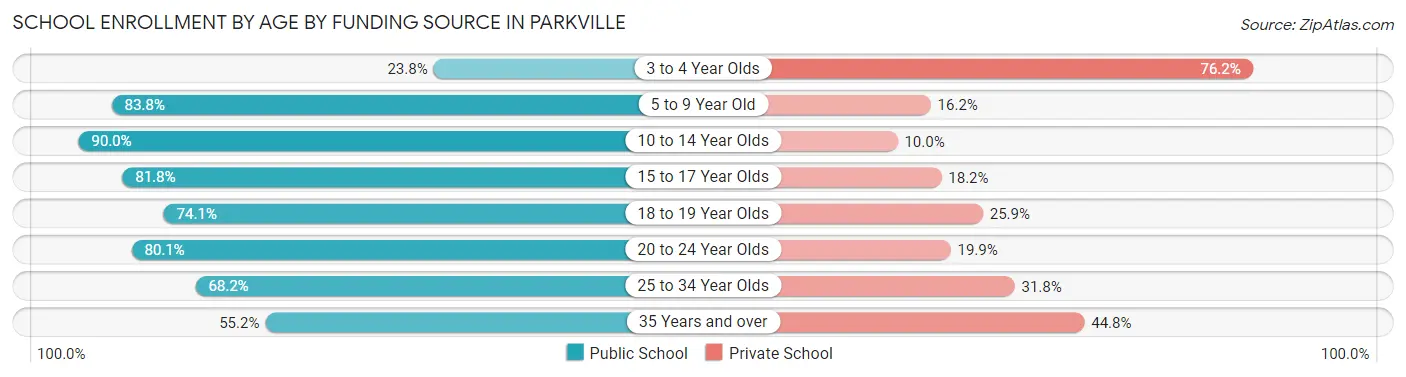
School Enrollment by Age by Funding Source in Parkville
Out of a total of 7,573 students who are enrolled in schools in Parkville, 1,825 (24.1%) attend a private institution, while the remaining 5,748 (75.9%) are enrolled in public schools. The age group of 3 to 4 year olds has the highest likelihood of being enrolled in private schools, with 425 (76.2% in the age bracket) enrolled. Conversely, the age group of 10 to 14 year olds has the lowest likelihood of being enrolled in a private school, with 1,329 (90.0% in the age bracket) attending a public institution.
| Age Bracket | Public School | Private School |
| 3 to 4 Year Olds | 133 (23.8%) | 425 (76.2%) |
| 5 to 9 Year Old | 1,583 (83.8%) | 306 (16.2%) |
| 10 to 14 Year Olds | 1,329 (90.0%) | 148 (10.0%) |
| 15 to 17 Year Olds | 1,025 (81.8%) | 228 (18.2%) |
| 18 to 19 Year Olds | 366 (74.1%) | 128 (25.9%) |
| 20 to 24 Year Olds | 523 (80.1%) | 130 (19.9%) |
| 25 to 34 Year Olds | 529 (68.2%) | 247 (31.8%) |
| 35 Years and over | 261 (55.2%) | 212 (44.8%) |
| Total | 5,748 (75.9%) | 1,825 (24.1%) |
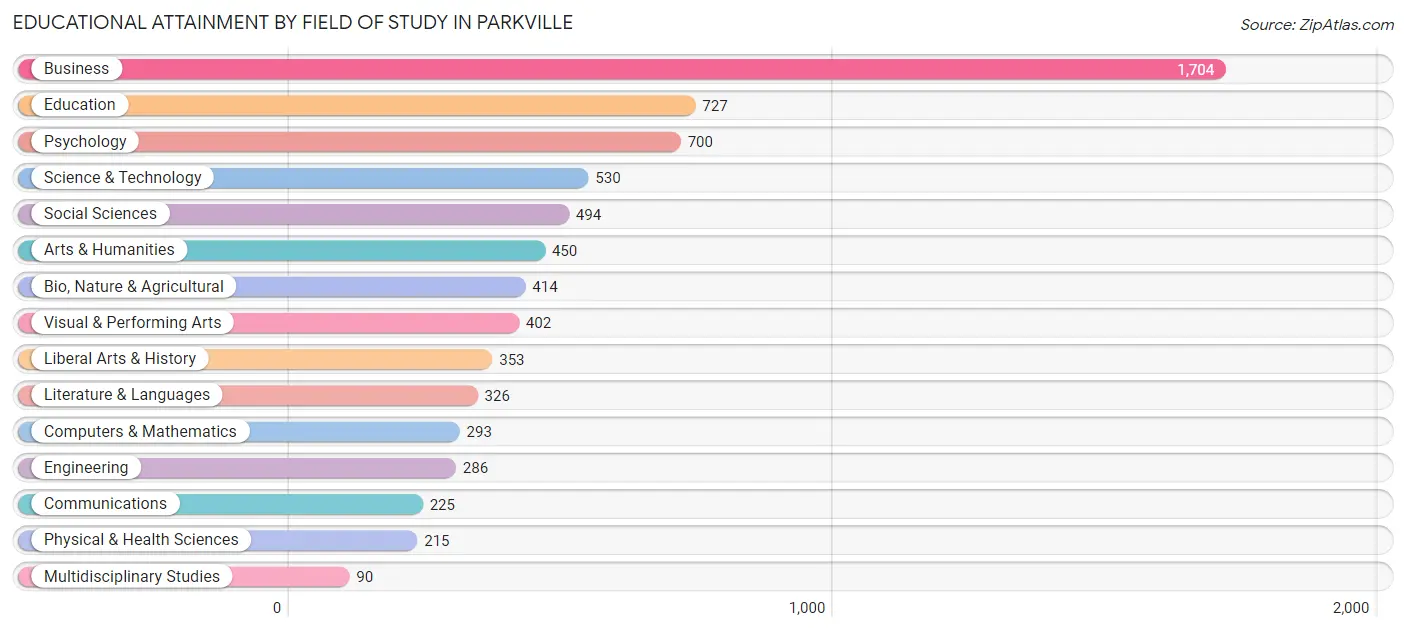
Educational Attainment by Field of Study in Parkville
Business (1,704 | 23.6%), education (727 | 10.1%), psychology (700 | 9.7%), science & technology (530 | 7.3%), and social sciences (494 | 6.9%) are the most common fields of study among 7,209 individuals in Parkville who have obtained a bachelor's degree or higher.
| Field of Study | # Graduates | % Graduates |
| Computers & Mathematics | 293 | 4.1% |
| Bio, Nature & Agricultural | 414 | 5.7% |
| Physical & Health Sciences | 215 | 3.0% |
| Psychology | 700 | 9.7% |
| Social Sciences | 494 | 6.9% |
| Engineering | 286 | 4.0% |
| Multidisciplinary Studies | 90 | 1.3% |
| Science & Technology | 530 | 7.3% |
| Business | 1,704 | 23.6% |
| Education | 727 | 10.1% |
| Literature & Languages | 326 | 4.5% |
| Liberal Arts & History | 353 | 4.9% |
| Visual & Performing Arts | 402 | 5.6% |
| Communications | 225 | 3.1% |
| Arts & Humanities | 450 | 6.2% |
| Total | 7,209 | 100.0% |
Transportation & Commute in Parkville
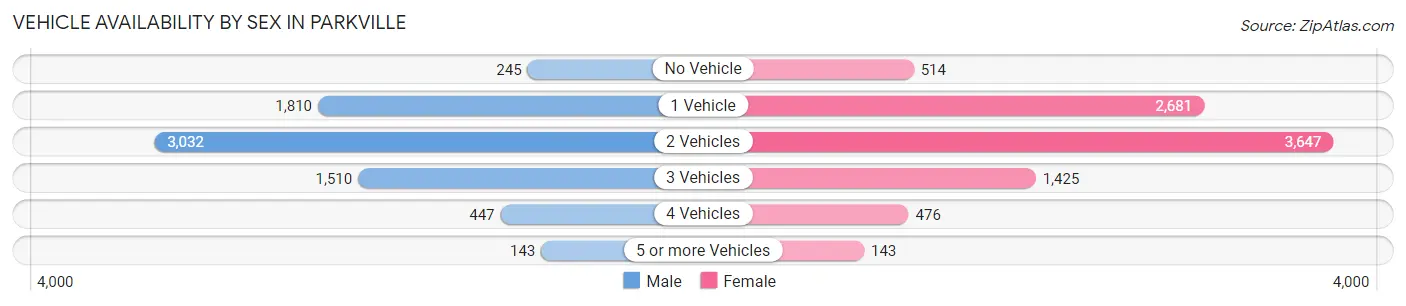
Vehicle Availability by Sex in Parkville
The most prevalent vehicle ownership categories in Parkville are males with 2 vehicles (3,032, accounting for 42.2%) and females with 2 vehicles (3,647, making up 34.1%).
| Vehicles Available | Male | Female |
| No Vehicle | 245 (3.4%) | 514 (5.8%) |
| 1 Vehicle | 1,810 (25.2%) | 2,681 (30.2%) |
| 2 Vehicles | 3,032 (42.2%) | 3,647 (41.0%) |
| 3 Vehicles | 1,510 (21.0%) | 1,425 (16.0%) |
| 4 Vehicles | 447 (6.2%) | 476 (5.4%) |
| 5 or more Vehicles | 143 (2.0%) | 143 (1.6%) |
| Total | 7,187 (100.0%) | 8,886 (100.0%) |
Commute Time in Parkville
The most frequently occuring commute durations in Parkville are 20 to 24 minutes (2,991 commuters, 20.8%), 15 to 19 minutes (2,265 commuters, 15.8%), and 30 to 34 minutes (2,172 commuters, 15.1%).
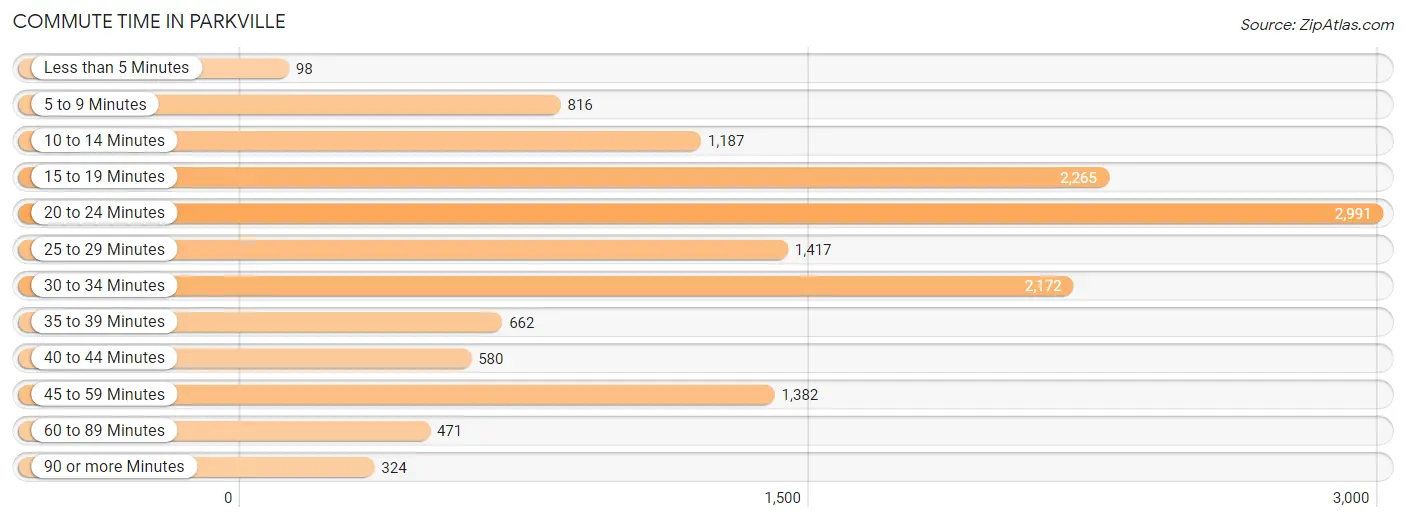
| Commute Time | # Commuters | % Commuters |
| Less than 5 Minutes | 98 | 0.7% |
| 5 to 9 Minutes | 816 | 5.7% |
| 10 to 14 Minutes | 1,187 | 8.3% |
| 15 to 19 Minutes | 2,265 | 15.8% |
| 20 to 24 Minutes | 2,991 | 20.8% |
| 25 to 29 Minutes | 1,417 | 9.9% |
| 30 to 34 Minutes | 2,172 | 15.1% |
| 35 to 39 Minutes | 662 | 4.6% |
| 40 to 44 Minutes | 580 | 4.0% |
| 45 to 59 Minutes | 1,382 | 9.6% |
| 60 to 89 Minutes | 471 | 3.3% |
| 90 or more Minutes | 324 | 2.3% |
Commute Time by Sex in Parkville
The most common commute times in Parkville are 20 to 24 minutes (1,348 commuters, 20.7%) for males and 20 to 24 minutes (1,643 commuters, 20.9%) for females.
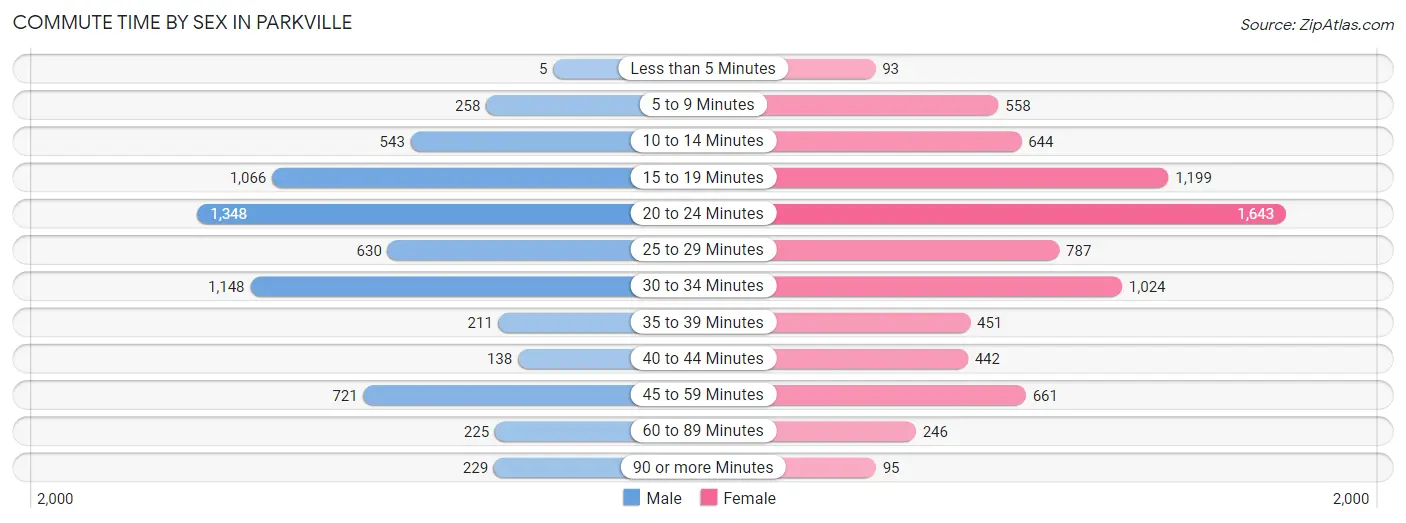
| Commute Time | Male | Female |
| Less than 5 Minutes | 5 (0.1%) | 93 (1.2%) |
| 5 to 9 Minutes | 258 (4.0%) | 558 (7.1%) |
| 10 to 14 Minutes | 543 (8.3%) | 644 (8.2%) |
| 15 to 19 Minutes | 1,066 (16.3%) | 1,199 (15.3%) |
| 20 to 24 Minutes | 1,348 (20.7%) | 1,643 (20.9%) |
| 25 to 29 Minutes | 630 (9.7%) | 787 (10.0%) |
| 30 to 34 Minutes | 1,148 (17.6%) | 1,024 (13.1%) |
| 35 to 39 Minutes | 211 (3.2%) | 451 (5.8%) |
| 40 to 44 Minutes | 138 (2.1%) | 442 (5.6%) |
| 45 to 59 Minutes | 721 (11.1%) | 661 (8.4%) |
| 60 to 89 Minutes | 225 (3.5%) | 246 (3.1%) |
| 90 or more Minutes | 229 (3.5%) | 95 (1.2%) |
Time of Departure to Work by Sex in Parkville
The most frequent times of departure to work in Parkville are 7:00 AM to 7:29 AM (933, 14.3%) for males and 7:00 AM to 7:29 AM (1,289, 16.4%) for females.
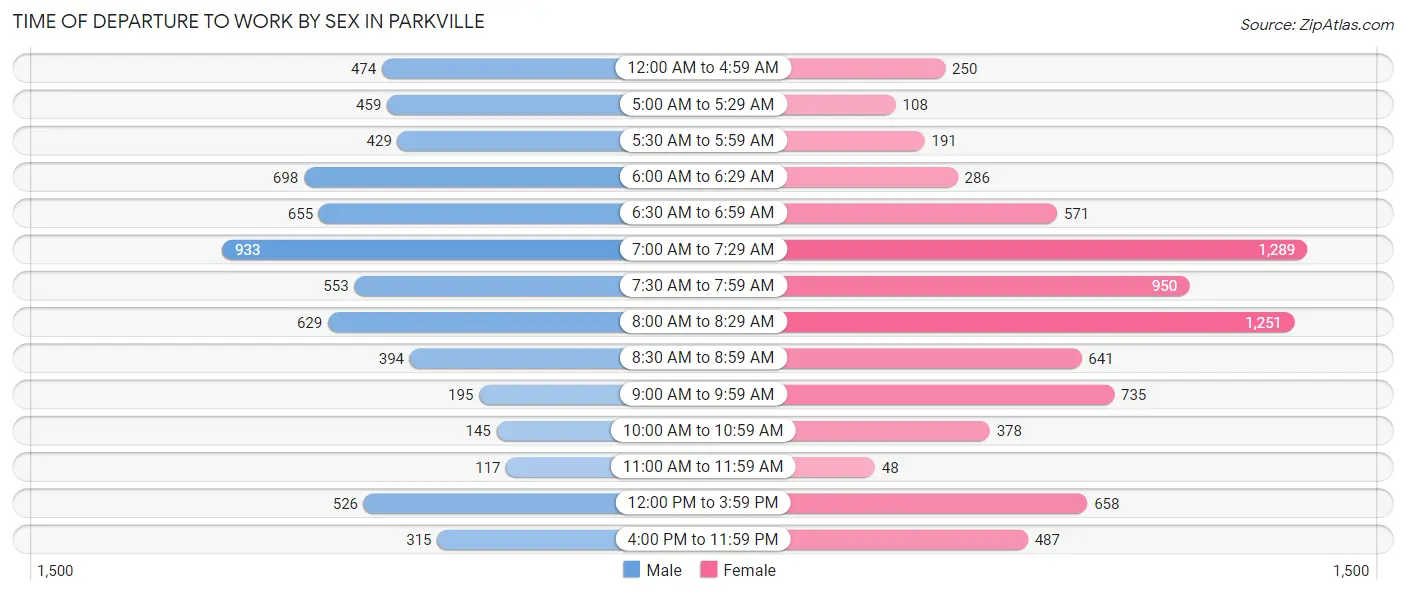
| Time of Departure | Male | Female |
| 12:00 AM to 4:59 AM | 474 (7.3%) | 250 (3.2%) |
| 5:00 AM to 5:29 AM | 459 (7.0%) | 108 (1.4%) |
| 5:30 AM to 5:59 AM | 429 (6.6%) | 191 (2.4%) |
| 6:00 AM to 6:29 AM | 698 (10.7%) | 286 (3.6%) |
| 6:30 AM to 6:59 AM | 655 (10.0%) | 571 (7.3%) |
| 7:00 AM to 7:29 AM | 933 (14.3%) | 1,289 (16.4%) |
| 7:30 AM to 7:59 AM | 553 (8.5%) | 950 (12.1%) |
| 8:00 AM to 8:29 AM | 629 (9.6%) | 1,251 (16.0%) |
| 8:30 AM to 8:59 AM | 394 (6.0%) | 641 (8.2%) |
| 9:00 AM to 9:59 AM | 195 (3.0%) | 735 (9.4%) |
| 10:00 AM to 10:59 AM | 145 (2.2%) | 378 (4.8%) |
| 11:00 AM to 11:59 AM | 117 (1.8%) | 48 (0.6%) |
| 12:00 PM to 3:59 PM | 526 (8.1%) | 658 (8.4%) |
| 4:00 PM to 11:59 PM | 315 (4.8%) | 487 (6.2%) |
| Total | 6,522 (100.0%) | 7,843 (100.0%) |
Housing Occupancy in Parkville
Occupancy by Ownership in Parkville
Of the total 12,442 dwellings in Parkville, owner-occupied units account for 7,991 (64.2%), while renter-occupied units make up 4,451 (35.8%).
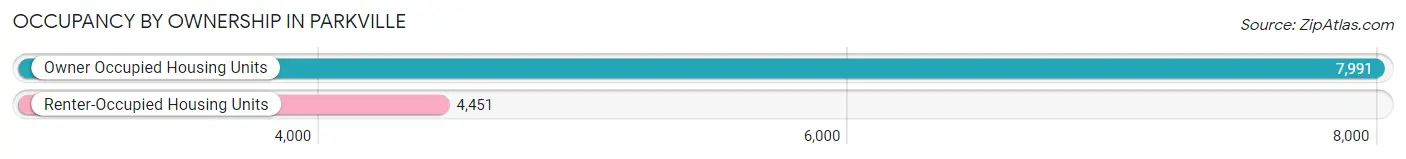
| Occupancy | # Housing Units | % Housing Units |
| Owner Occupied Housing Units | 7,991 | 64.2% |
| Renter-Occupied Housing Units | 4,451 | 35.8% |
| Total Occupied Housing Units | 12,442 | 100.0% |
Occupancy by Household Size in Parkville
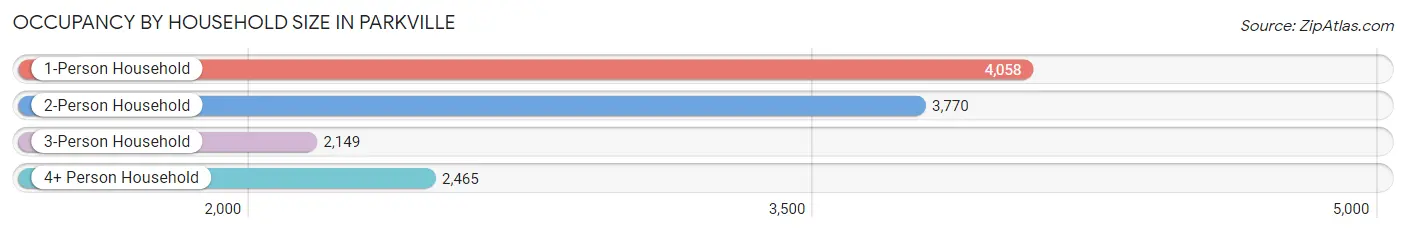
| Household Size | # Housing Units | % Housing Units |
| 1-Person Household | 4,058 | 32.6% |
| 2-Person Household | 3,770 | 30.3% |
| 3-Person Household | 2,149 | 17.3% |
| 4+ Person Household | 2,465 | 19.8% |
| Total Housing Units | 12,442 | 100.0% |
Occupancy by Ownership by Household Size in Parkville
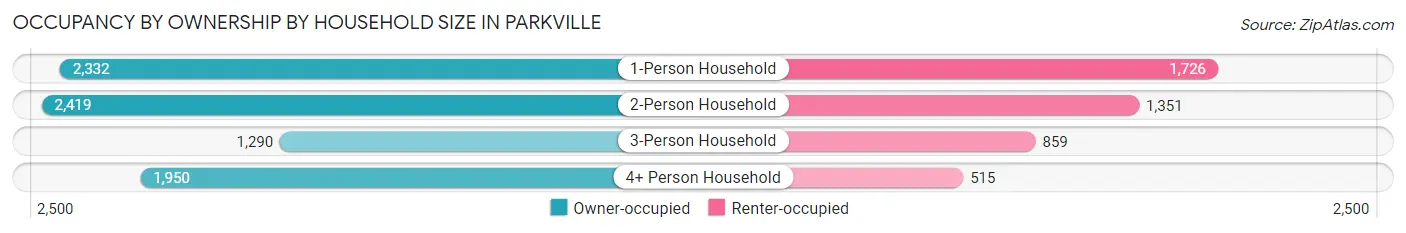
| Household Size | Owner-occupied | Renter-occupied |
| 1-Person Household | 2,332 (57.5%) | 1,726 (42.5%) |
| 2-Person Household | 2,419 (64.2%) | 1,351 (35.8%) |
| 3-Person Household | 1,290 (60.0%) | 859 (40.0%) |
| 4+ Person Household | 1,950 (79.1%) | 515 (20.9%) |
| Total Housing Units | 7,991 (64.2%) | 4,451 (35.8%) |
Occupancy by Educational Attainment in Parkville
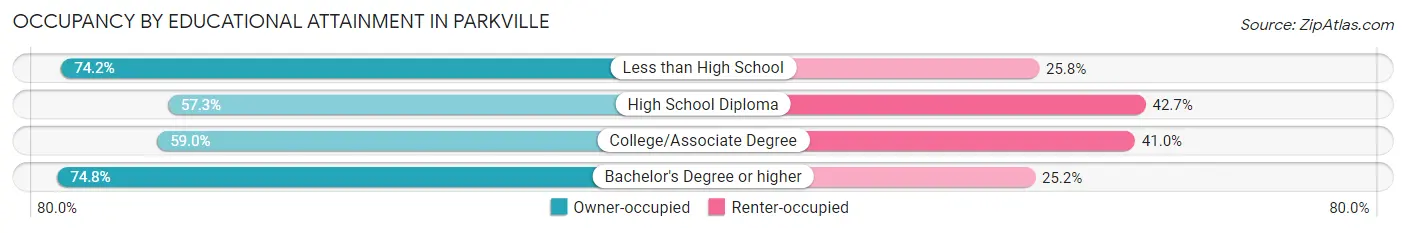
| Household Size | Owner-occupied | Renter-occupied |
| Less than High School | 448 (74.2%) | 156 (25.8%) |
| High School Diploma | 1,941 (57.3%) | 1,448 (42.7%) |
| College/Associate Degree | 2,672 (59.0%) | 1,860 (41.0%) |
| Bachelor's Degree or higher | 2,930 (74.8%) | 987 (25.2%) |
Occupancy by Age of Householder in Parkville
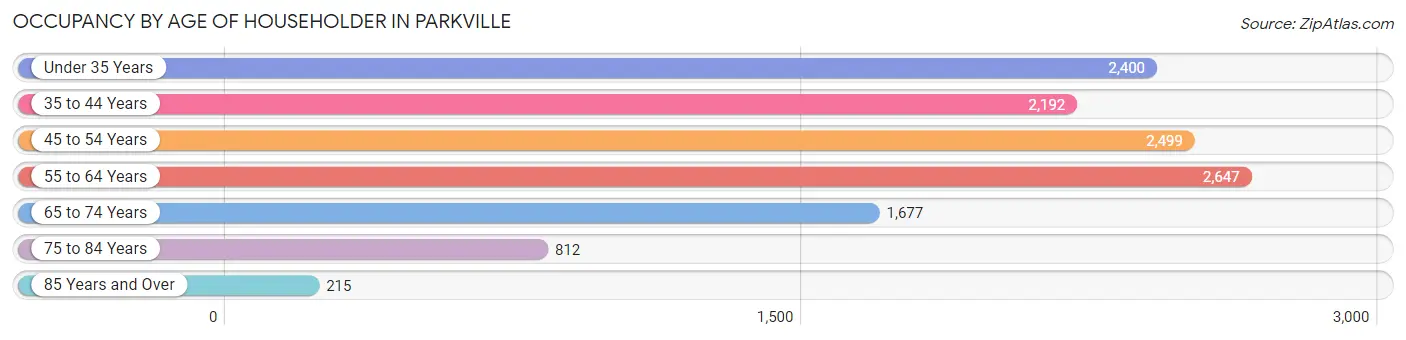
| Age Bracket | # Households | % Households |
| Under 35 Years | 2,400 | 19.3% |
| 35 to 44 Years | 2,192 | 17.6% |
| 45 to 54 Years | 2,499 | 20.1% |
| 55 to 64 Years | 2,647 | 21.3% |
| 65 to 74 Years | 1,677 | 13.5% |
| 75 to 84 Years | 812 | 6.5% |
| 85 Years and Over | 215 | 1.7% |
| Total | 12,442 | 100.0% |
Housing Finances in Parkville
Median Income by Occupancy in Parkville
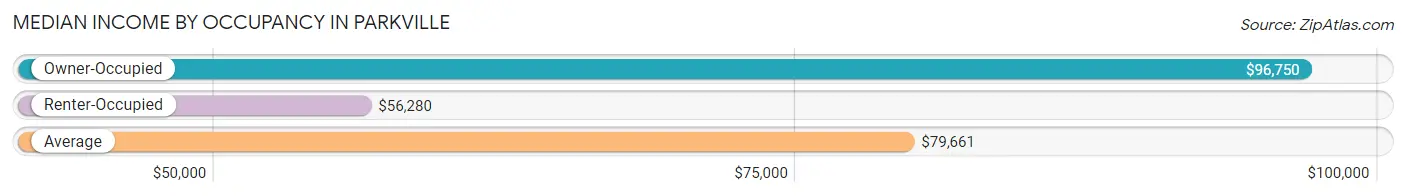
| Occupancy Type | # Households | Median Income |
| Owner-Occupied | 7,991 (64.2%) | $96,750 |
| Renter-Occupied | 4,451 (35.8%) | $56,280 |
| Average | 12,442 (100.0%) | $79,661 |
Occupancy by Householder Income Bracket in Parkville
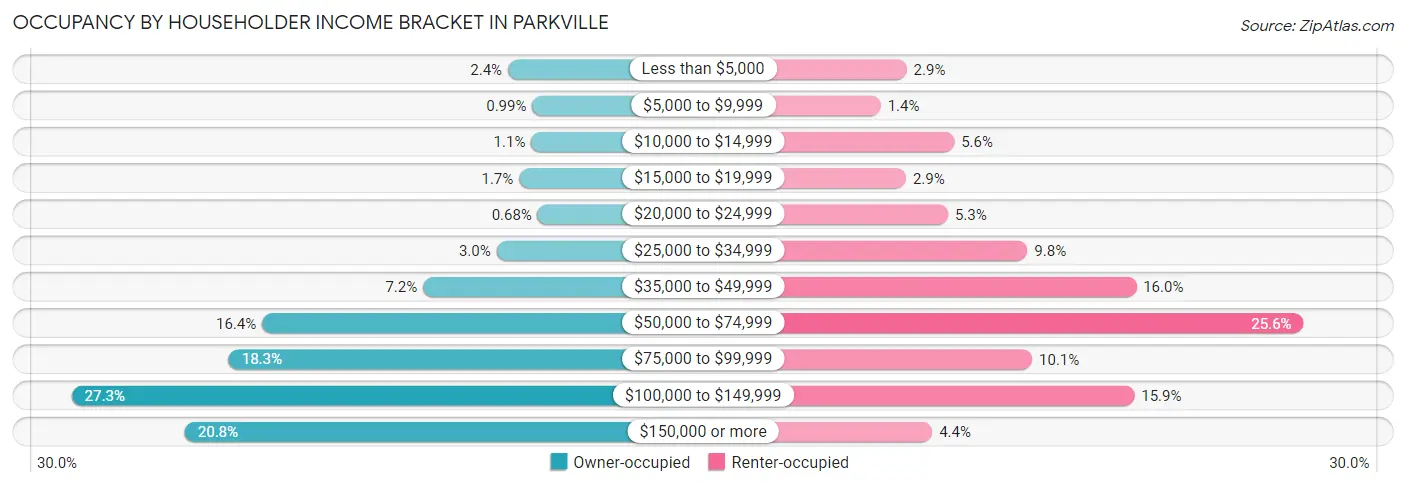
| Income Bracket | Owner-occupied | Renter-occupied |
| Less than $5,000 | 190 (2.4%) | 130 (2.9%) |
| $5,000 to $9,999 | 79 (1.0%) | 64 (1.4%) |
| $10,000 to $14,999 | 84 (1.1%) | 251 (5.6%) |
| $15,000 to $19,999 | 139 (1.7%) | 128 (2.9%) |
| $20,000 to $24,999 | 54 (0.7%) | 235 (5.3%) |
| $25,000 to $34,999 | 242 (3.0%) | 437 (9.8%) |
| $35,000 to $49,999 | 578 (7.2%) | 714 (16.0%) |
| $50,000 to $74,999 | 1,313 (16.4%) | 1,139 (25.6%) |
| $75,000 to $99,999 | 1,465 (18.3%) | 449 (10.1%) |
| $100,000 to $149,999 | 2,182 (27.3%) | 709 (15.9%) |
| $150,000 or more | 1,665 (20.8%) | 195 (4.4%) |
| Total | 7,991 (100.0%) | 4,451 (100.0%) |
Monthly Housing Cost Tiers in Parkville
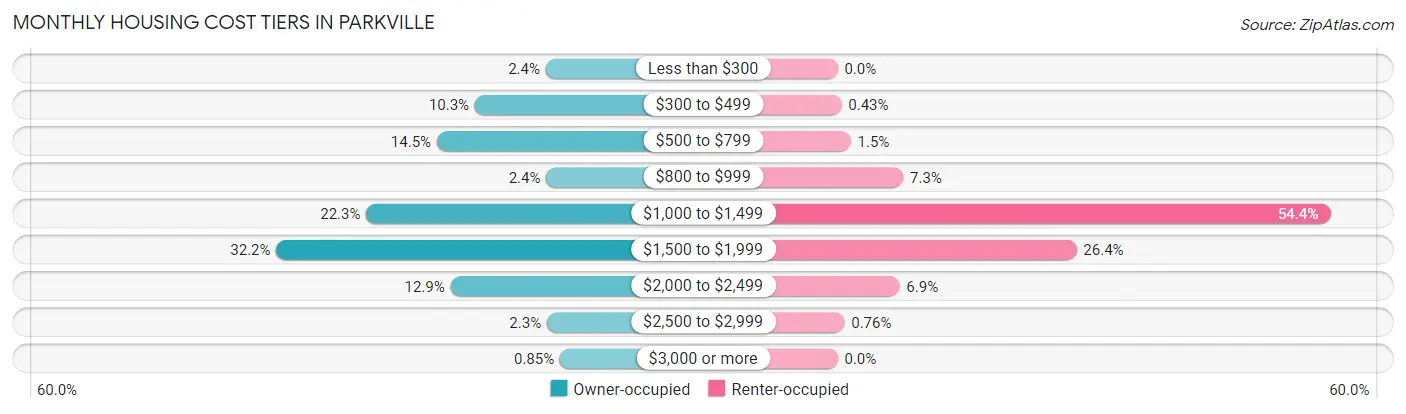
| Monthly Cost | Owner-occupied | Renter-occupied |
| Less than $300 | 193 (2.4%) | 0 (0.0%) |
| $300 to $499 | 819 (10.2%) | 19 (0.4%) |
| $500 to $799 | 1,155 (14.4%) | 65 (1.5%) |
| $800 to $999 | 189 (2.4%) | 323 (7.3%) |
| $1,000 to $1,499 | 1,778 (22.3%) | 2,422 (54.4%) |
| $1,500 to $1,999 | 2,572 (32.2%) | 1,175 (26.4%) |
| $2,000 to $2,499 | 1,034 (12.9%) | 305 (6.9%) |
| $2,500 to $2,999 | 183 (2.3%) | 34 (0.8%) |
| $3,000 or more | 68 (0.9%) | 0 (0.0%) |
| Total | 7,991 (100.0%) | 4,451 (100.0%) |
Physical Housing Characteristics in Parkville
Housing Structures in Parkville
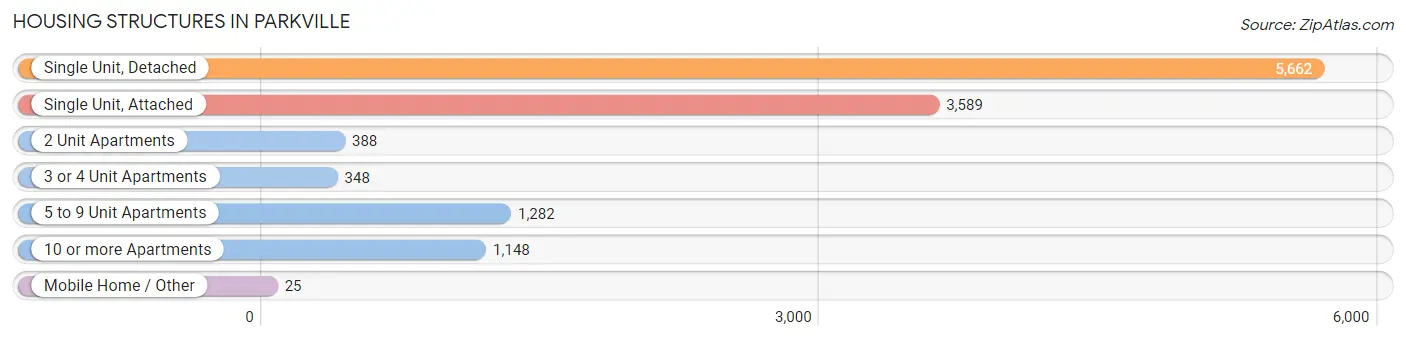
| Structure Type | # Housing Units | % Housing Units |
| Single Unit, Detached | 5,662 | 45.5% |
| Single Unit, Attached | 3,589 | 28.8% |
| 2 Unit Apartments | 388 | 3.1% |
| 3 or 4 Unit Apartments | 348 | 2.8% |
| 5 to 9 Unit Apartments | 1,282 | 10.3% |
| 10 or more Apartments | 1,148 | 9.2% |
| Mobile Home / Other | 25 | 0.2% |
| Total | 12,442 | 100.0% |
Housing Structures by Occupancy in Parkville
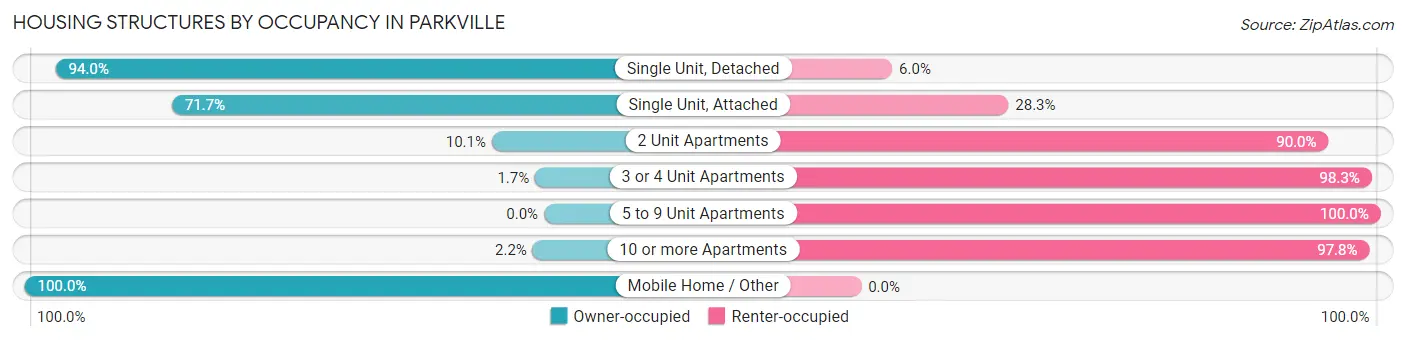
| Structure Type | Owner-occupied | Renter-occupied |
| Single Unit, Detached | 5,324 (94.0%) | 338 (6.0%) |
| Single Unit, Attached | 2,572 (71.7%) | 1,017 (28.3%) |
| 2 Unit Apartments | 39 (10.1%) | 349 (89.9%) |
| 3 or 4 Unit Apartments | 6 (1.7%) | 342 (98.3%) |
| 5 to 9 Unit Apartments | 0 (0.0%) | 1,282 (100.0%) |
| 10 or more Apartments | 25 (2.2%) | 1,123 (97.8%) |
| Mobile Home / Other | 25 (100.0%) | 0 (0.0%) |
| Total | 7,991 (64.2%) | 4,451 (35.8%) |
Housing Structures by Number of Rooms in Parkville
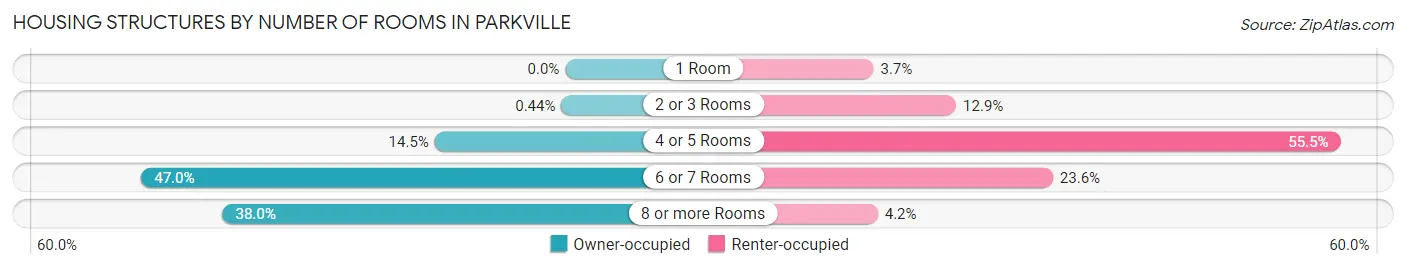
| Number of Rooms | Owner-occupied | Renter-occupied |
| 1 Room | 0 (0.0%) | 166 (3.7%) |
| 2 or 3 Rooms | 35 (0.4%) | 574 (12.9%) |
| 4 or 5 Rooms | 1,158 (14.5%) | 2,472 (55.5%) |
| 6 or 7 Rooms | 3,759 (47.0%) | 1,052 (23.6%) |
| 8 or more Rooms | 3,039 (38.0%) | 187 (4.2%) |
| Total | 7,991 (100.0%) | 4,451 (100.0%) |
Housing Structure by Heating Type in Parkville
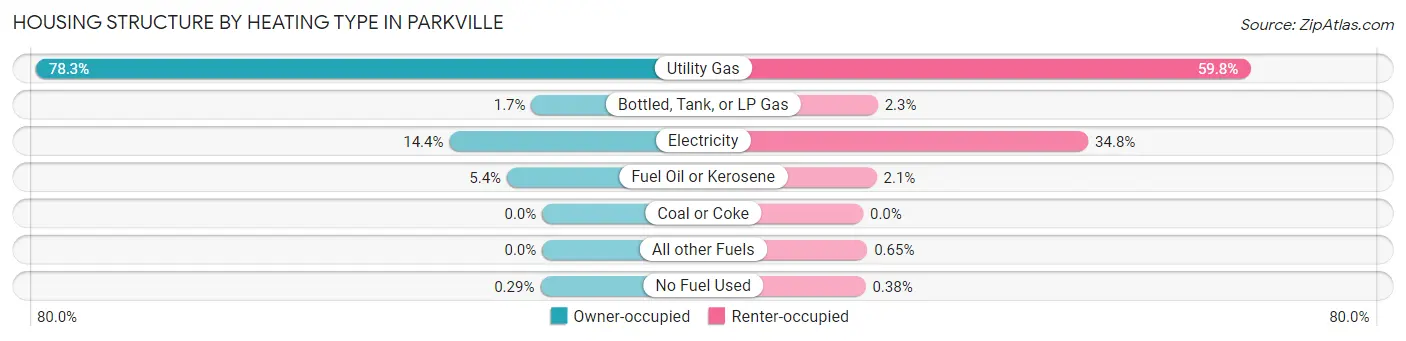
| Heating Type | Owner-occupied | Renter-occupied |
| Utility Gas | 6,253 (78.2%) | 2,662 (59.8%) |
| Bottled, Tank, or LP Gas | 133 (1.7%) | 101 (2.3%) |
| Electricity | 1,147 (14.3%) | 1,549 (34.8%) |
| Fuel Oil or Kerosene | 435 (5.4%) | 93 (2.1%) |
| Coal or Coke | 0 (0.0%) | 0 (0.0%) |
| All other Fuels | 0 (0.0%) | 29 (0.6%) |
| No Fuel Used | 23 (0.3%) | 17 (0.4%) |
| Total | 7,991 (100.0%) | 4,451 (100.0%) |
Household Vehicle Usage in Parkville
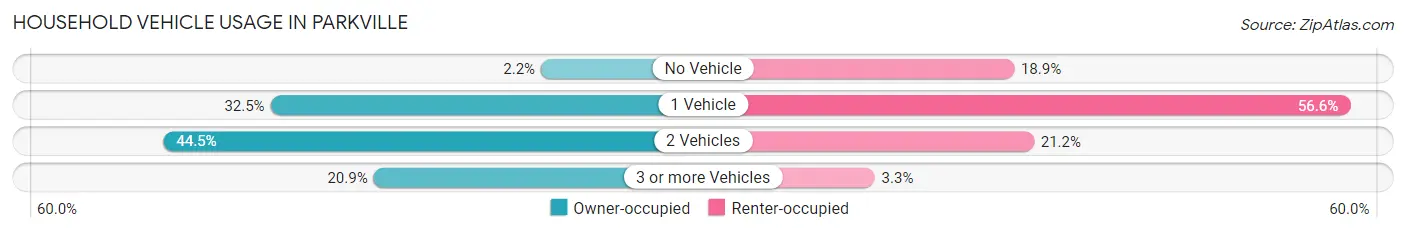
| Vehicles per Household | Owner-occupied | Renter-occupied |
| No Vehicle | 173 (2.2%) | 843 (18.9%) |
| 1 Vehicle | 2,594 (32.5%) | 2,518 (56.6%) |
| 2 Vehicles | 3,552 (44.5%) | 942 (21.2%) |
| 3 or more Vehicles | 1,672 (20.9%) | 148 (3.3%) |
| Total | 7,991 (100.0%) | 4,451 (100.0%) |
Real Estate & Mortgages in Parkville
Real Estate and Mortgage Overview in Parkville
| Characteristic | Without Mortgage | With Mortgage |
| Housing Units | 2,238 | 5,753 |
| Median Property Value | $228,700 | $248,700 |
| Median Household Income | $78,621 | $1,407 |
| Monthly Housing Costs | $552 | $68 |
| Real Estate Taxes | $2,760 | $97 |
Property Value by Mortgage Status in Parkville
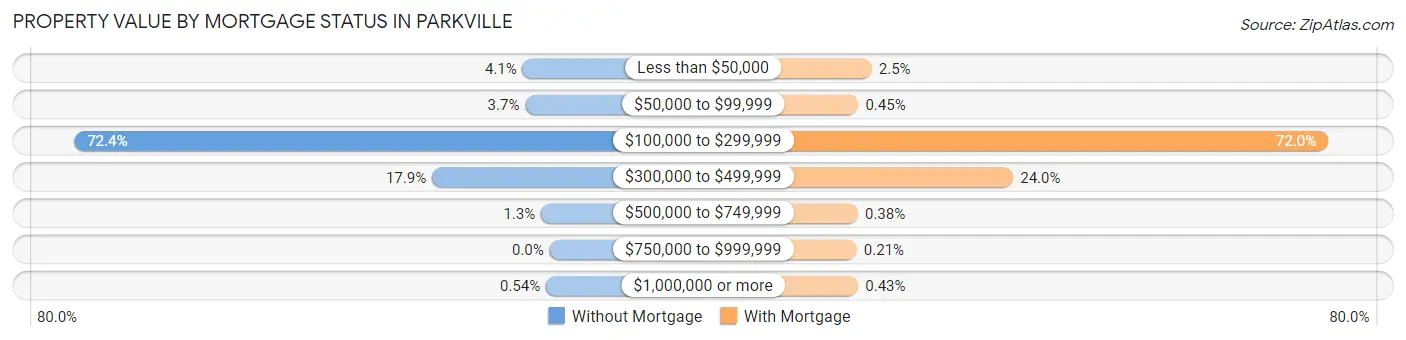
| Property Value | Without Mortgage | With Mortgage |
| Less than $50,000 | 92 (4.1%) | 143 (2.5%) |
| $50,000 to $99,999 | 83 (3.7%) | 26 (0.4%) |
| $100,000 to $299,999 | 1,621 (72.4%) | 4,142 (72.0%) |
| $300,000 to $499,999 | 401 (17.9%) | 1,383 (24.0%) |
| $500,000 to $749,999 | 29 (1.3%) | 22 (0.4%) |
| $750,000 to $999,999 | 0 (0.0%) | 12 (0.2%) |
| $1,000,000 or more | 12 (0.5%) | 25 (0.4%) |
| Total | 2,238 (100.0%) | 5,753 (100.0%) |
Household Income by Mortgage Status in Parkville
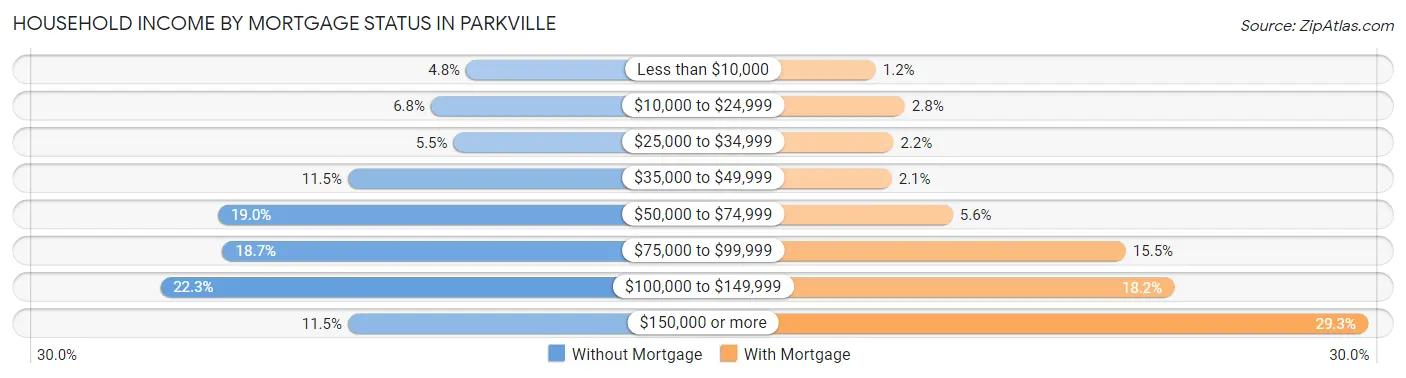
| Household Income | Without Mortgage | With Mortgage |
| Less than $10,000 | 107 (4.8%) | 67 (1.2%) |
| $10,000 to $24,999 | 152 (6.8%) | 162 (2.8%) |
| $25,000 to $34,999 | 123 (5.5%) | 125 (2.2%) |
| $35,000 to $49,999 | 258 (11.5%) | 119 (2.1%) |
| $50,000 to $74,999 | 424 (19.0%) | 320 (5.6%) |
| $75,000 to $99,999 | 418 (18.7%) | 889 (15.4%) |
| $100,000 to $149,999 | 498 (22.3%) | 1,047 (18.2%) |
| $150,000 or more | 258 (11.5%) | 1,684 (29.3%) |
| Total | 2,238 (100.0%) | 5,753 (100.0%) |
Property Value to Household Income Ratio in Parkville
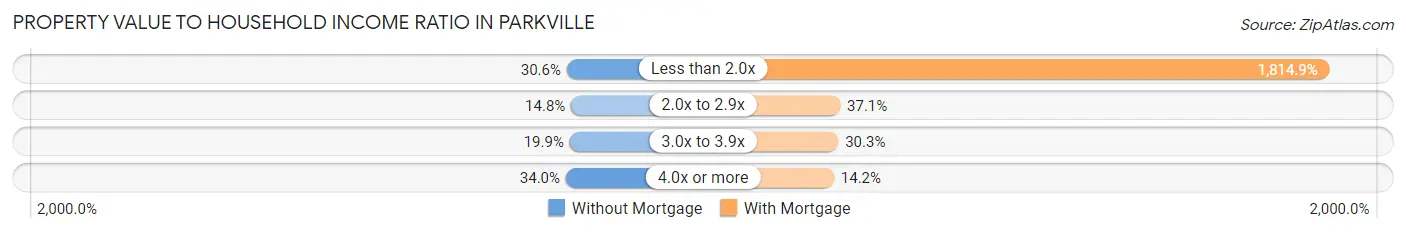
| Value-to-Income Ratio | Without Mortgage | With Mortgage |
| Less than 2.0x | 684 (30.6%) | 104,413 (1,814.9%) |
| 2.0x to 2.9x | 330 (14.7%) | 2,132 (37.1%) |
| 3.0x to 3.9x | 446 (19.9%) | 1,742 (30.3%) |
| 4.0x or more | 760 (34.0%) | 818 (14.2%) |
| Total | 2,238 (100.0%) | 5,753 (100.0%) |
Real Estate Taxes by Mortgage Status in Parkville
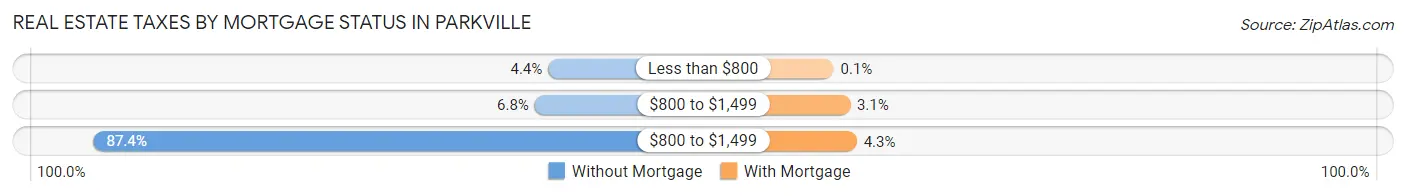
| Property Taxes | Without Mortgage | With Mortgage |
| Less than $800 | 98 (4.4%) | 6 (0.1%) |
| $800 to $1,499 | 153 (6.8%) | 178 (3.1%) |
| $800 to $1,499 | 1,956 (87.4%) | 249 (4.3%) |
| Total | 2,238 (100.0%) | 5,753 (100.0%) |
Health & Disability in Parkville
Health Insurance Coverage by Age in Parkville
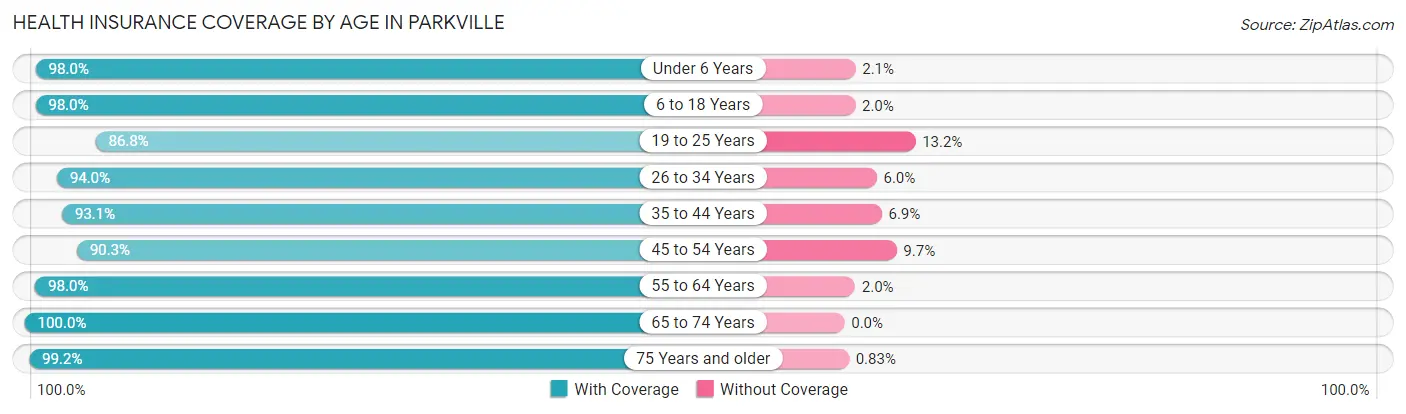
| Age Bracket | With Coverage | Without Coverage |
| Under 6 Years | 2,388 (98.0%) | 50 (2.1%) |
| 6 to 18 Years | 4,655 (98.0%) | 95 (2.0%) |
| 19 to 25 Years | 1,975 (86.8%) | 301 (13.2%) |
| 26 to 34 Years | 4,063 (94.0%) | 260 (6.0%) |
| 35 to 44 Years | 4,009 (93.1%) | 299 (6.9%) |
| 45 to 54 Years | 3,614 (90.3%) | 389 (9.7%) |
| 55 to 64 Years | 3,977 (98.0%) | 80 (2.0%) |
| 65 to 74 Years | 2,574 (100.0%) | 0 (0.0%) |
| 75 Years and older | 1,434 (99.2%) | 12 (0.8%) |
| Total | 28,689 (95.1%) | 1,486 (4.9%) |
Health Insurance Coverage by Citizenship Status in Parkville
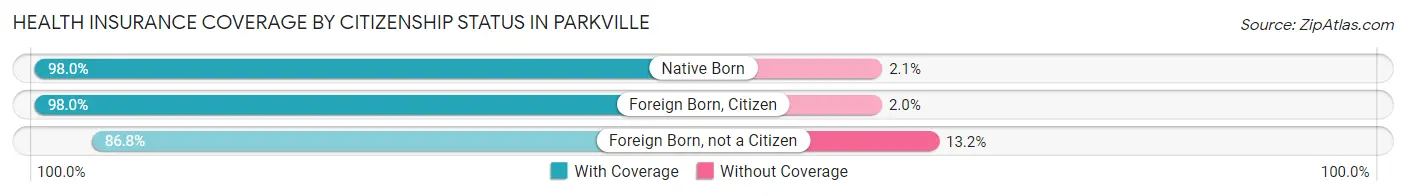
| Citizenship Status | With Coverage | Without Coverage |
| Native Born | 2,388 (98.0%) | 50 (2.1%) |
| Foreign Born, Citizen | 4,655 (98.0%) | 95 (2.0%) |
| Foreign Born, not a Citizen | 1,975 (86.8%) | 301 (13.2%) |
Health Insurance Coverage by Household Income in Parkville
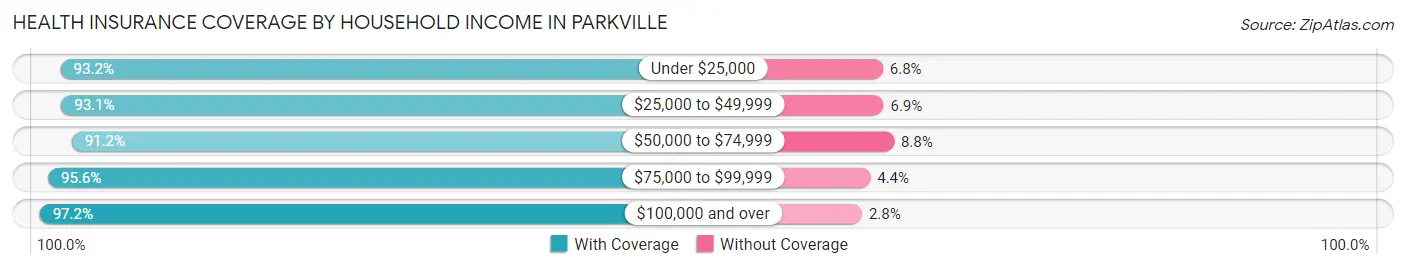
| Household Income | With Coverage | Without Coverage |
| Under $25,000 | 1,945 (93.2%) | 141 (6.8%) |
| $25,000 to $49,999 | 3,290 (93.1%) | 243 (6.9%) |
| $50,000 to $74,999 | 5,000 (91.2%) | 485 (8.8%) |
| $75,000 to $99,999 | 4,731 (95.6%) | 218 (4.4%) |
| $100,000 and over | 13,642 (97.2%) | 399 (2.8%) |
Public vs Private Health Insurance Coverage by Age in Parkville
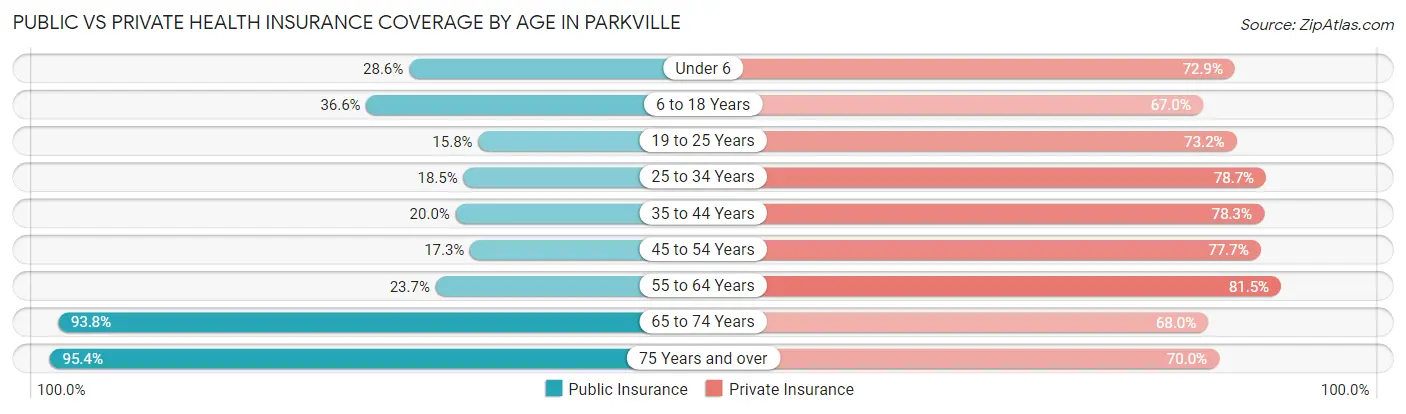
| Age Bracket | Public Insurance | Private Insurance |
| Under 6 | 698 (28.6%) | 1,778 (72.9%) |
| 6 to 18 Years | 1,736 (36.5%) | 3,182 (67.0%) |
| 19 to 25 Years | 359 (15.8%) | 1,667 (73.2%) |
| 25 to 34 Years | 801 (18.5%) | 3,403 (78.7%) |
| 35 to 44 Years | 861 (20.0%) | 3,374 (78.3%) |
| 45 to 54 Years | 692 (17.3%) | 3,111 (77.7%) |
| 55 to 64 Years | 961 (23.7%) | 3,307 (81.5%) |
| 65 to 74 Years | 2,415 (93.8%) | 1,750 (68.0%) |
| 75 Years and over | 1,379 (95.4%) | 1,012 (70.0%) |
| Total | 9,902 (32.8%) | 22,584 (74.8%) |
Disability Status by Sex by Age in Parkville
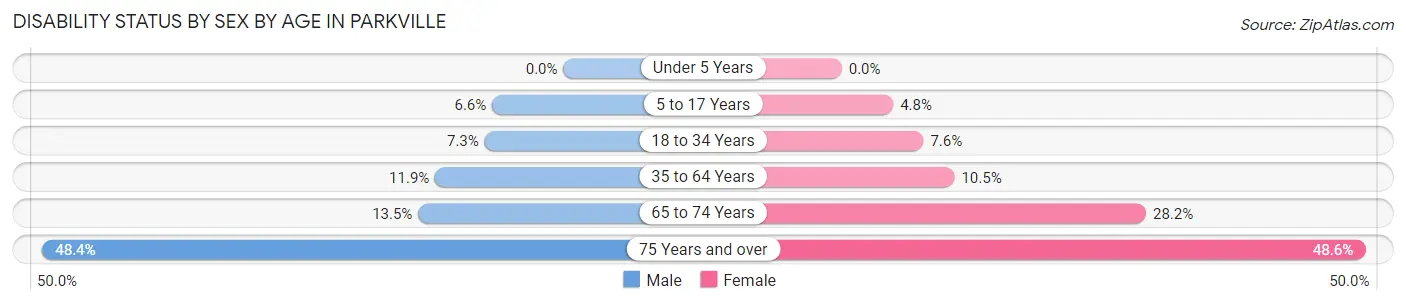
| Age Bracket | Male | Female |
| Under 5 Years | 0 (0.0%) | 0 (0.0%) |
| 5 to 17 Years | 157 (6.6%) | 116 (4.8%) |
| 18 to 34 Years | 200 (7.3%) | 322 (7.6%) |
| 35 to 64 Years | 721 (11.9%) | 660 (10.5%) |
| 65 to 74 Years | 165 (13.5%) | 381 (28.2%) |
| 75 Years and over | 264 (48.3%) | 437 (48.6%) |
Disability Class by Sex by Age in Parkville
Disability Class: Hearing Difficulty
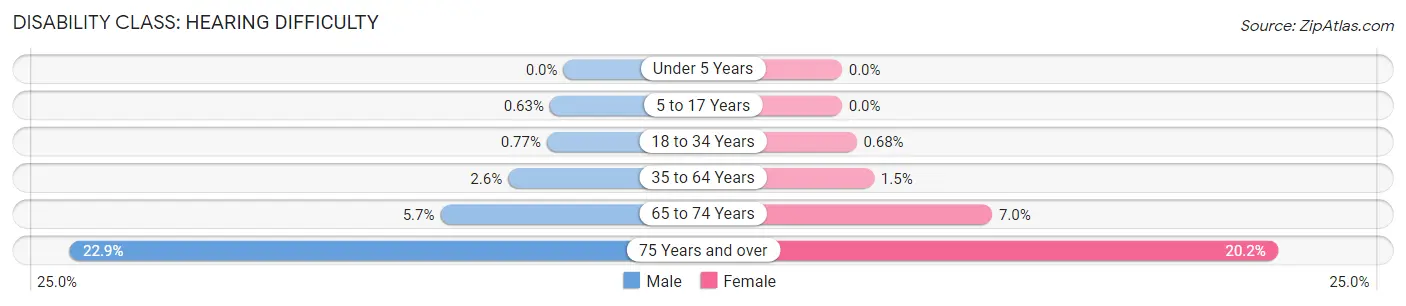
| Age Bracket | Male | Female |
| Under 5 Years | 0 (0.0%) | 0 (0.0%) |
| 5 to 17 Years | 15 (0.6%) | 0 (0.0%) |
| 18 to 34 Years | 21 (0.8%) | 29 (0.7%) |
| 35 to 64 Years | 156 (2.6%) | 94 (1.5%) |
| 65 to 74 Years | 70 (5.7%) | 94 (7.0%) |
| 75 Years and over | 125 (22.9%) | 182 (20.2%) |
Disability Class: Vision Difficulty
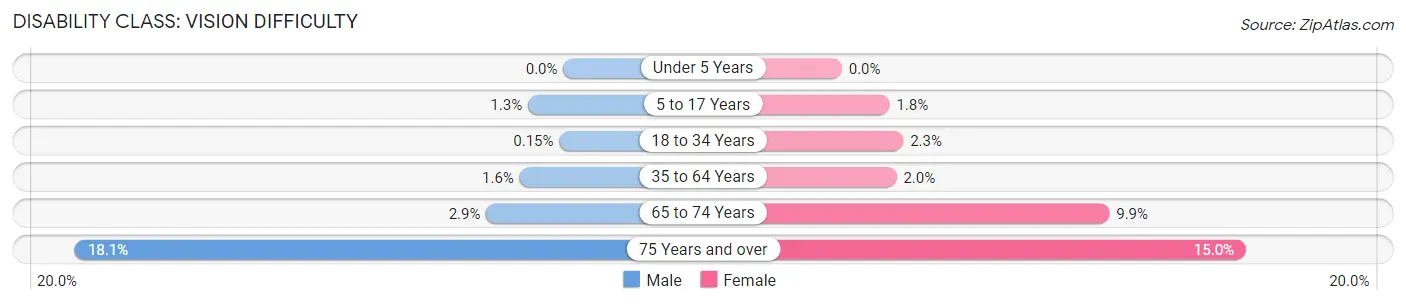
| Age Bracket | Male | Female |
| Under 5 Years | 0 (0.0%) | 0 (0.0%) |
| 5 to 17 Years | 31 (1.3%) | 43 (1.8%) |
| 18 to 34 Years | 4 (0.2%) | 97 (2.3%) |
| 35 to 64 Years | 98 (1.6%) | 128 (2.0%) |
| 65 to 74 Years | 35 (2.9%) | 134 (9.9%) |
| 75 Years and over | 99 (18.1%) | 135 (15.0%) |
Disability Class: Cognitive Difficulty
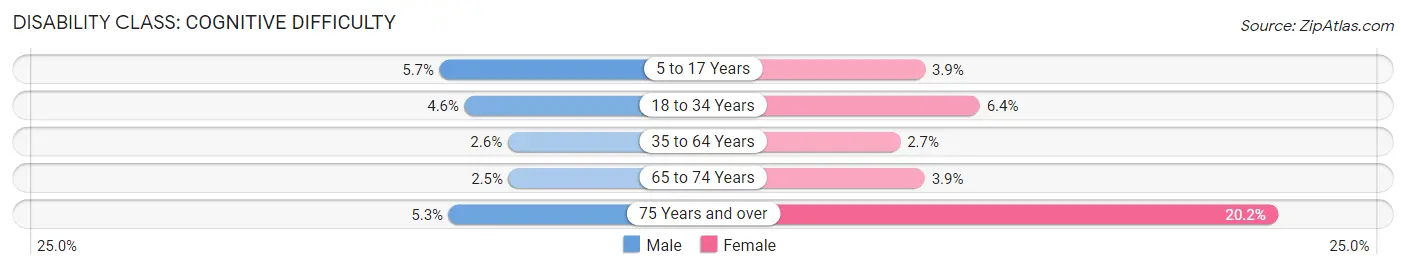
| Age Bracket | Male | Female |
| 5 to 17 Years | 136 (5.7%) | 94 (3.9%) |
| 18 to 34 Years | 125 (4.6%) | 272 (6.4%) |
| 35 to 64 Years | 156 (2.6%) | 171 (2.7%) |
| 65 to 74 Years | 31 (2.5%) | 52 (3.8%) |
| 75 Years and over | 29 (5.3%) | 182 (20.2%) |
Disability Class: Ambulatory Difficulty
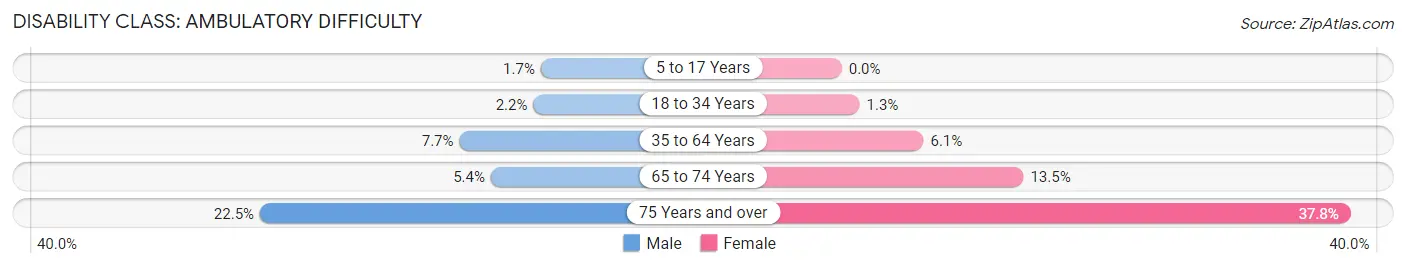
| Age Bracket | Male | Female |
| 5 to 17 Years | 40 (1.7%) | 0 (0.0%) |
| 18 to 34 Years | 61 (2.2%) | 56 (1.3%) |
| 35 to 64 Years | 468 (7.7%) | 383 (6.1%) |
| 65 to 74 Years | 66 (5.4%) | 182 (13.5%) |
| 75 Years and over | 123 (22.5%) | 340 (37.8%) |
Disability Class: Self-Care Difficulty
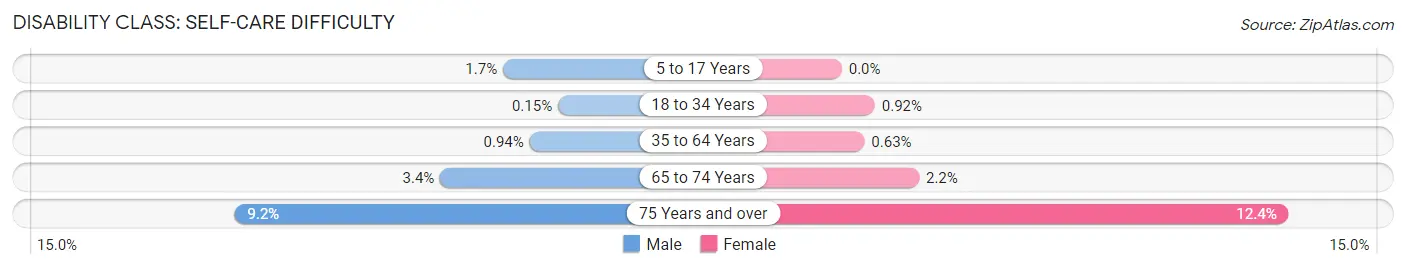
| Age Bracket | Male | Female |
| 5 to 17 Years | 40 (1.7%) | 0 (0.0%) |
| 18 to 34 Years | 4 (0.2%) | 39 (0.9%) |
| 35 to 64 Years | 57 (0.9%) | 40 (0.6%) |
| 65 to 74 Years | 42 (3.4%) | 29 (2.1%) |
| 75 Years and over | 50 (9.2%) | 112 (12.4%) |
Technology Access in Parkville
Computing Device Access in Parkville
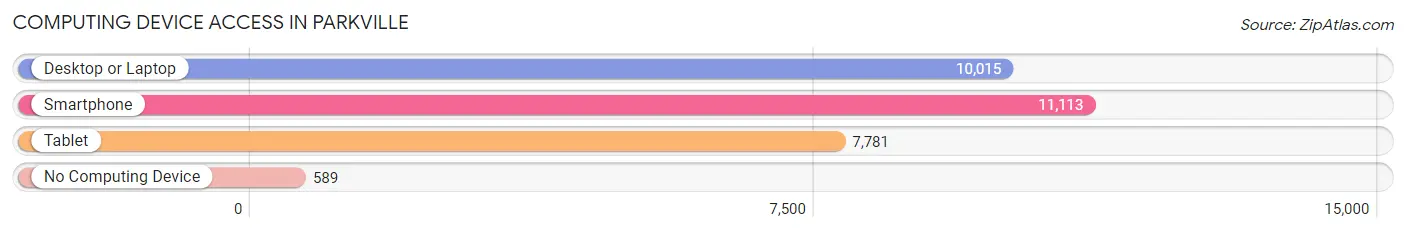
| Device Type | # Households | % Households |
| Desktop or Laptop | 10,015 | 80.5% |
| Smartphone | 11,113 | 89.3% |
| Tablet | 7,781 | 62.5% |
| No Computing Device | 589 | 4.7% |
| Total | 12,442 | 100.0% |
Internet Access in Parkville
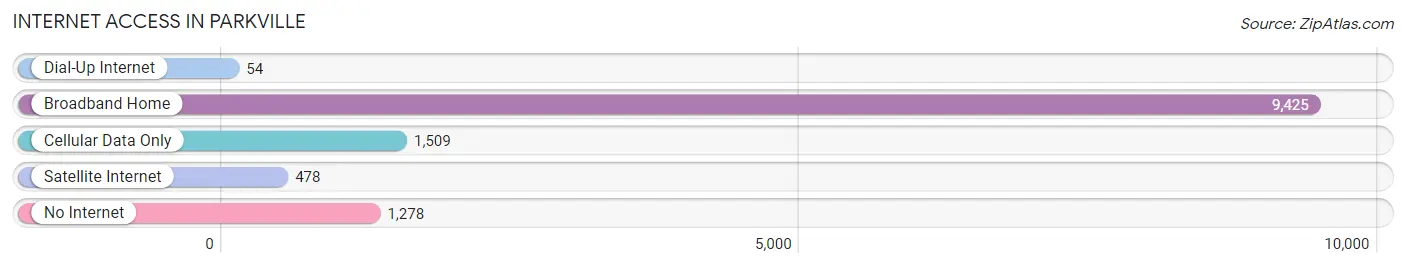
| Internet Type | # Households | % Households |
| Dial-Up Internet | 54 | 0.4% |
| Broadband Home | 9,425 | 75.7% |
| Cellular Data Only | 1,509 | 12.1% |
| Satellite Internet | 478 | 3.8% |
| No Internet | 1,278 | 10.3% |
| Total | 12,442 | 100.0% |
Parkville Summary
History
Parkville, Maryland is a small town located in Baltimore County, Maryland. It is situated just north of the city of Baltimore and is part of the greater Baltimore metropolitan area. The town was founded in 1887 by the Baltimore and Ohio Railroad and was originally known as Parkville Station. The town was named after the nearby Parkville Hotel, which was built in 1883.
The town of Parkville has a rich history that dates back to the early 19th century. In 1812, the area was part of a large tract of land owned by the Carroll family. The Carrolls were prominent landowners in the area and owned a large portion of the land that would eventually become Parkville. In 1887, the Baltimore and Ohio Railroad purchased the land from the Carrolls and began to develop the area. The railroad built a station in Parkville and the town began to grow.
In the early 20th century, Parkville was a thriving community with a variety of businesses and industries. The town was home to a number of factories, including a paper mill, a canning factory, and a brickyard. The town also had a number of stores, including a grocery store, a hardware store, and a drug store.
In the 1950s, Parkville began to experience a decline in population and businesses. The decline was due to the growth of the suburbs and the decline of the railroad industry. By the 1970s, the town was in a state of decline and many of the businesses had closed.
In the 1980s, Parkville began to experience a resurgence. The town was revitalized with the construction of a new shopping center and the development of a new residential area. The town also experienced an influx of new businesses, including restaurants, banks, and other retail stores.
Geography
Parkville is located in Baltimore County, Maryland. It is situated just north of the city of Baltimore and is part of the greater Baltimore metropolitan area. The town is bordered by the Loch Raven Reservoir to the north, the Gunpowder River to the east, and the city of Towson to the south.
The town of Parkville is located in a hilly area and is surrounded by forests and streams. The town is located in a temperate climate and experiences mild winters and hot summers. The average annual temperature is around 60 degrees Fahrenheit.
Economy
The economy of Parkville is largely based on the service industry. The town is home to a number of restaurants, banks, and other retail stores. The town also has a number of medical facilities, including a hospital and a number of medical offices.
The town is also home to a number of manufacturing companies, including a paper mill, a canning factory, and a brickyard. The town also has a number of small businesses, including auto repair shops, beauty salons, and pet stores.
Demographics
As of the 2010 census, the population of Parkville was 8,919. The town has a population density of 1,845 people per square mile. The median age of the population is 39.7 years.
The racial makeup of Parkville is 87.3% White, 8.2% African American, 0.7% Asian, 0.3% Native American, and 3.5% from other races. The town has a large Hispanic population, with 8.7% of the population being of Hispanic or Latino origin.
The median household income in Parkville is $60,945. The town has a poverty rate of 8.3%. The town has a high rate of homeownership, with 73.3% of the population owning their own homes.
Common Questions
What is Per Capita Income in Parkville?
Per Capita income in Parkville is $39,550.
What is the Median Family Income in Parkville?
Median Family Income in Parkville is $95,735.
What is the Median Household income in Parkville?
Median Household Income in Parkville is $79,661.
What is Income or Wage Gap in Parkville?
Income or Wage Gap in Parkville is 27.1%.
Women in Parkville earn 72.9 cents for every dollar earned by a man.
What is Family Income Deficit in Parkville?
Family Income Deficit in Parkville is $10,547.
Families that are below poverty line in Parkville earn $10,547 less on average than the poverty threshold level.
What is Inequality or Gini Index in Parkville?
Inequality or Gini Index in Parkville is 0.38.
What is the Total Population of Parkville?
Total Population of Parkville is 30,520.
What is the Total Male Population of Parkville?
Total Male Population of Parkville is 13,988.
What is the Total Female Population of Parkville?
Total Female Population of Parkville is 16,532.
What is the Ratio of Males per 100 Females in Parkville?
There are 84.61 Males per 100 Females in Parkville.
What is the Ratio of Females per 100 Males in Parkville?
There are 118.19 Females per 100 Males in Parkville.
What is the Median Population Age in Parkville?
Median Population Age in Parkville is 37.6 Years.
What is the Average Family Size in Parkville
Average Family Size in Parkville is 3.0 People.
What is the Average Household Size in Parkville
Average Household Size in Parkville is 2.4 People.
How Large is the Labor Force in Parkville?
There are 17,425 People in the Labor Forcein in Parkville.
What is the Percentage of People in the Labor Force in Parkville?
70.7% of People are in the Labor Force in Parkville.
What is the Unemployment Rate in Parkville?
Unemployment Rate in Parkville is 5.7%.