Potomac, MD Map & Demographics
Potomac Map
Potomac Overview
$102,878
PER CAPITA INCOME
$250,001
AVG FAMILY INCOME
$218,710
AVG HOUSEHOLD INCOME
44.6%
WAGE / INCOME GAP [ % ]
55.4¢/ $1
WAGE / INCOME GAP [ $ ]
$9,868
FAMILY INCOME DEFICIT
0.46
INEQUALITY / GINI INDEX
46,499
TOTAL POPULATION
22,531
MALE POPULATION
23,968
FEMALE POPULATION
94.00
MALES / 100 FEMALES
106.38
FEMALES / 100 MALES
47.4
MEDIAN AGE
3.2
AVG FAMILY SIZE
2.8
AVG HOUSEHOLD SIZE
23,150
LABOR FORCE [ PEOPLE ]
62.1%
PERCENT IN LABOR FORCE
4.2%
UNEMPLOYMENT RATE
Potomac Zip Codes
Income in Potomac
Income Overview in Potomac
Per Capita Income in Potomac is $102,878, while median incomes of families and households are $250,001 and $218,710 respectively.
| Characteristic | Number | Measure |
| Per Capita Income | 46,499 | $102,878 |
| Median Family Income | 12,898 | $250,001 |
| Mean Family Income | 12,898 | $330,681 |
| Median Household Income | 16,328 | $218,710 |
| Mean Household Income | 16,328 | $287,918 |
| Income Deficit | 12,898 | $9,868 |
| Wage / Income Gap (%) | 46,499 | 44.59% |
| Wage / Income Gap ($) | 46,499 | 55.41¢ per $1 |
| Gini / Inequality Index | 46,499 | 0.46 |
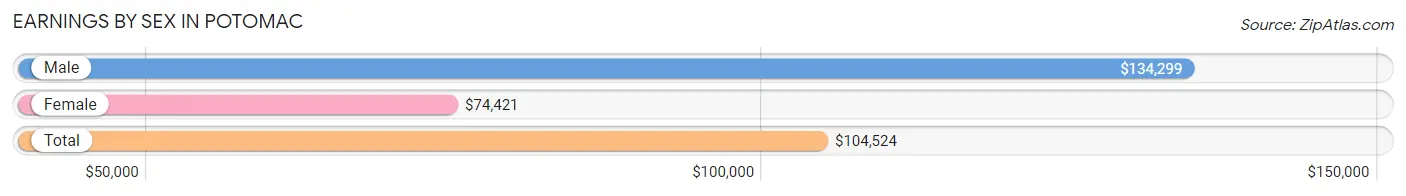
Earnings by Sex in Potomac
Average Earnings in Potomac are $104,524, $134,299 for men and $74,421 for women, a difference of 44.6%.
| Sex | Number | Average Earnings |
| Male | 12,859 (51.8%) | $134,299 |
| Female | 11,973 (48.2%) | $74,421 |
| Total | 24,832 (100.0%) | $104,524 |
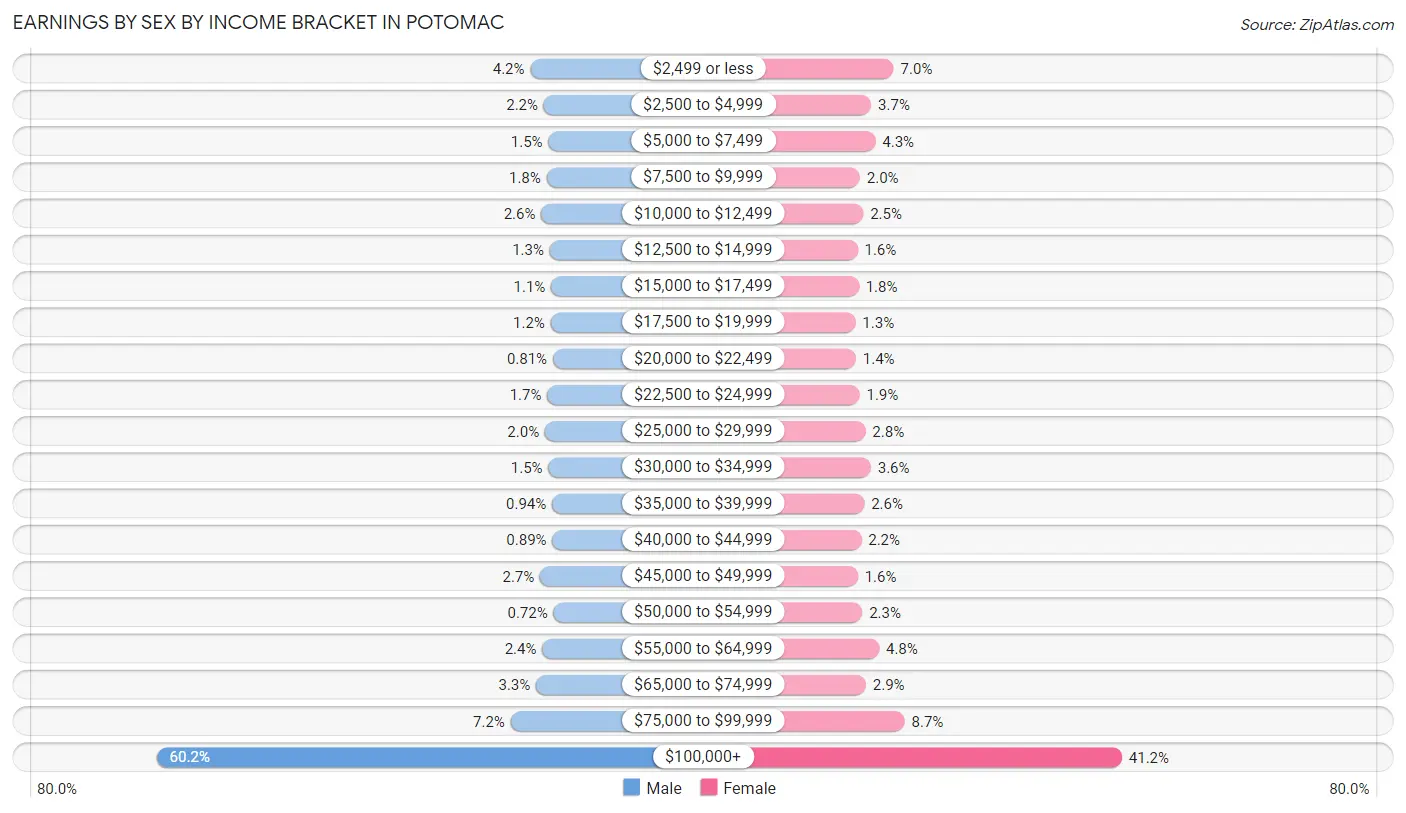
Earnings by Sex by Income Bracket in Potomac
The most common earnings brackets in Potomac are $100,000+ for men (7,743 | 60.2%) and $100,000+ for women (4,937 | 41.2%).
| Income | Male | Female |
| $2,499 or less | 539 (4.2%) | 840 (7.0%) |
| $2,500 to $4,999 | 279 (2.2%) | 437 (3.6%) |
| $5,000 to $7,499 | 192 (1.5%) | 512 (4.3%) |
| $7,500 to $9,999 | 226 (1.8%) | 233 (1.9%) |
| $10,000 to $12,499 | 329 (2.6%) | 294 (2.5%) |
| $12,500 to $14,999 | 164 (1.3%) | 193 (1.6%) |
| $15,000 to $17,499 | 137 (1.1%) | 214 (1.8%) |
| $17,500 to $19,999 | 148 (1.1%) | 155 (1.3%) |
| $20,000 to $22,499 | 104 (0.8%) | 163 (1.4%) |
| $22,500 to $24,999 | 214 (1.7%) | 229 (1.9%) |
| $25,000 to $29,999 | 257 (2.0%) | 334 (2.8%) |
| $30,000 to $34,999 | 191 (1.5%) | 431 (3.6%) |
| $35,000 to $39,999 | 121 (0.9%) | 312 (2.6%) |
| $40,000 to $44,999 | 115 (0.9%) | 260 (2.2%) |
| $45,000 to $49,999 | 351 (2.7%) | 196 (1.6%) |
| $50,000 to $54,999 | 92 (0.7%) | 276 (2.3%) |
| $55,000 to $64,999 | 310 (2.4%) | 578 (4.8%) |
| $65,000 to $74,999 | 428 (3.3%) | 342 (2.9%) |
| $75,000 to $99,999 | 919 (7.1%) | 1,037 (8.7%) |
| $100,000+ | 7,743 (60.2%) | 4,937 (41.2%) |
| Total | 12,859 (100.0%) | 11,973 (100.0%) |
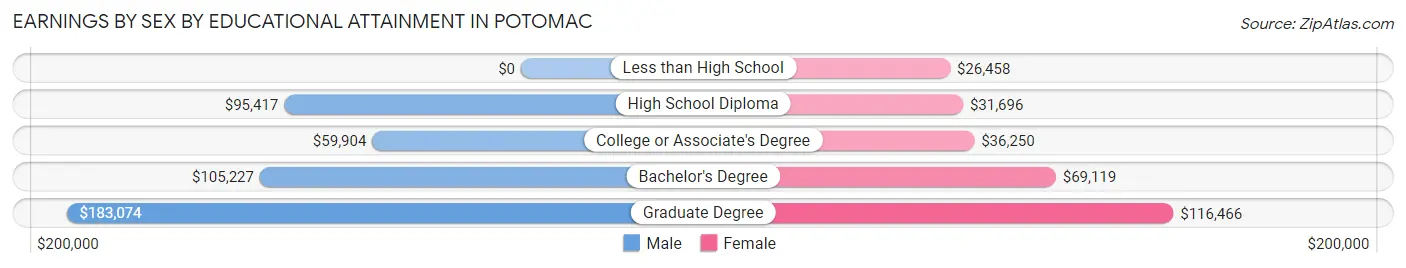
Earnings by Sex by Educational Attainment in Potomac
Average earnings in Potomac are $154,235 for men and $94,010 for women, a difference of 39.1%. Men with an educational attainment of graduate degree enjoy the highest average annual earnings of $183,074, while those with college or associate's degree education earn the least with $59,904. Women with an educational attainment of graduate degree earn the most with the average annual earnings of $116,466, while those with less than high school education have the smallest earnings of $26,458.
| Educational Attainment | Male Income | Female Income |
| Less than High School | - | - |
| High School Diploma | $95,417 | $31,696 |
| College or Associate's Degree | $59,904 | $36,250 |
| Bachelor's Degree | $105,227 | $69,119 |
| Graduate Degree | $183,074 | $116,466 |
| Total | $154,235 | $94,010 |
Family Income in Potomac
Family Income Brackets in Potomac
According to the Potomac family income data, there are 8,319 families falling into the $200,000+ income range, which is the most common income bracket and makes up 64.5% of all families. Conversely, the $10,000 to $14,999 income bracket is the least frequent group with only 77 families (0.6%) belonging to this category.
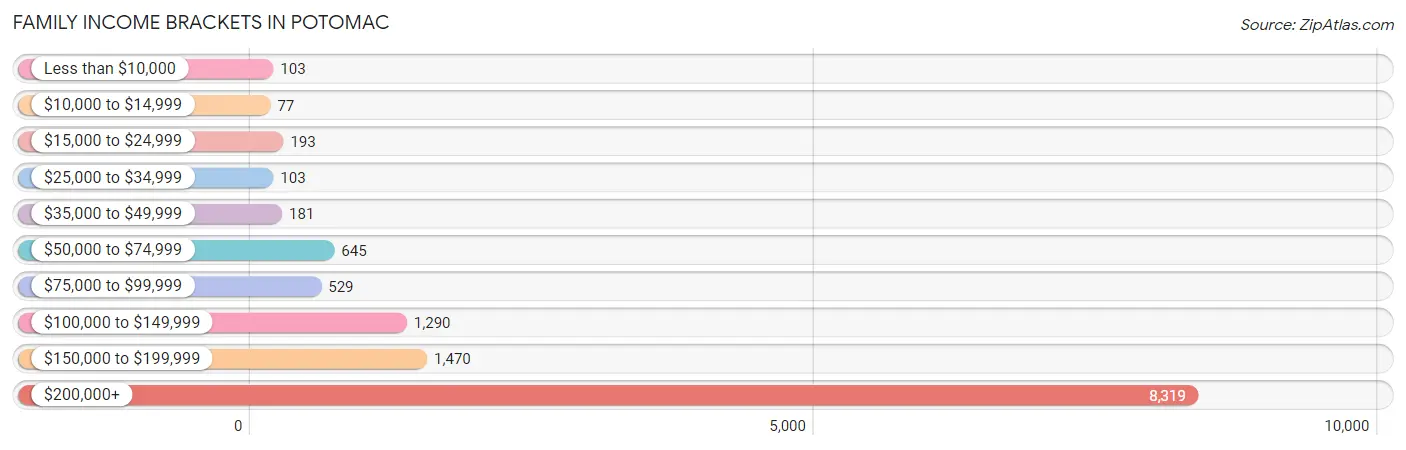
| Income Bracket | # Families | % Families |
| Less than $10,000 | 103 | 0.8% |
| $10,000 to $14,999 | 77 | 0.6% |
| $15,000 to $24,999 | 193 | 1.5% |
| $25,000 to $34,999 | 103 | 0.8% |
| $35,000 to $49,999 | 181 | 1.4% |
| $50,000 to $74,999 | 645 | 5.0% |
| $75,000 to $99,999 | 529 | 4.1% |
| $100,000 to $149,999 | 1,290 | 10.0% |
| $150,000 to $199,999 | 1,470 | 11.4% |
| $200,000+ | 8,319 | 64.5% |
Family Income by Famaliy Size in Potomac
3-person families (2,780 | 21.5%) account for the highest median family income in Potomac with $250,001 per family, while 2-person families (5,502 | 42.7%) have the highest median income of $117,250 per family member.
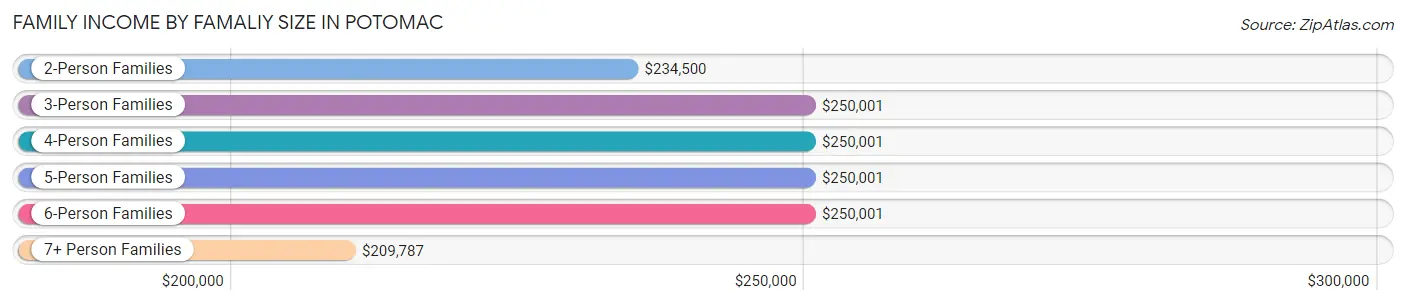
| Income Bracket | # Families | Median Income |
| 2-Person Families | 5,502 (42.7%) | $234,500 |
| 3-Person Families | 2,780 (21.5%) | $250,001 |
| 4-Person Families | 3,135 (24.3%) | $250,001 |
| 5-Person Families | 1,073 (8.3%) | $250,001 |
| 6-Person Families | 281 (2.2%) | $250,001 |
| 7+ Person Families | 127 (1.0%) | $209,787 |
| Total | 12,898 (100.0%) | $250,001 |
Family Income by Number of Earners in Potomac
The median family income in Potomac is $250,001, with families comprising 2 earners (6,020) having the highest median family income of $250,001, while families with no earners (1,781) have the lowest median family income of $152,535, accounting for 46.7% and 13.8% of families, respectively.
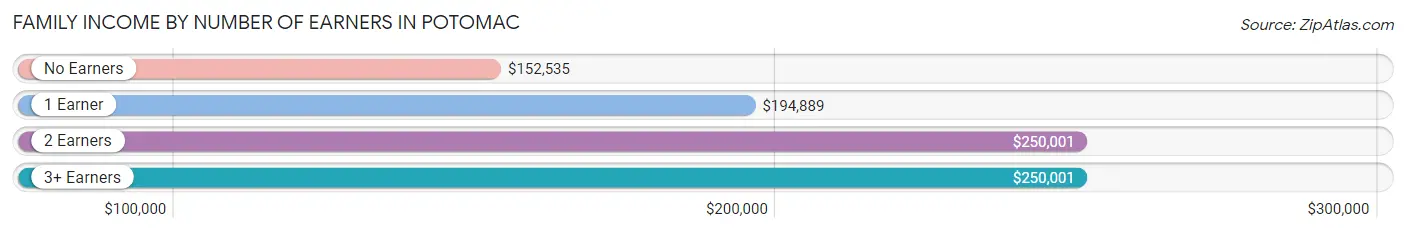
| Number of Earners | # Families | Median Income |
| No Earners | 1,781 (13.8%) | $152,535 |
| 1 Earner | 3,280 (25.4%) | $194,889 |
| 2 Earners | 6,020 (46.7%) | $250,001 |
| 3+ Earners | 1,817 (14.1%) | $250,001 |
| Total | 12,898 (100.0%) | $250,001 |
Household Income in Potomac
Household Income Brackets in Potomac
With 8,882 households falling in the category, the $200,000+ income range is the most frequent in Potomac, accounting for 54.4% of all households. In contrast, only 180 households (1.1%) fall into the $10,000 to $14,999 income bracket, making it the least populous group.
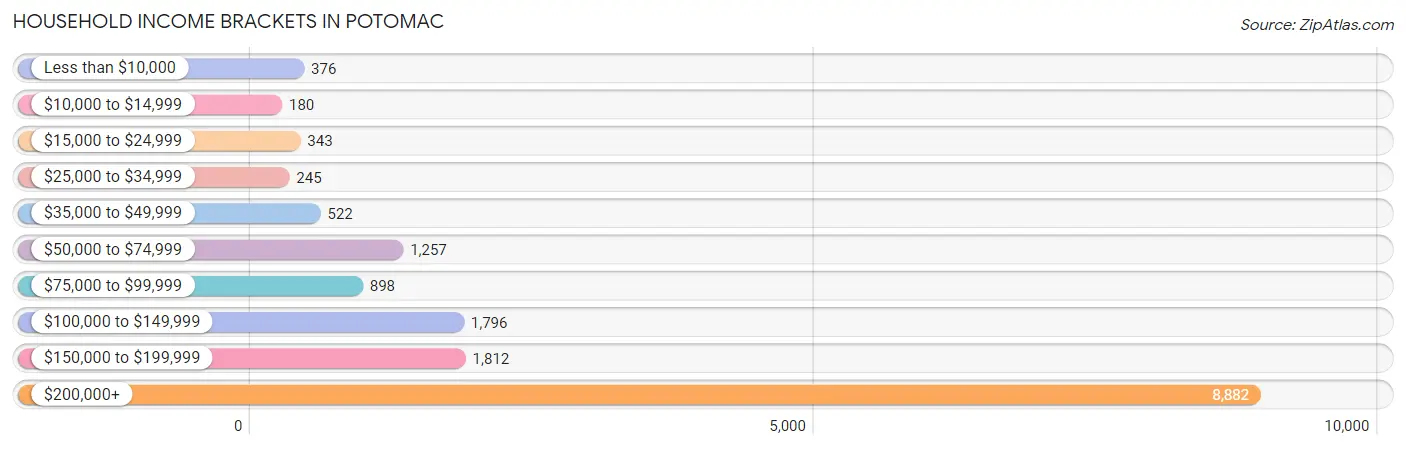
| Income Bracket | # Households | % Households |
| Less than $10,000 | 376 | 2.3% |
| $10,000 to $14,999 | 180 | 1.1% |
| $15,000 to $24,999 | 343 | 2.1% |
| $25,000 to $34,999 | 245 | 1.5% |
| $35,000 to $49,999 | 522 | 3.2% |
| $50,000 to $74,999 | 1,257 | 7.7% |
| $75,000 to $99,999 | 898 | 5.5% |
| $100,000 to $149,999 | 1,796 | 11.0% |
| $150,000 to $199,999 | 1,812 | 11.1% |
| $200,000+ | 8,882 | 54.4% |
Household Income by Householder Age in Potomac
The median household income in Potomac is $218,710, with the highest median household income of $250,001 found in the 45 to 64 years age bracket for the primary householder. A total of 7,098 households (43.5%) fall into this category. Meanwhile, the 15 to 24 years age bracket for the primary householder has the lowest median household income of $0, with 39 households (0.2%) in this group.
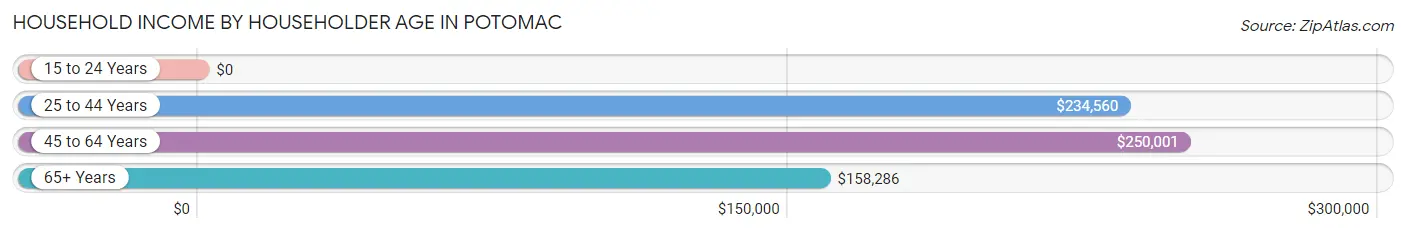
| Income Bracket | # Households | Median Income |
| 15 to 24 Years | 39 (0.2%) | $0 |
| 25 to 44 Years | 3,165 (19.4%) | $234,560 |
| 45 to 64 Years | 7,098 (43.5%) | $250,001 |
| 65+ Years | 6,026 (36.9%) | $158,286 |
| Total | 16,328 (100.0%) | $218,710 |
Poverty in Potomac
Income Below Poverty by Sex and Age in Potomac
With 3.0% poverty level for males and 4.5% for females among the residents of Potomac, 15 year old males and 65 to 74 year old females are the most vulnerable to poverty, with 38 males (8.4%) and 316 females (10.5%) in their respective age groups living below the poverty level.
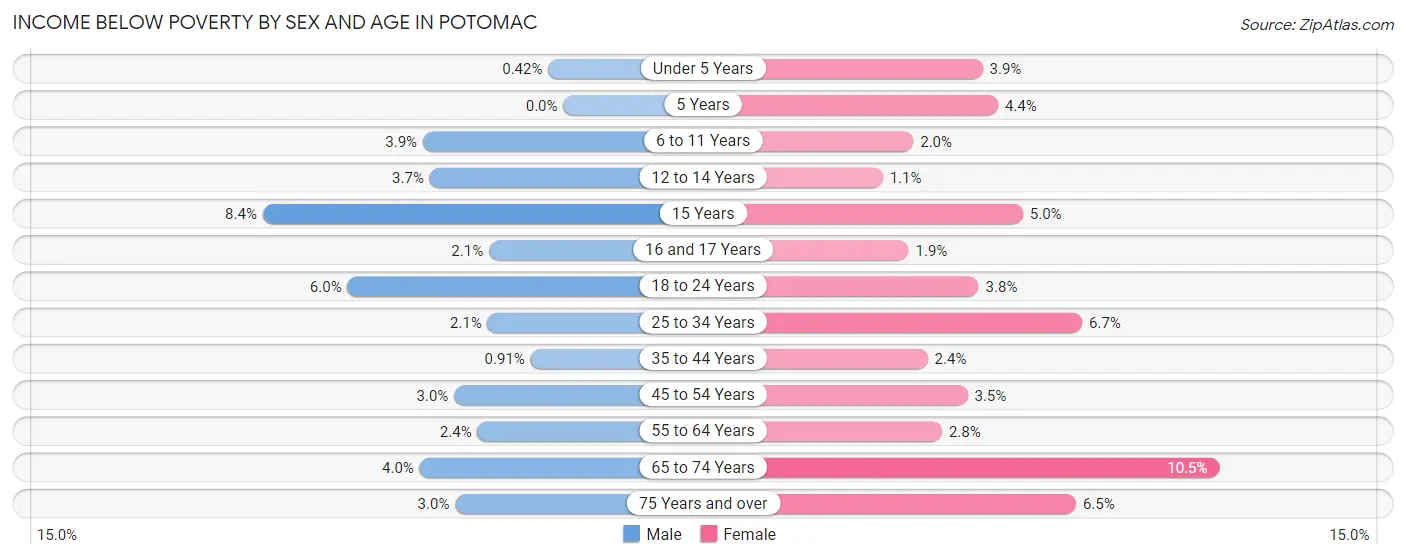
| Age Bracket | Male | Female |
| Under 5 Years | 5 (0.4%) | 35 (3.9%) |
| 5 Years | 0 (0.0%) | 9 (4.3%) |
| 6 to 11 Years | 70 (3.9%) | 35 (2.0%) |
| 12 to 14 Years | 48 (3.7%) | 10 (1.1%) |
| 15 Years | 38 (8.4%) | 19 (5.0%) |
| 16 and 17 Years | 19 (2.1%) | 18 (1.9%) |
| 18 to 24 Years | 97 (6.0%) | 57 (3.8%) |
| 25 to 34 Years | 27 (2.1%) | 84 (6.7%) |
| 35 to 44 Years | 21 (0.9%) | 67 (2.4%) |
| 45 to 54 Years | 103 (3.0%) | 132 (3.5%) |
| 55 to 64 Years | 76 (2.4%) | 101 (2.8%) |
| 65 to 74 Years | 104 (4.0%) | 316 (10.5%) |
| 75 Years and over | 64 (3.0%) | 174 (6.5%) |
| Total | 672 (3.0%) | 1,057 (4.5%) |
Income Above Poverty by Sex and Age in Potomac
According to the poverty statistics in Potomac, males aged 5 years and females aged 12 to 14 years are the age groups that are most secure financially, with 100.0% of males and 98.9% of females in these age groups living above the poverty line.
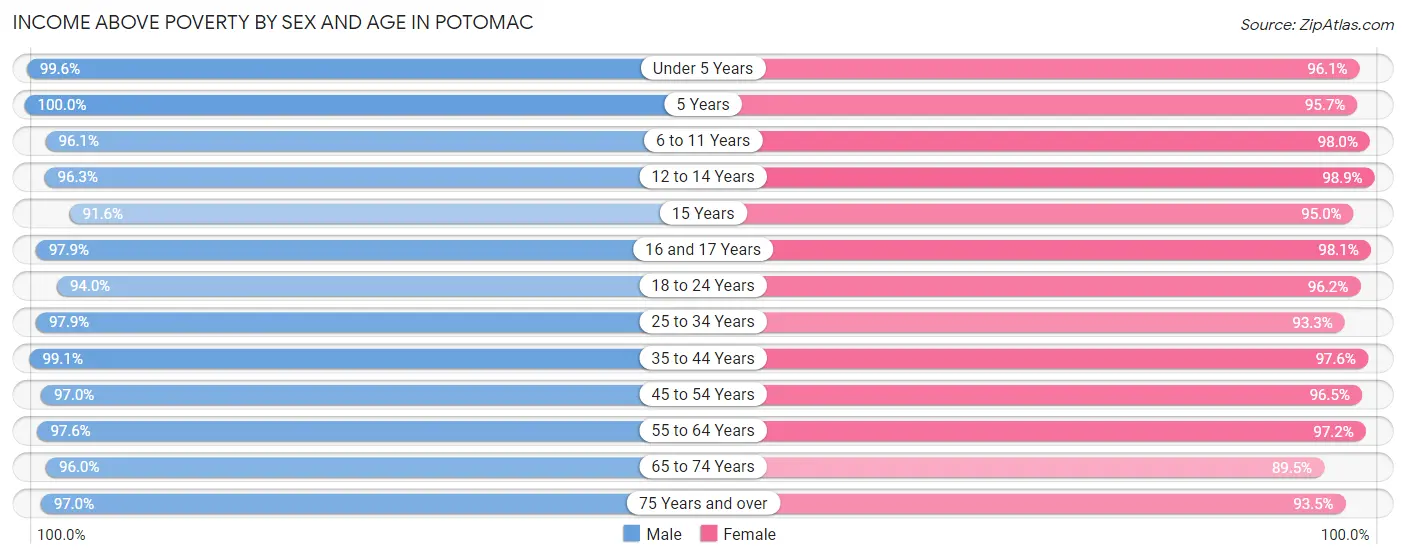
| Age Bracket | Male | Female |
| Under 5 Years | 1,196 (99.6%) | 858 (96.1%) |
| 5 Years | 287 (100.0%) | 198 (95.7%) |
| 6 to 11 Years | 1,720 (96.1%) | 1,720 (98.0%) |
| 12 to 14 Years | 1,244 (96.3%) | 864 (98.9%) |
| 15 Years | 416 (91.6%) | 358 (95.0%) |
| 16 and 17 Years | 899 (97.9%) | 950 (98.1%) |
| 18 to 24 Years | 1,516 (94.0%) | 1,439 (96.2%) |
| 25 to 34 Years | 1,252 (97.9%) | 1,171 (93.3%) |
| 35 to 44 Years | 2,280 (99.1%) | 2,733 (97.6%) |
| 45 to 54 Years | 3,289 (97.0%) | 3,641 (96.5%) |
| 55 to 64 Years | 3,110 (97.6%) | 3,513 (97.2%) |
| 65 to 74 Years | 2,499 (96.0%) | 2,690 (89.5%) |
| 75 Years and over | 2,065 (97.0%) | 2,496 (93.5%) |
| Total | 21,773 (97.0%) | 22,631 (95.5%) |
Income Below Poverty Among Married-Couple Families in Potomac
The poverty statistics for married-couple families in Potomac show that 1.8% or 199 of the total 11,387 families live below the poverty line. Families with no children have the highest poverty rate of 2.2%, comprising of 133 families. On the other hand, families with 3 or 4 children have the lowest poverty rate of 0.0%, which includes 0 families.
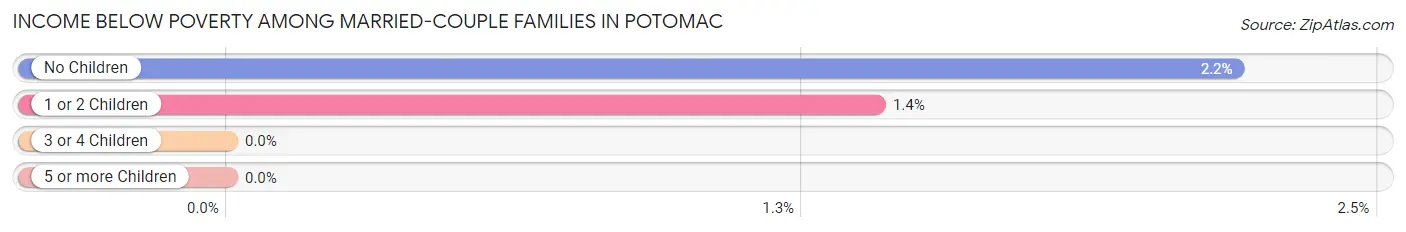
| Children | Above Poverty | Below Poverty |
| No Children | 5,935 (97.8%) | 133 (2.2%) |
| 1 or 2 Children | 4,615 (98.6%) | 66 (1.4%) |
| 3 or 4 Children | 597 (100.0%) | 0 (0.0%) |
| 5 or more Children | 41 (100.0%) | 0 (0.0%) |
| Total | 11,188 (98.3%) | 199 (1.8%) |
Income Below Poverty Among Single-Parent Households in Potomac
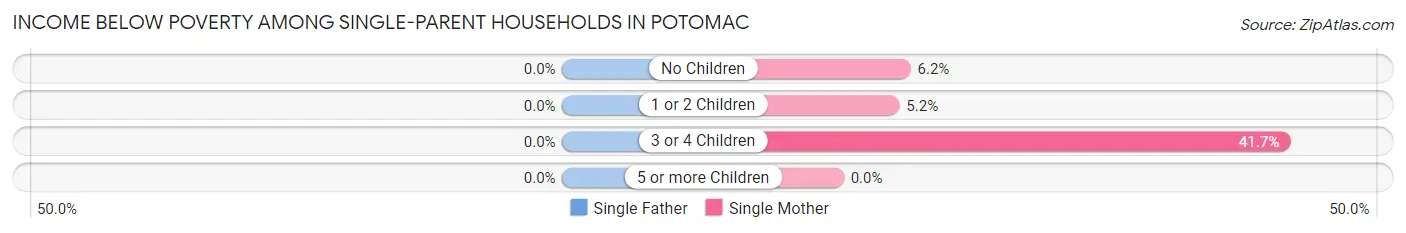
| Children | Single Father | Single Mother |
| No Children | 0 (0.0%) | 35 (6.2%) |
| 1 or 2 Children | 0 (0.0%) | 27 (5.2%) |
| 3 or 4 Children | 0 (0.0%) | 40 (41.7%) |
| 5 or more Children | 0 (0.0%) | 0 (0.0%) |
| Total | 0 (0.0%) | 102 (8.7%) |
Income Below Poverty Among Married-Couple vs Single-Parent Households in Potomac
The poverty data for Potomac shows that 199 of the married-couple family households (1.8%) and 102 of the single-parent households (6.8%) are living below the poverty level. Within the married-couple family households, those with no children have the highest poverty rate, with 133 households (2.2%) falling below the poverty line. Among the single-parent households, those with 3 or 4 children have the highest poverty rate, with 40 household (32.5%) living below poverty.
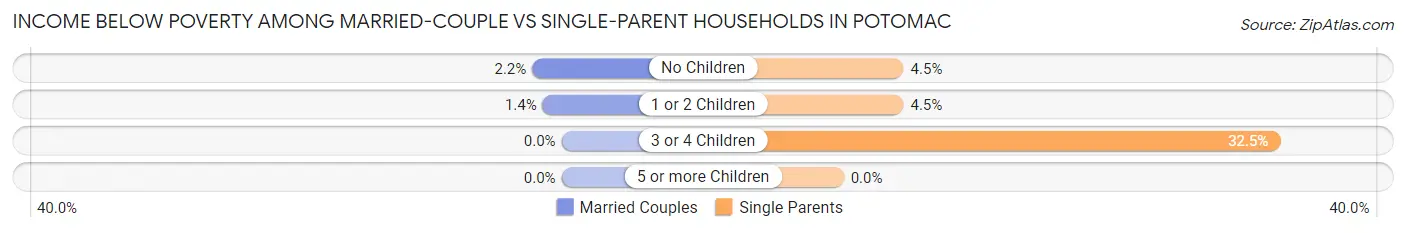
| Children | Married-Couple Families | Single-Parent Households |
| No Children | 133 (2.2%) | 35 (4.5%) |
| 1 or 2 Children | 66 (1.4%) | 27 (4.5%) |
| 3 or 4 Children | 0 (0.0%) | 40 (32.5%) |
| 5 or more Children | 0 (0.0%) | 0 (0.0%) |
| Total | 199 (1.8%) | 102 (6.8%) |
Race in Potomac
The most populous races in Potomac are White / Caucasian (29,377 | 63.2%), Asian (9,576 | 20.6%), and Hispanic or Latino (4,560 | 9.8%).
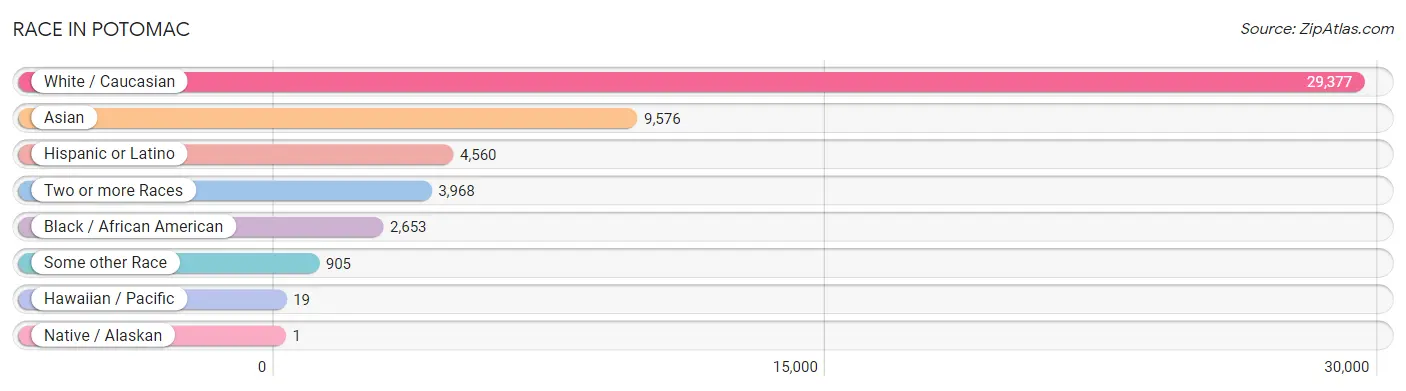
| Race | # Population | % Population |
| Asian | 9,576 | 20.6% |
| Black / African American | 2,653 | 5.7% |
| Hawaiian / Pacific | 19 | 0.0% |
| Hispanic or Latino | 4,560 | 9.8% |
| Native / Alaskan | 1 | 0.0% |
| White / Caucasian | 29,377 | 63.2% |
| Two or more Races | 3,968 | 8.5% |
| Some other Race | 905 | 1.9% |
| Total | 46,499 | 100.0% |
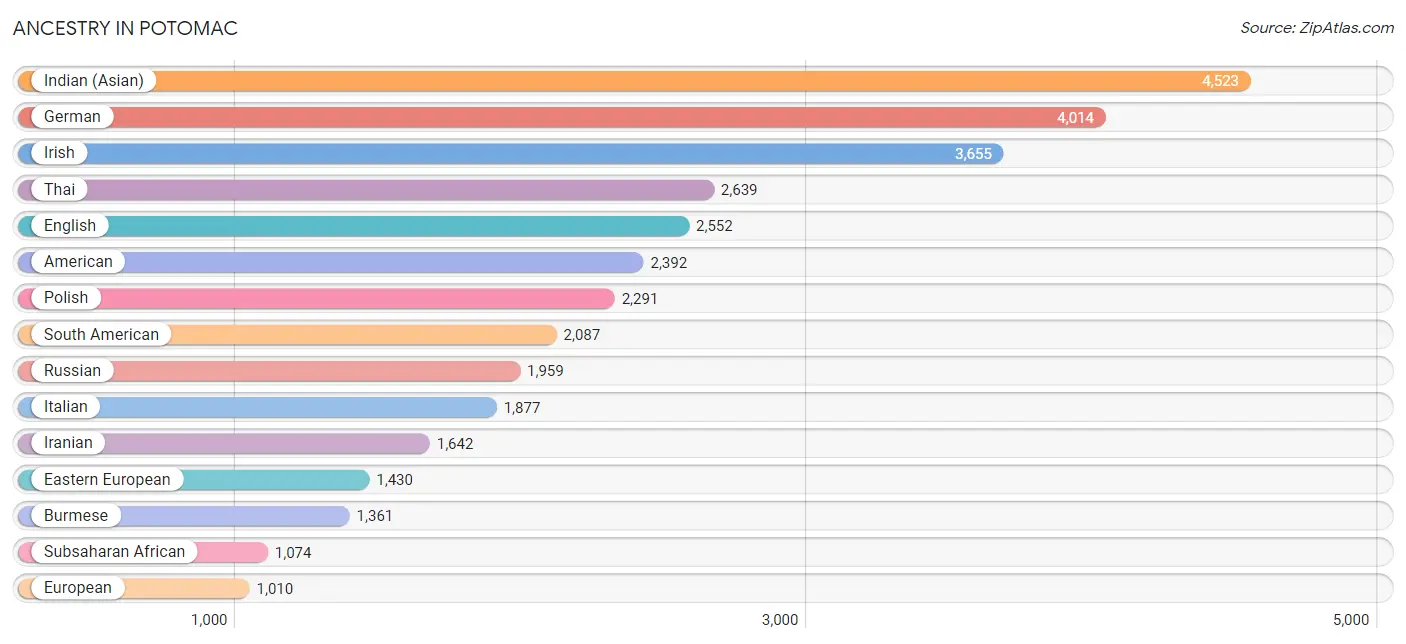
Ancestry in Potomac
The most populous ancestries reported in Potomac are Indian (Asian) (4,523 | 9.7%), German (4,014 | 8.6%), Irish (3,655 | 7.9%), Thai (2,639 | 5.7%), and English (2,552 | 5.5%), together accounting for 37.4% of all Potomac residents.
| Ancestry | # Population | % Population |
| African | 530 | 1.1% |
| Albanian | 12 | 0.0% |
| American | 2,392 | 5.1% |
| Arab | 938 | 2.0% |
| Argentinean | 636 | 1.4% |
| Armenian | 109 | 0.2% |
| Australian | 8 | 0.0% |
| Austrian | 325 | 0.7% |
| Barbadian | 15 | 0.0% |
| Basque | 5 | 0.0% |
| Belgian | 283 | 0.6% |
| Bhutanese | 231 | 0.5% |
| Bolivian | 87 | 0.2% |
| Brazilian | 142 | 0.3% |
| British | 318 | 0.7% |
| Bulgarian | 52 | 0.1% |
| Burmese | 1,361 | 2.9% |
| Cambodian | 23 | 0.1% |
| Canadian | 89 | 0.2% |
| Central American | 574 | 1.2% |
| Cherokee | 21 | 0.1% |
| Chilean | 112 | 0.2% |
| Choctaw | 16 | 0.0% |
| Colombian | 618 | 1.3% |
| Costa Rican | 31 | 0.1% |
| Croatian | 7 | 0.0% |
| Cuban | 170 | 0.4% |
| Czech | 147 | 0.3% |
| Czechoslovakian | 55 | 0.1% |
| Danish | 152 | 0.3% |
| Dominican | 22 | 0.1% |
| Dutch | 263 | 0.6% |
| Eastern European | 1,430 | 3.1% |
| Ecuadorian | 104 | 0.2% |
| Egyptian | 144 | 0.3% |
| English | 2,552 | 5.5% |
| Ethiopian | 53 | 0.1% |
| European | 1,010 | 2.2% |
| Filipino | 525 | 1.1% |
| Finnish | 105 | 0.2% |
| French | 963 | 2.1% |
| French Canadian | 50 | 0.1% |
| German | 4,014 | 8.6% |
| Ghanaian | 10 | 0.0% |
| Greek | 440 | 0.9% |
| Guatemalan | 28 | 0.1% |
| Guyanese | 46 | 0.1% |
| Haitian | 39 | 0.1% |
| Honduran | 105 | 0.2% |
| Hungarian | 378 | 0.8% |
| Indian (Asian) | 4,523 | 9.7% |
| Iranian | 1,642 | 3.5% |
| Iraqi | 58 | 0.1% |
| Irish | 3,655 | 7.9% |
| Israeli | 81 | 0.2% |
| Italian | 1,877 | 4.0% |
| Jamaican | 29 | 0.1% |
| Japanese | 55 | 0.1% |
| Kenyan | 64 | 0.1% |
| Korean | 299 | 0.6% |
| Laotian | 21 | 0.1% |
| Latvian | 83 | 0.2% |
| Lebanese | 138 | 0.3% |
| Liberian | 10 | 0.0% |
| Lithuanian | 163 | 0.4% |
| Mexican | 780 | 1.7% |
| Mexican American Indian | 29 | 0.1% |
| Mongolian | 16 | 0.0% |
| Moroccan | 279 | 0.6% |
| Native Hawaiian | 100 | 0.2% |
| Navajo | 4 | 0.0% |
| Nicaraguan | 105 | 0.2% |
| Nigerian | 162 | 0.4% |
| Northern European | 155 | 0.3% |
| Norwegian | 249 | 0.5% |
| Okinawan | 13 | 0.0% |
| Pakistani | 91 | 0.2% |
| Panamanian | 78 | 0.2% |
| Peruvian | 394 | 0.9% |
| Polish | 2,291 | 4.9% |
| Portuguese | 212 | 0.5% |
| Puerto Rican | 603 | 1.3% |
| Romanian | 242 | 0.5% |
| Russian | 1,959 | 4.2% |
| Salvadoran | 227 | 0.5% |
| Scandinavian | 35 | 0.1% |
| Scotch-Irish | 394 | 0.9% |
| Scottish | 456 | 1.0% |
| Seminole | 8 | 0.0% |
| Serbian | 65 | 0.1% |
| Sierra Leonean | 106 | 0.2% |
| Slavic | 10 | 0.0% |
| Slovak | 52 | 0.1% |
| Slovene | 68 | 0.2% |
| South African | 37 | 0.1% |
| South American | 2,087 | 4.5% |
| Spaniard | 163 | 0.4% |
| Spanish | 61 | 0.1% |
| Sri Lankan | 378 | 0.8% |
| Subsaharan African | 1,074 | 2.3% |
| Swedish | 195 | 0.4% |
| Swiss | 104 | 0.2% |
| Syrian | 25 | 0.1% |
| Taiwanese | 24 | 0.1% |
| Thai | 2,639 | 5.7% |
| Trinidadian and Tobagonian | 18 | 0.0% |
| Turkish | 63 | 0.1% |
| U.S. Virgin Islander | 11 | 0.0% |
| Ukrainian | 465 | 1.0% |
| Venezuelan | 136 | 0.3% |
| Vietnamese | 142 | 0.3% |
| Welsh | 149 | 0.3% |
| West Indian | 42 | 0.1% | View All 113 Rows |
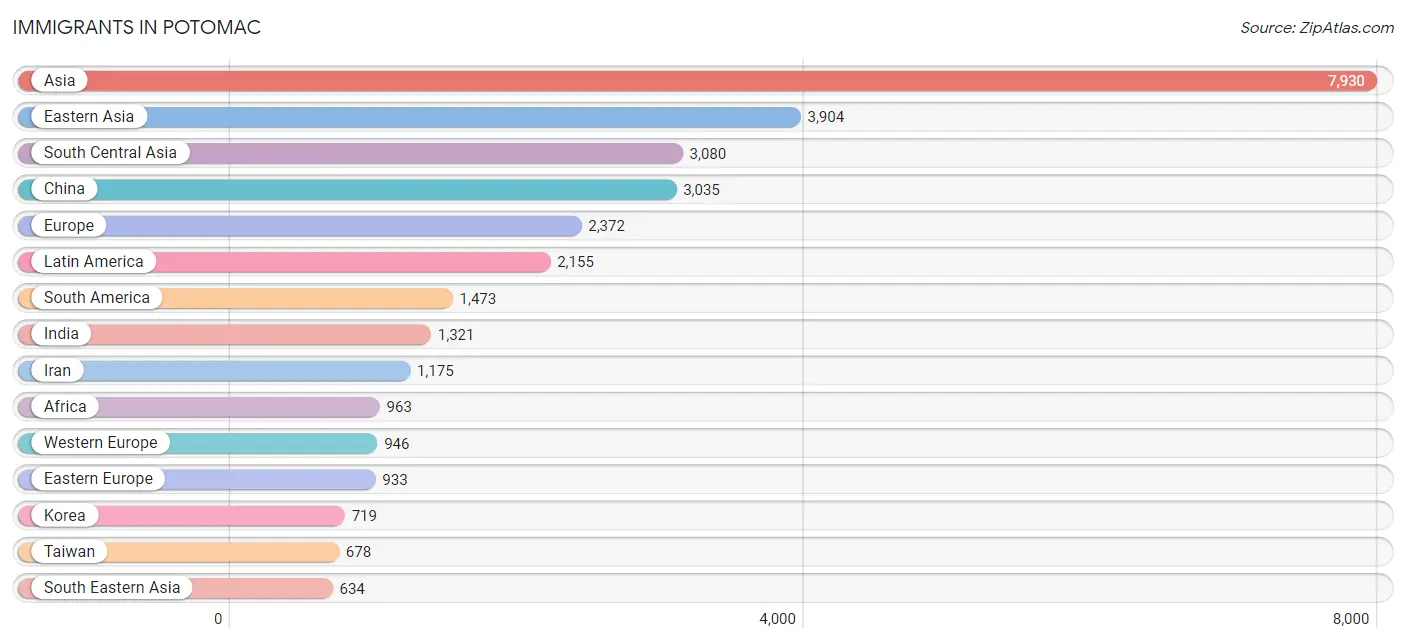
Immigrants in Potomac
The most numerous immigrant groups reported in Potomac came from Asia (7,930 | 17.1%), Eastern Asia (3,904 | 8.4%), South Central Asia (3,080 | 6.6%), China (3,035 | 6.5%), and Europe (2,372 | 5.1%), together accounting for 43.7% of all Potomac residents.
| Immigration Origin | # Population | % Population |
| Afghanistan | 14 | 0.0% |
| Africa | 963 | 2.1% |
| Argentina | 154 | 0.3% |
| Asia | 7,930 | 17.1% |
| Australia | 25 | 0.1% |
| Austria | 11 | 0.0% |
| Bangladesh | 174 | 0.4% |
| Barbados | 19 | 0.0% |
| Belarus | 22 | 0.1% |
| Belgium | 98 | 0.2% |
| Bolivia | 49 | 0.1% |
| Brazil | 284 | 0.6% |
| Bulgaria | 60 | 0.1% |
| Cambodia | 55 | 0.1% |
| Canada | 112 | 0.2% |
| Caribbean | 106 | 0.2% |
| Central America | 576 | 1.2% |
| Chile | 167 | 0.4% |
| China | 3,035 | 6.5% |
| Colombia | 420 | 0.9% |
| Costa Rica | 31 | 0.1% |
| Cuba | 39 | 0.1% |
| Czechoslovakia | 37 | 0.1% |
| Eastern Africa | 308 | 0.7% |
| Eastern Asia | 3,904 | 8.4% |
| Eastern Europe | 933 | 2.0% |
| Ecuador | 121 | 0.3% |
| Egypt | 168 | 0.4% |
| El Salvador | 161 | 0.4% |
| England | 108 | 0.2% |
| Eritrea | 127 | 0.3% |
| Ethiopia | 10 | 0.0% |
| Europe | 2,372 | 5.1% |
| France | 277 | 0.6% |
| Germany | 427 | 0.9% |
| Ghana | 10 | 0.0% |
| Greece | 27 | 0.1% |
| Guatemala | 28 | 0.1% |
| Guyana | 24 | 0.1% |
| Haiti | 9 | 0.0% |
| Honduras | 67 | 0.1% |
| Hong Kong | 125 | 0.3% |
| Hungary | 1 | 0.0% |
| India | 1,321 | 2.8% |
| Indonesia | 16 | 0.0% |
| Iran | 1,175 | 2.5% |
| Iraq | 46 | 0.1% |
| Ireland | 69 | 0.2% |
| Israel | 117 | 0.3% |
| Italy | 28 | 0.1% |
| Jamaica | 9 | 0.0% |
| Japan | 88 | 0.2% |
| Kenya | 68 | 0.2% |
| Korea | 719 | 1.5% |
| Latin America | 2,155 | 4.6% |
| Latvia | 2 | 0.0% |
| Lebanon | 34 | 0.1% |
| Liberia | 10 | 0.0% |
| Malaysia | 68 | 0.2% |
| Mexico | 219 | 0.5% |
| Middle Africa | 7 | 0.0% |
| Moldova | 29 | 0.1% |
| Morocco | 87 | 0.2% |
| Nepal | 31 | 0.1% |
| Netherlands | 33 | 0.1% |
| Nicaragua | 41 | 0.1% |
| Nigeria | 126 | 0.3% |
| Northern Africa | 317 | 0.7% |
| Northern Europe | 339 | 0.7% |
| Norway | 14 | 0.0% |
| Oceania | 50 | 0.1% |
| Pakistan | 276 | 0.6% |
| Panama | 29 | 0.1% |
| Peru | 199 | 0.4% |
| Philippines | 110 | 0.2% |
| Poland | 41 | 0.1% |
| Portugal | 28 | 0.1% |
| Romania | 122 | 0.3% |
| Russia | 322 | 0.7% |
| Scotland | 5 | 0.0% |
| Serbia | 18 | 0.0% |
| Sierra Leone | 83 | 0.2% |
| Singapore | 43 | 0.1% |
| South Africa | 37 | 0.1% |
| South America | 1,473 | 3.2% |
| South Central Asia | 3,080 | 6.6% |
| South Eastern Asia | 634 | 1.4% |
| Southern Europe | 154 | 0.3% |
| Spain | 71 | 0.2% |
| Sri Lanka | 64 | 0.1% |
| Switzerland | 100 | 0.2% |
| Syria | 7 | 0.0% |
| Taiwan | 678 | 1.5% |
| Thailand | 84 | 0.2% |
| Trinidad and Tobago | 30 | 0.1% |
| Turkey | 66 | 0.1% |
| Uganda | 8 | 0.0% |
| Ukraine | 200 | 0.4% |
| Uruguay | 16 | 0.0% |
| Uzbekistan | 25 | 0.1% |
| Venezuela | 39 | 0.1% |
| Vietnam | 258 | 0.5% |
| Western Africa | 294 | 0.6% |
| Western Asia | 303 | 0.6% |
| Western Europe | 946 | 2.0% |
| Zaire | 7 | 0.0% |
| Zimbabwe | 16 | 0.0% | View All 107 Rows |
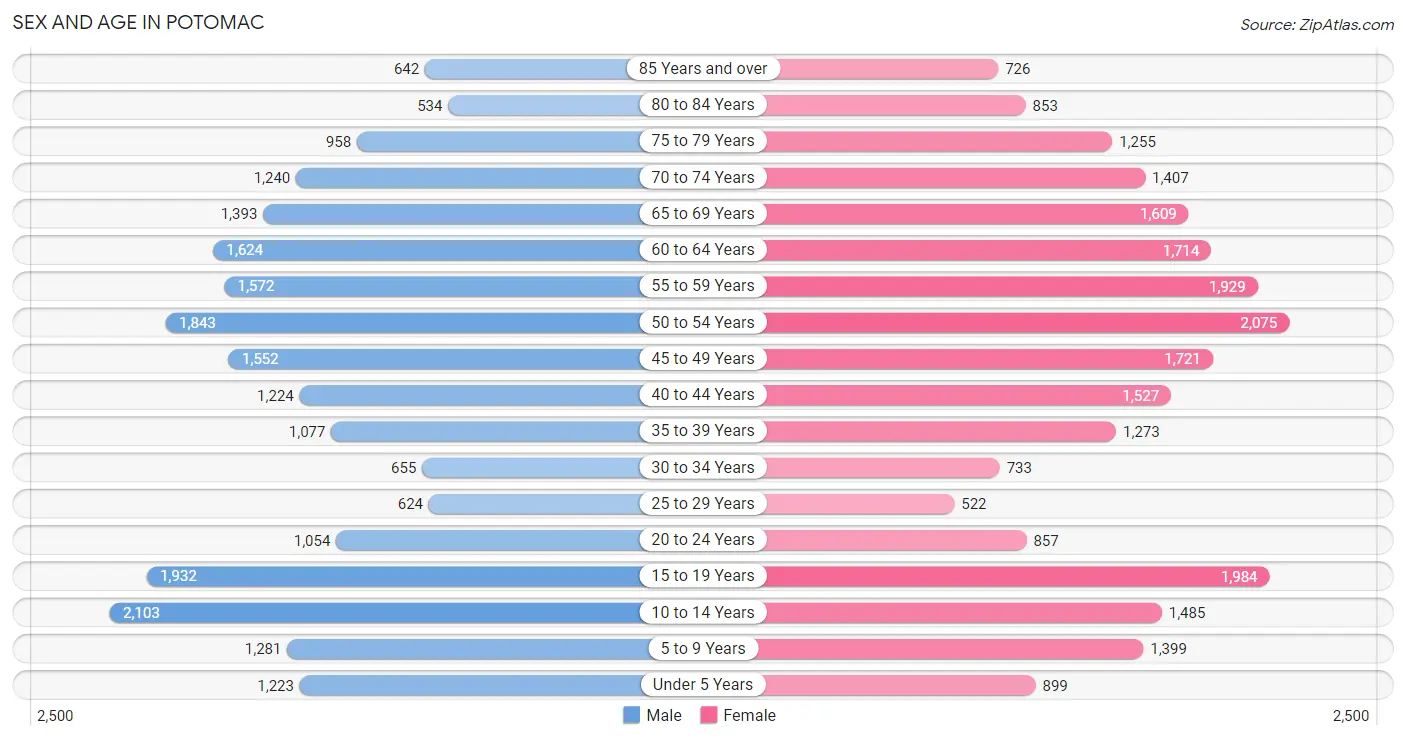
Sex and Age in Potomac
Sex and Age in Potomac
The most populous age groups in Potomac are 10 to 14 Years (2,103 | 9.3%) for men and 50 to 54 Years (2,075 | 8.7%) for women.
| Age Bracket | Male | Female |
| Under 5 Years | 1,223 (5.4%) | 899 (3.7%) |
| 5 to 9 Years | 1,281 (5.7%) | 1,399 (5.8%) |
| 10 to 14 Years | 2,103 (9.3%) | 1,485 (6.2%) |
| 15 to 19 Years | 1,932 (8.6%) | 1,984 (8.3%) |
| 20 to 24 Years | 1,054 (4.7%) | 857 (3.6%) |
| 25 to 29 Years | 624 (2.8%) | 522 (2.2%) |
| 30 to 34 Years | 655 (2.9%) | 733 (3.1%) |
| 35 to 39 Years | 1,077 (4.8%) | 1,273 (5.3%) |
| 40 to 44 Years | 1,224 (5.4%) | 1,527 (6.4%) |
| 45 to 49 Years | 1,552 (6.9%) | 1,721 (7.2%) |
| 50 to 54 Years | 1,843 (8.2%) | 2,075 (8.7%) |
| 55 to 59 Years | 1,572 (7.0%) | 1,929 (8.1%) |
| 60 to 64 Years | 1,624 (7.2%) | 1,714 (7.1%) |
| 65 to 69 Years | 1,393 (6.2%) | 1,609 (6.7%) |
| 70 to 74 Years | 1,240 (5.5%) | 1,407 (5.9%) |
| 75 to 79 Years | 958 (4.3%) | 1,255 (5.2%) |
| 80 to 84 Years | 534 (2.4%) | 853 (3.6%) |
| 85 Years and over | 642 (2.9%) | 726 (3.0%) |
| Total | 22,531 (100.0%) | 23,968 (100.0%) |
Families and Households in Potomac
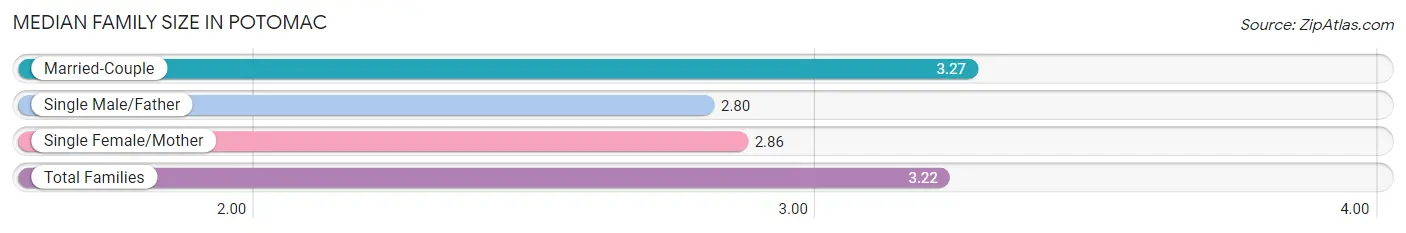
Median Family Size in Potomac
The median family size in Potomac is 3.22 persons per family, with married-couple families (11,387 | 88.3%) accounting for the largest median family size of 3.27 persons per family. On the other hand, single male/father families (333 | 2.6%) represent the smallest median family size with 2.80 persons per family.
| Family Type | # Families | Family Size |
| Married-Couple | 11,387 (88.3%) | 3.27 |
| Single Male/Father | 333 (2.6%) | 2.80 |
| Single Female/Mother | 1,178 (9.1%) | 2.86 |
| Total Families | 12,898 (100.0%) | 3.22 |
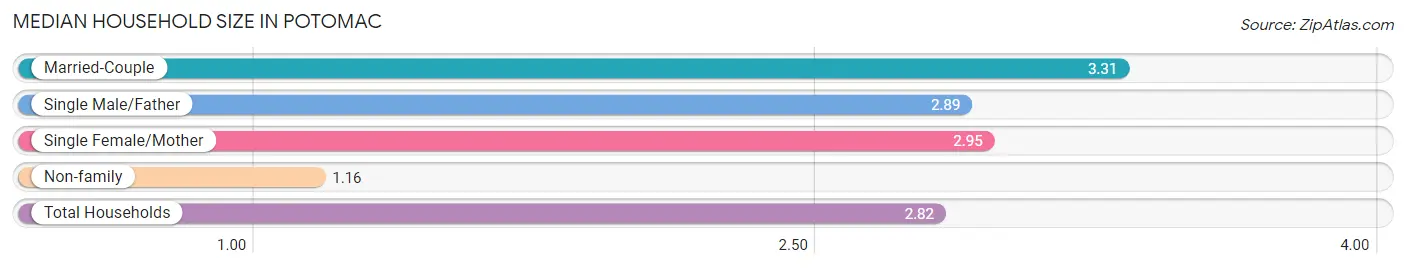
Median Household Size in Potomac
The median household size in Potomac is 2.82 persons per household, with married-couple households (11,387 | 69.7%) accounting for the largest median household size of 3.31 persons per household. non-family households (3,430 | 21.0%) represent the smallest median household size with 1.16 persons per household.
| Household Type | # Households | Household Size |
| Married-Couple | 11,387 (69.7%) | 3.31 |
| Single Male/Father | 333 (2.0%) | 2.89 |
| Single Female/Mother | 1,178 (7.2%) | 2.95 |
| Non-family | 3,430 (21.0%) | 1.16 |
| Total Households | 16,328 (100.0%) | 2.82 |
Household Size by Marriage Status in Potomac
Out of a total of 16,328 households in Potomac, 12,898 (79.0%) are family households, while 3,430 (21.0%) are nonfamily households. The most numerous type of family households are 2-person households, comprising 5,400, and the most common type of nonfamily households are 1-person households, comprising 3,089.
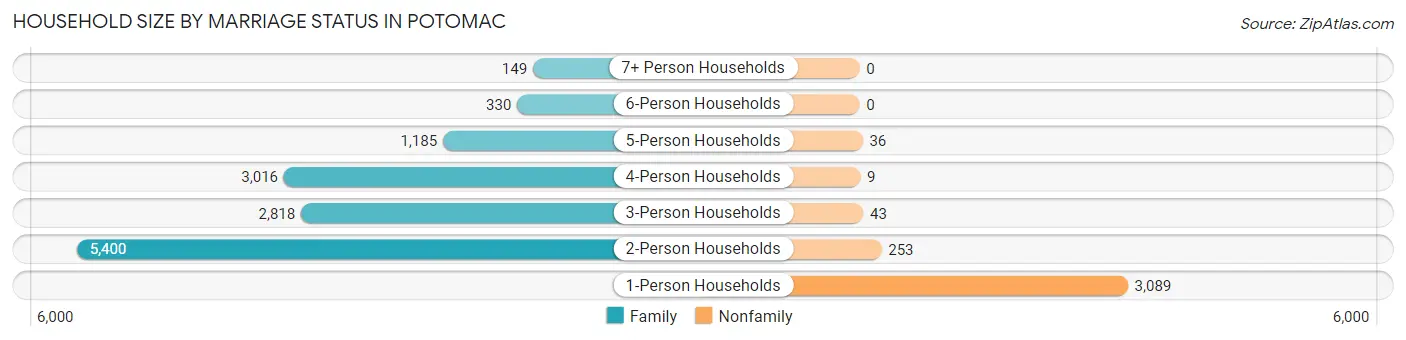
| Household Size | Family Households | Nonfamily Households |
| 1-Person Households | - | 3,089 (18.9%) |
| 2-Person Households | 5,400 (33.1%) | 253 (1.5%) |
| 3-Person Households | 2,818 (17.3%) | 43 (0.3%) |
| 4-Person Households | 3,016 (18.5%) | 9 (0.1%) |
| 5-Person Households | 1,185 (7.3%) | 36 (0.2%) |
| 6-Person Households | 330 (2.0%) | 0 (0.0%) |
| 7+ Person Households | 149 (0.9%) | 0 (0.0%) |
| Total | 12,898 (79.0%) | 3,430 (21.0%) |
Female Fertility in Potomac
Fertility by Age in Potomac
Average fertility rate in Potomac is 35.0 births per 1,000 women. Women in the age bracket of 20 to 34 years have the highest fertility rate with 58.0 births per 1,000 women. Women in the age bracket of 35 to 50 years acount for 61.2% of all women with births.
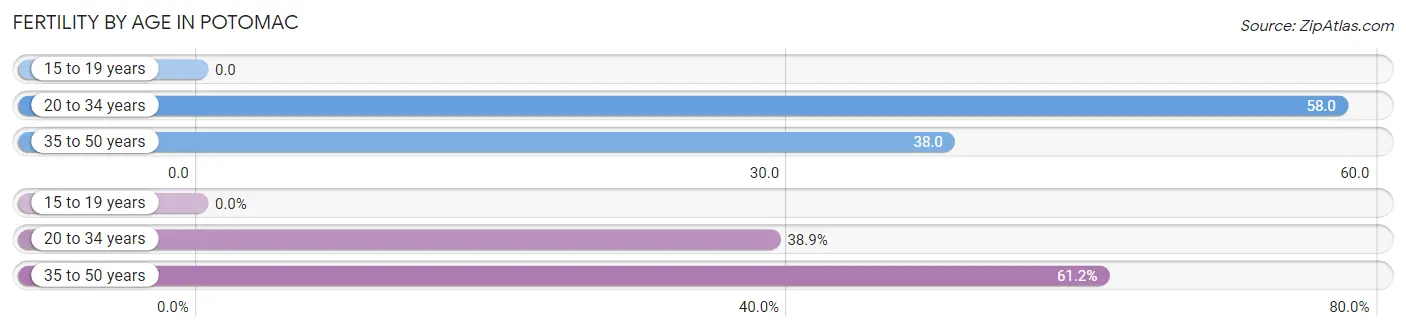
| Age Bracket | Women with Births | Births / 1,000 Women |
| 15 to 19 years | 0 (0.0%) | 0.0 |
| 20 to 34 years | 122 (38.9%) | 58.0 |
| 35 to 50 years | 192 (61.2%) | 38.0 |
| Total | 314 (100.0%) | 35.0 |
Fertility by Age by Marriage Status in Potomac
97.1% of women with births (314) in Potomac are married. The highest percentage of unmarried women with births falls into 20 to 34 years age bracket with 3.3% of them unmarried at the time of birth, while the lowest percentage of unmarried women with births belong to 35 to 50 years age bracket with 2.6% of them unmarried.
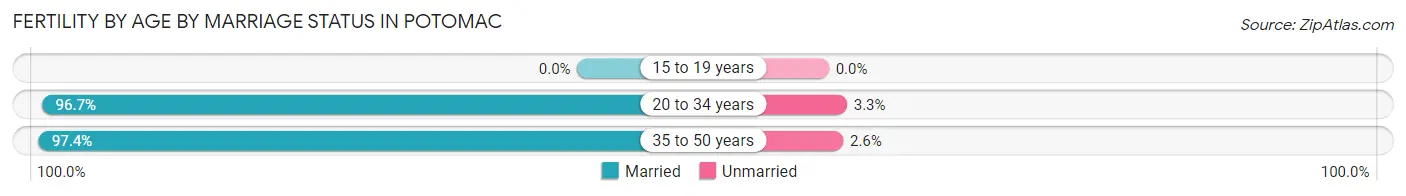
| Age Bracket | Married | Unmarried |
| 15 to 19 years | 0 (0.0%) | 0 (0.0%) |
| 20 to 34 years | 118 (96.7%) | 4 (3.3%) |
| 35 to 50 years | 187 (97.4%) | 5 (2.6%) |
| Total | 305 (97.1%) | 9 (2.9%) |
Fertility by Education in Potomac
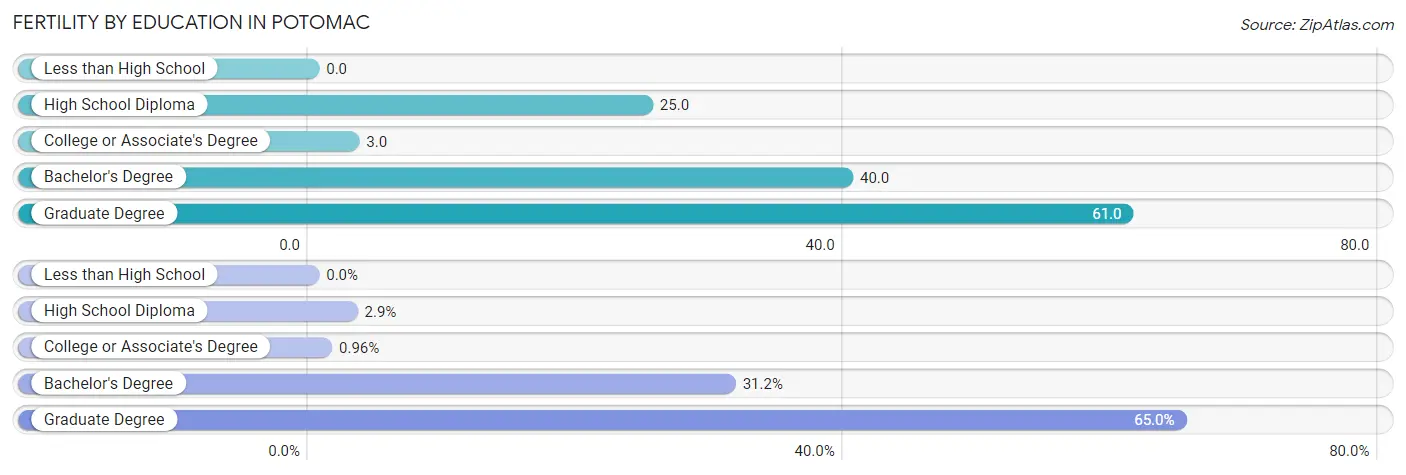
| Educational Attainment | Women with Births | Births / 1,000 Women |
| Less than High School | 0 (0.0%) | 0.0 |
| High School Diploma | 9 (2.9%) | 25.0 |
| College or Associate's Degree | 3 (1.0%) | 3.0 |
| Bachelor's Degree | 98 (31.2%) | 40.0 |
| Graduate Degree | 204 (65.0%) | 61.0 |
| Total | 314 (100.0%) | 35.0 |
Fertility by Education by Marriage Status in Potomac
2.9% of women with births in Potomac are unmarried. Women with the educational attainment of college or associate's degree are most likely to be married with 100.0% of them married at childbirth, while women with the educational attainment of high school diploma are least likely to be married with 100.0% of them unmarried at childbirth.
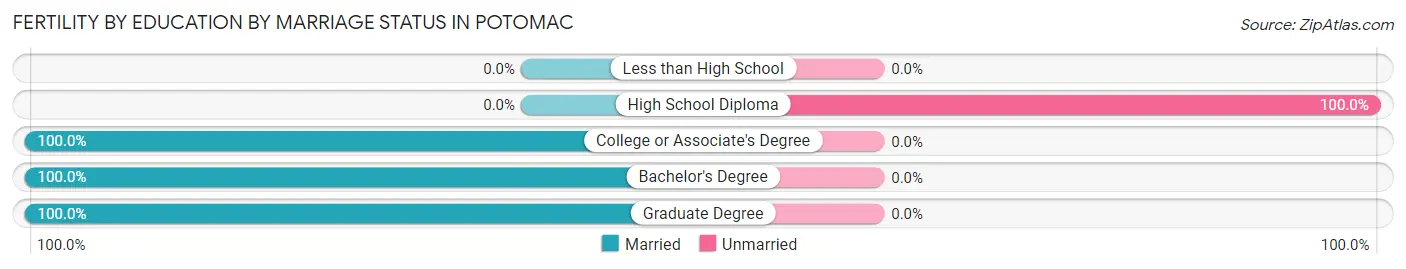
| Educational Attainment | Married | Unmarried |
| Less than High School | 0 (0.0%) | 0 (0.0%) |
| High School Diploma | 0 (0.0%) | 9 (100.0%) |
| College or Associate's Degree | 3 (100.0%) | 0 (0.0%) |
| Bachelor's Degree | 98 (100.0%) | 0 (0.0%) |
| Graduate Degree | 204 (100.0%) | 0 (0.0%) |
| Total | 305 (97.1%) | 9 (2.9%) |
Employment Characteristics in Potomac
Employment by Class of Employer in Potomac
Among the 21,902 employed individuals in Potomac, private company employees (10,252 | 46.8%), federal government employees (3,736 | 17.1%), and not-for-profit organizations (2,746 | 12.5%) make up the most common classes of employment.
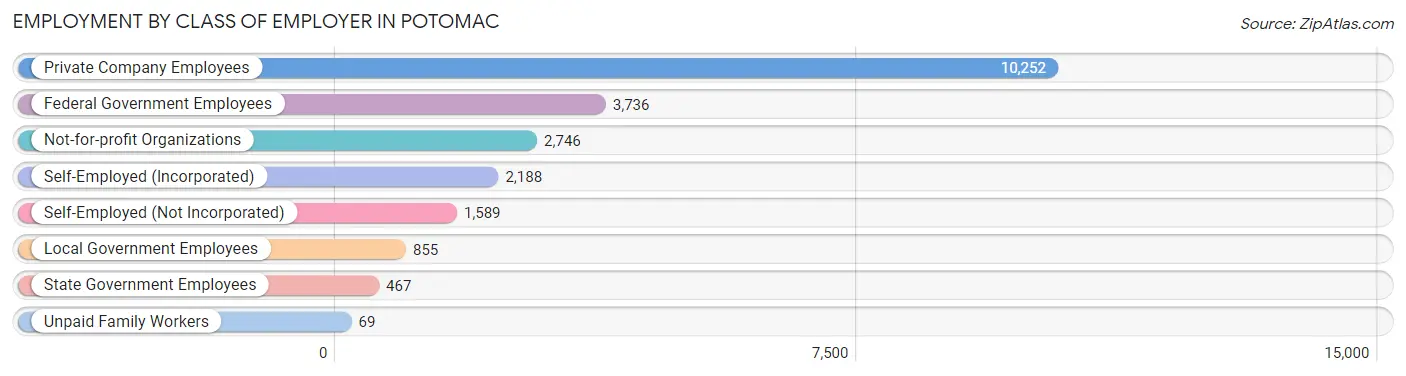
| Employer Class | # Employees | % Employees |
| Private Company Employees | 10,252 | 46.8% |
| Self-Employed (Incorporated) | 2,188 | 10.0% |
| Self-Employed (Not Incorporated) | 1,589 | 7.3% |
| Not-for-profit Organizations | 2,746 | 12.5% |
| Local Government Employees | 855 | 3.9% |
| State Government Employees | 467 | 2.1% |
| Federal Government Employees | 3,736 | 17.1% |
| Unpaid Family Workers | 69 | 0.3% |
| Total | 21,902 | 100.0% |
Employment Status by Age in Potomac
According to the labor force statistics for Potomac, out of the total population over 16 years of age (37,278), 62.1% or 23,150 individuals are in the labor force, with 4.2% or 972 of them unemployed. The age group with the highest labor force participation rate is 35 to 44 years, with 91.3% or 4,657 individuals in the labor force. Within the labor force, the 20 to 24 years age range has the highest percentage of unemployed individuals, with 12.7% or 138 of them being unemployed.
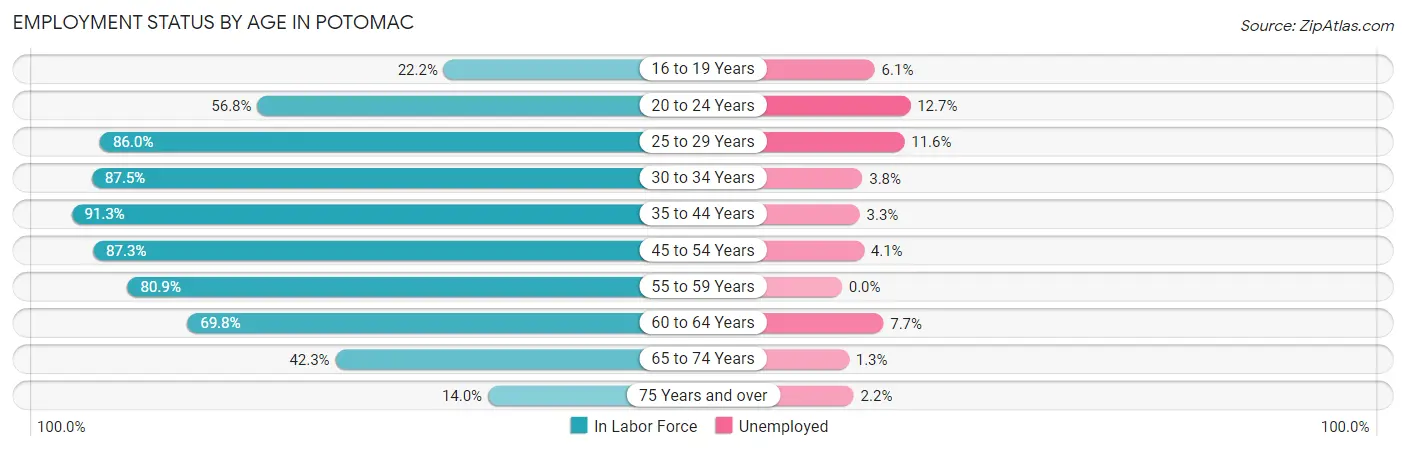
| Age Bracket | In Labor Force | Unemployed |
| 16 to 19 Years | 685 (22.2%) | 42 (6.1%) |
| 20 to 24 Years | 1,085 (56.8%) | 138 (12.7%) |
| 25 to 29 Years | 986 (86.0%) | 114 (11.6%) |
| 30 to 34 Years | 1,214 (87.5%) | 46 (3.8%) |
| 35 to 44 Years | 4,657 (91.3%) | 154 (3.3%) |
| 45 to 54 Years | 6,278 (87.3%) | 257 (4.1%) |
| 55 to 59 Years | 2,832 (80.9%) | 0 (0.0%) |
| 60 to 64 Years | 2,330 (69.8%) | 179 (7.7%) |
| 65 to 74 Years | 2,390 (42.3%) | 31 (1.3%) |
| 75 Years and over | 696 (14.0%) | 15 (2.2%) |
| Total | 23,150 (62.1%) | 972 (4.2%) |
Employment Status by Educational Attainment in Potomac
According to labor force statistics for Potomac, 84.5% of individuals (18,307) out of the total population between 25 and 64 years of age (21,665) are in the labor force, with 4.1% or 751 of them being unemployed. The group with the highest labor force participation rate are those with the educational attainment of bachelor's degree or higher, with 86.5% or 16,404 individuals in the labor force. Within the labor force, individuals with college / associate degree education have the highest percentage of unemployment, with 10.9% or 131 of them being unemployed.
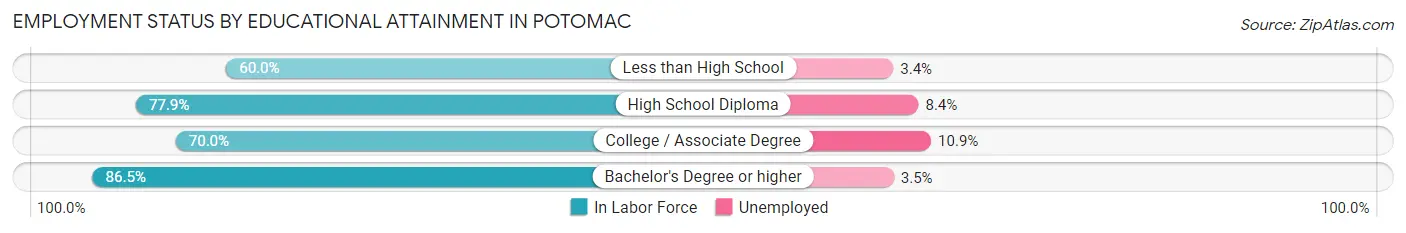
| Educational Attainment | In Labor Force | Unemployed |
| Less than High School | 234 (60.0%) | 13 (3.4%) |
| High School Diploma | 462 (77.9%) | 50 (8.4%) |
| College / Associate Degree | 1,203 (70.0%) | 187 (10.9%) |
| Bachelor's Degree or higher | 16,404 (86.5%) | 664 (3.5%) |
| Total | 18,307 (84.5%) | 888 (4.1%) |
Employment Occupations by Sex in Potomac
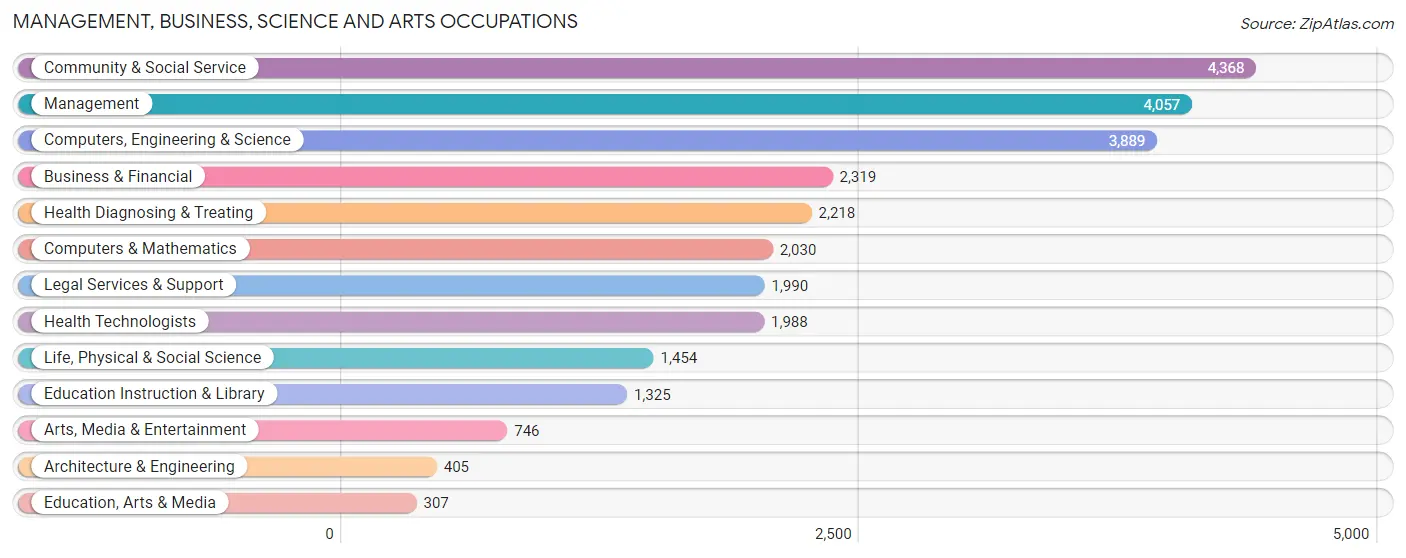
Management, Business, Science and Arts Occupations
The most common Management, Business, Science and Arts occupations in Potomac are Community & Social Service (4,368 | 19.8%), Management (4,057 | 18.3%), Computers, Engineering & Science (3,889 | 17.6%), Business & Financial (2,319 | 10.5%), and Health Diagnosing & Treating (2,218 | 10.0%).
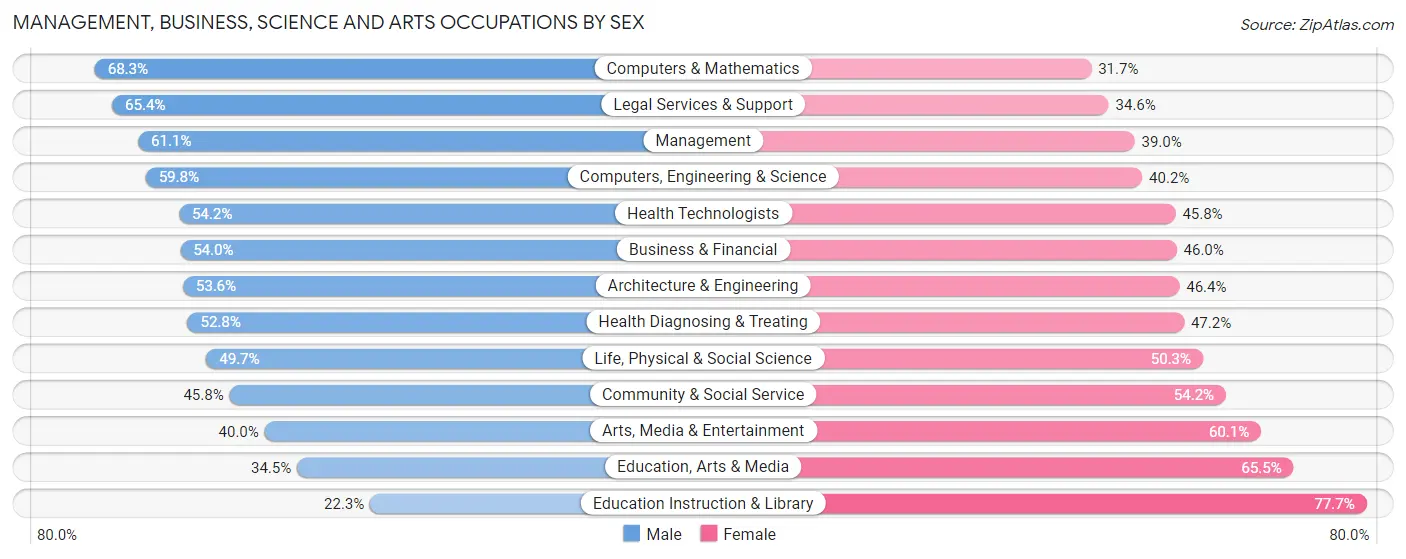
Management, Business, Science and Arts Occupations by Sex
Within the Management, Business, Science and Arts occupations in Potomac, the most male-oriented occupations are Computers & Mathematics (68.3%), Legal Services & Support (65.4%), and Management (61.1%), while the most female-oriented occupations are Education Instruction & Library (77.7%), Education, Arts & Media (65.5%), and Arts, Media & Entertainment (60.1%).
| Occupation | Male | Female |
| Management | 2,477 (61.1%) | 1,580 (39.0%) |
| Business & Financial | 1,253 (54.0%) | 1,066 (46.0%) |
| Computers, Engineering & Science | 2,325 (59.8%) | 1,564 (40.2%) |
| Computers & Mathematics | 1,386 (68.3%) | 644 (31.7%) |
| Architecture & Engineering | 217 (53.6%) | 188 (46.4%) |
| Life, Physical & Social Science | 722 (49.7%) | 732 (50.3%) |
| Community & Social Service | 2,001 (45.8%) | 2,367 (54.2%) |
| Education, Arts & Media | 106 (34.5%) | 201 (65.5%) |
| Legal Services & Support | 1,301 (65.4%) | 689 (34.6%) |
| Education Instruction & Library | 296 (22.3%) | 1,029 (77.7%) |
| Arts, Media & Entertainment | 298 (40.0%) | 448 (60.1%) |
| Health Diagnosing & Treating | 1,171 (52.8%) | 1,047 (47.2%) |
| Health Technologists | 1,078 (54.2%) | 910 (45.8%) |
| Total (Category) | 9,227 (54.8%) | 7,624 (45.2%) |
| Total (Overall) | 11,620 (52.5%) | 10,502 (47.5%) |
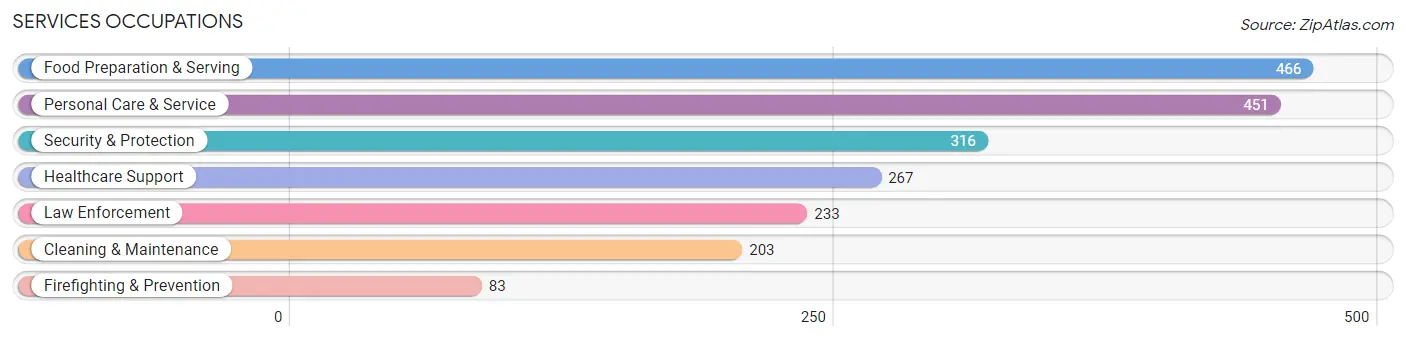
Services Occupations
The most common Services occupations in Potomac are Food Preparation & Serving (466 | 2.1%), Personal Care & Service (451 | 2.0%), Security & Protection (316 | 1.4%), Healthcare Support (267 | 1.2%), and Law Enforcement (233 | 1.1%).
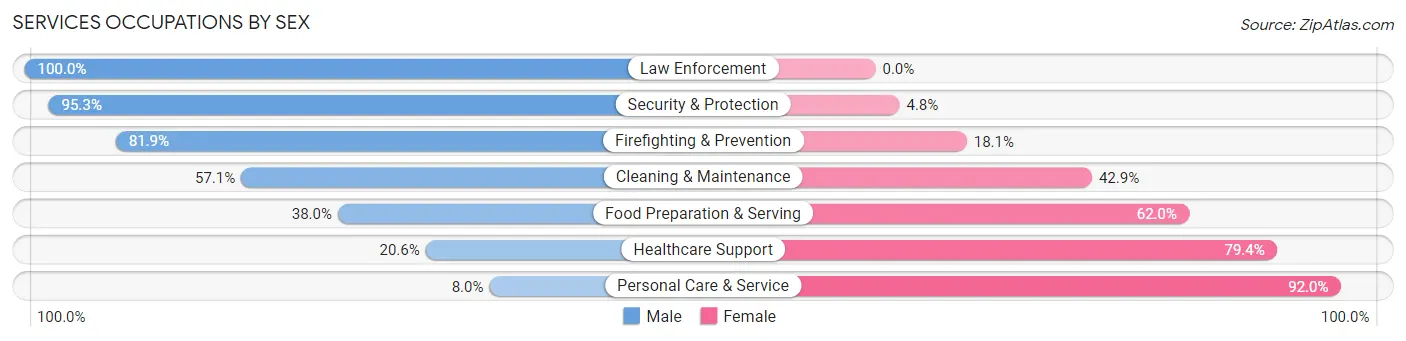
Services Occupations by Sex
Within the Services occupations in Potomac, the most male-oriented occupations are Law Enforcement (100.0%), Security & Protection (95.3%), and Firefighting & Prevention (81.9%), while the most female-oriented occupations are Personal Care & Service (92.0%), Healthcare Support (79.4%), and Food Preparation & Serving (62.0%).
| Occupation | Male | Female |
| Healthcare Support | 55 (20.6%) | 212 (79.4%) |
| Security & Protection | 301 (95.3%) | 15 (4.8%) |
| Firefighting & Prevention | 68 (81.9%) | 15 (18.1%) |
| Law Enforcement | 233 (100.0%) | 0 (0.0%) |
| Food Preparation & Serving | 177 (38.0%) | 289 (62.0%) |
| Cleaning & Maintenance | 116 (57.1%) | 87 (42.9%) |
| Personal Care & Service | 36 (8.0%) | 415 (92.0%) |
| Total (Category) | 685 (40.2%) | 1,018 (59.8%) |
| Total (Overall) | 11,620 (52.5%) | 10,502 (47.5%) |
Sales and Office Occupations
The most common Sales and Office occupations in Potomac are Sales & Related (1,874 | 8.5%), and Office & Administration (1,157 | 5.2%).
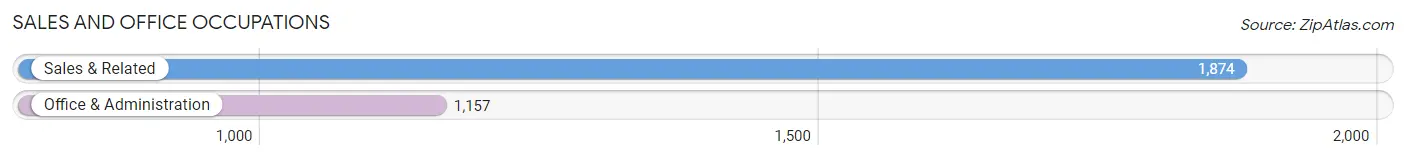
Sales and Office Occupations by Sex
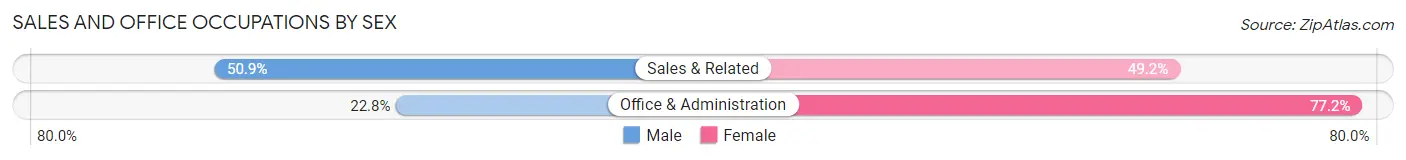
| Occupation | Male | Female |
| Sales & Related | 953 (50.8%) | 921 (49.1%) |
| Office & Administration | 264 (22.8%) | 893 (77.2%) |
| Total (Category) | 1,217 (40.2%) | 1,814 (59.9%) |
| Total (Overall) | 11,620 (52.5%) | 10,502 (47.5%) |
Natural Resources, Construction and Maintenance Occupations
The most common Natural Resources, Construction and Maintenance occupations in Potomac are Construction & Extraction (155 | 0.7%), Installation, Maintenance & Repair (118 | 0.5%), and Farming, Fishing & Forestry (5 | 0.0%).
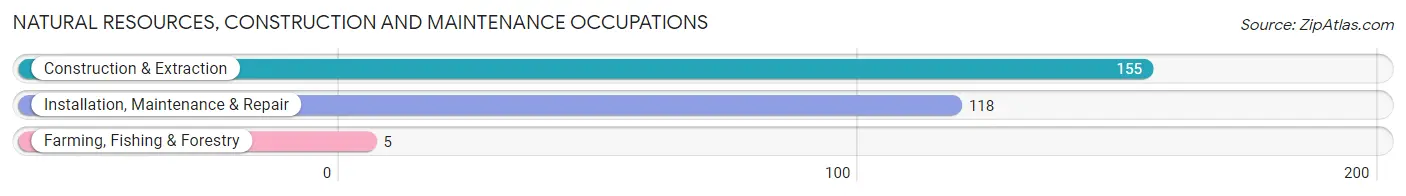
Natural Resources, Construction and Maintenance Occupations by Sex
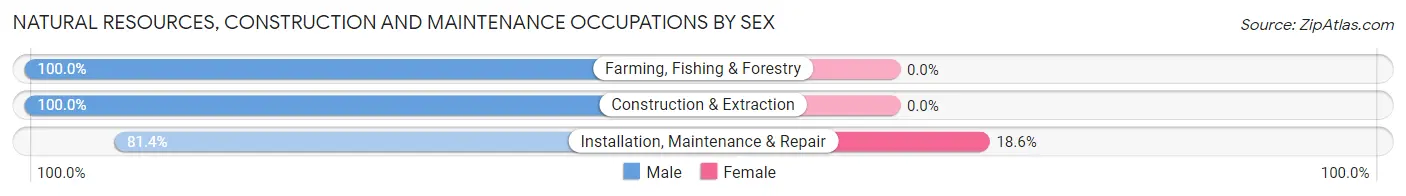
| Occupation | Male | Female |
| Farming, Fishing & Forestry | 5 (100.0%) | 0 (0.0%) |
| Construction & Extraction | 155 (100.0%) | 0 (0.0%) |
| Installation, Maintenance & Repair | 96 (81.4%) | 22 (18.6%) |
| Total (Category) | 256 (92.1%) | 22 (7.9%) |
| Total (Overall) | 11,620 (52.5%) | 10,502 (47.5%) |
Production, Transportation and Moving Occupations
The most common Production, Transportation and Moving occupations in Potomac are Transportation (129 | 0.6%), Production (85 | 0.4%), and Material Moving (45 | 0.2%).
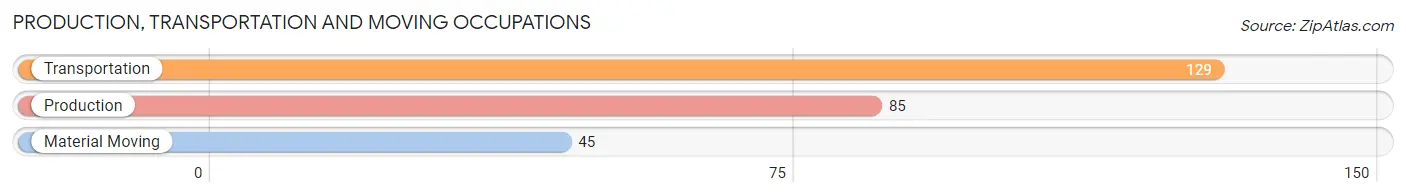
Production, Transportation and Moving Occupations by Sex
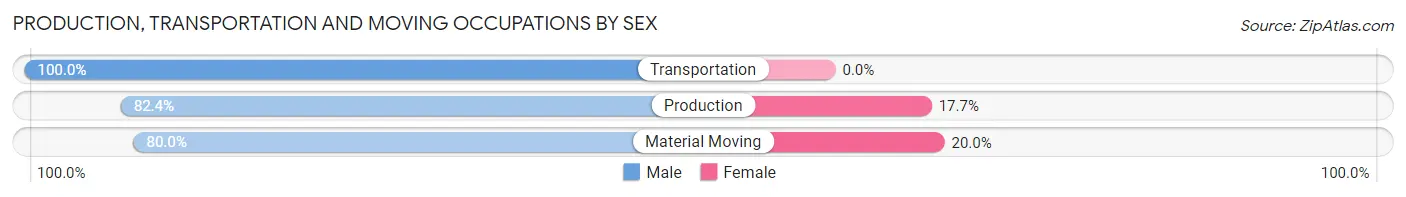
| Occupation | Male | Female |
| Production | 70 (82.4%) | 15 (17.6%) |
| Transportation | 129 (100.0%) | 0 (0.0%) |
| Material Moving | 36 (80.0%) | 9 (20.0%) |
| Total (Category) | 235 (90.7%) | 24 (9.3%) |
| Total (Overall) | 11,620 (52.5%) | 10,502 (47.5%) |
Employment Industries by Sex in Potomac
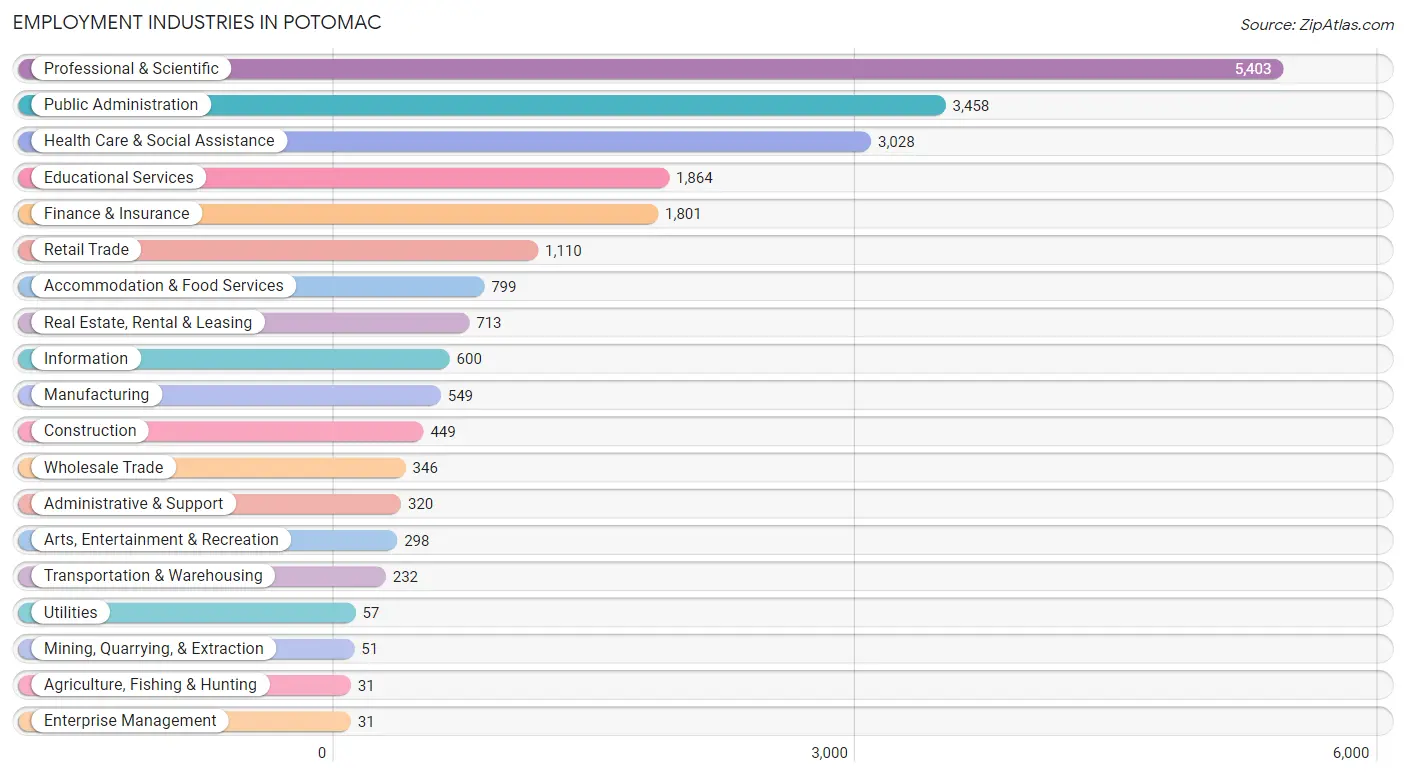
Employment Industries in Potomac
The major employment industries in Potomac include Professional & Scientific (5,403 | 24.4%), Public Administration (3,458 | 15.6%), Health Care & Social Assistance (3,028 | 13.7%), Educational Services (1,864 | 8.4%), and Finance & Insurance (1,801 | 8.1%).
Employment Industries by Sex in Potomac
The Potomac industries that see more men than women are Mining, Quarrying, & Extraction (100.0%), Transportation & Warehousing (92.7%), and Construction (90.0%), whereas the industries that tend to have a higher number of women are Educational Services (70.1%), Accommodation & Food Services (60.5%), and Arts, Entertainment & Recreation (60.1%).
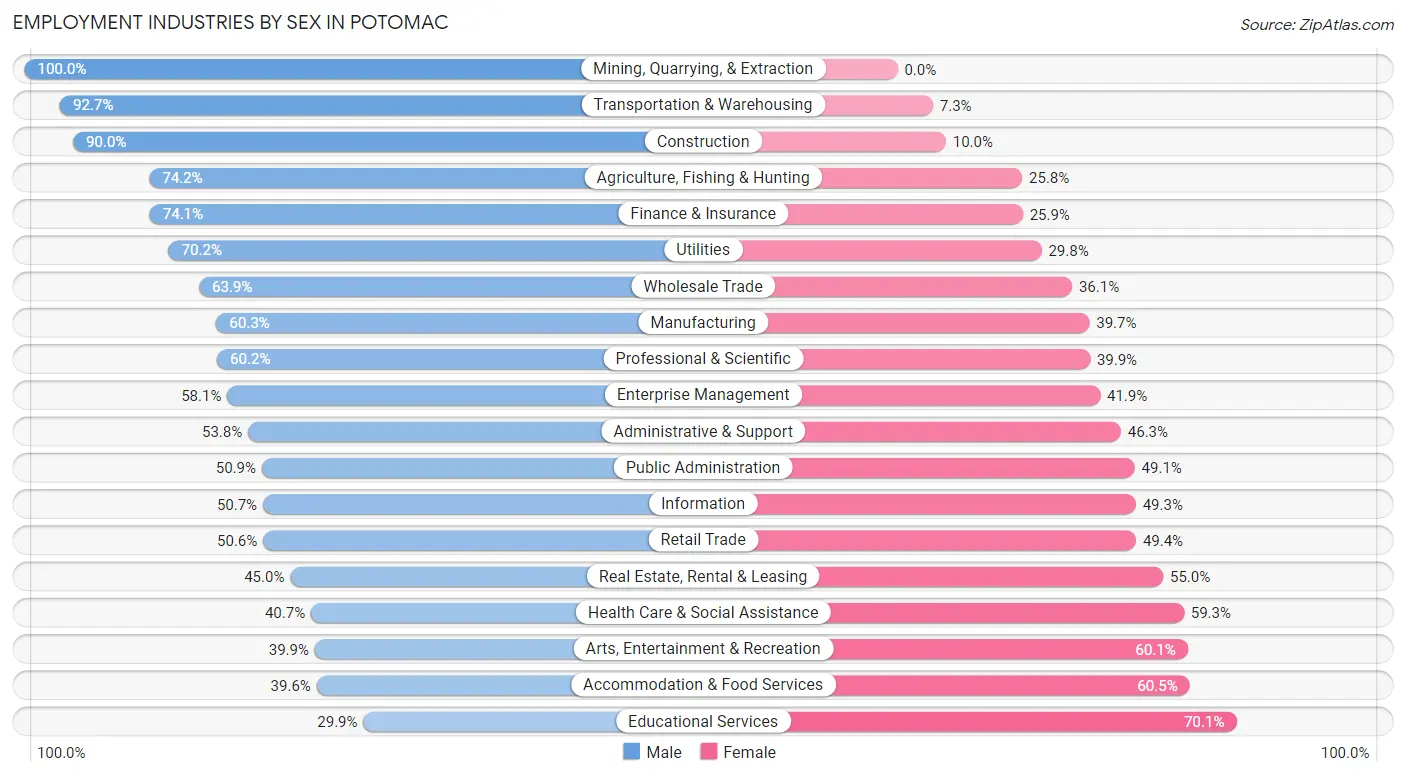
| Industry | Male | Female |
| Agriculture, Fishing & Hunting | 23 (74.2%) | 8 (25.8%) |
| Mining, Quarrying, & Extraction | 51 (100.0%) | 0 (0.0%) |
| Construction | 404 (90.0%) | 45 (10.0%) |
| Manufacturing | 331 (60.3%) | 218 (39.7%) |
| Wholesale Trade | 221 (63.9%) | 125 (36.1%) |
| Retail Trade | 562 (50.6%) | 548 (49.4%) |
| Transportation & Warehousing | 215 (92.7%) | 17 (7.3%) |
| Utilities | 40 (70.2%) | 17 (29.8%) |
| Information | 304 (50.7%) | 296 (49.3%) |
| Finance & Insurance | 1,334 (74.1%) | 467 (25.9%) |
| Real Estate, Rental & Leasing | 321 (45.0%) | 392 (55.0%) |
| Professional & Scientific | 3,250 (60.2%) | 2,153 (39.9%) |
| Enterprise Management | 18 (58.1%) | 13 (41.9%) |
| Administrative & Support | 172 (53.7%) | 148 (46.3%) |
| Educational Services | 557 (29.9%) | 1,307 (70.1%) |
| Health Care & Social Assistance | 1,233 (40.7%) | 1,795 (59.3%) |
| Arts, Entertainment & Recreation | 119 (39.9%) | 179 (60.1%) |
| Accommodation & Food Services | 316 (39.6%) | 483 (60.5%) |
| Public Administration | 1,760 (50.9%) | 1,698 (49.1%) |
| Total | 11,620 (52.5%) | 10,502 (47.5%) |
Education in Potomac
School Enrollment in Potomac
The most common levels of schooling among the 12,492 students in Potomac are high school (3,698 | 29.6%), middle school (2,831 | 22.7%), and elementary school (2,279 | 18.2%).
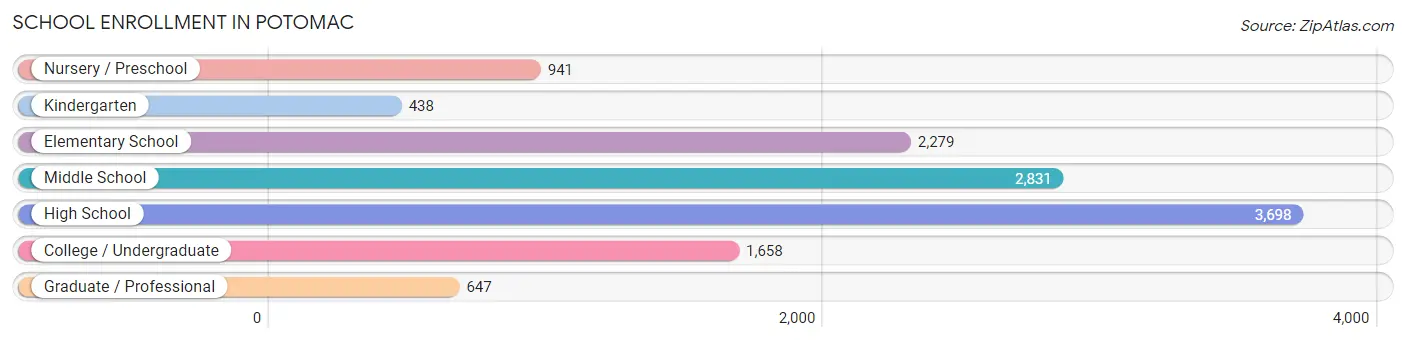
| School Level | # Students | % Students |
| Nursery / Preschool | 941 | 7.5% |
| Kindergarten | 438 | 3.5% |
| Elementary School | 2,279 | 18.2% |
| Middle School | 2,831 | 22.7% |
| High School | 3,698 | 29.6% |
| College / Undergraduate | 1,658 | 13.3% |
| Graduate / Professional | 647 | 5.2% |
| Total | 12,492 | 100.0% |
School Enrollment by Age by Funding Source in Potomac
Out of a total of 12,492 students who are enrolled in schools in Potomac, 3,673 (29.4%) attend a private institution, while the remaining 8,819 (70.6%) are enrolled in public schools. The age group of 3 to 4 year olds has the highest likelihood of being enrolled in private schools, with 512 (74.0% in the age bracket) enrolled. Conversely, the age group of 10 to 14 year olds has the lowest likelihood of being enrolled in a private school, with 2,977 (85.1% in the age bracket) attending a public institution.
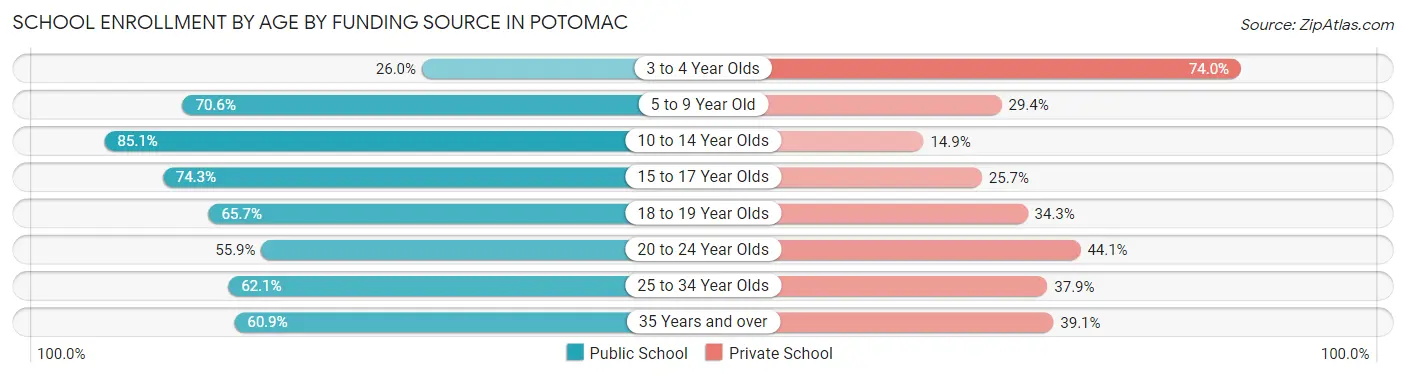
| Age Bracket | Public School | Private School |
| 3 to 4 Year Olds | 180 (26.0%) | 512 (74.0%) |
| 5 to 9 Year Old | 1,858 (70.6%) | 774 (29.4%) |
| 10 to 14 Year Olds | 2,977 (85.1%) | 520 (14.9%) |
| 15 to 17 Year Olds | 1,968 (74.3%) | 682 (25.7%) |
| 18 to 19 Year Olds | 712 (65.7%) | 371 (34.3%) |
| 20 to 24 Year Olds | 649 (55.9%) | 512 (44.1%) |
| 25 to 34 Year Olds | 193 (62.1%) | 118 (37.9%) |
| 35 Years and over | 284 (60.9%) | 182 (39.1%) |
| Total | 8,819 (70.6%) | 3,673 (29.4%) |
Educational Attainment by Field of Study in Potomac
Business (5,022 | 16.9%), social sciences (4,851 | 16.3%), engineering (2,849 | 9.6%), bio, nature & agricultural (2,673 | 9.0%), and science & technology (1,889 | 6.4%) are the most common fields of study among 29,725 individuals in Potomac who have obtained a bachelor's degree or higher.
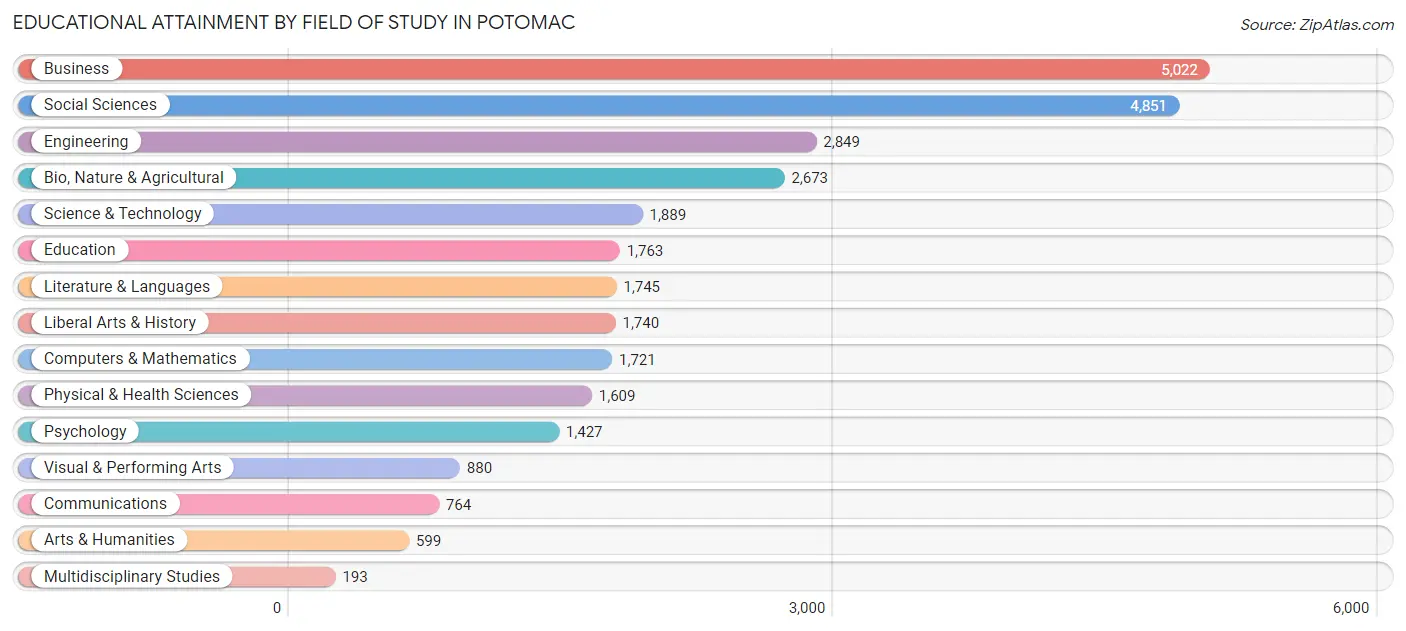
| Field of Study | # Graduates | % Graduates |
| Computers & Mathematics | 1,721 | 5.8% |
| Bio, Nature & Agricultural | 2,673 | 9.0% |
| Physical & Health Sciences | 1,609 | 5.4% |
| Psychology | 1,427 | 4.8% |
| Social Sciences | 4,851 | 16.3% |
| Engineering | 2,849 | 9.6% |
| Multidisciplinary Studies | 193 | 0.6% |
| Science & Technology | 1,889 | 6.4% |
| Business | 5,022 | 16.9% |
| Education | 1,763 | 5.9% |
| Literature & Languages | 1,745 | 5.9% |
| Liberal Arts & History | 1,740 | 5.9% |
| Visual & Performing Arts | 880 | 3.0% |
| Communications | 764 | 2.6% |
| Arts & Humanities | 599 | 2.0% |
| Total | 29,725 | 100.0% |
Transportation & Commute in Potomac
Vehicle Availability by Sex in Potomac
The most prevalent vehicle ownership categories in Potomac are males with 2 vehicles (5,975, accounting for 51.7%) and females with 2 vehicles (4,789, making up 57.9%).
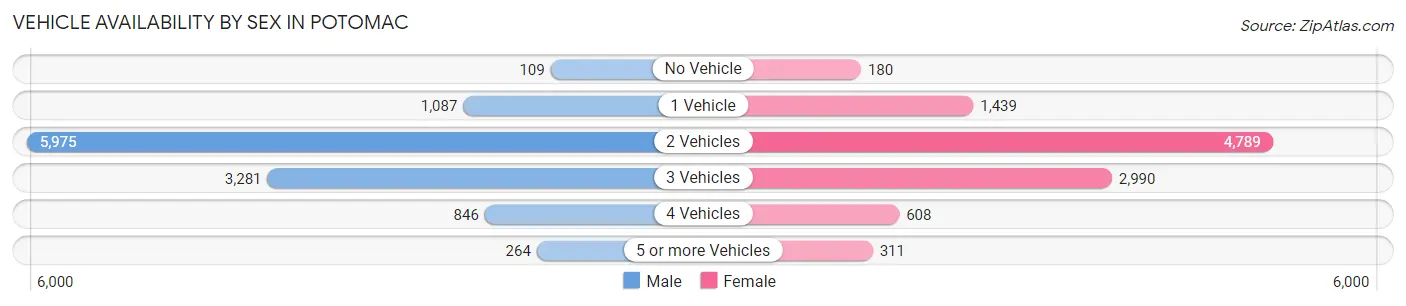
| Vehicles Available | Male | Female |
| No Vehicle | 109 (0.9%) | 180 (1.7%) |
| 1 Vehicle | 1,087 (9.4%) | 1,439 (14.0%) |
| 2 Vehicles | 5,975 (51.7%) | 4,789 (46.4%) |
| 3 Vehicles | 3,281 (28.4%) | 2,990 (29.0%) |
| 4 Vehicles | 846 (7.3%) | 608 (5.9%) |
| 5 or more Vehicles | 264 (2.3%) | 311 (3.0%) |
| Total | 11,562 (100.0%) | 10,317 (100.0%) |
Commute Time in Potomac
The most frequently occuring commute durations in Potomac are 30 to 34 minutes (2,378 commuters, 15.0%), 20 to 24 minutes (2,332 commuters, 14.7%), and 45 to 59 minutes (2,300 commuters, 14.5%).
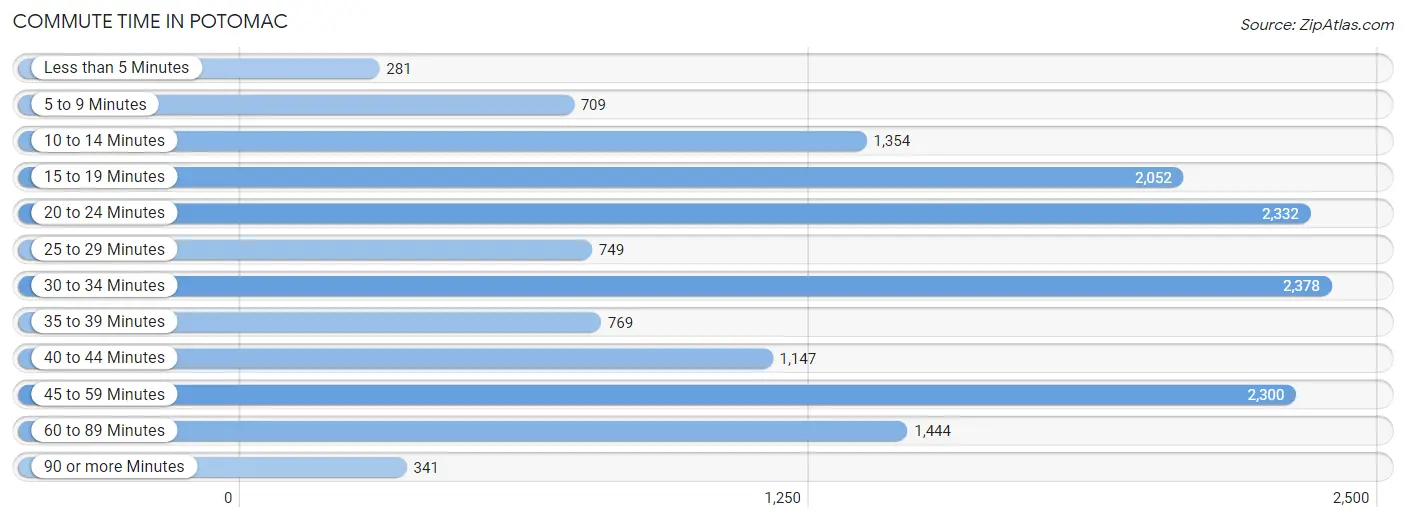
| Commute Time | # Commuters | % Commuters |
| Less than 5 Minutes | 281 | 1.8% |
| 5 to 9 Minutes | 709 | 4.5% |
| 10 to 14 Minutes | 1,354 | 8.5% |
| 15 to 19 Minutes | 2,052 | 12.9% |
| 20 to 24 Minutes | 2,332 | 14.7% |
| 25 to 29 Minutes | 749 | 4.7% |
| 30 to 34 Minutes | 2,378 | 15.0% |
| 35 to 39 Minutes | 769 | 4.9% |
| 40 to 44 Minutes | 1,147 | 7.2% |
| 45 to 59 Minutes | 2,300 | 14.5% |
| 60 to 89 Minutes | 1,444 | 9.1% |
| 90 or more Minutes | 341 | 2.1% |
Commute Time by Sex in Potomac
The most common commute times in Potomac are 45 to 59 minutes (1,474 commuters, 17.4%) for males and 20 to 24 minutes (1,140 commuters, 15.4%) for females.
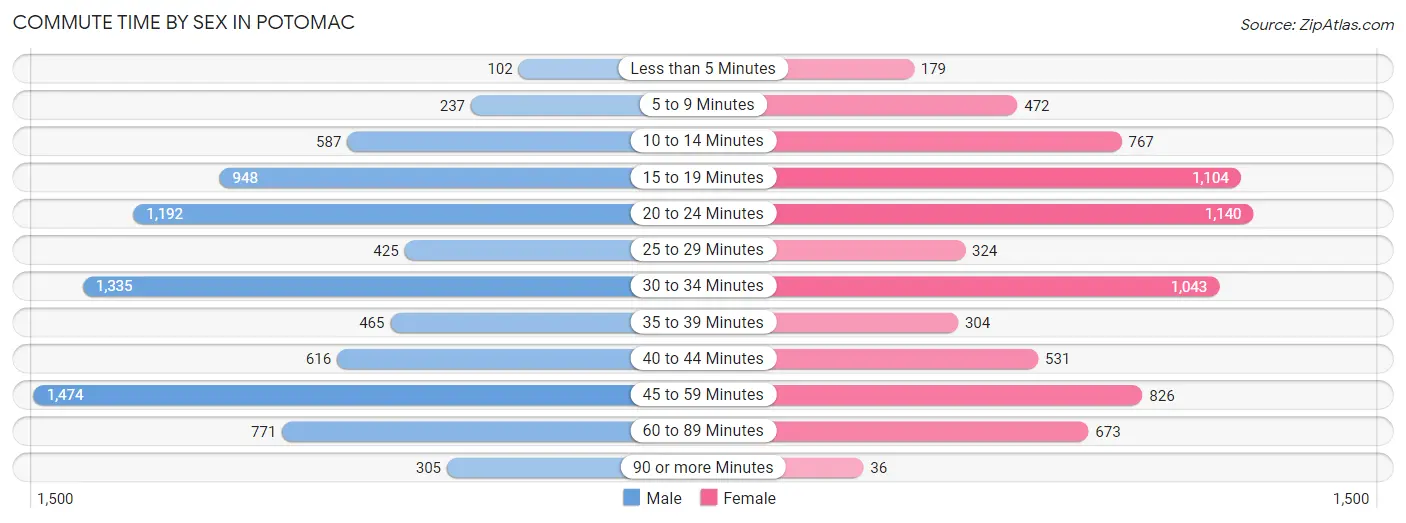
| Commute Time | Male | Female |
| Less than 5 Minutes | 102 (1.2%) | 179 (2.4%) |
| 5 to 9 Minutes | 237 (2.8%) | 472 (6.4%) |
| 10 to 14 Minutes | 587 (6.9%) | 767 (10.4%) |
| 15 to 19 Minutes | 948 (11.2%) | 1,104 (14.9%) |
| 20 to 24 Minutes | 1,192 (14.1%) | 1,140 (15.4%) |
| 25 to 29 Minutes | 425 (5.0%) | 324 (4.4%) |
| 30 to 34 Minutes | 1,335 (15.8%) | 1,043 (14.1%) |
| 35 to 39 Minutes | 465 (5.5%) | 304 (4.1%) |
| 40 to 44 Minutes | 616 (7.3%) | 531 (7.2%) |
| 45 to 59 Minutes | 1,474 (17.4%) | 826 (11.2%) |
| 60 to 89 Minutes | 771 (9.1%) | 673 (9.1%) |
| 90 or more Minutes | 305 (3.6%) | 36 (0.5%) |
Time of Departure to Work by Sex in Potomac
The most frequent times of departure to work in Potomac are 8:00 AM to 8:29 AM (1,582, 18.7%) for males and 8:00 AM to 8:29 AM (1,496, 20.2%) for females.
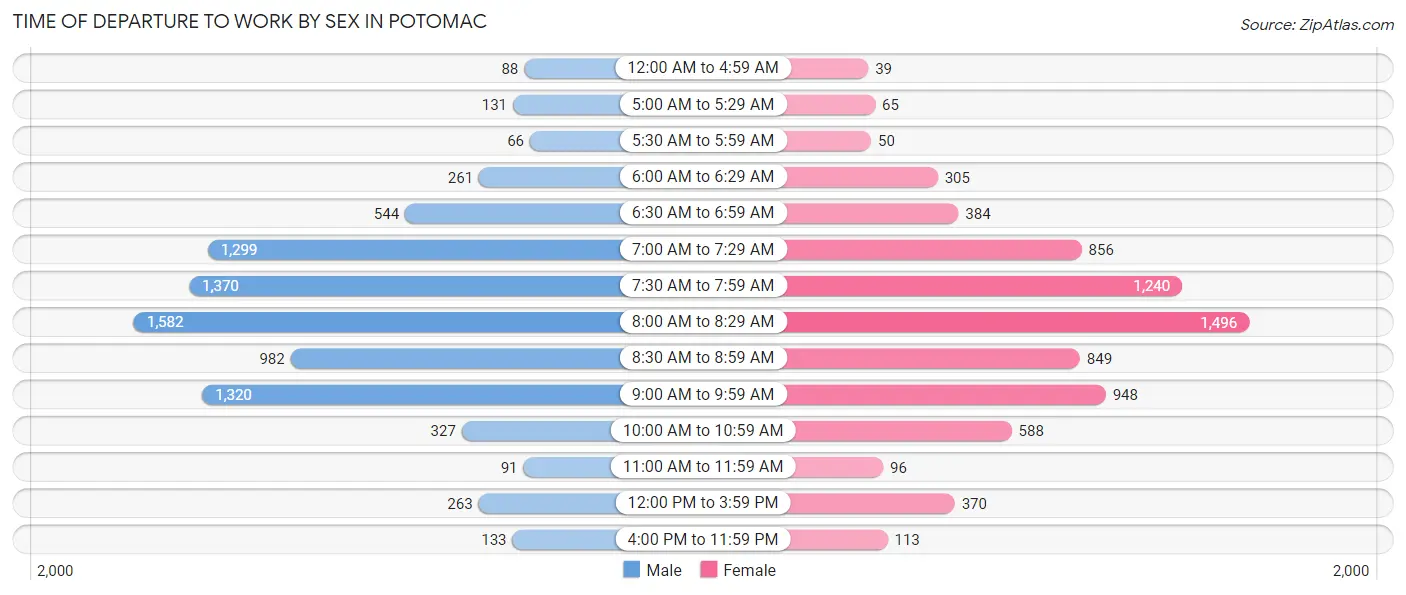
| Time of Departure | Male | Female |
| 12:00 AM to 4:59 AM | 88 (1.0%) | 39 (0.5%) |
| 5:00 AM to 5:29 AM | 131 (1.5%) | 65 (0.9%) |
| 5:30 AM to 5:59 AM | 66 (0.8%) | 50 (0.7%) |
| 6:00 AM to 6:29 AM | 261 (3.1%) | 305 (4.1%) |
| 6:30 AM to 6:59 AM | 544 (6.4%) | 384 (5.2%) |
| 7:00 AM to 7:29 AM | 1,299 (15.4%) | 856 (11.6%) |
| 7:30 AM to 7:59 AM | 1,370 (16.2%) | 1,240 (16.8%) |
| 8:00 AM to 8:29 AM | 1,582 (18.7%) | 1,496 (20.2%) |
| 8:30 AM to 8:59 AM | 982 (11.6%) | 849 (11.5%) |
| 9:00 AM to 9:59 AM | 1,320 (15.6%) | 948 (12.8%) |
| 10:00 AM to 10:59 AM | 327 (3.9%) | 588 (8.0%) |
| 11:00 AM to 11:59 AM | 91 (1.1%) | 96 (1.3%) |
| 12:00 PM to 3:59 PM | 263 (3.1%) | 370 (5.0%) |
| 4:00 PM to 11:59 PM | 133 (1.6%) | 113 (1.5%) |
| Total | 8,457 (100.0%) | 7,399 (100.0%) |
Housing Occupancy in Potomac
Occupancy by Ownership in Potomac
Of the total 16,328 dwellings in Potomac, owner-occupied units account for 13,913 (85.2%), while renter-occupied units make up 2,415 (14.8%).
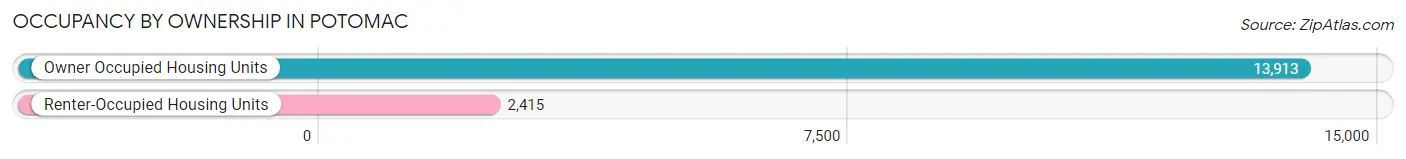
| Occupancy | # Housing Units | % Housing Units |
| Owner Occupied Housing Units | 13,913 | 85.2% |
| Renter-Occupied Housing Units | 2,415 | 14.8% |
| Total Occupied Housing Units | 16,328 | 100.0% |
Occupancy by Household Size in Potomac
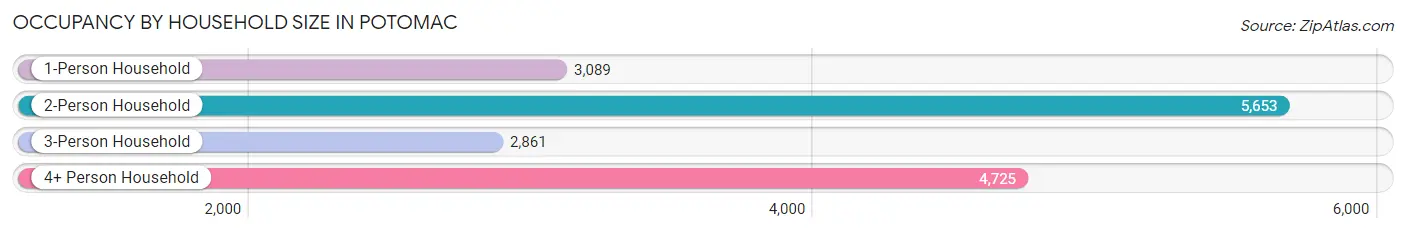
| Household Size | # Housing Units | % Housing Units |
| 1-Person Household | 3,089 | 18.9% |
| 2-Person Household | 5,653 | 34.6% |
| 3-Person Household | 2,861 | 17.5% |
| 4+ Person Household | 4,725 | 28.9% |
| Total Housing Units | 16,328 | 100.0% |
Occupancy by Ownership by Household Size in Potomac
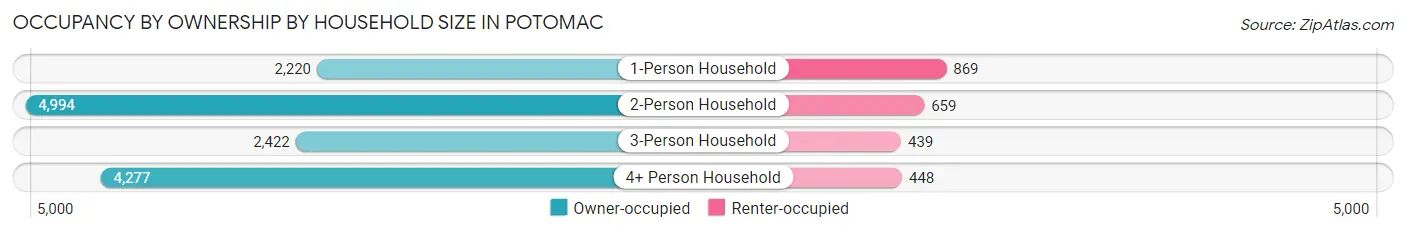
| Household Size | Owner-occupied | Renter-occupied |
| 1-Person Household | 2,220 (71.9%) | 869 (28.1%) |
| 2-Person Household | 4,994 (88.3%) | 659 (11.7%) |
| 3-Person Household | 2,422 (84.7%) | 439 (15.3%) |
| 4+ Person Household | 4,277 (90.5%) | 448 (9.5%) |
| Total Housing Units | 13,913 (85.2%) | 2,415 (14.8%) |
Occupancy by Educational Attainment in Potomac
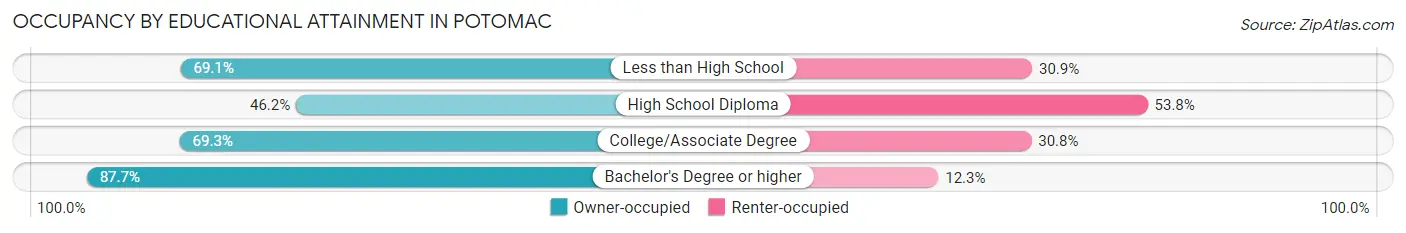
| Household Size | Owner-occupied | Renter-occupied |
| Less than High School | 114 (69.1%) | 51 (30.9%) |
| High School Diploma | 145 (46.2%) | 169 (53.8%) |
| College/Associate Degree | 910 (69.3%) | 404 (30.7%) |
| Bachelor's Degree or higher | 12,744 (87.7%) | 1,791 (12.3%) |
Occupancy by Age of Householder in Potomac
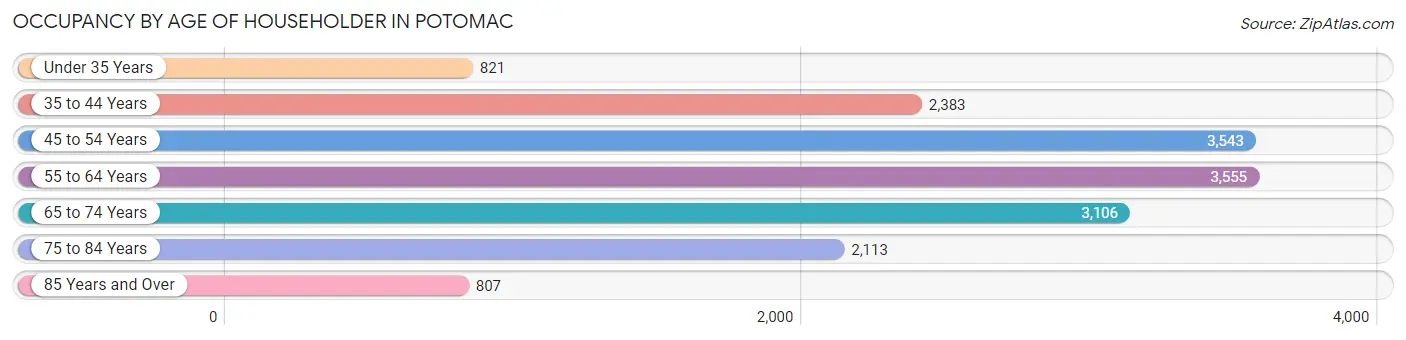
| Age Bracket | # Households | % Households |
| Under 35 Years | 821 | 5.0% |
| 35 to 44 Years | 2,383 | 14.6% |
| 45 to 54 Years | 3,543 | 21.7% |
| 55 to 64 Years | 3,555 | 21.8% |
| 65 to 74 Years | 3,106 | 19.0% |
| 75 to 84 Years | 2,113 | 12.9% |
| 85 Years and Over | 807 | 4.9% |
| Total | 16,328 | 100.0% |
Housing Finances in Potomac
Median Income by Occupancy in Potomac
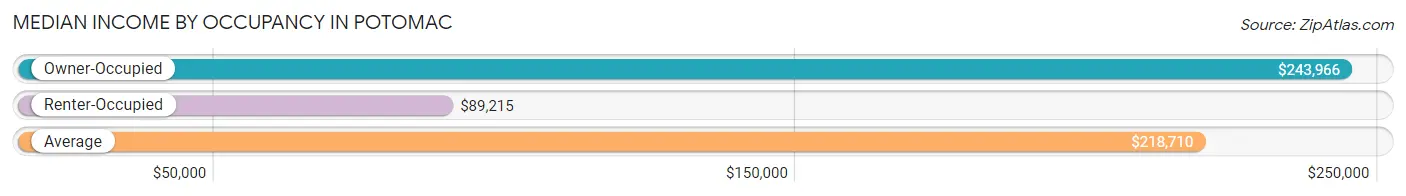
| Occupancy Type | # Households | Median Income |
| Owner-Occupied | 13,913 (85.2%) | $243,966 |
| Renter-Occupied | 2,415 (14.8%) | $89,215 |
| Average | 16,328 (100.0%) | $218,710 |
Occupancy by Householder Income Bracket in Potomac
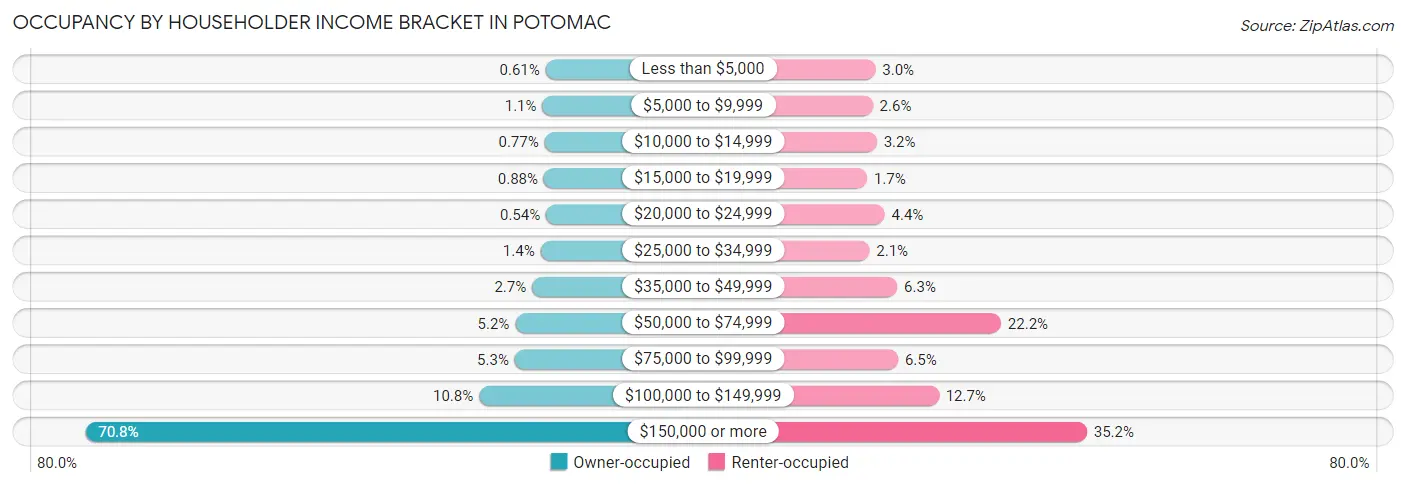
| Income Bracket | Owner-occupied | Renter-occupied |
| Less than $5,000 | 85 (0.6%) | 73 (3.0%) |
| $5,000 to $9,999 | 153 (1.1%) | 63 (2.6%) |
| $10,000 to $14,999 | 107 (0.8%) | 78 (3.2%) |
| $15,000 to $19,999 | 122 (0.9%) | 42 (1.7%) |
| $20,000 to $24,999 | 75 (0.5%) | 107 (4.4%) |
| $25,000 to $34,999 | 194 (1.4%) | 51 (2.1%) |
| $35,000 to $49,999 | 371 (2.7%) | 153 (6.3%) |
| $50,000 to $74,999 | 729 (5.2%) | 535 (22.2%) |
| $75,000 to $99,999 | 739 (5.3%) | 156 (6.5%) |
| $100,000 to $149,999 | 1,495 (10.7%) | 306 (12.7%) |
| $150,000 or more | 9,843 (70.8%) | 851 (35.2%) |
| Total | 13,913 (100.0%) | 2,415 (100.0%) |
Monthly Housing Cost Tiers in Potomac
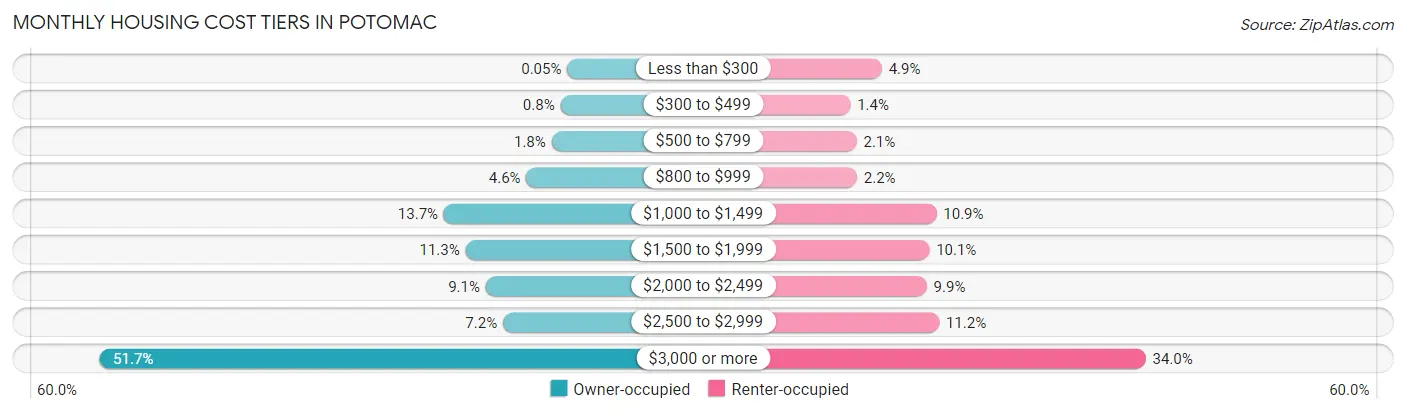
| Monthly Cost | Owner-occupied | Renter-occupied |
| Less than $300 | 7 (0.1%) | 118 (4.9%) |
| $300 to $499 | 111 (0.8%) | 34 (1.4%) |
| $500 to $799 | 247 (1.8%) | 51 (2.1%) |
| $800 to $999 | 634 (4.6%) | 52 (2.1%) |
| $1,000 to $1,499 | 1,903 (13.7%) | 264 (10.9%) |
| $1,500 to $1,999 | 1,571 (11.3%) | 245 (10.1%) |
| $2,000 to $2,499 | 1,259 (9.0%) | 238 (9.9%) |
| $2,500 to $2,999 | 995 (7.1%) | 271 (11.2%) |
| $3,000 or more | 7,186 (51.6%) | 822 (34.0%) |
| Total | 13,913 (100.0%) | 2,415 (100.0%) |
Physical Housing Characteristics in Potomac
Housing Structures in Potomac
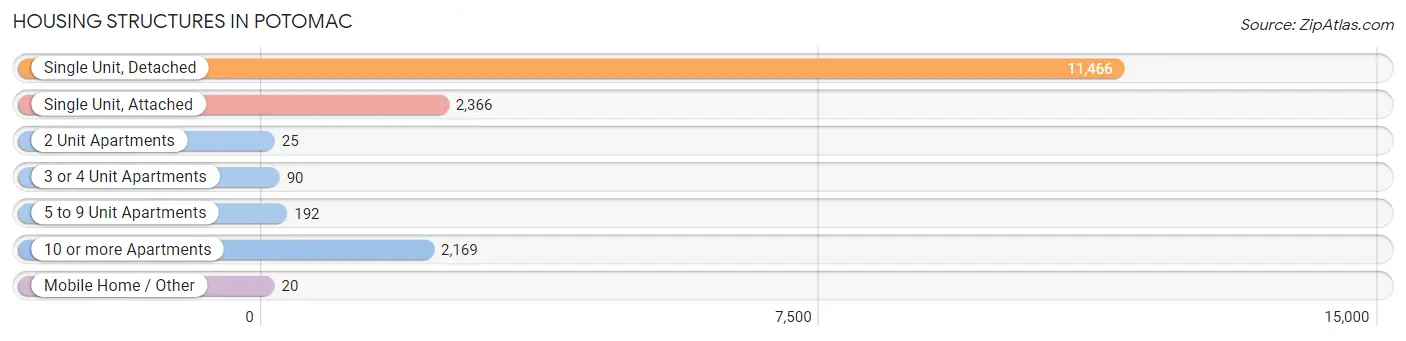
| Structure Type | # Housing Units | % Housing Units |
| Single Unit, Detached | 11,466 | 70.2% |
| Single Unit, Attached | 2,366 | 14.5% |
| 2 Unit Apartments | 25 | 0.2% |
| 3 or 4 Unit Apartments | 90 | 0.5% |
| 5 to 9 Unit Apartments | 192 | 1.2% |
| 10 or more Apartments | 2,169 | 13.3% |
| Mobile Home / Other | 20 | 0.1% |
| Total | 16,328 | 100.0% |
Housing Structures by Occupancy in Potomac
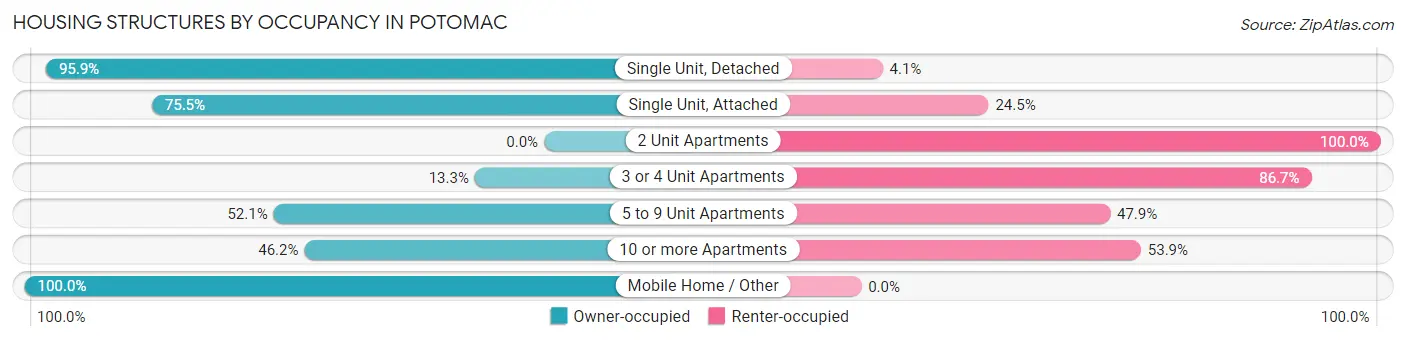
| Structure Type | Owner-occupied | Renter-occupied |
| Single Unit, Detached | 10,994 (95.9%) | 472 (4.1%) |
| Single Unit, Attached | 1,786 (75.5%) | 580 (24.5%) |
| 2 Unit Apartments | 0 (0.0%) | 25 (100.0%) |
| 3 or 4 Unit Apartments | 12 (13.3%) | 78 (86.7%) |
| 5 to 9 Unit Apartments | 100 (52.1%) | 92 (47.9%) |
| 10 or more Apartments | 1,001 (46.2%) | 1,168 (53.8%) |
| Mobile Home / Other | 20 (100.0%) | 0 (0.0%) |
| Total | 13,913 (85.2%) | 2,415 (14.8%) |
Housing Structures by Number of Rooms in Potomac
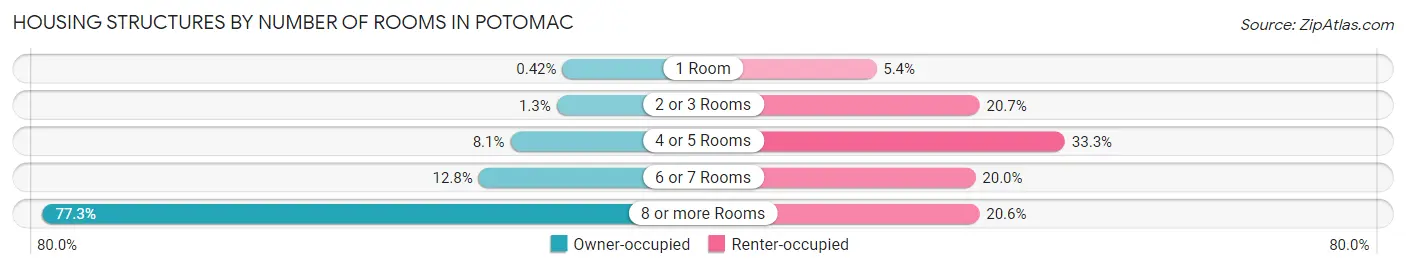
| Number of Rooms | Owner-occupied | Renter-occupied |
| 1 Room | 59 (0.4%) | 130 (5.4%) |
| 2 or 3 Rooms | 178 (1.3%) | 499 (20.7%) |
| 4 or 5 Rooms | 1,131 (8.1%) | 804 (33.3%) |
| 6 or 7 Rooms | 1,785 (12.8%) | 484 (20.0%) |
| 8 or more Rooms | 10,760 (77.3%) | 498 (20.6%) |
| Total | 13,913 (100.0%) | 2,415 (100.0%) |
Housing Structure by Heating Type in Potomac
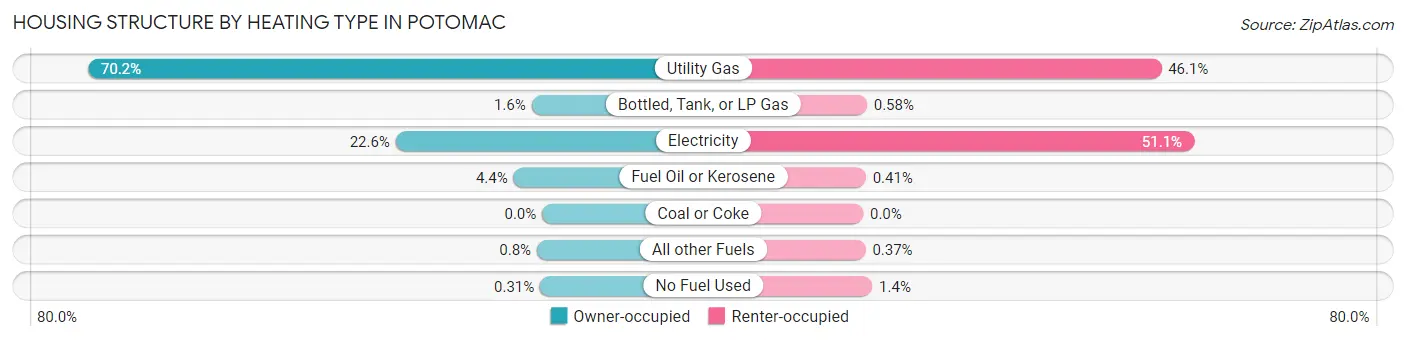
| Heating Type | Owner-occupied | Renter-occupied |
| Utility Gas | 9,770 (70.2%) | 1,113 (46.1%) |
| Bottled, Tank, or LP Gas | 227 (1.6%) | 14 (0.6%) |
| Electricity | 3,148 (22.6%) | 1,235 (51.1%) |
| Fuel Oil or Kerosene | 614 (4.4%) | 10 (0.4%) |
| Coal or Coke | 0 (0.0%) | 0 (0.0%) |
| All other Fuels | 111 (0.8%) | 9 (0.4%) |
| No Fuel Used | 43 (0.3%) | 34 (1.4%) |
| Total | 13,913 (100.0%) | 2,415 (100.0%) |
Household Vehicle Usage in Potomac
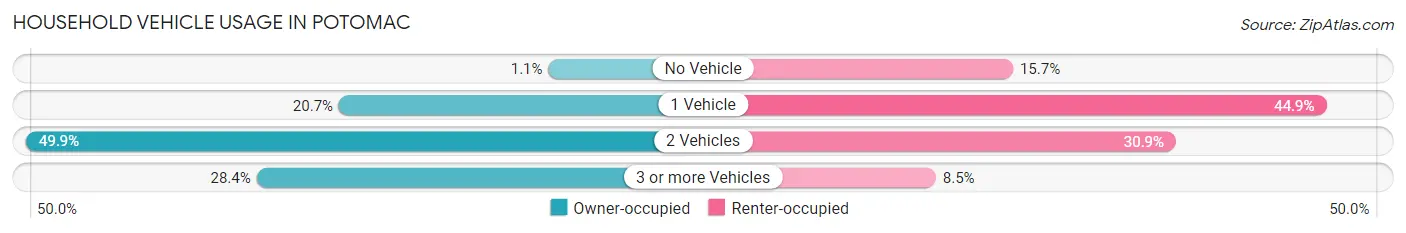
| Vehicles per Household | Owner-occupied | Renter-occupied |
| No Vehicle | 154 (1.1%) | 379 (15.7%) |
| 1 Vehicle | 2,874 (20.7%) | 1,085 (44.9%) |
| 2 Vehicles | 6,940 (49.9%) | 746 (30.9%) |
| 3 or more Vehicles | 3,945 (28.3%) | 205 (8.5%) |
| Total | 13,913 (100.0%) | 2,415 (100.0%) |
Real Estate & Mortgages in Potomac
Real Estate and Mortgage Overview in Potomac
| Characteristic | Without Mortgage | With Mortgage |
| Housing Units | 4,933 | 8,980 |
| Median Property Value | $1,052,400 | $1,040,200 |
| Median Household Income | $179,963 | $6,991 |
| Monthly Housing Costs | $1,452 | $6,852 |
| Real Estate Taxes | $10,001 | $83 |
Property Value by Mortgage Status in Potomac
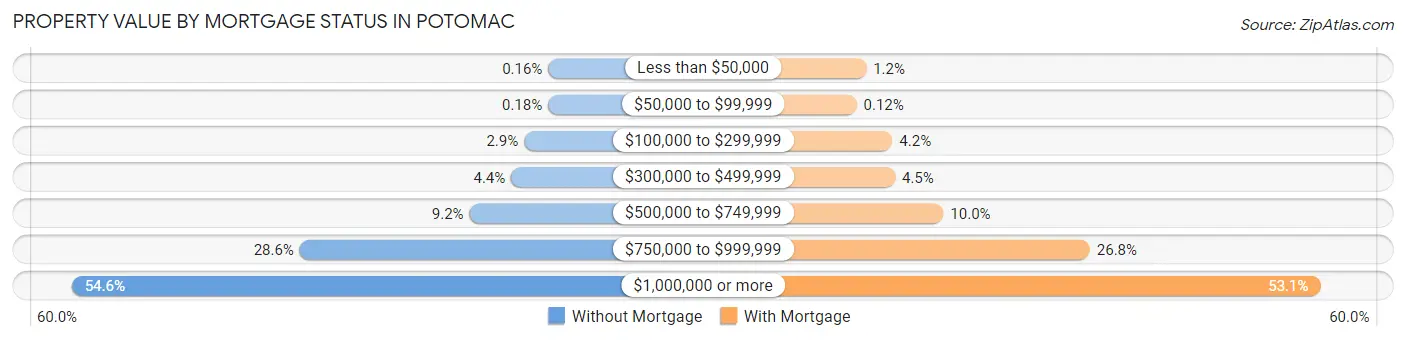
| Property Value | Without Mortgage | With Mortgage |
| Less than $50,000 | 8 (0.2%) | 110 (1.2%) |
| $50,000 to $99,999 | 9 (0.2%) | 11 (0.1%) |
| $100,000 to $299,999 | 144 (2.9%) | 378 (4.2%) |
| $300,000 to $499,999 | 217 (4.4%) | 405 (4.5%) |
| $500,000 to $749,999 | 452 (9.2%) | 902 (10.0%) |
| $750,000 to $999,999 | 1,409 (28.6%) | 2,405 (26.8%) |
| $1,000,000 or more | 2,694 (54.6%) | 4,769 (53.1%) |
| Total | 4,933 (100.0%) | 8,980 (100.0%) |
Household Income by Mortgage Status in Potomac
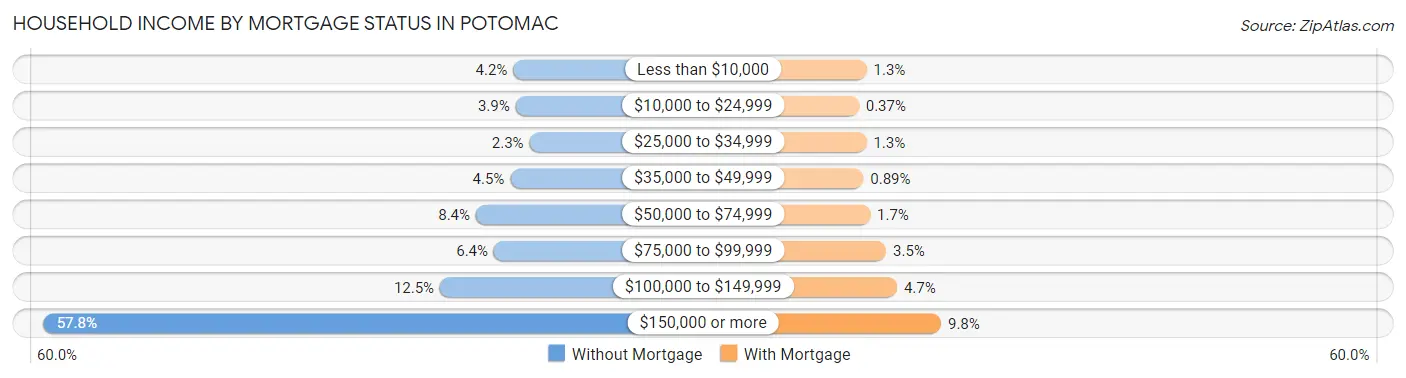
| Household Income | Without Mortgage | With Mortgage |
| Less than $10,000 | 205 (4.2%) | 113 (1.3%) |
| $10,000 to $24,999 | 192 (3.9%) | 33 (0.4%) |
| $25,000 to $34,999 | 114 (2.3%) | 112 (1.3%) |
| $35,000 to $49,999 | 222 (4.5%) | 80 (0.9%) |
| $50,000 to $74,999 | 416 (8.4%) | 149 (1.7%) |
| $75,000 to $99,999 | 314 (6.4%) | 313 (3.5%) |
| $100,000 to $149,999 | 618 (12.5%) | 425 (4.7%) |
| $150,000 or more | 2,852 (57.8%) | 877 (9.8%) |
| Total | 4,933 (100.0%) | 8,980 (100.0%) |
Property Value to Household Income Ratio in Potomac
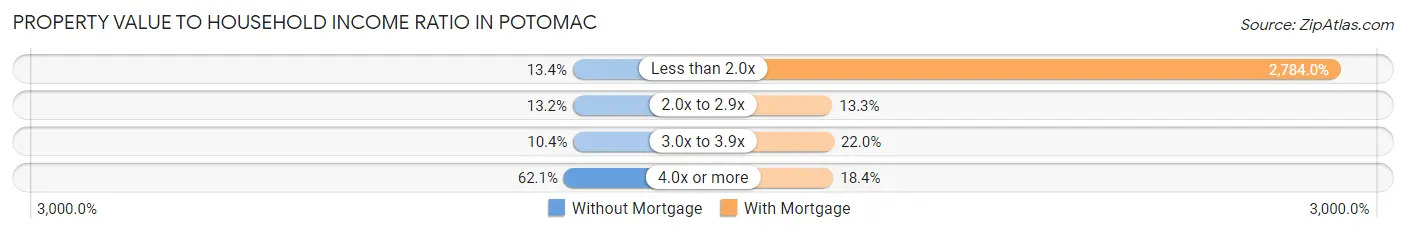
| Value-to-Income Ratio | Without Mortgage | With Mortgage |
| Less than 2.0x | 663 (13.4%) | 250,001 (2,784.0%) |
| 2.0x to 2.9x | 653 (13.2%) | 1,196 (13.3%) |
| 3.0x to 3.9x | 512 (10.4%) | 1,978 (22.0%) |
| 4.0x or more | 3,065 (62.1%) | 1,653 (18.4%) |
| Total | 4,933 (100.0%) | 8,980 (100.0%) |
Real Estate Taxes by Mortgage Status in Potomac
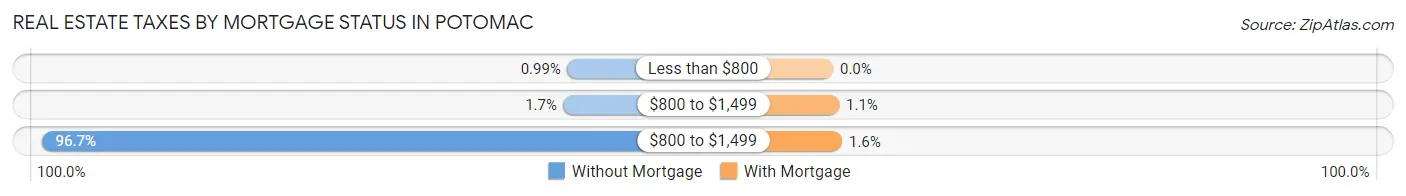
| Property Taxes | Without Mortgage | With Mortgage |
| Less than $800 | 49 (1.0%) | 0 (0.0%) |
| $800 to $1,499 | 84 (1.7%) | 99 (1.1%) |
| $800 to $1,499 | 4,770 (96.7%) | 147 (1.6%) |
| Total | 4,933 (100.0%) | 8,980 (100.0%) |
Health & Disability in Potomac
Health Insurance Coverage by Age in Potomac
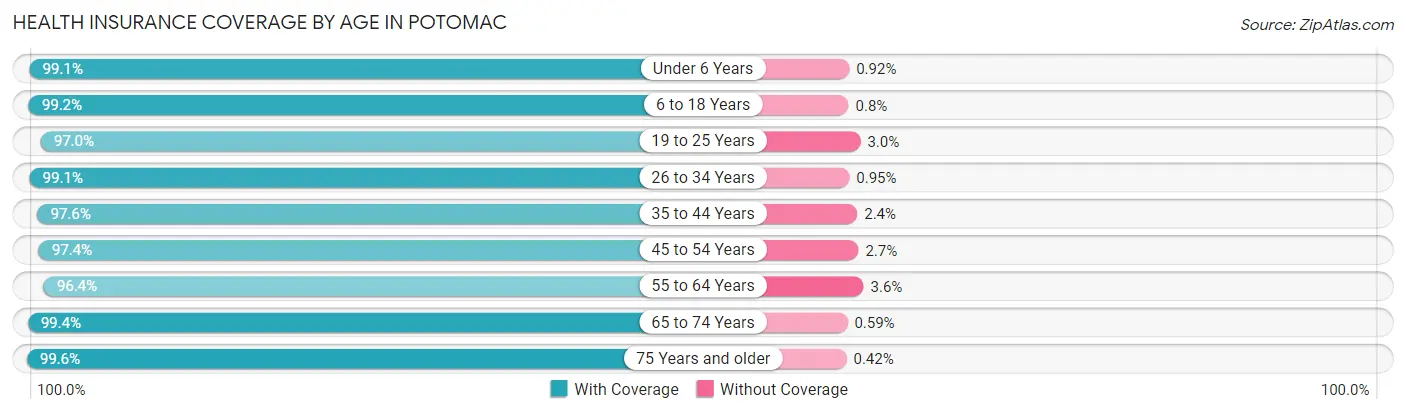
| Age Bracket | With Coverage | Without Coverage |
| Under 6 Years | 2,597 (99.1%) | 24 (0.9%) |
| 6 to 18 Years | 9,205 (99.2%) | 74 (0.8%) |
| 19 to 25 Years | 2,443 (97.0%) | 76 (3.0%) |
| 26 to 34 Years | 2,304 (99.1%) | 22 (0.9%) |
| 35 to 44 Years | 4,957 (97.6%) | 123 (2.4%) |
| 45 to 54 Years | 6,935 (97.4%) | 189 (2.6%) |
| 55 to 64 Years | 6,555 (96.4%) | 245 (3.6%) |
| 65 to 74 Years | 5,576 (99.4%) | 33 (0.6%) |
| 75 Years and older | 4,779 (99.6%) | 20 (0.4%) |
| Total | 45,351 (98.3%) | 806 (1.8%) |
Health Insurance Coverage by Citizenship Status in Potomac
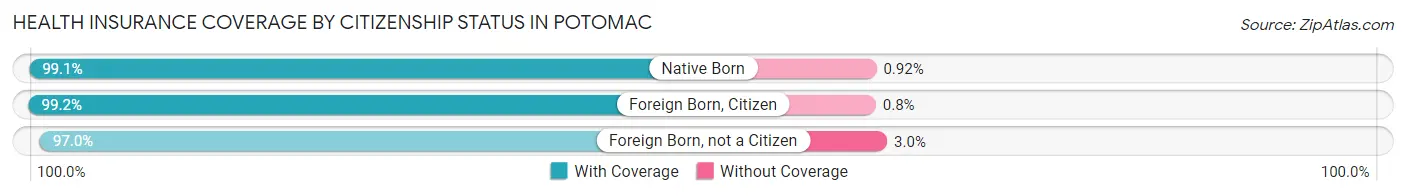
| Citizenship Status | With Coverage | Without Coverage |
| Native Born | 2,597 (99.1%) | 24 (0.9%) |
| Foreign Born, Citizen | 9,205 (99.2%) | 74 (0.8%) |
| Foreign Born, not a Citizen | 2,443 (97.0%) | 76 (3.0%) |
Health Insurance Coverage by Household Income in Potomac
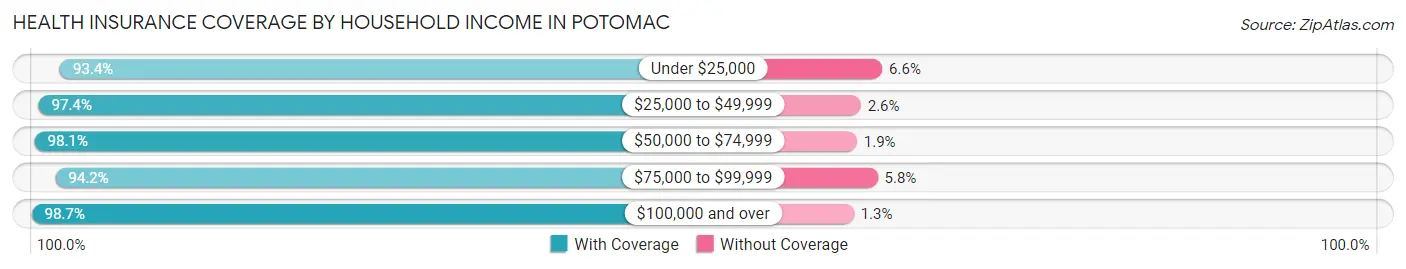
| Household Income | With Coverage | Without Coverage |
| Under $25,000 | 1,467 (93.4%) | 104 (6.6%) |
| $25,000 to $49,999 | 1,114 (97.4%) | 30 (2.6%) |
| $50,000 to $74,999 | 2,407 (98.1%) | 46 (1.9%) |
| $75,000 to $99,999 | 1,797 (94.2%) | 110 (5.8%) |
| $100,000 and over | 38,472 (98.7%) | 507 (1.3%) |
Public vs Private Health Insurance Coverage by Age in Potomac
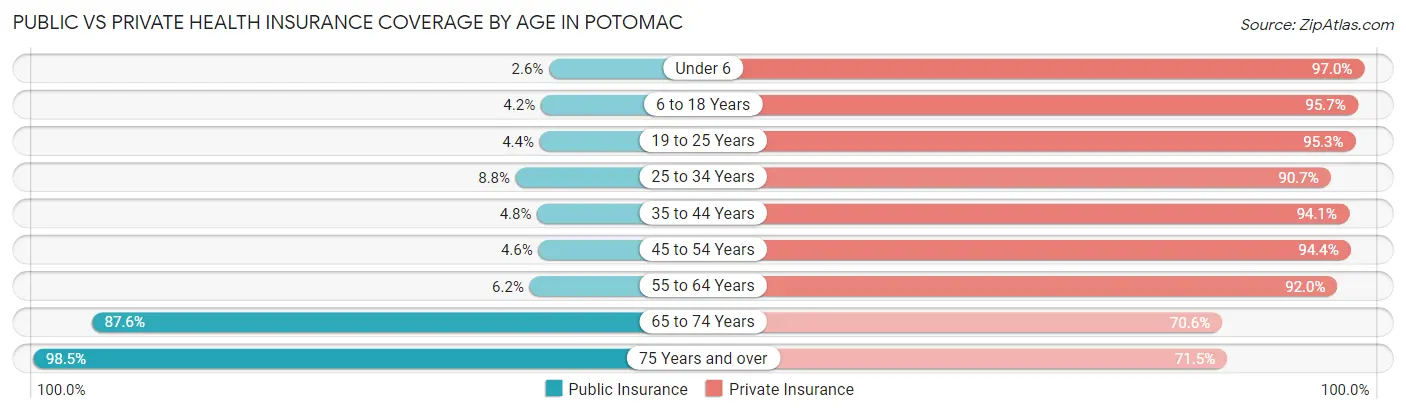
| Age Bracket | Public Insurance | Private Insurance |
| Under 6 | 69 (2.6%) | 2,541 (97.0%) |
| 6 to 18 Years | 385 (4.2%) | 8,883 (95.7%) |
| 19 to 25 Years | 110 (4.4%) | 2,401 (95.3%) |
| 25 to 34 Years | 205 (8.8%) | 2,110 (90.7%) |
| 35 to 44 Years | 246 (4.8%) | 4,780 (94.1%) |
| 45 to 54 Years | 328 (4.6%) | 6,727 (94.4%) |
| 55 to 64 Years | 424 (6.2%) | 6,254 (92.0%) |
| 65 to 74 Years | 4,912 (87.6%) | 3,959 (70.6%) |
| 75 Years and over | 4,725 (98.5%) | 3,431 (71.5%) |
| Total | 11,404 (24.7%) | 41,086 (89.0%) |
Disability Status by Sex by Age in Potomac
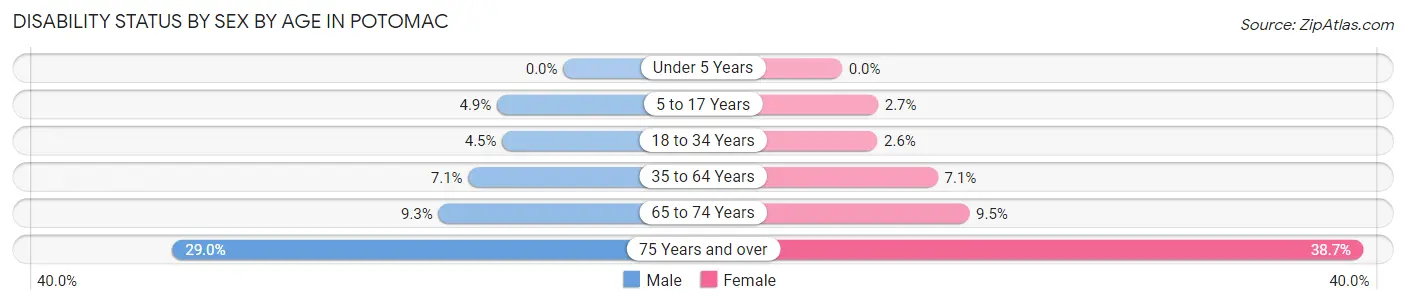
| Age Bracket | Male | Female |
| Under 5 Years | 0 (0.0%) | 0 (0.0%) |
| 5 to 17 Years | 234 (4.9%) | 113 (2.7%) |
| 18 to 34 Years | 131 (4.5%) | 72 (2.6%) |
| 35 to 64 Years | 623 (7.0%) | 723 (7.1%) |
| 65 to 74 Years | 241 (9.3%) | 284 (9.5%) |
| 75 Years and over | 618 (29.0%) | 1,033 (38.7%) |
Disability Class by Sex by Age in Potomac
Disability Class: Hearing Difficulty
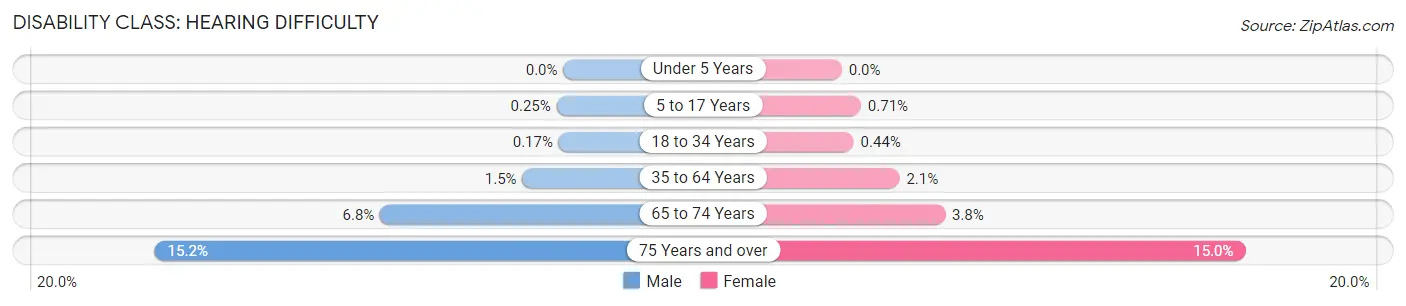
| Age Bracket | Male | Female |
| Under 5 Years | 0 (0.0%) | 0 (0.0%) |
| 5 to 17 Years | 12 (0.3%) | 30 (0.7%) |
| 18 to 34 Years | 5 (0.2%) | 12 (0.4%) |
| 35 to 64 Years | 134 (1.5%) | 218 (2.1%) |
| 65 to 74 Years | 177 (6.8%) | 115 (3.8%) |
| 75 Years and over | 323 (15.2%) | 400 (15.0%) |
Disability Class: Vision Difficulty
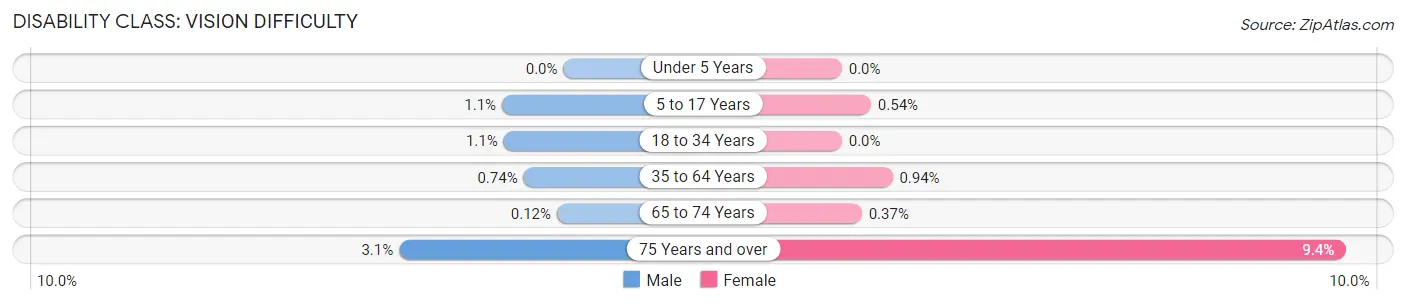
| Age Bracket | Male | Female |
| Under 5 Years | 0 (0.0%) | 0 (0.0%) |
| 5 to 17 Years | 54 (1.1%) | 23 (0.5%) |
| 18 to 34 Years | 32 (1.1%) | 0 (0.0%) |
| 35 to 64 Years | 65 (0.7%) | 96 (0.9%) |
| 65 to 74 Years | 3 (0.1%) | 11 (0.4%) |
| 75 Years and over | 65 (3.0%) | 250 (9.4%) |
Disability Class: Cognitive Difficulty
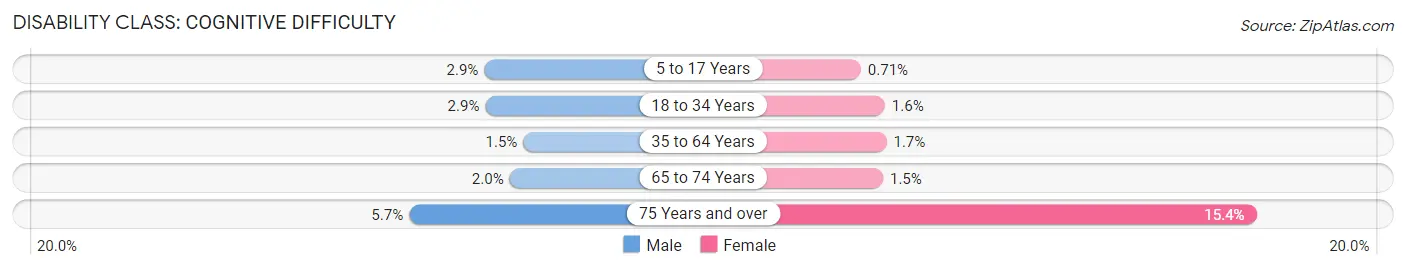
| Age Bracket | Male | Female |
| 5 to 17 Years | 140 (2.9%) | 30 (0.7%) |
| 18 to 34 Years | 84 (2.9%) | 44 (1.6%) |
| 35 to 64 Years | 132 (1.5%) | 169 (1.7%) |
| 65 to 74 Years | 52 (2.0%) | 46 (1.5%) |
| 75 Years and over | 122 (5.7%) | 411 (15.4%) |
Disability Class: Ambulatory Difficulty
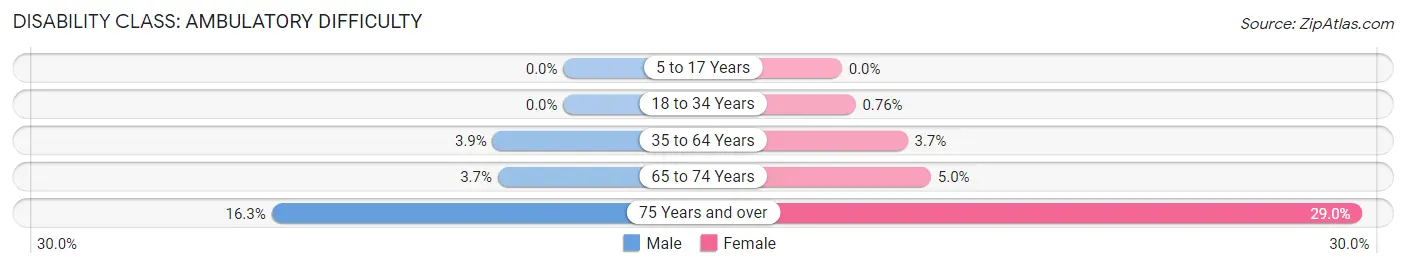
| Age Bracket | Male | Female |
| 5 to 17 Years | 0 (0.0%) | 0 (0.0%) |
| 18 to 34 Years | 0 (0.0%) | 21 (0.8%) |
| 35 to 64 Years | 348 (3.9%) | 372 (3.7%) |
| 65 to 74 Years | 95 (3.6%) | 149 (5.0%) |
| 75 Years and over | 346 (16.3%) | 774 (29.0%) |
Disability Class: Self-Care Difficulty
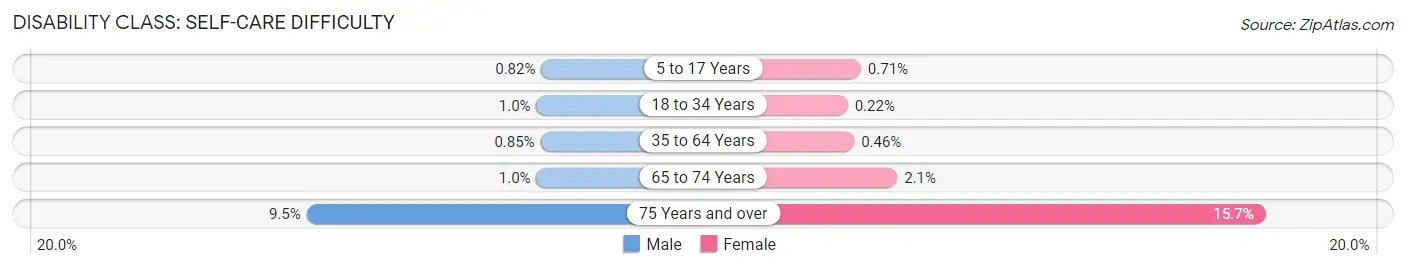
| Age Bracket | Male | Female |
| 5 to 17 Years | 39 (0.8%) | 30 (0.7%) |
| 18 to 34 Years | 29 (1.0%) | 6 (0.2%) |
| 35 to 64 Years | 75 (0.9%) | 47 (0.5%) |
| 65 to 74 Years | 26 (1.0%) | 62 (2.1%) |
| 75 Years and over | 203 (9.5%) | 420 (15.7%) |
Technology Access in Potomac
Computing Device Access in Potomac
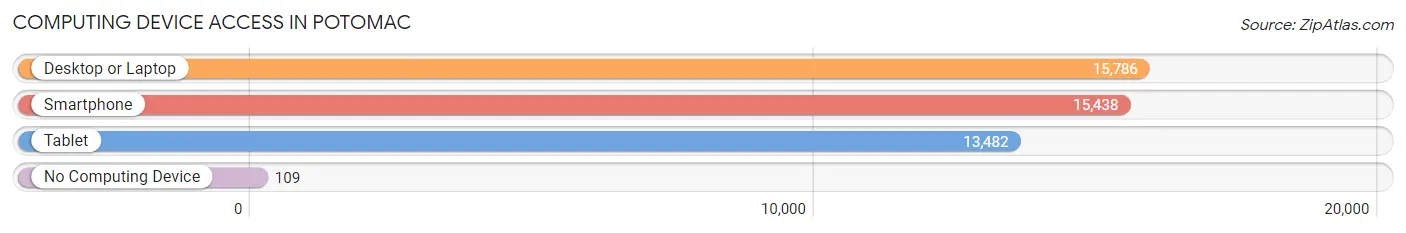
| Device Type | # Households | % Households |
| Desktop or Laptop | 15,786 | 96.7% |
| Smartphone | 15,438 | 94.6% |
| Tablet | 13,482 | 82.6% |
| No Computing Device | 109 | 0.7% |
| Total | 16,328 | 100.0% |
Internet Access in Potomac
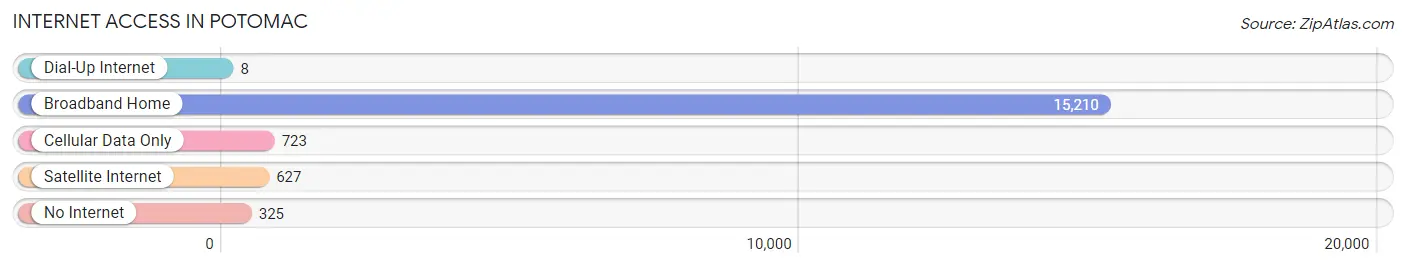
| Internet Type | # Households | % Households |
| Dial-Up Internet | 8 | 0.1% |
| Broadband Home | 15,210 | 93.1% |
| Cellular Data Only | 723 | 4.4% |
| Satellite Internet | 627 | 3.8% |
| No Internet | 325 | 2.0% |
| Total | 16,328 | 100.0% |
Potomac Summary
Potomac, Maryland is a small, affluent community located in Montgomery County, Maryland, just outside of Washington, D.C. It is a popular residential area for those who work in the nation’s capital, and is known for its beautiful scenery and high quality of life.
History
The area now known as Potomac was originally inhabited by the Piscataway Indians, who lived in the area for centuries before the arrival of European settlers. The first Europeans to settle in the area were English colonists, who arrived in the late 1600s. The area was originally part of the Province of Maryland, and was known as “Potomoke”, which is derived from the Algonquian word for “a place where people trade”.
In the late 1700s, the area was divided into two separate townships, known as “Upper Potomac” and “Lower Potomac”. The two townships were later combined to form the Town of Potomac, which was officially incorporated in 1878.
Geography
Potomac is located in Montgomery County, Maryland, just outside of Washington, D.C. It is bordered by the Potomac River to the north, the C&O Canal to the east, and the City of Rockville to the south. The area is mostly residential, with some commercial and industrial areas.
The terrain of Potomac is mostly hilly, with some flat areas. The highest point in the area is the summit of Sugarloaf Mountain, which is located just outside of the town. The area is also home to several parks and nature preserves, including the Potomac River National Wildlife Refuge and the Great Falls National Park.
Economy
The economy of Potomac is largely based on the service industry, with many residents employed in the government, education, and healthcare sectors. The area is also home to several large corporations, including Marriott International, Lockheed Martin, and Northrop Grumman.
The median household income in Potomac is $150,000, which is significantly higher than the national average. The unemployment rate in the area is also lower than the national average, at just 3.2%.
Demographics
As of the 2010 census, the population of Potomac was 45,744. The racial makeup of the area is predominantly white (77.3%), with smaller percentages of African Americans (14.2%), Asians (4.7%), and Hispanics (2.7%).
The median age in Potomac is 44.7, and the median household income is $150,000. The area is also home to a large number of college-educated residents, with over 70% of the population having a bachelor’s degree or higher.
Conclusion
Potomac, Maryland is a small, affluent community located in Montgomery County, Maryland, just outside of Washington, D.C. It is a popular residential area for those who work in the nation’s capital, and is known for its beautiful scenery and high quality of life. The economy of Potomac is largely based on the service industry, with many residents employed in the government, education, and healthcare sectors. The population of Potomac is predominantly white, with a median age of 44.7 and a median household income of $150,000.
Common Questions
What is Per Capita Income in Potomac?
Per Capita income in Potomac is $102,878.
What is the Median Family Income in Potomac?
Median Family Income in Potomac is $250,001.
What is the Median Household income in Potomac?
Median Household Income in Potomac is $218,710.
What is Income or Wage Gap in Potomac?
Income or Wage Gap in Potomac is 44.6%.
Women in Potomac earn 55.4 cents for every dollar earned by a man.
What is Family Income Deficit in Potomac?
Family Income Deficit in Potomac is $9,868.
Families that are below poverty line in Potomac earn $9,868 less on average than the poverty threshold level.
What is Inequality or Gini Index in Potomac?
Inequality or Gini Index in Potomac is 0.46.
What is the Total Population of Potomac?
Total Population of Potomac is 46,499.
What is the Total Male Population of Potomac?
Total Male Population of Potomac is 22,531.
What is the Total Female Population of Potomac?
Total Female Population of Potomac is 23,968.
What is the Ratio of Males per 100 Females in Potomac?
There are 94.00 Males per 100 Females in Potomac.
What is the Ratio of Females per 100 Males in Potomac?
There are 106.38 Females per 100 Males in Potomac.
What is the Median Population Age in Potomac?
Median Population Age in Potomac is 47.4 Years.
What is the Average Family Size in Potomac
Average Family Size in Potomac is 3.2 People.
What is the Average Household Size in Potomac
Average Household Size in Potomac is 2.8 People.
How Large is the Labor Force in Potomac?
There are 23,150 People in the Labor Forcein in Potomac.
What is the Percentage of People in the Labor Force in Potomac?
62.1% of People are in the Labor Force in Potomac.
What is the Unemployment Rate in Potomac?
Unemployment Rate in Potomac is 4.2%.