Cities with the Highest Percentage of Japanese Population in Maryland
RELATED REPORTS & OPTIONS
Japanese
Maryland
Compare Cities
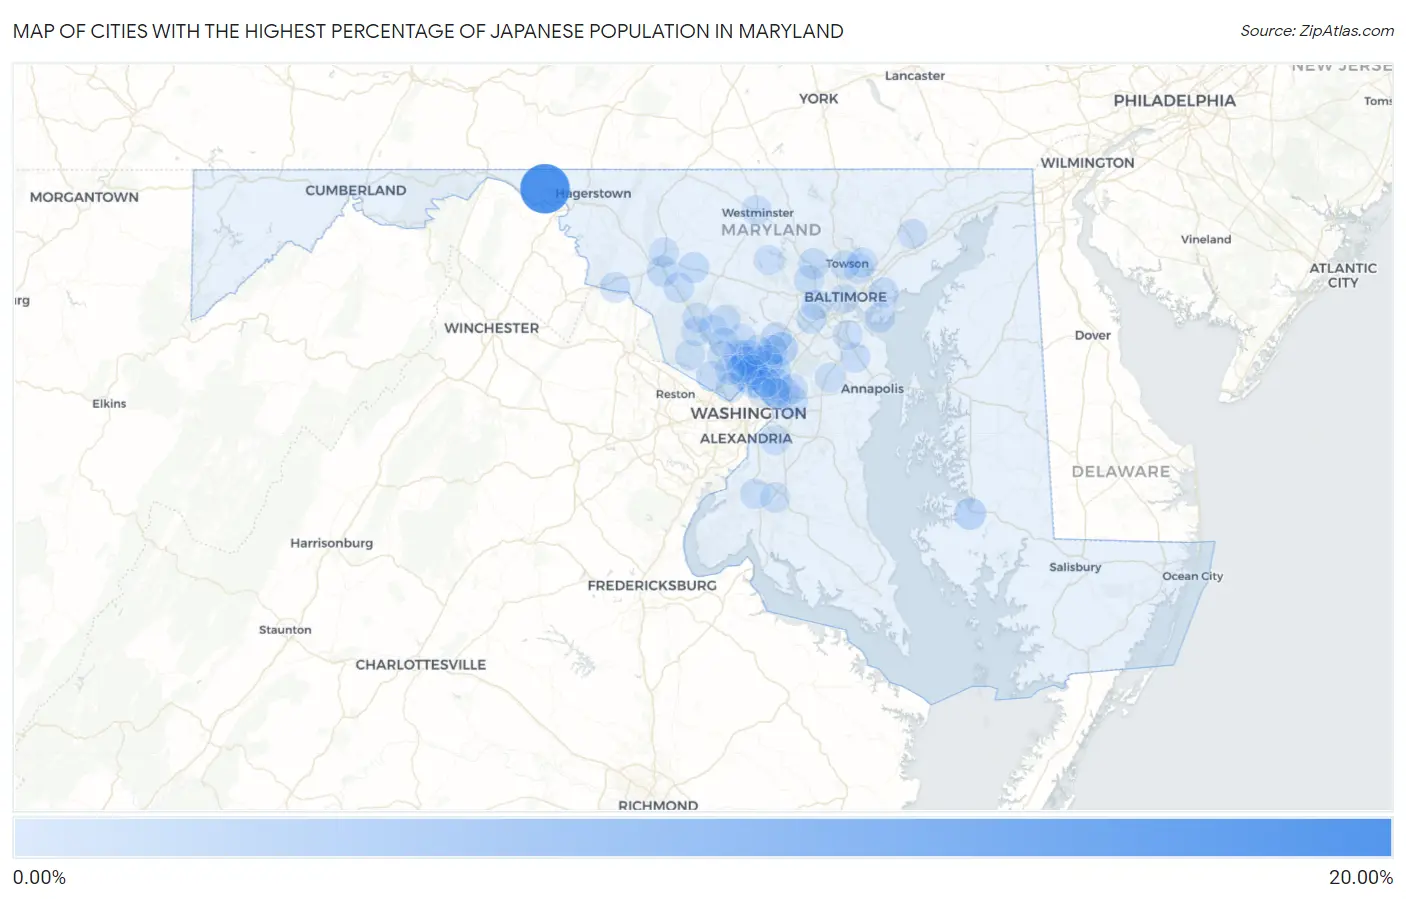
Map of Cities with the Highest Percentage of Japanese Population in Maryland
0.00%
20.00%
Cities with the Highest Percentage of Japanese Population in Maryland
| City | Japanese | vs State | vs National | |
| 1. | Clear Spring | 16.30% | 0.061%(+16.2)#1 | 0.11%(+16.2)#7 |
| 2. | West Laurel | 2.35% | 0.061%(+2.29)#2 | 0.11%(+2.25)#77 |
| 3. | Layhill | 2.02% | 0.061%(+1.96)#3 | 0.11%(+1.91)#95 |
| 4. | Cambridge | 1.62% | 0.061%(+1.56)#4 | 0.11%(+1.52)#122 |
| 5. | Forest Glen | 1.34% | 0.061%(+1.28)#5 | 0.11%(+1.24)#167 |
| 6. | Calverton | 1.26% | 0.061%(+1.20)#6 | 0.11%(+1.15)#185 |
| 7. | Abingdon | 1.17% | 0.061%(+1.11)#7 | 0.11%(+1.07)#203 |
| 8. | Beltsville | 1.06% | 0.061%(+1.00)#8 | 0.11%(+0.954)#228 |
| 9. | Ballenger Creek | 0.99% | 0.061%(+0.926)#9 | 0.11%(+0.880)#250 |
| 10. | New Market | 0.72% | 0.061%(+0.657)#10 | 0.11%(+0.611)#358 |
| 11. | Garrison | 0.69% | 0.061%(+0.626)#11 | 0.11%(+0.580)#374 |
| 12. | Brunswick | 0.67% | 0.061%(+0.608)#12 | 0.11%(+0.562)#382 |
| 13. | Springdale | 0.65% | 0.061%(+0.586)#13 | 0.11%(+0.540)#388 |
| 14. | Colesville | 0.55% | 0.061%(+0.487)#14 | 0.11%(+0.441)#449 |
| 15. | Fulton | 0.50% | 0.061%(+0.436)#15 | 0.11%(+0.390)#488 |
| 16. | Aspen Hill | 0.49% | 0.061%(+0.430)#16 | 0.11%(+0.384)#495 |
| 17. | Urbana | 0.46% | 0.061%(+0.403)#17 | 0.11%(+0.357)#514 |
| 18. | Fairland | 0.44% | 0.061%(+0.382)#18 | 0.11%(+0.336)#530 |
| 19. | Laytonsville | 0.41% | 0.061%(+0.347)#19 | 0.11%(+0.301)#574 |
| 20. | North Kensington | 0.31% | 0.061%(+0.246)#20 | 0.11%(+0.201)#719 |
| 21. | Silver Spring | 0.27% | 0.061%(+0.212)#21 | 0.11%(+0.166)#796 |
| 22. | Four Corners | 0.23% | 0.061%(+0.171)#22 | 0.11%(+0.125)#891 |
| 23. | New Carrollton | 0.22% | 0.061%(+0.160)#23 | 0.11%(+0.115)#919 |
| 24. | Essex | 0.21% | 0.061%(+0.145)#24 | 0.11%(+0.099)#956 |
| 25. | East Riverdale | 0.18% | 0.061%(+0.116)#25 | 0.11%(+0.071)#1,016 |
| 26. | Edgemere | 0.17% | 0.061%(+0.108)#26 | 0.11%(+0.063)#1,039 |
| 27. | Ilchester | 0.16% | 0.061%(+0.104)#27 | 0.11%(+0.059)#1,056 |
| 28. | Catonsville | 0.16% | 0.061%(+0.103)#28 | 0.11%(+0.057)#1,065 |
| 29. | Berwyn Heights | 0.15% | 0.061%(+0.090)#29 | 0.11%(+0.045)#1,095 |
| 30. | Severna Park | 0.15% | 0.061%(+0.090)#30 | 0.11%(+0.044)#1,097 |
| 31. | Glenmont | 0.15% | 0.061%(+0.090)#31 | 0.11%(+0.044)#1,098 |
| 32. | Flower Hill | 0.14% | 0.061%(+0.083)#32 | 0.11%(+0.037)#1,116 |
| 33. | Parkville | 0.13% | 0.061%(+0.074)#33 | 0.11%(+0.028)#1,147 |
| 34. | Frederick | 0.12% | 0.061%(+0.061)#34 | 0.11%(+0.015)#1,210 |
| 35. | Darnestown | 0.12% | 0.061%(+0.059)#35 | 0.11%(+0.014)#1,215 |
| 36. | Potomac | 0.12% | 0.061%(+0.058)#36 | 0.11%(+0.012)#1,222 |
| 37. | Langley Park | 0.11% | 0.061%(+0.054)#37 | 0.11%(+0.008)#1,230 |
| 38. | Glen Burnie | 0.11% | 0.061%(+0.053)#38 | 0.11%(+0.007)#1,238 |
| 39. | Bensville | 0.11% | 0.061%(+0.052)#39 | 0.11%(+0.006)#1,242 |
| 40. | Camp Springs | 0.11% | 0.061%(+0.047)#40 | 0.11%(+0.001)#1,267 |
| 41. | Bel Air South | 0.11% | 0.061%(+0.044)#41 | 0.11%(-0.001)#1,283 |
| 42. | Waldorf | 0.096% | 0.061%(+0.036)#42 | 0.11%(-0.010)#1,321 |
| 43. | Seabrook | 0.088% | 0.061%(+0.027)#43 | 0.11%(-0.019)#1,357 |
| 44. | Kemp Mill | 0.085% | 0.061%(+0.025)#44 | 0.11%(-0.021)#1,377 |
| 45. | Olney | 0.084% | 0.061%(+0.024)#45 | 0.11%(-0.022)#1,383 |
| 46. | Chillum | 0.084% | 0.061%(+0.023)#46 | 0.11%(-0.023)#1,385 |
| 47. | Woodlawn Cdp Baltimore County | 0.080% | 0.061%(+0.020)#47 | 0.11%(-0.026)#1,397 |
| 48. | Wheaton | 0.078% | 0.061%(+0.017)#48 | 0.11%(-0.029)#1,411 |
| 49. | Burtonsville | 0.078% | 0.061%(+0.017)#49 | 0.11%(-0.029)#1,413 |
| 50. | Milford Mill | 0.076% | 0.061%(+0.016)#50 | 0.11%(-0.030)#1,419 |
| 51. | Carney | 0.072% | 0.061%(+0.011)#51 | 0.11%(-0.035)#1,444 |
| 52. | Rockville | 0.070% | 0.061%(+0.009)#52 | 0.11%(-0.036)#1,452 |
| 53. | Riverdale Park | 0.069% | 0.061%(+0.008)#53 | 0.11%(-0.038)#1,460 |
| 54. | Eldersburg | 0.066% | 0.061%(+0.005)#54 | 0.11%(-0.040)#1,478 |
| 55. | Montgomery Village | 0.060% | 0.061%(-0.000)#55 | 0.11%(-0.046)#1,514 |
| 56. | Clarksburg | 0.056% | 0.061%(-0.004)#56 | 0.11%(-0.050)#1,543 |
| 57. | Redland | 0.055% | 0.061%(-0.006)#57 | 0.11%(-0.052)#1,552 |
| 58. | Adelphi | 0.053% | 0.061%(-0.007)#58 | 0.11%(-0.053)#1,556 |
| 59. | Bethesda | 0.042% | 0.061%(-0.018)#59 | 0.11%(-0.064)#1,621 |
| 60. | Towson | 0.042% | 0.061%(-0.019)#60 | 0.11%(-0.065)#1,629 |
| 61. | Germantown | 0.041% | 0.061%(-0.020)#61 | 0.11%(-0.065)#1,634 |
| 62. | Westminster | 0.035% | 0.061%(-0.026)#62 | 0.11%(-0.071)#1,685 |
| 63. | North Bethesda | 0.028% | 0.061%(-0.032)#63 | 0.11%(-0.078)#1,735 |
| 64. | Crofton | 0.027% | 0.061%(-0.033)#64 | 0.11%(-0.079)#1,746 |
| 65. | Cloverly | 0.012% | 0.061%(-0.048)#65 | 0.11%(-0.094)#1,876 |
| 66. | Baltimore | 0.0032% | 0.061%(-0.057)#66 | 0.11%(-0.103)#1,937 |
Common Questions
What are the Top 10 Cities with the Highest Percentage of Japanese Population in Maryland?
Top 10 Cities with the Highest Percentage of Japanese Population in Maryland are:
#1
16.30%
#2
2.35%
#3
2.02%
#4
1.62%
#5
1.34%
#6
1.26%
#7
1.06%
#8
0.99%
#9
0.72%
#10
0.69%
What city has the Highest Percentage of Japanese Population in Maryland?
Clear Spring has the Highest Percentage of Japanese Population in Maryland with 16.30%.
What is the Percentage of Japanese Population in the State of Maryland?
Percentage of Japanese Population in Maryland is 0.061%.
What is the Percentage of Japanese Population in the United States?
Percentage of Japanese Population in the United States is 0.11%.