Cities with the Most Immigrants from El Salvador in Maryland
RELATED REPORTS & OPTIONS
El Salvador
Maryland
Compare Cities
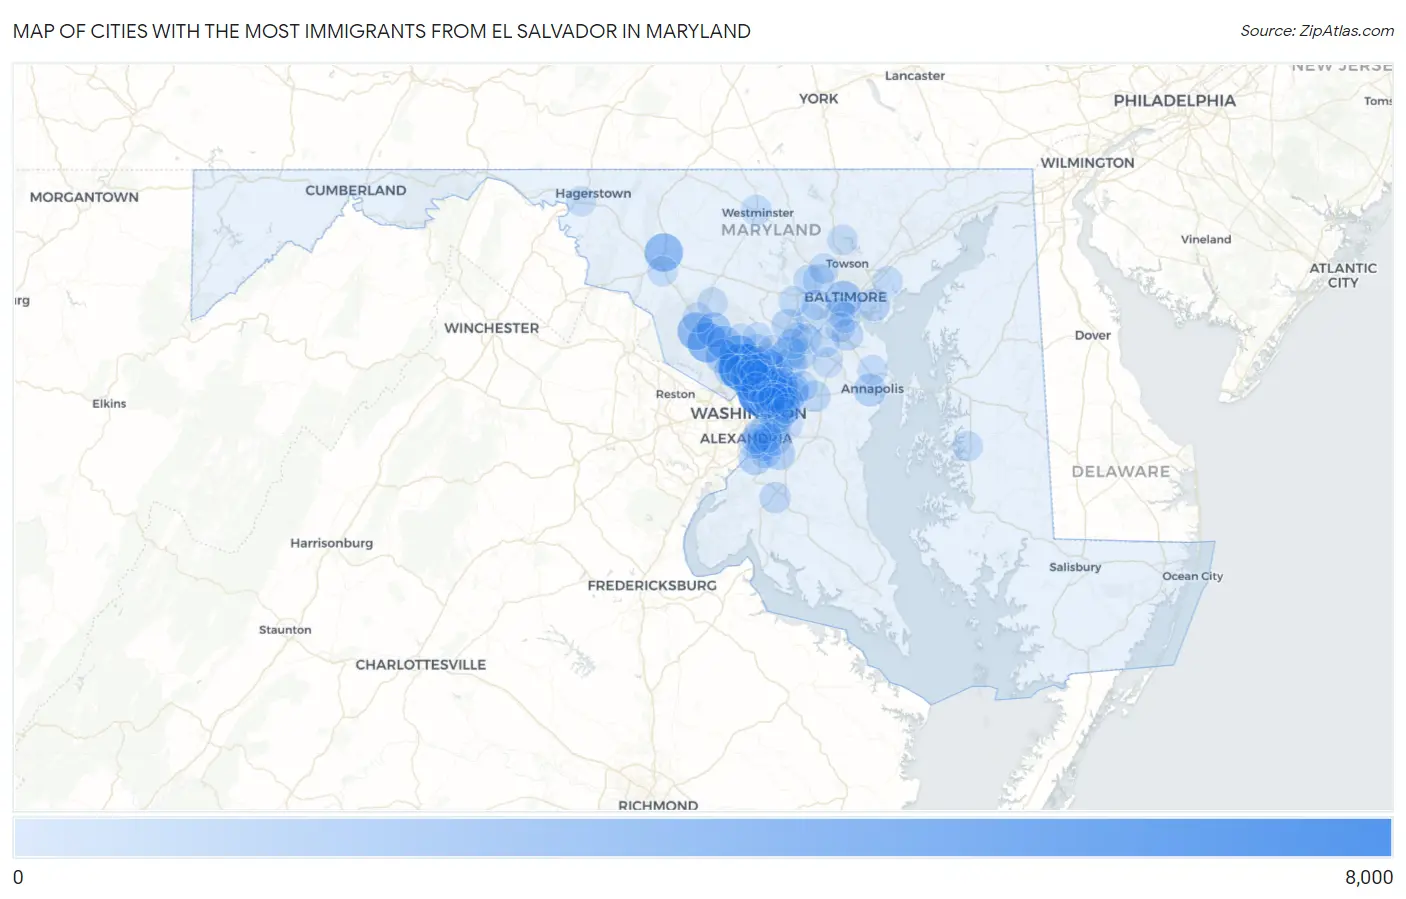
Map of Cities with the Most Immigrants from El Salvador in Maryland
0
8,000
Cities with the Most Immigrants from El Salvador in Maryland
| City | El Salvador | vs State | vs National | |
| 1. | Chillum | 7,493 | 115,412(6.49%)#1 | 1,408,349(0.53%)#12 |
| 2. | Wheaton | 6,766 | 115,412(5.86%)#2 | 1,408,349(0.48%)#17 |
| 3. | Langley Park | 3,886 | 115,412(3.37%)#3 | 1,408,349(0.28%)#40 |
| 4. | Gaithersburg | 3,792 | 115,412(3.29%)#4 | 1,408,349(0.27%)#42 |
| 5. | Aspen Hill | 3,668 | 115,412(3.18%)#5 | 1,408,349(0.26%)#48 |
| 6. | East Riverdale | 3,638 | 115,412(3.15%)#6 | 1,408,349(0.26%)#50 |
| 7. | Silver Spring | 3,605 | 115,412(3.12%)#7 | 1,408,349(0.26%)#53 |
| 8. | Frederick | 3,238 | 115,412(2.81%)#8 | 1,408,349(0.23%)#58 |
| 9. | Germantown | 2,963 | 115,412(2.57%)#9 | 1,408,349(0.21%)#67 |
| 10. | Adelphi | 2,778 | 115,412(2.41%)#10 | 1,408,349(0.20%)#74 |
| 11. | Hyattsville | 2,686 | 115,412(2.33%)#11 | 1,408,349(0.19%)#78 |
| 12. | Baltimore | 2,294 | 115,412(1.99%)#12 | 1,408,349(0.16%)#94 |
| 13. | Beltsville | 2,023 | 115,412(1.75%)#13 | 1,408,349(0.14%)#111 |
| 14. | Montgomery Village | 1,957 | 115,412(1.70%)#14 | 1,408,349(0.14%)#115 |
| 15. | Glenmont | 1,863 | 115,412(1.61%)#15 | 1,408,349(0.13%)#118 |
| 16. | Rockville | 1,809 | 115,412(1.57%)#16 | 1,408,349(0.13%)#128 |
| 17. | Landover | 1,596 | 115,412(1.38%)#17 | 1,408,349(0.11%)#140 |
| 18. | Calverton | 1,557 | 115,412(1.35%)#18 | 1,408,349(0.11%)#149 |
| 19. | Laurel | 1,527 | 115,412(1.32%)#19 | 1,408,349(0.11%)#152 |
| 20. | Redland | 1,469 | 115,412(1.27%)#20 | 1,408,349(0.10%)#155 |
| 21. | Glassmanor | 1,445 | 115,412(1.25%)#21 | 1,408,349(0.10%)#156 |
| 22. | Woodlawn Cdp Prince George S County | 1,436 | 115,412(1.24%)#22 | 1,408,349(0.10%)#157 |
| 23. | Seabrook | 1,354 | 115,412(1.17%)#23 | 1,408,349(0.10%)#167 |
| 24. | Fort Washington | 1,210 | 115,412(1.05%)#24 | 1,408,349(0.09%)#190 |
| 25. | New Carrollton | 1,179 | 115,412(1.02%)#25 | 1,408,349(0.08%)#198 |
| 26. | Annapolis | 1,159 | 115,412(1.00%)#26 | 1,408,349(0.08%)#200 |
| 27. | Dundalk | 1,126 | 115,412(0.98%)#27 | 1,408,349(0.08%)#209 |
| 28. | Clinton | 1,119 | 115,412(0.97%)#28 | 1,408,349(0.08%)#211 |
| 29. | Flower Hill | 1,111 | 115,412(0.96%)#29 | 1,408,349(0.08%)#213 |
| 30. | Oxon Hill | 977 | 115,412(0.85%)#30 | 1,408,349(0.07%)#230 |
| 31. | Columbia | 971 | 115,412(0.84%)#31 | 1,408,349(0.07%)#232 |
| 32. | Riverdale Park | 906 | 115,412(0.79%)#32 | 1,408,349(0.06%)#247 |
| 33. | North Bethesda | 877 | 115,412(0.76%)#33 | 1,408,349(0.06%)#252 |
| 34. | Mount Rainier | 860 | 115,412(0.75%)#34 | 1,408,349(0.06%)#254 |
| 35. | Lanham | 797 | 115,412(0.69%)#35 | 1,408,349(0.06%)#272 |
| 36. | Friendly | 776 | 115,412(0.67%)#36 | 1,408,349(0.06%)#277 |
| 37. | College Park | 764 | 115,412(0.66%)#37 | 1,408,349(0.05%)#282 |
| 38. | South Laurel | 761 | 115,412(0.66%)#38 | 1,408,349(0.05%)#283 |
| 39. | Camp Springs | 750 | 115,412(0.65%)#39 | 1,408,349(0.05%)#287 |
| 40. | Woodlawn Cdp Baltimore County | 747 | 115,412(0.65%)#40 | 1,408,349(0.05%)#288 |
| 41. | Glen Burnie | 738 | 115,412(0.64%)#41 | 1,408,349(0.05%)#293 |
| 42. | Cloverly | 737 | 115,412(0.64%)#42 | 1,408,349(0.05%)#294 |
| 43. | Brentwood | 728 | 115,412(0.63%)#43 | 1,408,349(0.05%)#295 |
| 44. | Fairland | 720 | 115,412(0.62%)#44 | 1,408,349(0.05%)#298 |
| 45. | Lochearn | 686 | 115,412(0.59%)#45 | 1,408,349(0.05%)#305 |
| 46. | Berwyn Heights | 634 | 115,412(0.55%)#46 | 1,408,349(0.05%)#322 |
| 47. | Bowie | 621 | 115,412(0.54%)#47 | 1,408,349(0.04%)#329 |
| 48. | Forest Glen | 608 | 115,412(0.53%)#48 | 1,408,349(0.04%)#336 |
| 49. | Greenbelt | 607 | 115,412(0.53%)#49 | 1,408,349(0.04%)#338 |
| 50. | Waldorf | 578 | 115,412(0.50%)#50 | 1,408,349(0.04%)#349 |
| 51. | White Oak | 538 | 115,412(0.47%)#51 | 1,408,349(0.04%)#380 |
| 52. | Maryland City | 479 | 115,412(0.42%)#52 | 1,408,349(0.03%)#415 |
| 53. | Suitland | 447 | 115,412(0.39%)#53 | 1,408,349(0.03%)#444 |
| 54. | Brooklyn Park | 420 | 115,412(0.36%)#54 | 1,408,349(0.03%)#459 |
| 55. | North Kensington | 420 | 115,412(0.36%)#55 | 1,408,349(0.03%)#460 |
| 56. | Ilchester | 401 | 115,412(0.35%)#56 | 1,408,349(0.03%)#491 |
| 57. | Cockeysville | 399 | 115,412(0.35%)#57 | 1,408,349(0.03%)#492 |
| 58. | Colesville | 386 | 115,412(0.33%)#58 | 1,408,349(0.03%)#514 |
| 59. | Milford Mill | 377 | 115,412(0.33%)#59 | 1,408,349(0.03%)#524 |
| 60. | Capitol Heights | 375 | 115,412(0.32%)#60 | 1,408,349(0.03%)#528 |
| 61. | Coral Hills | 368 | 115,412(0.32%)#61 | 1,408,349(0.03%)#538 |
| 62. | Hillandale | 360 | 115,412(0.31%)#62 | 1,408,349(0.03%)#546 |
| 63. | Arnold | 347 | 115,412(0.30%)#63 | 1,408,349(0.02%)#565 |
| 64. | Easton | 347 | 115,412(0.30%)#64 | 1,408,349(0.02%)#566 |
| 65. | Glenn Dale | 344 | 115,412(0.30%)#65 | 1,408,349(0.02%)#569 |
| 66. | Edmonston | 343 | 115,412(0.30%)#66 | 1,408,349(0.02%)#571 |
| 67. | Westminster | 339 | 115,412(0.29%)#67 | 1,408,349(0.02%)#577 |
| 68. | Kemp Mill | 338 | 115,412(0.29%)#68 | 1,408,349(0.02%)#580 |
| 69. | Ellicott City | 331 | 115,412(0.29%)#69 | 1,408,349(0.02%)#586 |
| 70. | Middle River | 329 | 115,412(0.29%)#70 | 1,408,349(0.02%)#593 |
| 71. | North Laurel | 329 | 115,412(0.29%)#71 | 1,408,349(0.02%)#595 |
| 72. | Ballenger Creek | 329 | 115,412(0.29%)#72 | 1,408,349(0.02%)#596 |
| 73. | Bladensburg | 328 | 115,412(0.28%)#73 | 1,408,349(0.02%)#601 |
| 74. | Hillcrest Heights | 322 | 115,412(0.28%)#74 | 1,408,349(0.02%)#613 |
| 75. | Olney | 319 | 115,412(0.28%)#75 | 1,408,349(0.02%)#617 |
| 76. | Four Corners | 319 | 115,412(0.28%)#76 | 1,408,349(0.02%)#618 |
| 77. | Pikesville | 316 | 115,412(0.27%)#77 | 1,408,349(0.02%)#623 |
| 78. | Catonsville | 314 | 115,412(0.27%)#78 | 1,408,349(0.02%)#625 |
| 79. | Jessup | 308 | 115,412(0.27%)#79 | 1,408,349(0.02%)#630 |
| 80. | Clarksburg | 305 | 115,412(0.26%)#80 | 1,408,349(0.02%)#632 |
| 81. | Damascus | 304 | 115,412(0.26%)#81 | 1,408,349(0.02%)#636 |
| 82. | Baltimore Highlands | 303 | 115,412(0.26%)#82 | 1,408,349(0.02%)#641 |
| 83. | Landover Hills | 302 | 115,412(0.26%)#83 | 1,408,349(0.02%)#645 |
| 84. | Peppermill Village | 299 | 115,412(0.26%)#84 | 1,408,349(0.02%)#652 |
| 85. | Forestville | 297 | 115,412(0.26%)#85 | 1,408,349(0.02%)#655 |
| 86. | Colmar Manor | 289 | 115,412(0.25%)#86 | 1,408,349(0.02%)#666 |
| 87. | Halfway | 283 | 115,412(0.25%)#87 | 1,408,349(0.02%)#676 |
| 88. | National Harbor | 280 | 115,412(0.24%)#88 | 1,408,349(0.02%)#682 |
| 89. | Odenton | 277 | 115,412(0.24%)#89 | 1,408,349(0.02%)#687 |
| 90. | Savage | 274 | 115,412(0.24%)#90 | 1,408,349(0.02%)#696 |
| 91. | Takoma Park | 269 | 115,412(0.23%)#91 | 1,408,349(0.02%)#703 |
| 92. | Temple Hills | 263 | 115,412(0.23%)#92 | 1,408,349(0.02%)#712 |
| 93. | Summerfield | 255 | 115,412(0.22%)#93 | 1,408,349(0.02%)#728 |
| 94. | Forest Heights | 245 | 115,412(0.21%)#94 | 1,408,349(0.02%)#749 |
| 95. | Ashton Sandy Spring | 240 | 115,412(0.21%)#95 | 1,408,349(0.02%)#756 |
| 96. | Burnt Mills | 240 | 115,412(0.21%)#96 | 1,408,349(0.02%)#757 |
| 97. | Severn | 218 | 115,412(0.19%)#97 | 1,408,349(0.02%)#810 |
| 98. | Glenarden | 205 | 115,412(0.18%)#98 | 1,408,349(0.01%)#837 |
| 99. | Ferndale | 182 | 115,412(0.16%)#99 | 1,408,349(0.01%)#896 |
| 100. | Burtonsville | 178 | 115,412(0.15%)#100 | 1,408,349(0.01%)#917 |
Common Questions
What are the Top 10 Cities with the Most Immigrants from El Salvador in Maryland?
Top 10 Cities with the Most Immigrants from El Salvador in Maryland are:
#1
7,493
#2
6,766
#3
3,886
#4
3,792
#5
3,668
#6
3,638
#7
3,605
#8
3,238
#9
2,963
#10
2,778
What city has the Most Immigrants from El Salvador in Maryland?
Chillum has the Most Immigrants from El Salvador in Maryland with 7,493.
What is the Total Immigrants from El Salvador in the State of Maryland?
Total Immigrants from El Salvador in Maryland is 115,412.
What is the Total Immigrants from El Salvador in the United States?
Total Immigrants from El Salvador in the United States is 1,408,349.