Cities with the Highest Percentage of Filipino Population in Maryland
RELATED REPORTS & OPTIONS
Filipino
Maryland
Compare Cities
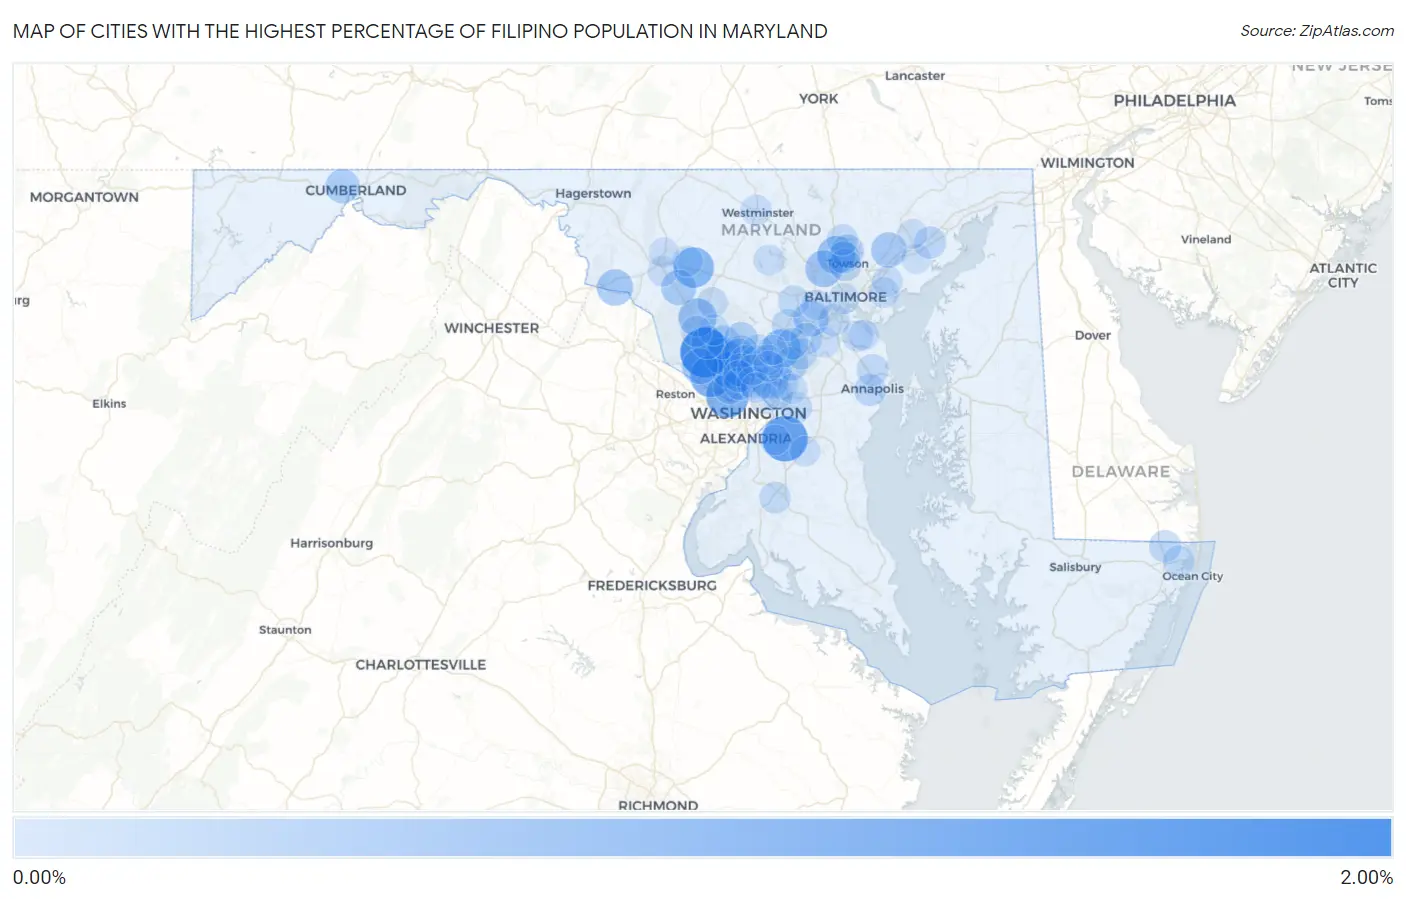
Map of Cities with the Highest Percentage of Filipino Population in Maryland
0.00%
2.00%
Cities with the Highest Percentage of Filipino Population in Maryland
| City | Filipino | vs State | vs National | |
| 1. | North Potomac | 1.88% | 0.10%(+1.78)#1 | 0.085%(+1.80)#67 |
| 2. | Andrews Afb | 1.48% | 0.10%(+1.38)#2 | 0.085%(+1.40)#95 |
| 3. | Brookmont | 1.21% | 0.10%(+1.11)#3 | 0.085%(+1.12)#146 |
| 4. | Potomac | 1.13% | 0.10%(+1.03)#4 | 0.085%(+1.04)#156 |
| 5. | New Market | 0.98% | 0.10%(+0.877)#5 | 0.085%(+0.893)#192 |
| 6. | Burnt Mills | 0.90% | 0.10%(+0.803)#6 | 0.085%(+0.819)#214 |
| 7. | West Laurel | 0.81% | 0.10%(+0.707)#7 | 0.085%(+0.723)#249 |
| 8. | Clarksburg | 0.76% | 0.10%(+0.654)#8 | 0.085%(+0.670)#269 |
| 9. | Mays Chapel | 0.72% | 0.10%(+0.621)#9 | 0.085%(+0.637)#287 |
| 10. | North Bethesda | 0.66% | 0.10%(+0.562)#10 | 0.085%(+0.578)#314 |
| 11. | Pikesville | 0.64% | 0.10%(+0.539)#11 | 0.085%(+0.554)#333 |
| 12. | Rockville | 0.61% | 0.10%(+0.513)#12 | 0.085%(+0.529)#347 |
| 13. | Brunswick | 0.58% | 0.10%(+0.478)#13 | 0.085%(+0.494)#371 |
| 14. | Travilah | 0.54% | 0.10%(+0.443)#14 | 0.085%(+0.459)#397 |
| 15. | Kingsville | 0.49% | 0.10%(+0.394)#15 | 0.085%(+0.410)#429 |
| 16. | Flower Hill | 0.49% | 0.10%(+0.385)#16 | 0.085%(+0.400)#436 |
| 17. | Ilchester | 0.48% | 0.10%(+0.379)#17 | 0.085%(+0.395)#444 |
| 18. | Urbana | 0.48% | 0.10%(+0.378)#18 | 0.085%(+0.394)#446 |
| 19. | La Vale | 0.39% | 0.10%(+0.290)#19 | 0.085%(+0.306)#535 |
| 20. | Leisure World | 0.37% | 0.10%(+0.267)#20 | 0.085%(+0.283)#562 |
| 21. | Green Valley | 0.36% | 0.10%(+0.261)#21 | 0.085%(+0.277)#568 |
| 22. | Redland | 0.34% | 0.10%(+0.243)#22 | 0.085%(+0.259)#587 |
| 23. | Forest Glen | 0.31% | 0.10%(+0.205)#23 | 0.085%(+0.221)#642 |
| 24. | South Laurel | 0.31% | 0.10%(+0.205)#24 | 0.085%(+0.221)#643 |
| 25. | Gaithersburg | 0.30% | 0.10%(+0.204)#25 | 0.085%(+0.219)#647 |
| 26. | Olney | 0.30% | 0.10%(+0.200)#26 | 0.085%(+0.216)#654 |
| 27. | Timonium | 0.29% | 0.10%(+0.186)#27 | 0.085%(+0.202)#678 |
| 28. | College Park | 0.28% | 0.10%(+0.181)#28 | 0.085%(+0.197)#682 |
| 29. | Aspen Hill | 0.28% | 0.10%(+0.178)#29 | 0.085%(+0.193)#691 |
| 30. | Bethesda | 0.28% | 0.10%(+0.175)#30 | 0.085%(+0.191)#695 |
| 31. | North Kensington | 0.26% | 0.10%(+0.159)#31 | 0.085%(+0.175)#725 |
| 32. | Beltsville | 0.25% | 0.10%(+0.153)#32 | 0.085%(+0.169)#734 |
| 33. | Chevy Chase | 0.23% | 0.10%(+0.134)#33 | 0.085%(+0.150)#776 |
| 34. | Towson | 0.21% | 0.10%(+0.109)#34 | 0.085%(+0.125)#826 |
| 35. | Riverside | 0.20% | 0.10%(+0.102)#35 | 0.085%(+0.118)#845 |
| 36. | Glenmont | 0.19% | 0.10%(+0.092)#36 | 0.085%(+0.108)#882 |
| 37. | Bishopville | 0.18% | 0.10%(+0.082)#37 | 0.085%(+0.098)#907 |
| 38. | Lutherville | 0.18% | 0.10%(+0.081)#38 | 0.085%(+0.097)#908 |
| 39. | Annapolis | 0.18% | 0.10%(+0.079)#39 | 0.085%(+0.094)#917 |
| 40. | Columbia | 0.17% | 0.10%(+0.074)#40 | 0.085%(+0.090)#931 |
| 41. | Greenbelt | 0.17% | 0.10%(+0.070)#41 | 0.085%(+0.086)#945 |
| 42. | Jessup | 0.17% | 0.10%(+0.066)#42 | 0.085%(+0.082)#959 |
| 43. | Arnold | 0.17% | 0.10%(+0.064)#43 | 0.085%(+0.080)#965 |
| 44. | South Kensington | 0.16% | 0.10%(+0.055)#44 | 0.085%(+0.070)#995 |
| 45. | Linthicum | 0.15% | 0.10%(+0.048)#45 | 0.085%(+0.064)#1,022 |
| 46. | Ellicott City | 0.14% | 0.10%(+0.041)#46 | 0.085%(+0.057)#1,051 |
| 47. | Colesville | 0.14% | 0.10%(+0.038)#47 | 0.085%(+0.054)#1,066 |
| 48. | Ocean Pines | 0.14% | 0.10%(+0.037)#48 | 0.085%(+0.053)#1,069 |
| 49. | Silver Spring | 0.14% | 0.10%(+0.036)#49 | 0.085%(+0.052)#1,076 |
| 50. | Maryland City | 0.13% | 0.10%(+0.025)#50 | 0.085%(+0.041)#1,130 |
| 51. | Waldorf | 0.12% | 0.10%(+0.021)#51 | 0.085%(+0.037)#1,158 |
| 52. | North Laurel | 0.12% | 0.10%(+0.018)#52 | 0.085%(+0.034)#1,173 |
| 53. | Cockeysville | 0.12% | 0.10%(+0.015)#53 | 0.085%(+0.031)#1,184 |
| 54. | Cloverly | 0.12% | 0.10%(+0.015)#54 | 0.085%(+0.031)#1,186 |
| 55. | Lake Arbor | 0.11% | 0.10%(+0.013)#55 | 0.085%(+0.029)#1,191 |
| 56. | Adelphi | 0.10% | 0.10%(-0.000)#56 | 0.085%(+0.016)#1,269 |
| 57. | Montgomery Village | 0.083% | 0.10%(-0.017)#57 | 0.085%(-0.001)#1,364 |
| 58. | East Riverdale | 0.083% | 0.10%(-0.018)#58 | 0.085%(-0.002)#1,367 |
| 59. | Germantown | 0.081% | 0.10%(-0.020)#59 | 0.085%(-0.004)#1,377 |
| 60. | Baltimore | 0.081% | 0.10%(-0.020)#60 | 0.085%(-0.004)#1,378 |
| 61. | Essex | 0.081% | 0.10%(-0.020)#61 | 0.085%(-0.004)#1,381 |
| 62. | Westminster | 0.080% | 0.10%(-0.021)#62 | 0.085%(-0.005)#1,391 |
| 63. | Kemp Mill | 0.078% | 0.10%(-0.023)#63 | 0.085%(-0.007)#1,401 |
| 64. | Fairland | 0.069% | 0.10%(-0.032)#64 | 0.085%(-0.016)#1,458 |
| 65. | Middle River | 0.067% | 0.10%(-0.033)#65 | 0.085%(-0.017)#1,471 |
| 66. | Pasadena | 0.065% | 0.10%(-0.035)#66 | 0.085%(-0.020)#1,491 |
| 67. | Damascus | 0.059% | 0.10%(-0.041)#67 | 0.085%(-0.025)#1,530 |
| 68. | Eldersburg | 0.059% | 0.10%(-0.041)#68 | 0.085%(-0.026)#1,532 |
| 69. | Linganore | 0.059% | 0.10%(-0.042)#69 | 0.085%(-0.026)#1,535 |
| 70. | Riviera Beach | 0.058% | 0.10%(-0.043)#70 | 0.085%(-0.027)#1,549 |
| 71. | Calverton | 0.049% | 0.10%(-0.052)#71 | 0.085%(-0.036)#1,634 |
| 72. | Camp Springs | 0.047% | 0.10%(-0.053)#72 | 0.085%(-0.038)#1,647 |
| 73. | Mount Rainier | 0.036% | 0.10%(-0.064)#73 | 0.085%(-0.048)#1,735 |
| 74. | Takoma Park | 0.029% | 0.10%(-0.072)#74 | 0.085%(-0.056)#1,797 |
| 75. | Catonsville | 0.028% | 0.10%(-0.073)#75 | 0.085%(-0.057)#1,803 |
| 76. | Ballenger Creek | 0.025% | 0.10%(-0.076)#76 | 0.085%(-0.060)#1,833 |
| 77. | Frederick | 0.024% | 0.10%(-0.077)#77 | 0.085%(-0.061)#1,839 |
| 78. | Marlton | 0.020% | 0.10%(-0.081)#78 | 0.085%(-0.065)#1,886 |
| 79. | Edgewood | 0.016% | 0.10%(-0.085)#79 | 0.085%(-0.069)#1,924 |
| 80. | Bel Air South | 0.016% | 0.10%(-0.085)#80 | 0.085%(-0.069)#1,925 |
| 81. | Burtonsville | 0.0097% | 0.10%(-0.091)#81 | 0.085%(-0.075)#1,977 |
| 82. | Seabrook | 0.0052% | 0.10%(-0.096)#82 | 0.085%(-0.080)#2,008 |
| 83. | Severn | 0.0035% | 0.10%(-0.097)#83 | 0.085%(-0.081)#2,017 |
Common Questions
What are the Top 10 Cities with the Highest Percentage of Filipino Population in Maryland?
Top 10 Cities with the Highest Percentage of Filipino Population in Maryland are:
#1
1.88%
#2
1.48%
#3
1.21%
#4
1.13%
#5
0.98%
#6
0.81%
#7
0.76%
#8
0.72%
#9
0.66%
#10
0.64%
What city has the Highest Percentage of Filipino Population in Maryland?
North Potomac has the Highest Percentage of Filipino Population in Maryland with 1.88%.
What is the Percentage of Filipino Population in the State of Maryland?
Percentage of Filipino Population in Maryland is 0.10%.
What is the Percentage of Filipino Population in the United States?
Percentage of Filipino Population in the United States is 0.085%.