Cities with the Fewest Births per 1,000 Women Over the Age of 35 in Maryland
RELATED REPORTS & OPTIONS
Lowest Birth Rate | Women 35+
Maryland
Compare Cities
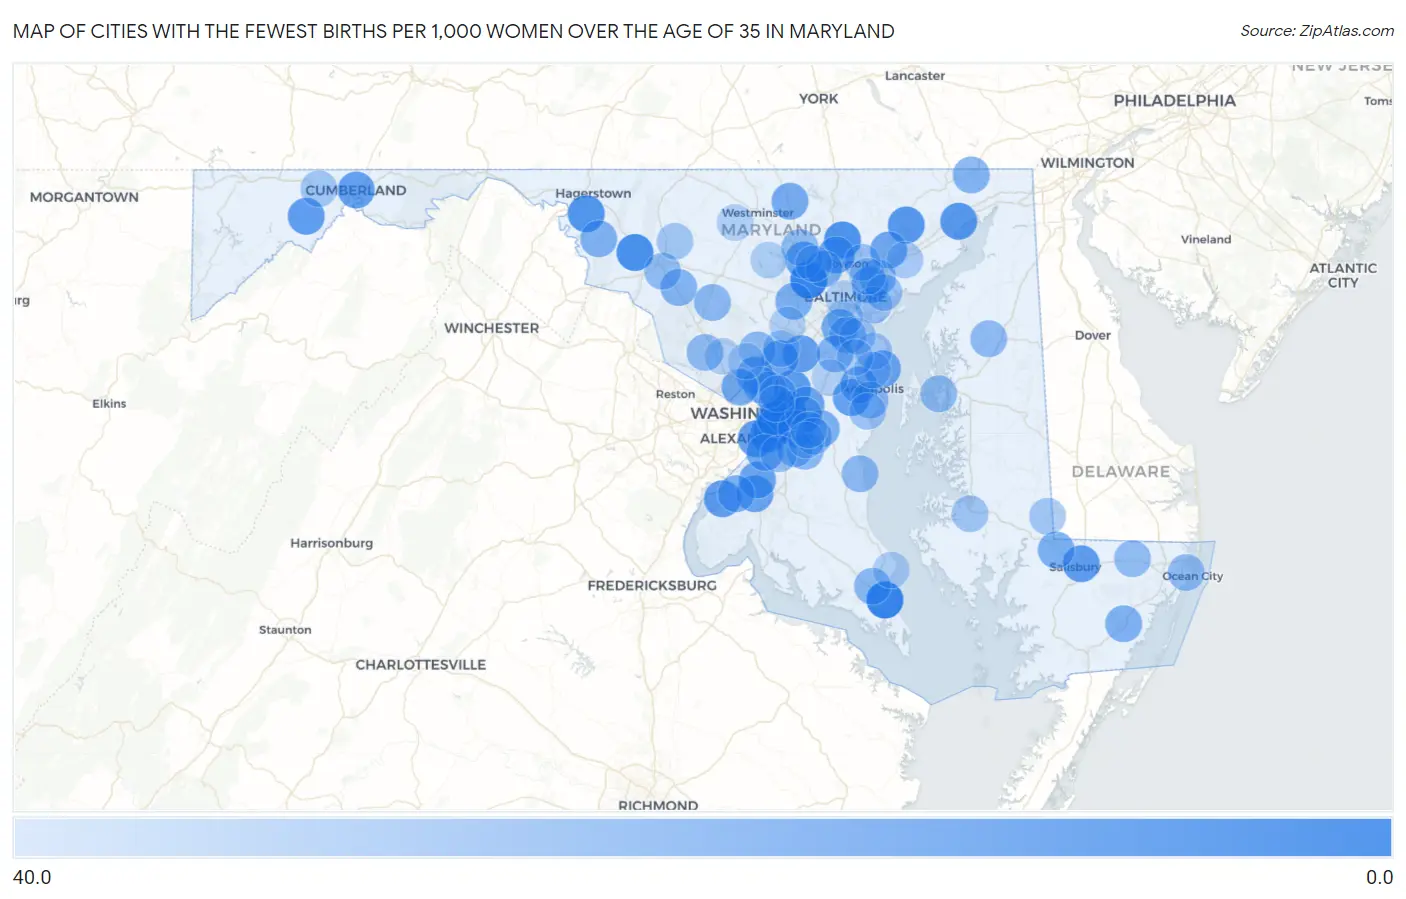
Map of Cities with the Fewest Births per 1,000 Women Over the Age of 35 in Maryland
40.0
0.0
Cities with the Fewest Births per 1,000 Women Over the Age of 35 in Maryland
| City | Births / 1,000 Women | vs State | vs National | |
| 1. | Milford Mill | 3.0 | 38.0(-35.0)#1 | 32.0(-29.0)#33 |
| 2. | Lexington Park | 3.0 | 38.0(-35.0)#2 | 32.0(-29.0)#50 |
| 3. | Middletown | 7.0 | 38.0(-31.0)#3 | 32.0(-25.0)#308 |
| 4. | Cockeysville | 8.0 | 38.0(-30.0)#4 | 32.0(-24.0)#351 |
| 5. | Silver Hill | 9.0 | 38.0(-29.0)#5 | 32.0(-23.0)#499 |
| 6. | St James | 9.0 | 38.0(-29.0)#6 | 32.0(-23.0)#503 |
| 7. | Havre De Grace | 10.0 | 38.0(-28.0)#7 | 32.0(-22.0)#566 |
| 8. | Bel Air | 10.0 | 38.0(-28.0)#8 | 32.0(-22.0)#590 |
| 9. | Marlow Heights | 10.0 | 38.0(-28.0)#9 | 32.0(-22.0)#618 |
| 10. | Peppermill Village | 10.0 | 38.0(-28.0)#10 | 32.0(-22.0)#621 |
| 11. | Seabrook | 11.0 | 38.0(-27.0)#11 | 32.0(-21.0)#678 |
| 12. | Salisbury | 12.0 | 38.0(-26.0)#12 | 32.0(-20.0)#806 |
| 13. | Suitland | 12.0 | 38.0(-26.0)#13 | 32.0(-20.0)#816 |
| 14. | Indian Head | 12.0 | 38.0(-26.0)#14 | 32.0(-20.0)#888 |
| 15. | Forest Heights | 12.0 | 38.0(-26.0)#15 | 32.0(-20.0)#891 |
| 16. | Lonaconing | 12.0 | 38.0(-26.0)#16 | 32.0(-20.0)#906 |
| 17. | Cumberland | 13.0 | 38.0(-25.0)#17 | 32.0(-19.0)#949 |
| 18. | Maryland City | 13.0 | 38.0(-25.0)#18 | 32.0(-19.0)#952 |
| 19. | Summerfield | 13.0 | 38.0(-25.0)#19 | 32.0(-19.0)#958 |
| 20. | Mays Chapel | 13.0 | 38.0(-25.0)#20 | 32.0(-19.0)#972 |
| 21. | Coral Hills | 13.0 | 38.0(-25.0)#21 | 32.0(-19.0)#984 |
| 22. | Riva | 13.0 | 38.0(-25.0)#22 | 32.0(-19.0)#1,005 |
| 23. | Owings Mills | 14.0 | 38.0(-24.0)#23 | 32.0(-18.0)#1,061 |
| 24. | Bensville | 14.0 | 38.0(-24.0)#24 | 32.0(-18.0)#1,094 |
| 25. | Accokeek | 14.0 | 38.0(-24.0)#25 | 32.0(-18.0)#1,099 |
| 26. | Konterra | 14.0 | 38.0(-24.0)#26 | 32.0(-18.0)#1,145 |
| 27. | Cape St Claire | 15.0 | 38.0(-23.0)#27 | 32.0(-17.0)#1,240 |
| 28. | Kingsville | 15.0 | 38.0(-23.0)#28 | 32.0(-17.0)#1,267 |
| 29. | Woodmore | 15.0 | 38.0(-23.0)#29 | 32.0(-17.0)#1,269 |
| 30. | Ferndale | 16.0 | 38.0(-22.0)#30 | 32.0(-16.0)#1,350 |
| 31. | Friendly | 16.0 | 38.0(-22.0)#31 | 32.0(-16.0)#1,365 |
| 32. | Four Corners | 16.0 | 38.0(-22.0)#32 | 32.0(-16.0)#1,384 |
| 33. | Rosedale | 17.0 | 38.0(-21.0)#33 | 32.0(-15.0)#1,505 |
| 34. | Parole | 17.0 | 38.0(-21.0)#34 | 32.0(-15.0)#1,508 |
| 35. | Westphalia | 17.0 | 38.0(-21.0)#35 | 32.0(-15.0)#1,522 |
| 36. | Hampstead | 17.0 | 38.0(-21.0)#36 | 32.0(-15.0)#1,556 |
| 37. | Ellicott City | 18.0 | 38.0(-20.0)#37 | 32.0(-14.0)#1,636 |
| 38. | Pikesville | 18.0 | 38.0(-20.0)#38 | 32.0(-14.0)#1,653 |
| 39. | Marlboro Meadows | 18.0 | 38.0(-20.0)#39 | 32.0(-14.0)#1,741 |
| 40. | Hebron | 18.0 | 38.0(-20.0)#40 | 32.0(-14.0)#1,785 |
| 41. | Glen Burnie | 19.0 | 38.0(-19.0)#41 | 32.0(-13.0)#1,807 |
| 42. | Kettering | 19.0 | 38.0(-19.0)#42 | 32.0(-13.0)#1,866 |
| 43. | Bryans Road | 19.0 | 38.0(-19.0)#43 | 32.0(-13.0)#1,887 |
| 44. | University Park | 19.0 | 38.0(-19.0)#44 | 32.0(-13.0)#1,920 |
| 45. | Snow Hill | 19.0 | 38.0(-19.0)#45 | 32.0(-13.0)#1,928 |
| 46. | Keedysville | 19.0 | 38.0(-19.0)#46 | 32.0(-13.0)#1,957 |
| 47. | Urbana | 20.0 | 38.0(-18.0)#47 | 32.0(-12.0)#2,032 |
| 48. | Gambrills | 20.0 | 38.0(-18.0)#48 | 32.0(-12.0)#2,088 |
| 49. | Rising Sun | 20.0 | 38.0(-18.0)#49 | 32.0(-12.0)#2,091 |
| 50. | Rossville | 21.0 | 38.0(-17.0)#50 | 32.0(-11.0)#2,195 |
| 51. | California | 21.0 | 38.0(-17.0)#51 | 32.0(-11.0)#2,204 |
| 52. | Marlton | 21.0 | 38.0(-17.0)#52 | 32.0(-11.0)#2,218 |
| 53. | North Potomac | 22.0 | 38.0(-16.0)#53 | 32.0(-10.00)#2,348 |
| 54. | Damascus | 22.0 | 38.0(-16.0)#54 | 32.0(-10.00)#2,365 |
| 55. | Cloverly | 22.0 | 38.0(-16.0)#55 | 32.0(-10.00)#2,367 |
| 56. | Annapolis Neck | 22.0 | 38.0(-16.0)#56 | 32.0(-10.00)#2,379 |
| 57. | Rosaryville | 22.0 | 38.0(-16.0)#57 | 32.0(-10.00)#2,382 |
| 58. | Chesapeake Beach | 22.0 | 38.0(-16.0)#58 | 32.0(-10.00)#2,405 |
| 59. | Church Hill | 22.0 | 38.0(-16.0)#59 | 32.0(-10.00)#2,464 |
| 60. | Reisterstown | 23.0 | 38.0(-15.0)#60 | 32.0(-9.00)#2,521 |
| 61. | Ballenger Creek | 23.0 | 38.0(-15.0)#61 | 32.0(-9.00)#2,529 |
| 62. | West Ocean City | 23.0 | 38.0(-15.0)#62 | 32.0(-9.00)#2,585 |
| 63. | Grasonville | 23.0 | 38.0(-15.0)#63 | 32.0(-9.00)#2,598 |
| 64. | Willards | 23.0 | 38.0(-15.0)#64 | 32.0(-9.00)#2,647 |
| 65. | Upper Marlboro | 23.0 | 38.0(-15.0)#65 | 32.0(-9.00)#2,659 |
| 66. | Dundalk | 24.0 | 38.0(-14.0)#66 | 32.0(-8.00)#2,690 |
| 67. | Clinton | 24.0 | 38.0(-14.0)#67 | 32.0(-8.00)#2,699 |
| 68. | Carney | 24.0 | 38.0(-14.0)#68 | 32.0(-8.00)#2,706 |
| 69. | Langley Park | 24.0 | 38.0(-14.0)#69 | 32.0(-8.00)#2,723 |
| 70. | Woodlawn Cdp Baltimore County | 25.0 | 38.0(-13.0)#70 | 32.0(-7.00)#2,889 |
| 71. | Essex | 25.0 | 38.0(-13.0)#71 | 32.0(-7.00)#2,891 |
| 72. | East Riverdale | 25.0 | 38.0(-13.0)#72 | 32.0(-7.00)#2,915 |
| 73. | Lake Shore | 26.0 | 38.0(-12.0)#73 | 32.0(-6.00)#3,074 |
| 74. | Cambridge | 26.0 | 38.0(-12.0)#74 | 32.0(-6.00)#3,086 |
| 75. | Mayo | 26.0 | 38.0(-12.0)#75 | 32.0(-6.00)#3,106 |
| 76. | Chevy Chase Section Five | 26.0 | 38.0(-12.0)#76 | 32.0(-6.00)#3,189 |
| 77. | Pasadena | 27.0 | 38.0(-11.0)#77 | 32.0(-5.00)#3,232 |
| 78. | Green Valley | 27.0 | 38.0(-11.0)#78 | 32.0(-5.00)#3,270 |
| 79. | Frostburg | 27.0 | 38.0(-11.0)#79 | 32.0(-5.00)#3,298 |
| 80. | Walkersville | 27.0 | 38.0(-11.0)#80 | 32.0(-5.00)#3,305 |
| 81. | West Laurel | 27.0 | 38.0(-11.0)#81 | 32.0(-5.00)#3,317 |
| 82. | Chevy Chase Section Three | 27.0 | 38.0(-11.0)#82 | 32.0(-5.00)#3,359 |
| 83. | Sharptown | 27.0 | 38.0(-11.0)#83 | 32.0(-5.00)#3,370 |
| 84. | Arnold | 28.0 | 38.0(-10.00)#84 | 32.0(-4.00)#3,421 |
| 85. | Joppatowne | 28.0 | 38.0(-10.00)#85 | 32.0(-4.00)#3,458 |
| 86. | Severna Park | 29.0 | 38.0(-9.00)#86 | 32.0(-3.00)#3,588 |
| 87. | Eldersburg | 29.0 | 38.0(-9.00)#87 | 32.0(-3.00)#3,597 |
| 88. | Chesapeake Ranch Estates | 29.0 | 38.0(-9.00)#88 | 32.0(-3.00)#3,629 |
| 89. | Cheverly | 29.0 | 38.0(-9.00)#89 | 32.0(-3.00)#3,649 |
| 90. | Queensland | 29.0 | 38.0(-9.00)#90 | 32.0(-3.00)#3,685 |
| 91. | Baltimore | 30.0 | 38.0(-8.00)#91 | 32.0(-2.00)#3,743 |
| 92. | Columbia | 30.0 | 38.0(-8.00)#92 | 32.0(-2.00)#3,755 |
| 93. | Rockville | 30.0 | 38.0(-8.00)#93 | 32.0(-2.00)#3,766 |
| 94. | Crofton | 30.0 | 38.0(-8.00)#94 | 32.0(-2.00)#3,790 |
| 95. | Overlea | 30.0 | 38.0(-8.00)#95 | 32.0(-2.00)#3,824 |
| 96. | Garrison | 30.0 | 38.0(-8.00)#96 | 32.0(-2.00)#3,832 |
| 97. | Marlboro Village | 30.0 | 38.0(-8.00)#97 | 32.0(-2.00)#3,834 |
| 98. | New Windsor | 30.0 | 38.0(-8.00)#98 | 32.0(-2.00)#3,911 |
| 99. | Glenmont | 31.0 | 38.0(-7.00)#99 | 32.0(-1.000)#4,008 |
| 100. | Brooklyn Park | 31.0 | 38.0(-7.00)#100 | 32.0(-1.000)#4,010 |
Common Questions
What are the Top 10 Cities with the Fewest Births per 1,000 Women Over the Age of 35 in Maryland?
Top 10 Cities with the Fewest Births per 1,000 Women Over the Age of 35 in Maryland are:
#1
3.0
#2
3.0
#3
7.0
#4
8.0
#5
9.0
#6
9.0
#7
10.0
#8
10.0
#9
10.0
#10
10.0
What city has the Fewest Births per 1,000 Women Over the Age of 35 in Maryland?
Milford Mill has the Fewest Births per 1,000 Women Over the Age of 35 in Maryland with 3.0.
What is the Number of Births per 1,000 Women Over the Age of 35 in the State of Maryland?
Number of Births per 1,000 Women Over the Age of 35 in Maryland is 38.0.
What is the Number of Births per 1,000 Women Over the Age of 35 in the United States?
Number of Births per 1,000 Women Over the Age of 35 in the United States is 32.0.