Cumberland, MD Map & Demographics
Cumberland Map
Cumberland Overview
$29,863
PER CAPITA INCOME
$63,672
AVG FAMILY INCOME
$45,915
AVG HOUSEHOLD INCOME
23.6%
WAGE / INCOME GAP [ % ]
76.4¢/ $1
WAGE / INCOME GAP [ $ ]
$9,061
FAMILY INCOME DEFICIT
0.50
INEQUALITY / GINI INDEX
19,041
TOTAL POPULATION
9,505
MALE POPULATION
9,536
FEMALE POPULATION
99.67
MALES / 100 FEMALES
100.33
FEMALES / 100 MALES
41.8
MEDIAN AGE
2.9
AVG FAMILY SIZE
2.1
AVG HOUSEHOLD SIZE
7,953
LABOR FORCE [ PEOPLE ]
50.9%
PERCENT IN LABOR FORCE
9.1%
UNEMPLOYMENT RATE
Cumberland Zip Codes
Income in Cumberland
Income Overview in Cumberland
Per Capita Income in Cumberland is $29,863, while median incomes of families and households are $63,672 and $45,915 respectively.
| Characteristic | Number | Measure |
| Per Capita Income | 19,041 | $29,863 |
| Median Family Income | 4,320 | $63,672 |
| Mean Family Income | 4,320 | $87,905 |
| Median Household Income | 8,343 | $45,915 |
| Mean Household Income | 8,343 | $66,628 |
| Income Deficit | 4,320 | $9,061 |
| Wage / Income Gap (%) | 19,041 | 23.55% |
| Wage / Income Gap ($) | 19,041 | 76.45¢ per $1 |
| Gini / Inequality Index | 19,041 | 0.50 |
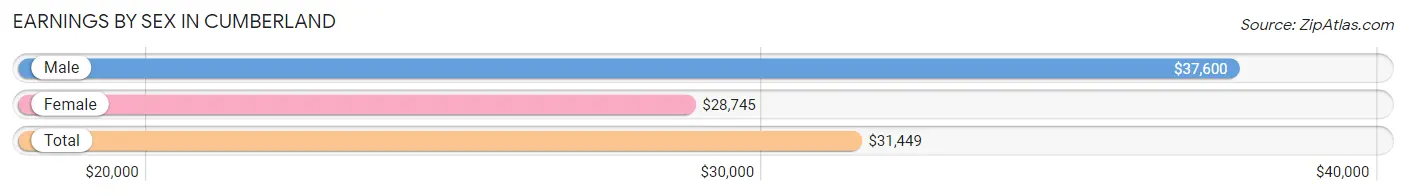
Earnings by Sex in Cumberland
Average Earnings in Cumberland are $31,449, $37,600 for men and $28,745 for women, a difference of 23.5%.
| Sex | Number | Average Earnings |
| Male | 4,462 (53.9%) | $37,600 |
| Female | 3,818 (46.1%) | $28,745 |
| Total | 8,280 (100.0%) | $31,449 |
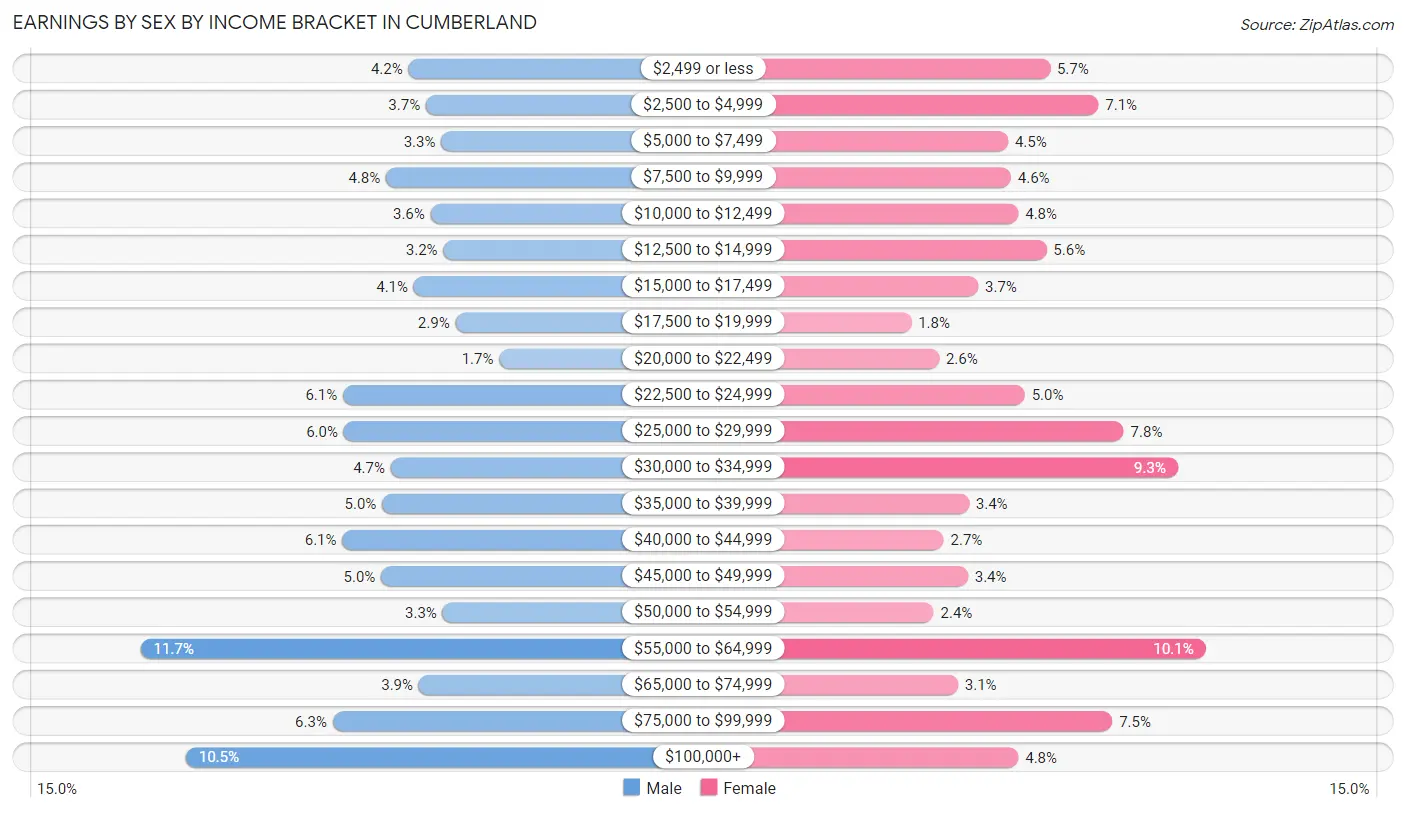
Earnings by Sex by Income Bracket in Cumberland
The most common earnings brackets in Cumberland are $55,000 to $64,999 for men (524 | 11.7%) and $55,000 to $64,999 for women (385 | 10.1%).
| Income | Male | Female |
| $2,499 or less | 188 (4.2%) | 218 (5.7%) |
| $2,500 to $4,999 | 166 (3.7%) | 270 (7.1%) |
| $5,000 to $7,499 | 147 (3.3%) | 173 (4.5%) |
| $7,500 to $9,999 | 216 (4.8%) | 176 (4.6%) |
| $10,000 to $12,499 | 160 (3.6%) | 184 (4.8%) |
| $12,500 to $14,999 | 144 (3.2%) | 214 (5.6%) |
| $15,000 to $17,499 | 181 (4.1%) | 141 (3.7%) |
| $17,500 to $19,999 | 129 (2.9%) | 69 (1.8%) |
| $20,000 to $22,499 | 74 (1.7%) | 99 (2.6%) |
| $22,500 to $24,999 | 270 (6.0%) | 191 (5.0%) |
| $25,000 to $29,999 | 269 (6.0%) | 297 (7.8%) |
| $30,000 to $34,999 | 210 (4.7%) | 355 (9.3%) |
| $35,000 to $39,999 | 221 (5.0%) | 131 (3.4%) |
| $40,000 to $44,999 | 271 (6.1%) | 104 (2.7%) |
| $45,000 to $49,999 | 222 (5.0%) | 130 (3.4%) |
| $50,000 to $54,999 | 145 (3.3%) | 93 (2.4%) |
| $55,000 to $64,999 | 524 (11.7%) | 385 (10.1%) |
| $65,000 to $74,999 | 175 (3.9%) | 119 (3.1%) |
| $75,000 to $99,999 | 283 (6.3%) | 285 (7.5%) |
| $100,000+ | 467 (10.5%) | 184 (4.8%) |
| Total | 4,462 (100.0%) | 3,818 (100.0%) |
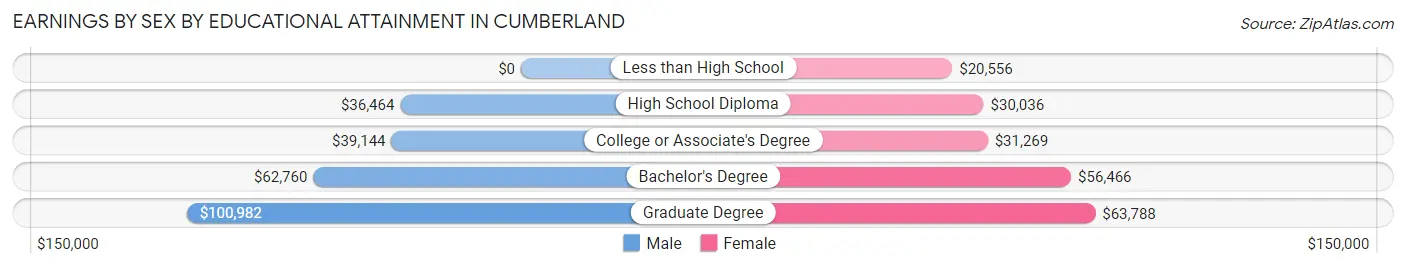
Earnings by Sex by Educational Attainment in Cumberland
Average earnings in Cumberland are $44,492 for men and $34,444 for women, a difference of 22.6%. Men with an educational attainment of graduate degree enjoy the highest average annual earnings of $100,982, while those with high school diploma education earn the least with $36,464. Women with an educational attainment of graduate degree earn the most with the average annual earnings of $63,788, while those with less than high school education have the smallest earnings of $20,556.
| Educational Attainment | Male Income | Female Income |
| Less than High School | - | - |
| High School Diploma | $36,464 | $30,036 |
| College or Associate's Degree | $39,144 | $31,269 |
| Bachelor's Degree | $62,760 | $56,466 |
| Graduate Degree | $100,982 | $63,788 |
| Total | $44,492 | $34,444 |
Family Income in Cumberland
Family Income Brackets in Cumberland
According to the Cumberland family income data, there are 855 families falling into the $50,000 to $74,999 income range, which is the most common income bracket and makes up 19.8% of all families. Conversely, the $10,000 to $14,999 income bracket is the least frequent group with only 112 families (2.6%) belonging to this category.
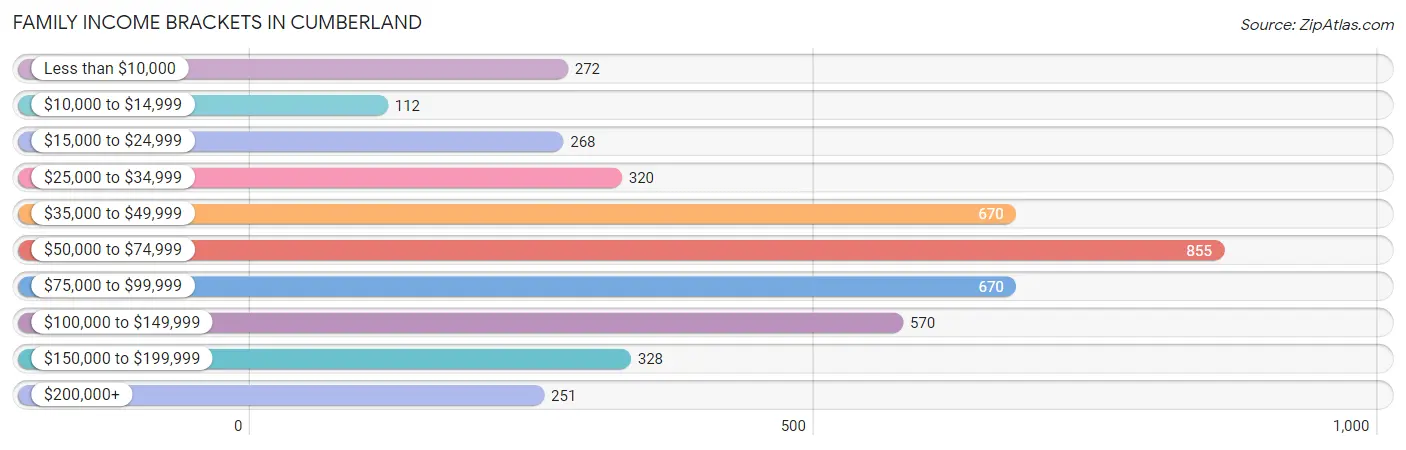
| Income Bracket | # Families | % Families |
| Less than $10,000 | 272 | 6.3% |
| $10,000 to $14,999 | 112 | 2.6% |
| $15,000 to $24,999 | 268 | 6.2% |
| $25,000 to $34,999 | 320 | 7.4% |
| $35,000 to $49,999 | 670 | 15.5% |
| $50,000 to $74,999 | 855 | 19.8% |
| $75,000 to $99,999 | 670 | 15.5% |
| $100,000 to $149,999 | 570 | 13.2% |
| $150,000 to $199,999 | 328 | 7.6% |
| $200,000+ | 251 | 5.8% |
Family Income by Famaliy Size in Cumberland
6-person families (51 | 1.2%) account for the highest median family income in Cumberland with $179,583 per family, while 2-person families (2,291 | 53.0%) have the highest median income of $32,746 per family member.
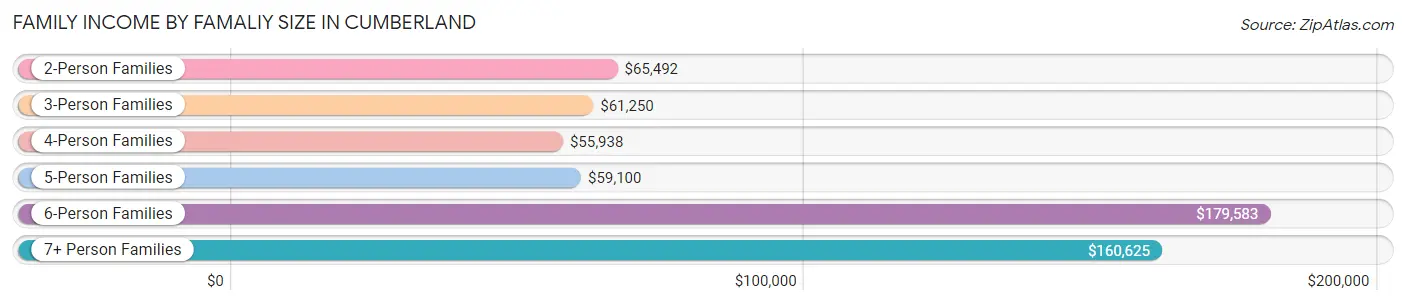
| Income Bracket | # Families | Median Income |
| 2-Person Families | 2,291 (53.0%) | $65,492 |
| 3-Person Families | 911 (21.1%) | $61,250 |
| 4-Person Families | 772 (17.9%) | $55,938 |
| 5-Person Families | 266 (6.2%) | $59,100 |
| 6-Person Families | 51 (1.2%) | $179,583 |
| 7+ Person Families | 29 (0.7%) | $160,625 |
| Total | 4,320 (100.0%) | $63,672 |
Family Income by Number of Earners in Cumberland
The median family income in Cumberland is $63,672, with families comprising 3+ earners (421) having the highest median family income of $103,098, while families with 1 earner (1,642) have the lowest median family income of $44,655, accounting for 9.8% and 38.0% of families, respectively.
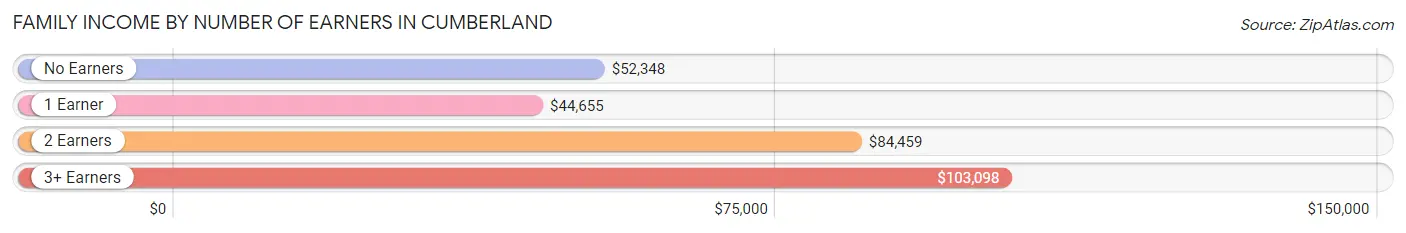
| Number of Earners | # Families | Median Income |
| No Earners | 950 (22.0%) | $52,348 |
| 1 Earner | 1,642 (38.0%) | $44,655 |
| 2 Earners | 1,307 (30.2%) | $84,459 |
| 3+ Earners | 421 (9.8%) | $103,098 |
| Total | 4,320 (100.0%) | $63,672 |
Household Income in Cumberland
Household Income Brackets in Cumberland
With 1,302 households falling in the category, the $50,000 to $74,999 income range is the most frequent in Cumberland, accounting for 15.6% of all households. In contrast, only 292 households (3.5%) fall into the $200,000+ income bracket, making it the least populous group.
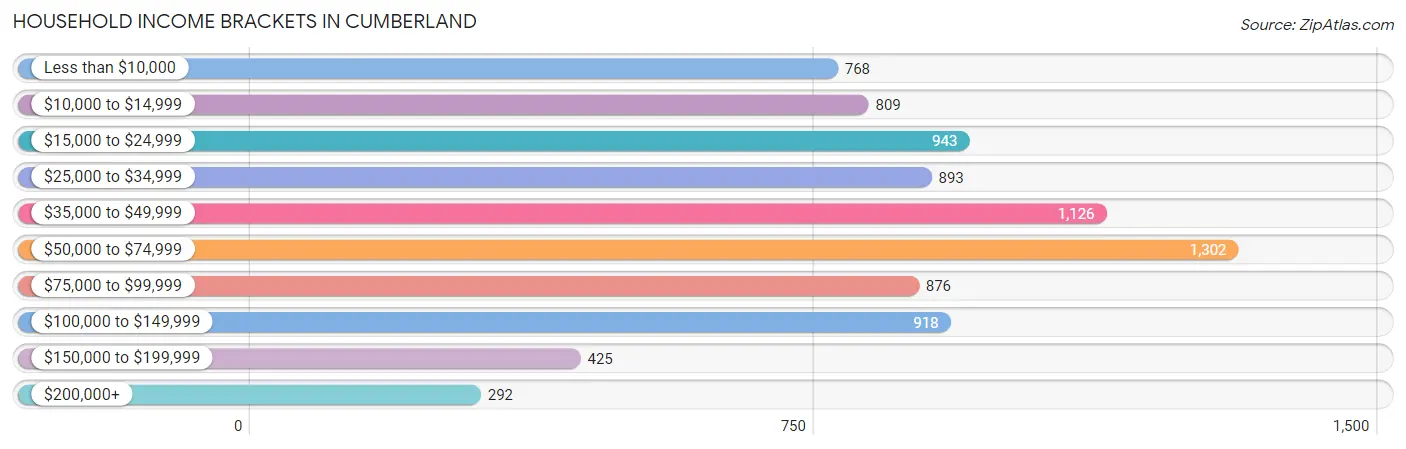
| Income Bracket | # Households | % Households |
| Less than $10,000 | 768 | 9.2% |
| $10,000 to $14,999 | 809 | 9.7% |
| $15,000 to $24,999 | 943 | 11.3% |
| $25,000 to $34,999 | 893 | 10.7% |
| $35,000 to $49,999 | 1,126 | 13.5% |
| $50,000 to $74,999 | 1,302 | 15.6% |
| $75,000 to $99,999 | 876 | 10.5% |
| $100,000 to $149,999 | 918 | 11.0% |
| $150,000 to $199,999 | 425 | 5.1% |
| $200,000+ | 292 | 3.5% |
Household Income by Householder Age in Cumberland
The median household income in Cumberland is $45,915, with the highest median household income of $55,946 found in the 45 to 64 years age bracket for the primary householder. A total of 2,683 households (32.2%) fall into this category. Meanwhile, the 15 to 24 years age bracket for the primary householder has the lowest median household income of $0, with 379 households (4.5%) in this group.
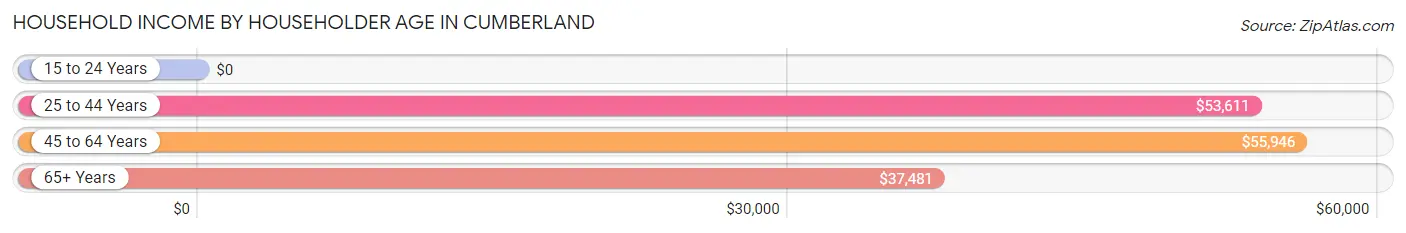
| Income Bracket | # Households | Median Income |
| 15 to 24 Years | 379 (4.5%) | $0 |
| 25 to 44 Years | 2,230 (26.7%) | $53,611 |
| 45 to 64 Years | 2,683 (32.2%) | $55,946 |
| 65+ Years | 3,051 (36.6%) | $37,481 |
| Total | 8,343 (100.0%) | $45,915 |
Poverty in Cumberland
Income Below Poverty by Sex and Age in Cumberland
With 20.0% poverty level for males and 23.6% for females among the residents of Cumberland, 5 year old males and 5 year old females are the most vulnerable to poverty, with 33 males (46.5%) and 94 females (56.3%) in their respective age groups living below the poverty level.
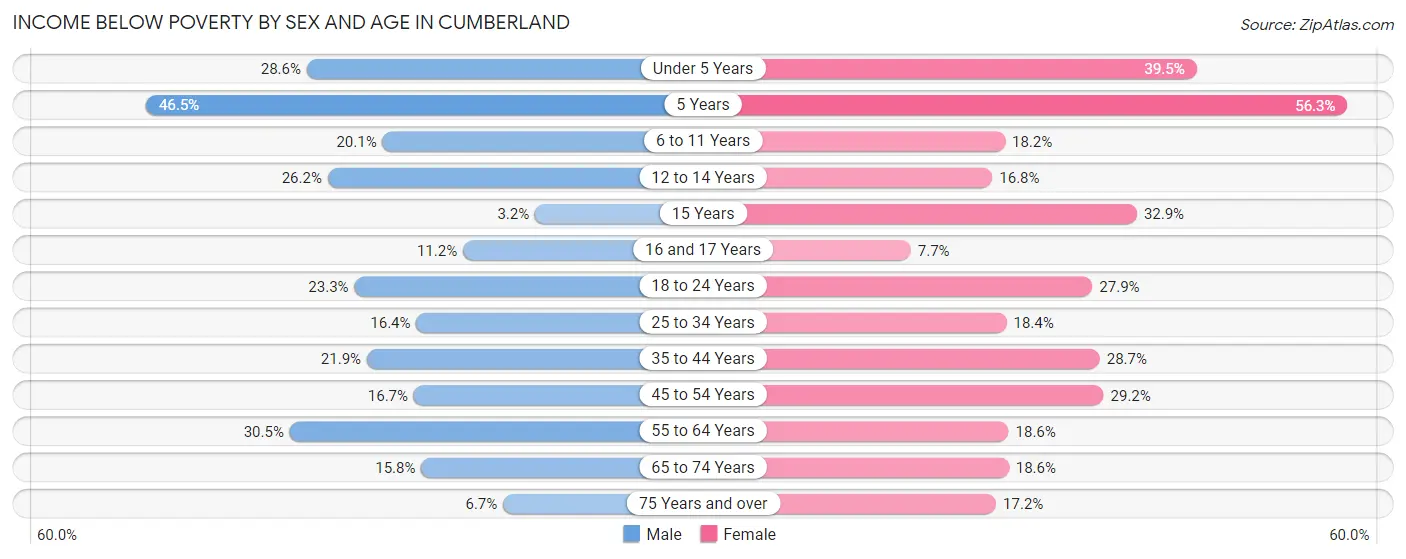
| Age Bracket | Male | Female |
| Under 5 Years | 128 (28.6%) | 143 (39.5%) |
| 5 Years | 33 (46.5%) | 94 (56.3%) |
| 6 to 11 Years | 148 (20.1%) | 88 (18.2%) |
| 12 to 14 Years | 116 (26.2%) | 52 (16.8%) |
| 15 Years | 4 (3.2%) | 71 (32.9%) |
| 16 and 17 Years | 34 (11.2%) | 8 (7.7%) |
| 18 to 24 Years | 236 (23.3%) | 249 (27.9%) |
| 25 to 34 Years | 140 (16.4%) | 147 (18.3%) |
| 35 to 44 Years | 244 (21.9%) | 352 (28.7%) |
| 45 to 54 Years | 169 (16.7%) | 305 (29.2%) |
| 55 to 64 Years | 351 (30.5%) | 202 (18.6%) |
| 65 to 74 Years | 175 (15.8%) | 208 (18.6%) |
| 75 Years and over | 50 (6.7%) | 198 (17.2%) |
| Total | 1,828 (20.0%) | 2,117 (23.6%) |
Income Above Poverty by Sex and Age in Cumberland
According to the poverty statistics in Cumberland, males aged 15 years and females aged 16 and 17 years are the age groups that are most secure financially, with 96.9% of males and 92.3% of females in these age groups living above the poverty line.
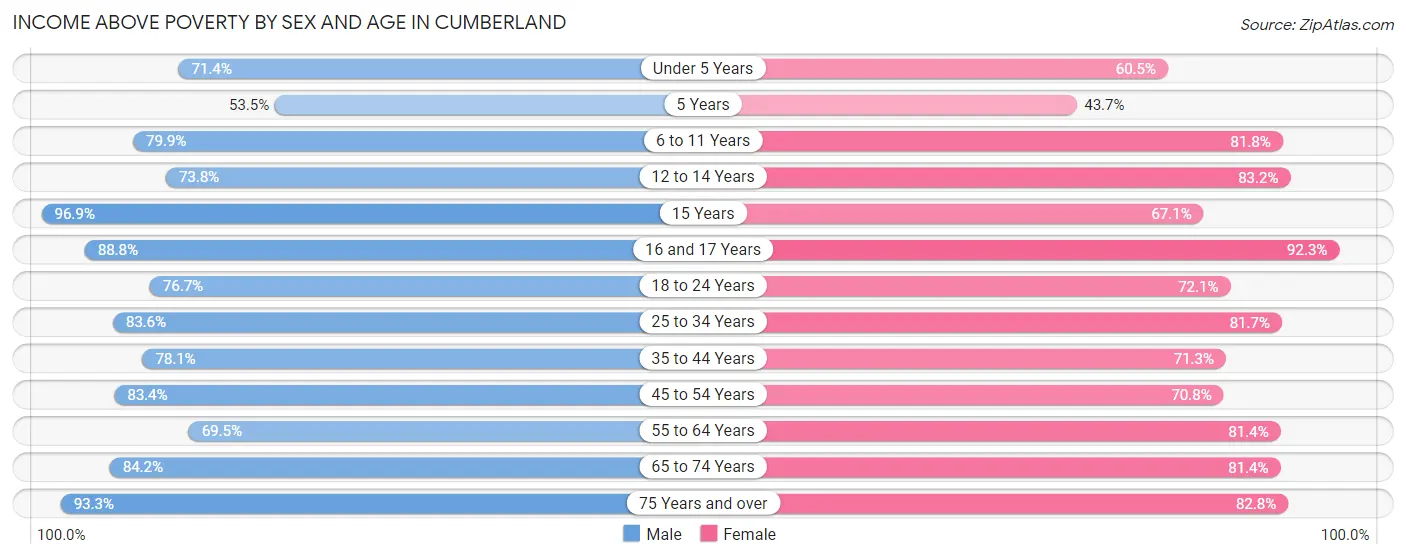
| Age Bracket | Male | Female |
| Under 5 Years | 320 (71.4%) | 219 (60.5%) |
| 5 Years | 38 (53.5%) | 73 (43.7%) |
| 6 to 11 Years | 587 (79.9%) | 396 (81.8%) |
| 12 to 14 Years | 326 (73.8%) | 258 (83.2%) |
| 15 Years | 123 (96.9%) | 145 (67.1%) |
| 16 and 17 Years | 270 (88.8%) | 96 (92.3%) |
| 18 to 24 Years | 778 (76.7%) | 643 (72.1%) |
| 25 to 34 Years | 715 (83.6%) | 654 (81.7%) |
| 35 to 44 Years | 871 (78.1%) | 873 (71.3%) |
| 45 to 54 Years | 846 (83.4%) | 741 (70.8%) |
| 55 to 64 Years | 801 (69.5%) | 885 (81.4%) |
| 65 to 74 Years | 931 (84.2%) | 910 (81.4%) |
| 75 Years and over | 695 (93.3%) | 954 (82.8%) |
| Total | 7,301 (80.0%) | 6,847 (76.4%) |
Income Below Poverty Among Married-Couple Families in Cumberland
The poverty statistics for married-couple families in Cumberland show that 7.6% or 212 of the total 2,783 families live below the poverty line. Families with 1 or 2 children have the highest poverty rate of 15.5%, comprising of 124 families. On the other hand, families with 5 or more children have the lowest poverty rate of 0.0%, which includes 0 families.
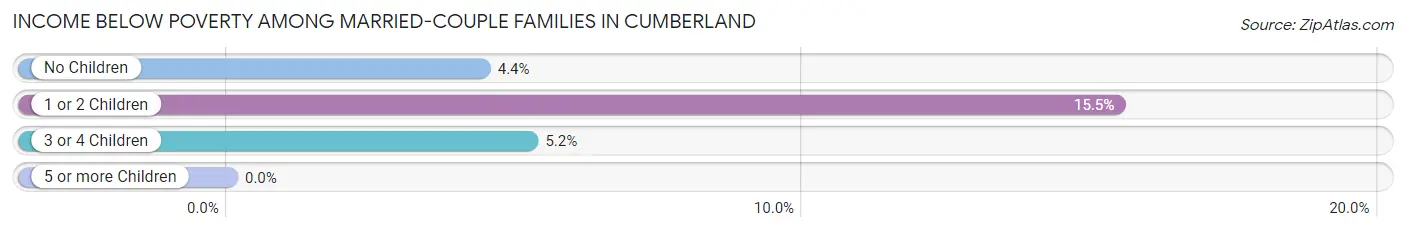
| Children | Above Poverty | Below Poverty |
| No Children | 1,718 (95.6%) | 79 (4.4%) |
| 1 or 2 Children | 678 (84.5%) | 124 (15.5%) |
| 3 or 4 Children | 163 (94.8%) | 9 (5.2%) |
| 5 or more Children | 12 (100.0%) | 0 (0.0%) |
| Total | 2,571 (92.4%) | 212 (7.6%) |
Income Below Poverty Among Single-Parent Households in Cumberland
According to the poverty data in Cumberland, 10.3% or 37 single-father households and 34.6% or 407 single-mother households are living below the poverty line. Among single-father households, those with 1 or 2 children have the highest poverty rate, with 37 households (18.0%) experiencing poverty. Likewise, among single-mother households, those with 3 or 4 children have the highest poverty rate, with 43 households (49.4%) falling below the poverty line.
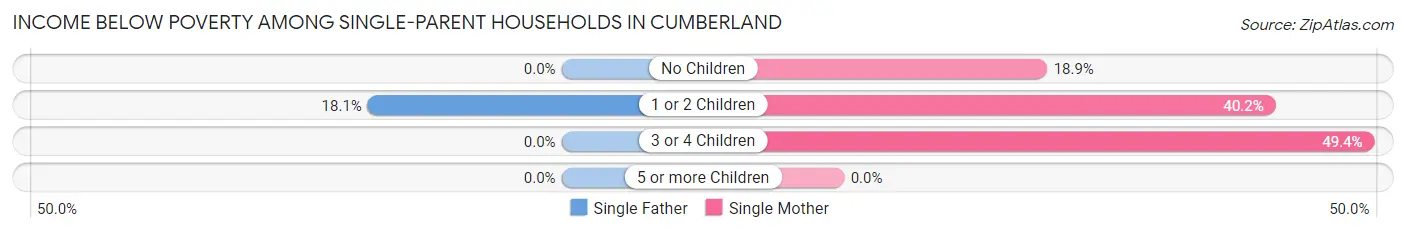
| Children | Single Father | Single Mother |
| No Children | 0 (0.0%) | 66 (18.9%) |
| 1 or 2 Children | 37 (18.0%) | 298 (40.2%) |
| 3 or 4 Children | 0 (0.0%) | 43 (49.4%) |
| 5 or more Children | 0 (0.0%) | 0 (0.0%) |
| Total | 37 (10.3%) | 407 (34.6%) |
Income Below Poverty Among Married-Couple vs Single-Parent Households in Cumberland
The poverty data for Cumberland shows that 212 of the married-couple family households (7.6%) and 444 of the single-parent households (28.9%) are living below the poverty level. Within the married-couple family households, those with 1 or 2 children have the highest poverty rate, with 124 households (15.5%) falling below the poverty line. Among the single-parent households, those with 1 or 2 children have the highest poverty rate, with 335 household (35.4%) living below poverty.
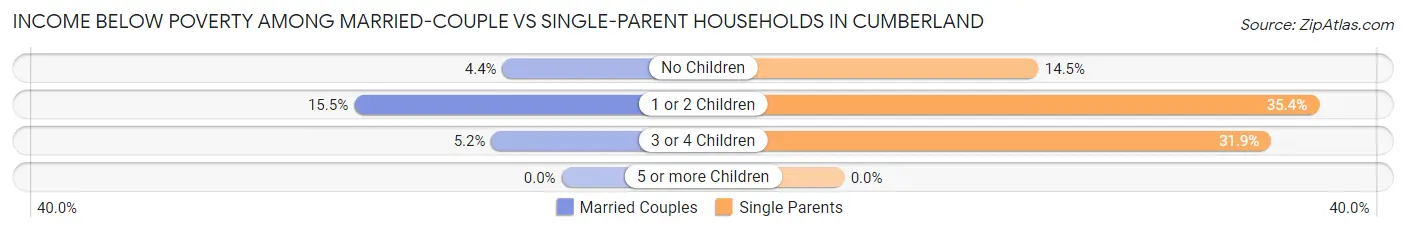
| Children | Married-Couple Families | Single-Parent Households |
| No Children | 79 (4.4%) | 66 (14.5%) |
| 1 or 2 Children | 124 (15.5%) | 335 (35.4%) |
| 3 or 4 Children | 9 (5.2%) | 43 (31.9%) |
| 5 or more Children | 0 (0.0%) | 0 (0.0%) |
| Total | 212 (7.6%) | 444 (28.9%) |
Race in Cumberland
The most populous races in Cumberland are White / Caucasian (16,825 | 88.4%), Two or more Races (1,158 | 6.1%), and Black / African American (822 | 4.3%).
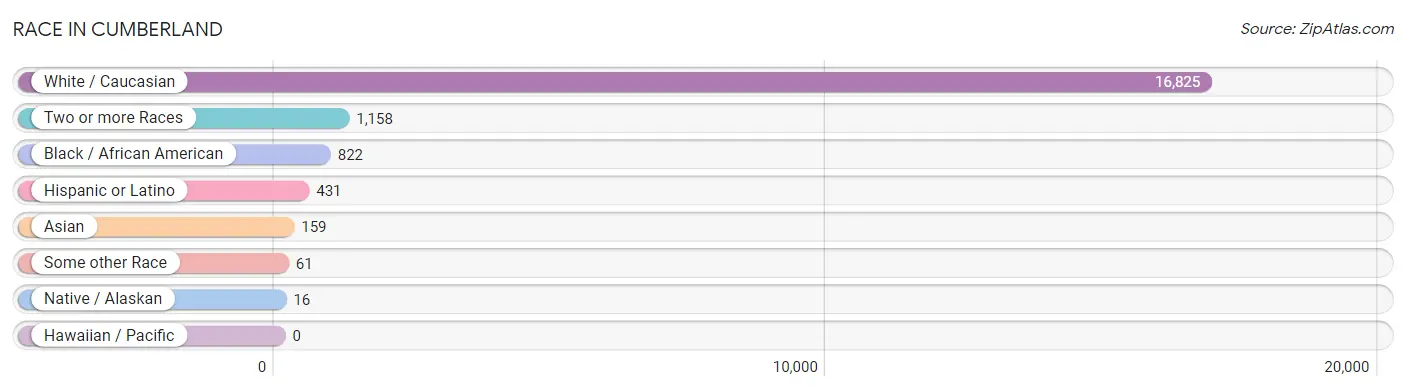
| Race | # Population | % Population |
| Asian | 159 | 0.8% |
| Black / African American | 822 | 4.3% |
| Hawaiian / Pacific | 0 | 0.0% |
| Hispanic or Latino | 431 | 2.3% |
| Native / Alaskan | 16 | 0.1% |
| White / Caucasian | 16,825 | 88.4% |
| Two or more Races | 1,158 | 6.1% |
| Some other Race | 61 | 0.3% |
| Total | 19,041 | 100.0% |
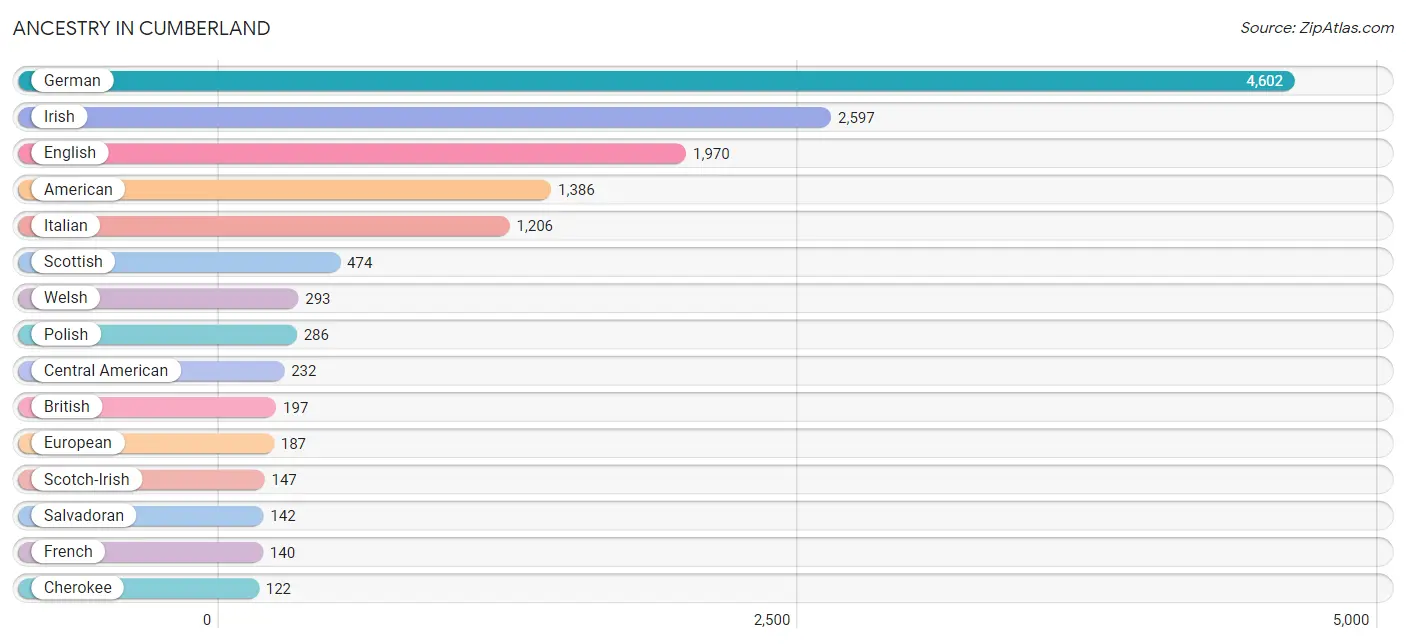
Ancestry in Cumberland
The most populous ancestries reported in Cumberland are German (4,602 | 24.2%), Irish (2,597 | 13.6%), English (1,970 | 10.3%), American (1,386 | 7.3%), and Italian (1,206 | 6.3%), together accounting for 61.8% of all Cumberland residents.
| Ancestry | # Population | % Population |
| African | 30 | 0.2% |
| American | 1,386 | 7.3% |
| Arab | 38 | 0.2% |
| Austrian | 12 | 0.1% |
| Belgian | 18 | 0.1% |
| Belizean | 1 | 0.0% |
| Bhutanese | 27 | 0.1% |
| British | 197 | 1.0% |
| Canadian | 8 | 0.0% |
| Central American | 232 | 1.2% |
| Central American Indian | 38 | 0.2% |
| Cherokee | 122 | 0.6% |
| Chilean | 12 | 0.1% |
| Croatian | 14 | 0.1% |
| Crow | 3 | 0.0% |
| Czech | 68 | 0.4% |
| Danish | 9 | 0.1% |
| Dutch | 83 | 0.4% |
| Eastern European | 26 | 0.1% |
| Ecuadorian | 46 | 0.2% |
| English | 1,970 | 10.3% |
| European | 187 | 1.0% |
| French | 140 | 0.7% |
| French Canadian | 102 | 0.5% |
| German | 4,602 | 24.2% |
| Greek | 37 | 0.2% |
| Honduran | 90 | 0.5% |
| Hungarian | 84 | 0.4% |
| Indian (Asian) | 86 | 0.4% |
| Iranian | 5 | 0.0% |
| Irish | 2,597 | 13.6% |
| Iroquois | 51 | 0.3% |
| Italian | 1,206 | 6.3% |
| Jamaican | 37 | 0.2% |
| Korean | 41 | 0.2% |
| Lebanese | 38 | 0.2% |
| Lithuanian | 7 | 0.0% |
| Lumbee | 13 | 0.1% |
| Mexican | 38 | 0.2% |
| Northern European | 21 | 0.1% |
| Norwegian | 36 | 0.2% |
| Pakistani | 3 | 0.0% |
| Peruvian | 4 | 0.0% |
| Polish | 286 | 1.5% |
| Portuguese | 18 | 0.1% |
| Puerto Rican | 78 | 0.4% |
| Russian | 98 | 0.5% |
| Salvadoran | 142 | 0.7% |
| Scandinavian | 70 | 0.4% |
| Scotch-Irish | 147 | 0.8% |
| Scottish | 474 | 2.5% |
| Serbian | 7 | 0.0% |
| Sioux | 10 | 0.1% |
| Slovak | 35 | 0.2% |
| South American | 62 | 0.3% |
| Spaniard | 6 | 0.0% |
| Spanish | 2 | 0.0% |
| Sri Lankan | 76 | 0.4% |
| Subsaharan African | 30 | 0.2% |
| Swedish | 108 | 0.6% |
| Swiss | 15 | 0.1% |
| Thai | 32 | 0.2% |
| Trinidadian and Tobagonian | 6 | 0.0% |
| Ukrainian | 18 | 0.1% |
| Welsh | 293 | 1.5% |
| West Indian | 9 | 0.1% |
| Yugoslavian | 10 | 0.1% | View All 67 Rows |
Immigrants in Cumberland
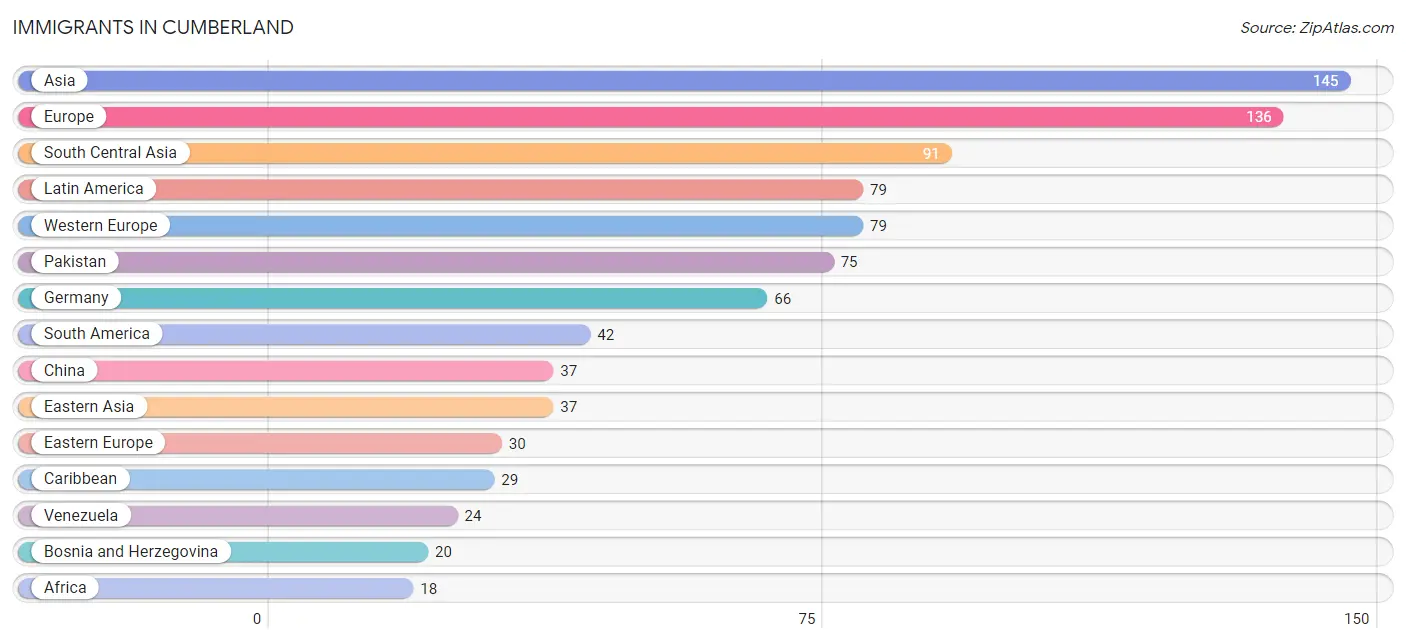
The most numerous immigrant groups reported in Cumberland came from Asia (145 | 0.8%), Europe (136 | 0.7%), South Central Asia (91 | 0.5%), Latin America (79 | 0.4%), and Western Europe (79 | 0.4%), together accounting for 2.8% of all Cumberland residents.
| Immigration Origin | # Population | % Population |
| Africa | 18 | 0.1% |
| Asia | 145 | 0.8% |
| Belize | 8 | 0.0% |
| Bosnia and Herzegovina | 20 | 0.1% |
| Brazil | 18 | 0.1% |
| Cambodia | 3 | 0.0% |
| Cameroon | 6 | 0.0% |
| Caribbean | 29 | 0.2% |
| Central America | 8 | 0.0% |
| China | 37 | 0.2% |
| Congo | 5 | 0.0% |
| Denmark | 6 | 0.0% |
| Eastern Asia | 37 | 0.2% |
| Eastern Europe | 30 | 0.2% |
| Europe | 136 | 0.7% |
| France | 13 | 0.1% |
| Germany | 66 | 0.4% |
| India | 11 | 0.1% |
| Iran | 5 | 0.0% |
| Jamaica | 16 | 0.1% |
| Latin America | 79 | 0.4% |
| Liberia | 2 | 0.0% |
| Middle Africa | 11 | 0.1% |
| Nigeria | 5 | 0.0% |
| Northern Europe | 17 | 0.1% |
| Pakistan | 75 | 0.4% |
| Philippines | 3 | 0.0% |
| Portugal | 9 | 0.1% |
| Russia | 10 | 0.1% |
| Scotland | 5 | 0.0% |
| South America | 42 | 0.2% |
| South Central Asia | 91 | 0.5% |
| South Eastern Asia | 17 | 0.1% |
| Southern Europe | 10 | 0.1% |
| Spain | 1 | 0.0% |
| Thailand | 3 | 0.0% |
| Trinidad and Tobago | 13 | 0.1% |
| Venezuela | 24 | 0.1% |
| Western Africa | 7 | 0.0% |
| Western Europe | 79 | 0.4% | View All 40 Rows |
Sex and Age in Cumberland
Sex and Age in Cumberland
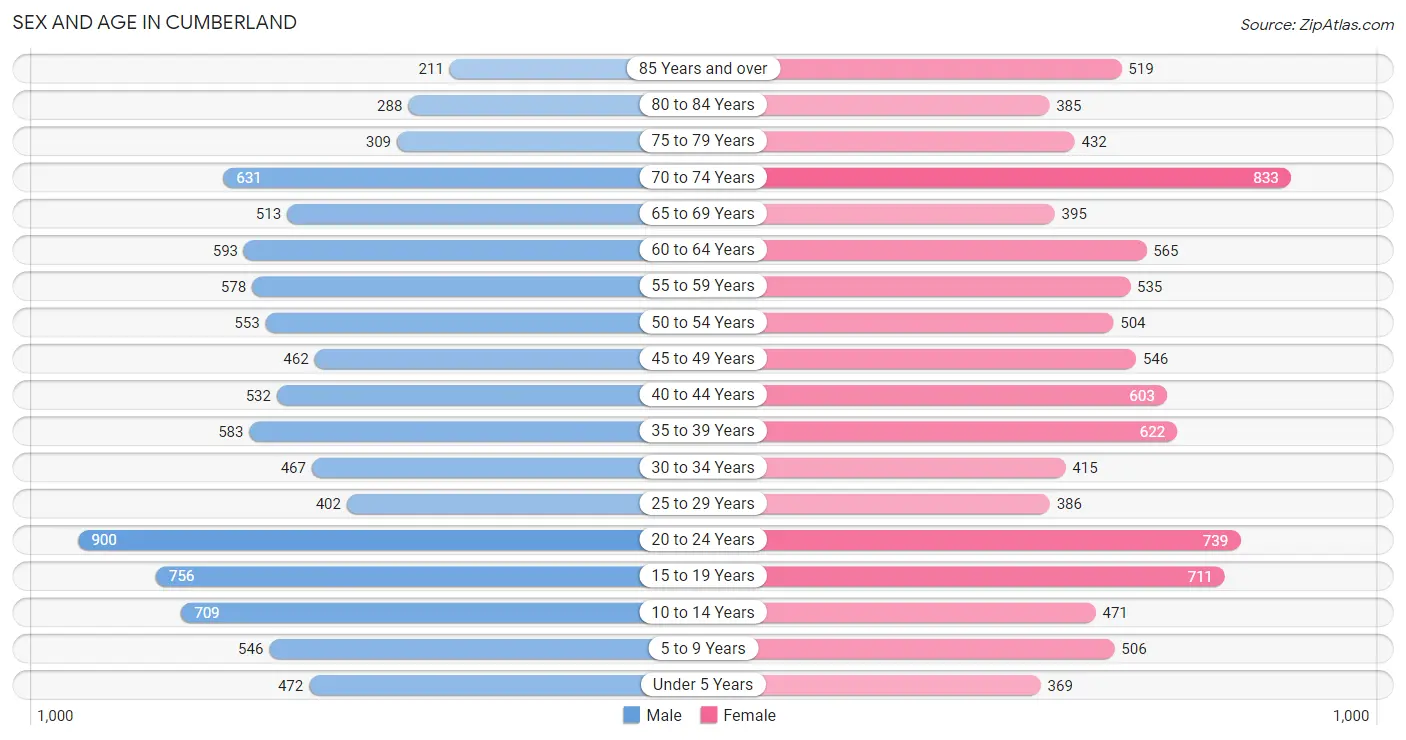
The most populous age groups in Cumberland are 20 to 24 Years (900 | 9.5%) for men and 70 to 74 Years (833 | 8.7%) for women.
| Age Bracket | Male | Female |
| Under 5 Years | 472 (5.0%) | 369 (3.9%) |
| 5 to 9 Years | 546 (5.7%) | 506 (5.3%) |
| 10 to 14 Years | 709 (7.5%) | 471 (4.9%) |
| 15 to 19 Years | 756 (8.0%) | 711 (7.5%) |
| 20 to 24 Years | 900 (9.5%) | 739 (7.7%) |
| 25 to 29 Years | 402 (4.2%) | 386 (4.1%) |
| 30 to 34 Years | 467 (4.9%) | 415 (4.3%) |
| 35 to 39 Years | 583 (6.1%) | 622 (6.5%) |
| 40 to 44 Years | 532 (5.6%) | 603 (6.3%) |
| 45 to 49 Years | 462 (4.9%) | 546 (5.7%) |
| 50 to 54 Years | 553 (5.8%) | 504 (5.3%) |
| 55 to 59 Years | 578 (6.1%) | 535 (5.6%) |
| 60 to 64 Years | 593 (6.2%) | 565 (5.9%) |
| 65 to 69 Years | 513 (5.4%) | 395 (4.1%) |
| 70 to 74 Years | 631 (6.6%) | 833 (8.7%) |
| 75 to 79 Years | 309 (3.3%) | 432 (4.5%) |
| 80 to 84 Years | 288 (3.0%) | 385 (4.0%) |
| 85 Years and over | 211 (2.2%) | 519 (5.4%) |
| Total | 9,505 (100.0%) | 9,536 (100.0%) |
Families and Households in Cumberland
Median Family Size in Cumberland
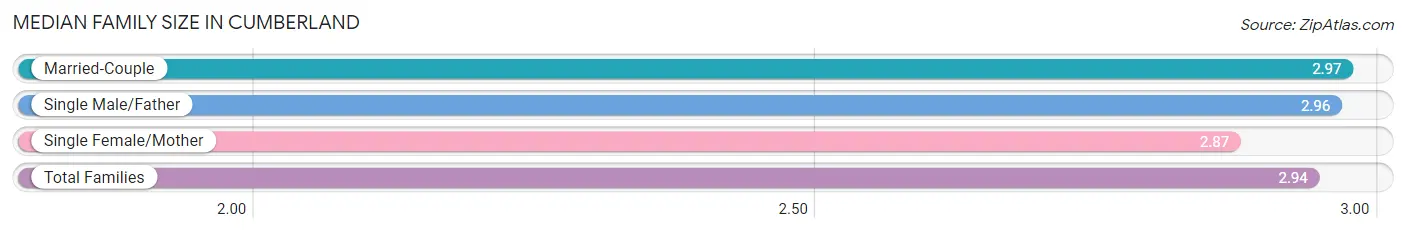
The median family size in Cumberland is 2.94 persons per family, with married-couple families (2,783 | 64.4%) accounting for the largest median family size of 2.97 persons per family. On the other hand, single female/mother families (1,177 | 27.3%) represent the smallest median family size with 2.87 persons per family.
| Family Type | # Families | Family Size |
| Married-Couple | 2,783 (64.4%) | 2.97 |
| Single Male/Father | 360 (8.3%) | 2.96 |
| Single Female/Mother | 1,177 (27.3%) | 2.87 |
| Total Families | 4,320 (100.0%) | 2.94 |
Median Household Size in Cumberland
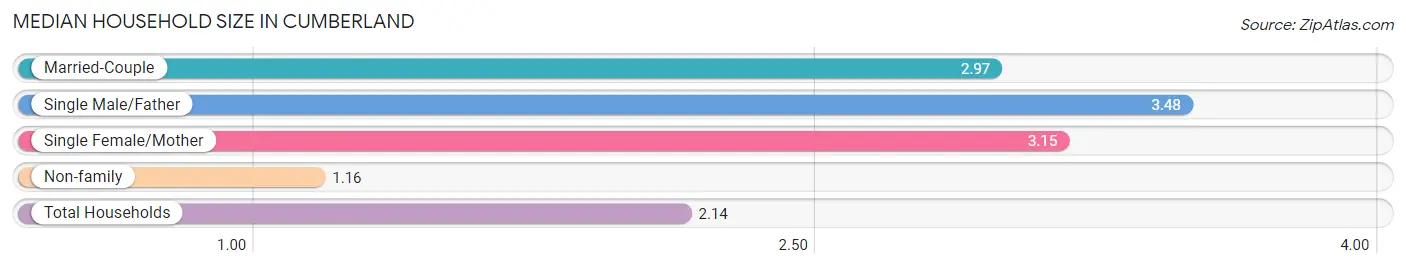
The median household size in Cumberland is 2.14 persons per household, with single male/father households (360 | 4.3%) accounting for the largest median household size of 3.48 persons per household. non-family households (4,023 | 48.2%) represent the smallest median household size with 1.16 persons per household.
| Household Type | # Households | Household Size |
| Married-Couple | 2,783 (33.4%) | 2.97 |
| Single Male/Father | 360 (4.3%) | 3.48 |
| Single Female/Mother | 1,177 (14.1%) | 3.15 |
| Non-family | 4,023 (48.2%) | 1.16 |
| Total Households | 8,343 (100.0%) | 2.14 |
Household Size by Marriage Status in Cumberland
Out of a total of 8,343 households in Cumberland, 4,320 (51.8%) are family households, while 4,023 (48.2%) are nonfamily households. The most numerous type of family households are 2-person households, comprising 2,126, and the most common type of nonfamily households are 1-person households, comprising 3,497.
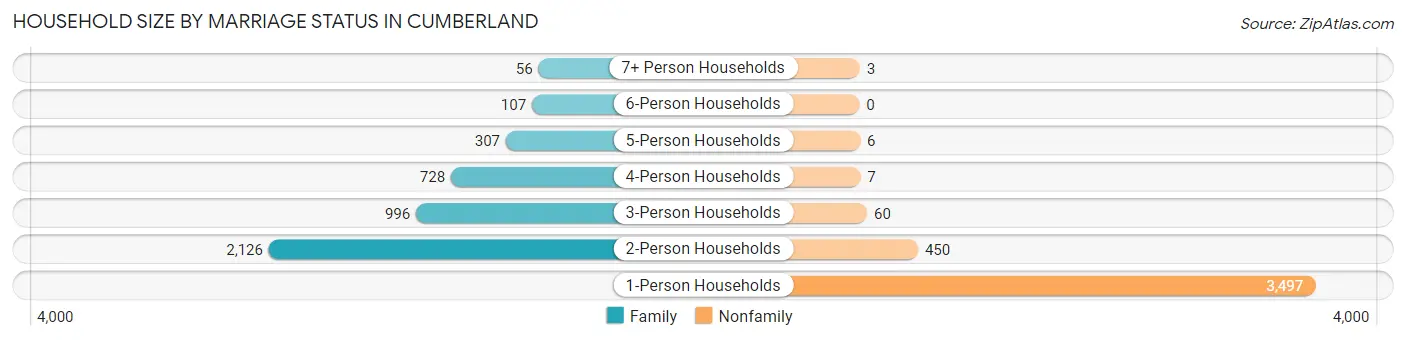
| Household Size | Family Households | Nonfamily Households |
| 1-Person Households | - | 3,497 (41.9%) |
| 2-Person Households | 2,126 (25.5%) | 450 (5.4%) |
| 3-Person Households | 996 (11.9%) | 60 (0.7%) |
| 4-Person Households | 728 (8.7%) | 7 (0.1%) |
| 5-Person Households | 307 (3.7%) | 6 (0.1%) |
| 6-Person Households | 107 (1.3%) | 0 (0.0%) |
| 7+ Person Households | 56 (0.7%) | 3 (0.0%) |
| Total | 4,320 (51.8%) | 4,023 (48.2%) |
Female Fertility in Cumberland
Fertility by Age in Cumberland
Average fertility rate in Cumberland is 46.0 births per 1,000 women. Women in the age bracket of 20 to 34 years have the highest fertility rate with 109.0 births per 1,000 women. Women in the age bracket of 20 to 34 years acount for 86.6% of all women with births.
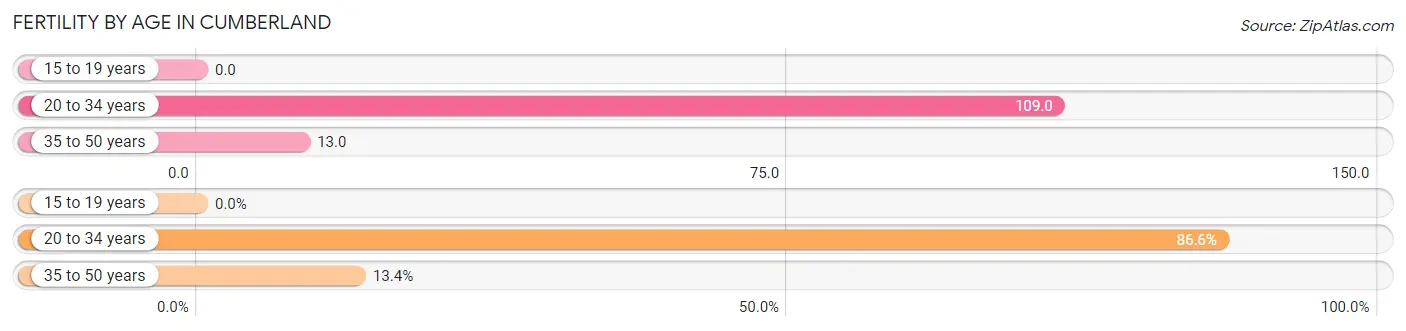
| Age Bracket | Women with Births | Births / 1,000 Women |
| 15 to 19 years | 0 (0.0%) | 0.0 |
| 20 to 34 years | 168 (86.6%) | 109.0 |
| 35 to 50 years | 26 (13.4%) | 13.0 |
| Total | 194 (100.0%) | 46.0 |
Fertility by Age by Marriage Status in Cumberland
74.2% of women with births (194) in Cumberland are married. The highest percentage of unmarried women with births falls into 35 to 50 years age bracket with 100.0% of them unmarried at the time of birth, while the lowest percentage of unmarried women with births belong to 20 to 34 years age bracket with 14.3% of them unmarried.
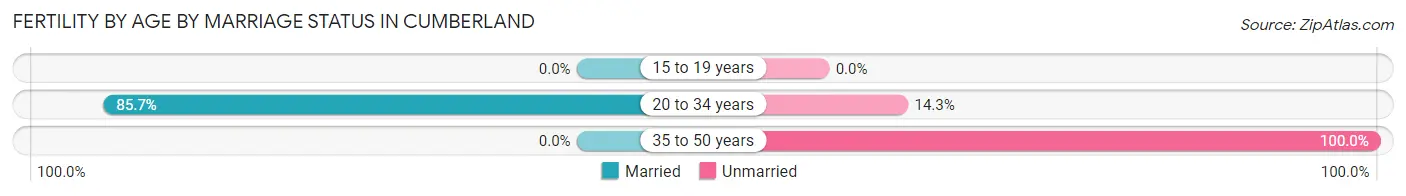
| Age Bracket | Married | Unmarried |
| 15 to 19 years | 0 (0.0%) | 0 (0.0%) |
| 20 to 34 years | 144 (85.7%) | 24 (14.3%) |
| 35 to 50 years | 0 (0.0%) | 26 (100.0%) |
| Total | 144 (74.2%) | 50 (25.8%) |
Fertility by Education in Cumberland
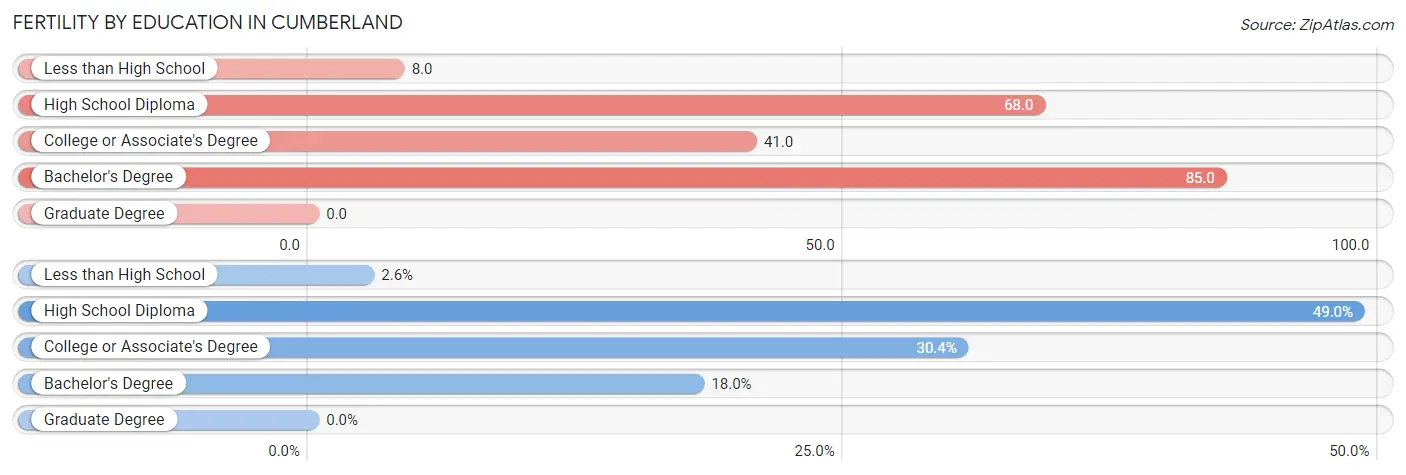
| Educational Attainment | Women with Births | Births / 1,000 Women |
| Less than High School | 5 (2.6%) | 8.0 |
| High School Diploma | 95 (49.0%) | 68.0 |
| College or Associate's Degree | 59 (30.4%) | 41.0 |
| Bachelor's Degree | 35 (18.0%) | 85.0 |
| Graduate Degree | 0 (0.0%) | 0.0 |
| Total | 194 (100.0%) | 46.0 |
Fertility by Education by Marriage Status in Cumberland
25.8% of women with births in Cumberland are unmarried. Women with the educational attainment of college or associate's degree are most likely to be married with 100.0% of them married at childbirth, while women with the educational attainment of less than high school are least likely to be married with 100.0% of them unmarried at childbirth.
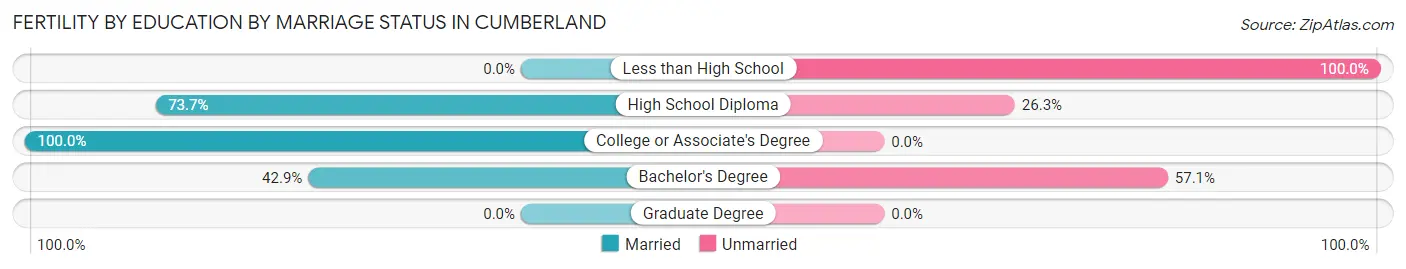
| Educational Attainment | Married | Unmarried |
| Less than High School | 0 (0.0%) | 5 (100.0%) |
| High School Diploma | 70 (73.7%) | 25 (26.3%) |
| College or Associate's Degree | 59 (100.0%) | 0 (0.0%) |
| Bachelor's Degree | 15 (42.9%) | 20 (57.1%) |
| Graduate Degree | 0 (0.0%) | 0 (0.0%) |
| Total | 144 (74.2%) | 50 (25.8%) |
Employment Characteristics in Cumberland
Employment by Class of Employer in Cumberland
Among the 7,120 employed individuals in Cumberland, private company employees (4,255 | 59.8%), not-for-profit organizations (965 | 13.6%), and state government employees (524 | 7.4%) make up the most common classes of employment.
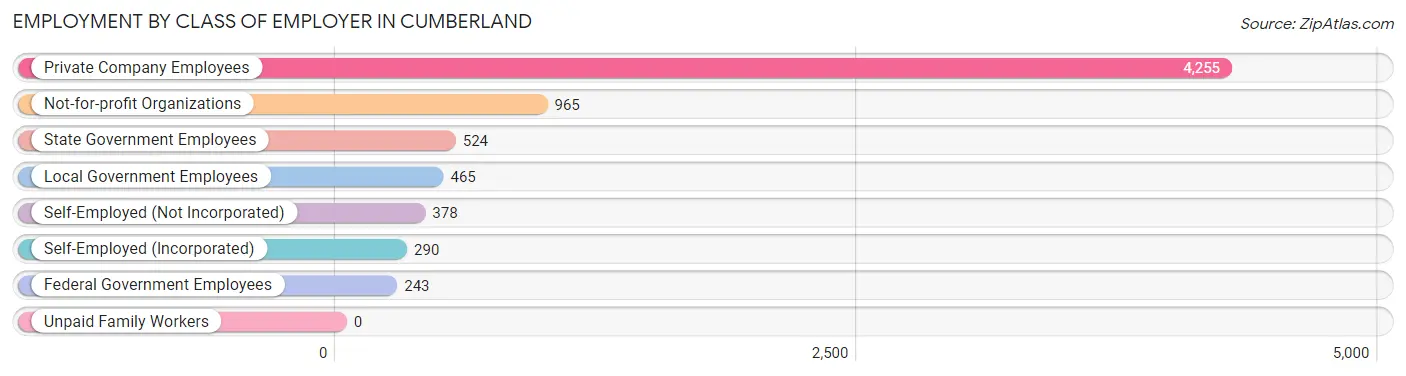
| Employer Class | # Employees | % Employees |
| Private Company Employees | 4,255 | 59.8% |
| Self-Employed (Incorporated) | 290 | 4.1% |
| Self-Employed (Not Incorporated) | 378 | 5.3% |
| Not-for-profit Organizations | 965 | 13.6% |
| Local Government Employees | 465 | 6.5% |
| State Government Employees | 524 | 7.4% |
| Federal Government Employees | 243 | 3.4% |
| Unpaid Family Workers | 0 | 0.0% |
| Total | 7,120 | 100.0% |
Employment Status by Age in Cumberland
According to the labor force statistics for Cumberland, out of the total population over 16 years of age (15,624), 50.9% or 7,953 individuals are in the labor force, with 9.1% or 724 of them unemployed. The age group with the highest labor force participation rate is 25 to 29 years, with 85.0% or 670 individuals in the labor force. Within the labor force, the 16 to 19 years age range has the highest percentage of unemployed individuals, with 36.2% or 181 of them being unemployed.
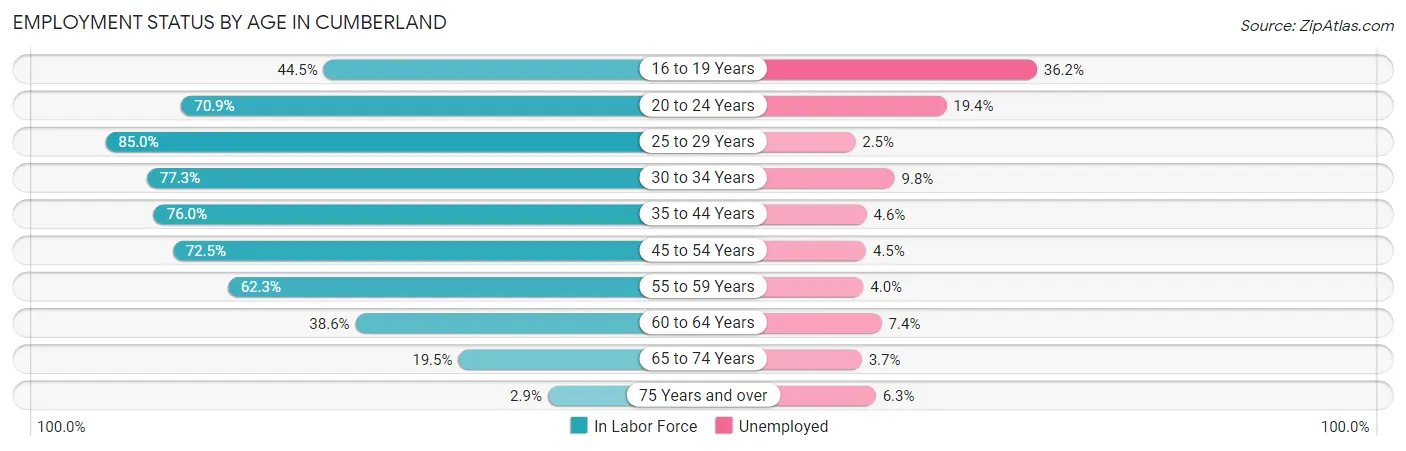
| Age Bracket | In Labor Force | Unemployed |
| 16 to 19 Years | 500 (44.5%) | 181 (36.2%) |
| 20 to 24 Years | 1,162 (70.9%) | 225 (19.4%) |
| 25 to 29 Years | 670 (85.0%) | 17 (2.5%) |
| 30 to 34 Years | 682 (77.3%) | 67 (9.8%) |
| 35 to 44 Years | 1,778 (76.0%) | 82 (4.6%) |
| 45 to 54 Years | 1,497 (72.5%) | 67 (4.5%) |
| 55 to 59 Years | 693 (62.3%) | 28 (4.0%) |
| 60 to 64 Years | 447 (38.6%) | 33 (7.4%) |
| 65 to 74 Years | 463 (19.5%) | 17 (3.7%) |
| 75 Years and over | 62 (2.9%) | 4 (6.3%) |
| Total | 7,953 (50.9%) | 724 (9.1%) |
Employment Status by Educational Attainment in Cumberland
According to labor force statistics for Cumberland, 69.1% of individuals (5,767) out of the total population between 25 and 64 years of age (8,346) are in the labor force, with 5.1% or 294 of them being unemployed. The group with the highest labor force participation rate are those with the educational attainment of bachelor's degree or higher, with 85.3% or 1,746 individuals in the labor force. Within the labor force, individuals with less than high school education have the highest percentage of unemployment, with 14.2% or 40 of them being unemployed.
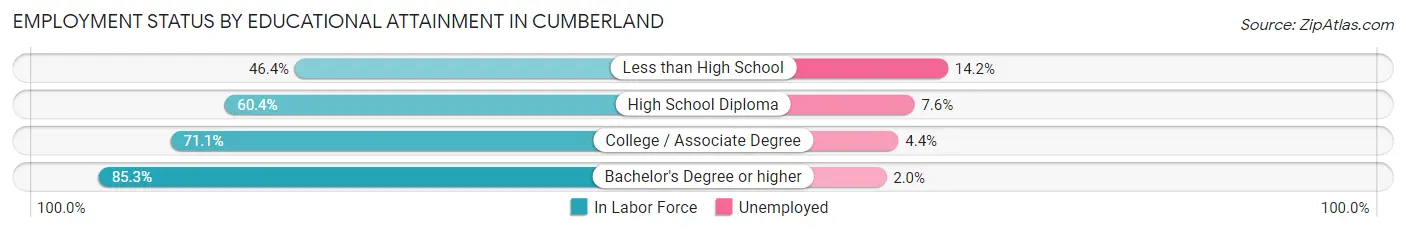
| Educational Attainment | In Labor Force | Unemployed |
| Less than High School | 282 (46.4%) | 86 (14.2%) |
| High School Diploma | 1,736 (60.4%) | 218 (7.6%) |
| College / Associate Degree | 2,003 (71.1%) | 124 (4.4%) |
| Bachelor's Degree or higher | 1,746 (85.3%) | 41 (2.0%) |
| Total | 5,767 (69.1%) | 426 (5.1%) |
Employment Occupations by Sex in Cumberland
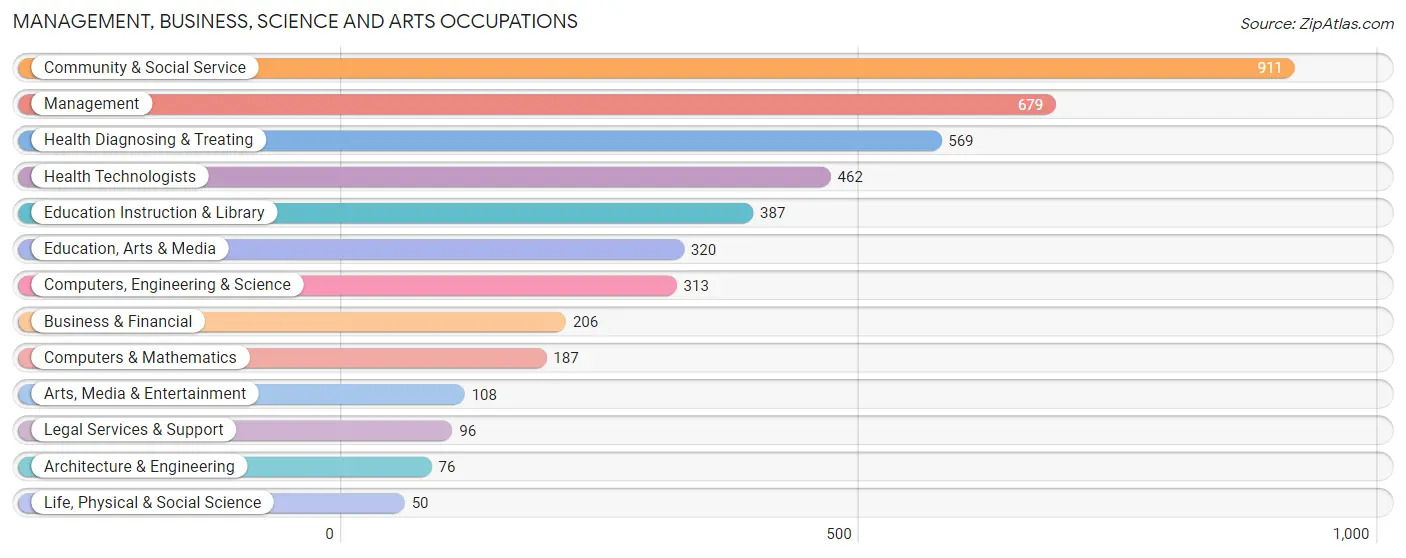
Management, Business, Science and Arts Occupations
The most common Management, Business, Science and Arts occupations in Cumberland are Community & Social Service (911 | 12.6%), Management (679 | 9.4%), Health Diagnosing & Treating (569 | 7.9%), Health Technologists (462 | 6.4%), and Education Instruction & Library (387 | 5.4%).
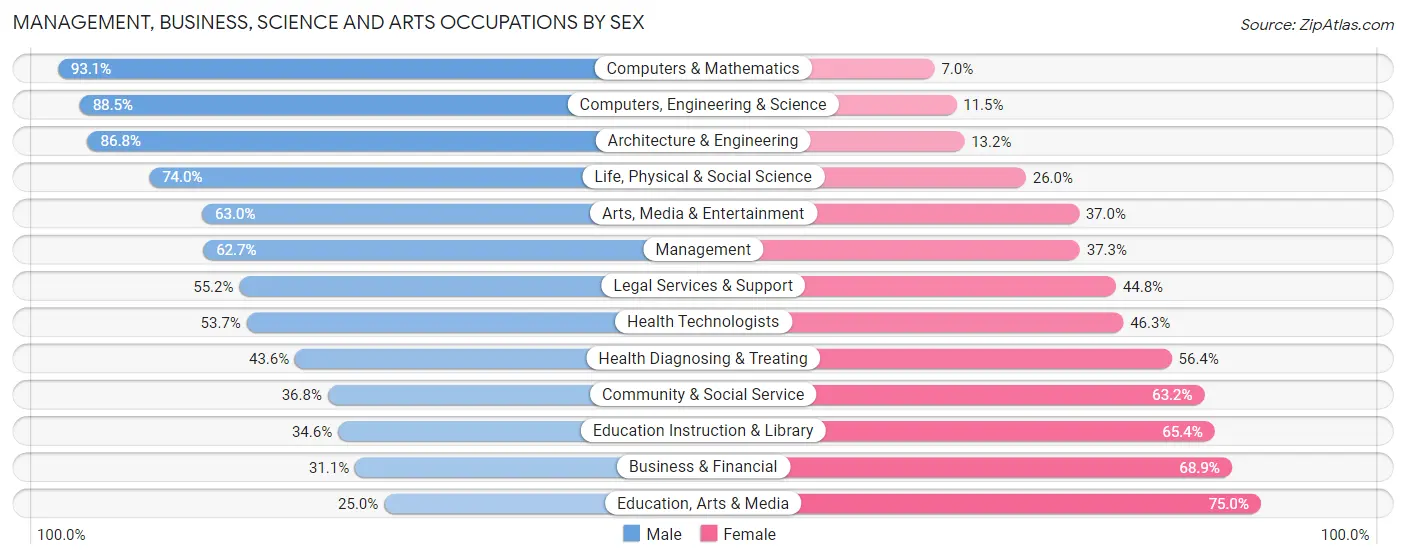
Management, Business, Science and Arts Occupations by Sex
Within the Management, Business, Science and Arts occupations in Cumberland, the most male-oriented occupations are Computers & Mathematics (93.0%), Computers, Engineering & Science (88.5%), and Architecture & Engineering (86.8%), while the most female-oriented occupations are Education, Arts & Media (75.0%), Business & Financial (68.9%), and Education Instruction & Library (65.4%).
| Occupation | Male | Female |
| Management | 426 (62.7%) | 253 (37.3%) |
| Business & Financial | 64 (31.1%) | 142 (68.9%) |
| Computers, Engineering & Science | 277 (88.5%) | 36 (11.5%) |
| Computers & Mathematics | 174 (93.0%) | 13 (7.0%) |
| Architecture & Engineering | 66 (86.8%) | 10 (13.2%) |
| Life, Physical & Social Science | 37 (74.0%) | 13 (26.0%) |
| Community & Social Service | 335 (36.8%) | 576 (63.2%) |
| Education, Arts & Media | 80 (25.0%) | 240 (75.0%) |
| Legal Services & Support | 53 (55.2%) | 43 (44.8%) |
| Education Instruction & Library | 134 (34.6%) | 253 (65.4%) |
| Arts, Media & Entertainment | 68 (63.0%) | 40 (37.0%) |
| Health Diagnosing & Treating | 248 (43.6%) | 321 (56.4%) |
| Health Technologists | 248 (53.7%) | 214 (46.3%) |
| Total (Category) | 1,350 (50.4%) | 1,328 (49.6%) |
| Total (Overall) | 3,984 (55.2%) | 3,236 (44.8%) |
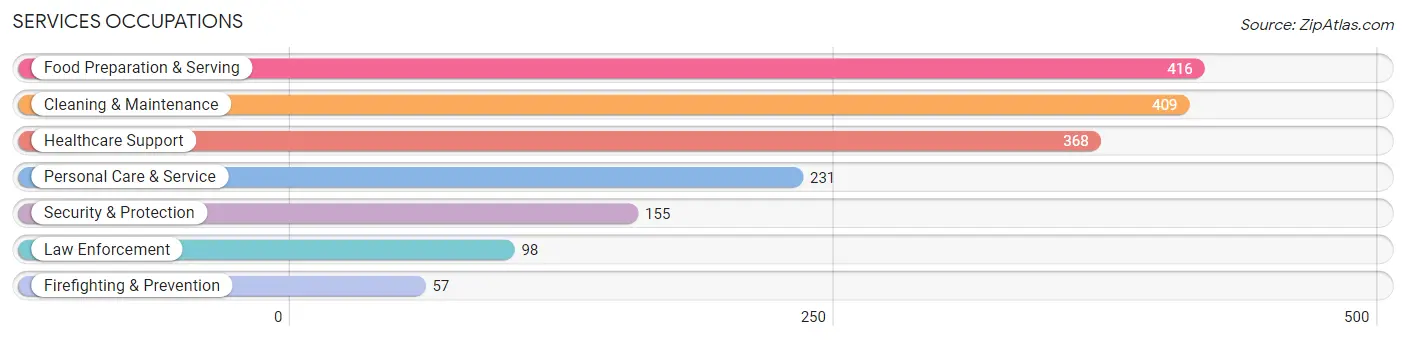
Services Occupations
The most common Services occupations in Cumberland are Food Preparation & Serving (416 | 5.8%), Cleaning & Maintenance (409 | 5.7%), Healthcare Support (368 | 5.1%), Personal Care & Service (231 | 3.2%), and Security & Protection (155 | 2.1%).
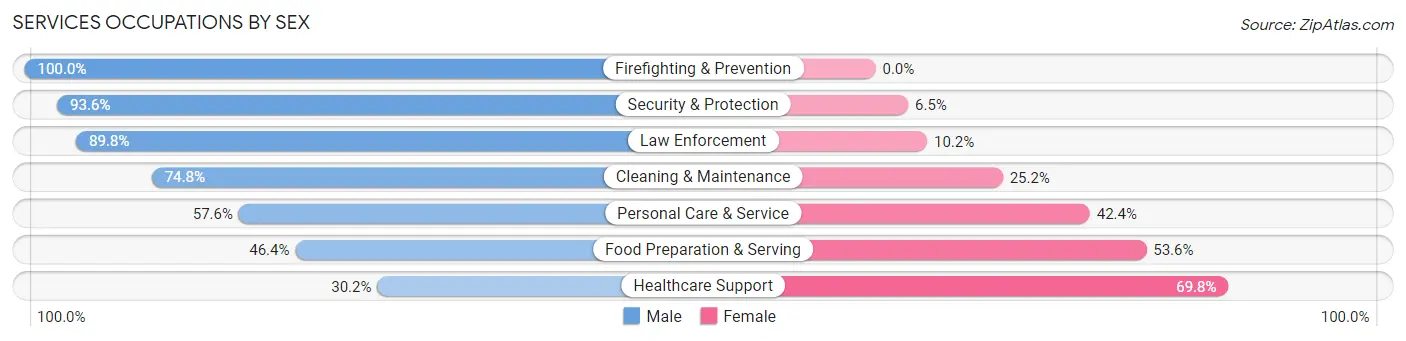
Services Occupations by Sex
Within the Services occupations in Cumberland, the most male-oriented occupations are Firefighting & Prevention (100.0%), Security & Protection (93.5%), and Law Enforcement (89.8%), while the most female-oriented occupations are Healthcare Support (69.8%), Food Preparation & Serving (53.6%), and Personal Care & Service (42.4%).
| Occupation | Male | Female |
| Healthcare Support | 111 (30.2%) | 257 (69.8%) |
| Security & Protection | 145 (93.5%) | 10 (6.5%) |
| Firefighting & Prevention | 57 (100.0%) | 0 (0.0%) |
| Law Enforcement | 88 (89.8%) | 10 (10.2%) |
| Food Preparation & Serving | 193 (46.4%) | 223 (53.6%) |
| Cleaning & Maintenance | 306 (74.8%) | 103 (25.2%) |
| Personal Care & Service | 133 (57.6%) | 98 (42.4%) |
| Total (Category) | 888 (56.2%) | 691 (43.8%) |
| Total (Overall) | 3,984 (55.2%) | 3,236 (44.8%) |
Sales and Office Occupations
The most common Sales and Office occupations in Cumberland are Office & Administration (1,155 | 16.0%), and Sales & Related (462 | 6.4%).
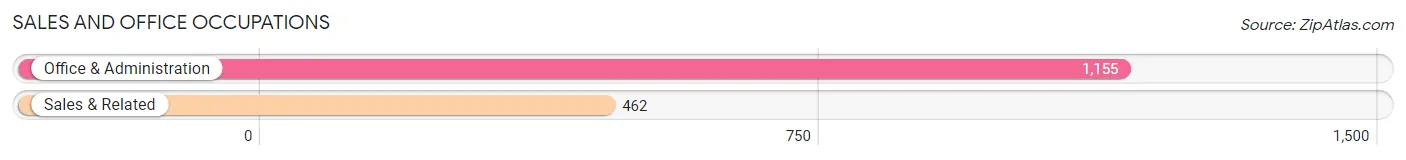
Sales and Office Occupations by Sex
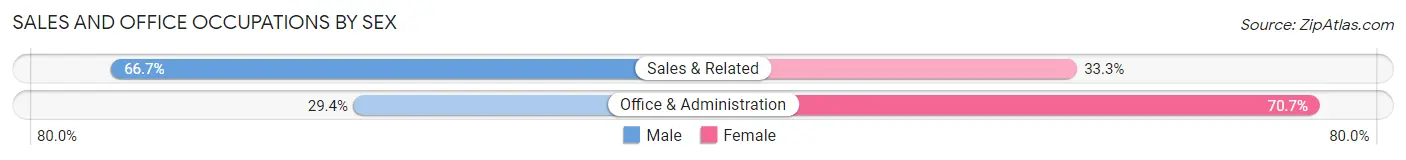
| Occupation | Male | Female |
| Sales & Related | 308 (66.7%) | 154 (33.3%) |
| Office & Administration | 339 (29.3%) | 816 (70.7%) |
| Total (Category) | 647 (40.0%) | 970 (60.0%) |
| Total (Overall) | 3,984 (55.2%) | 3,236 (44.8%) |
Natural Resources, Construction and Maintenance Occupations
The most common Natural Resources, Construction and Maintenance occupations in Cumberland are Construction & Extraction (174 | 2.4%), Installation, Maintenance & Repair (88 | 1.2%), and Farming, Fishing & Forestry (69 | 1.0%).
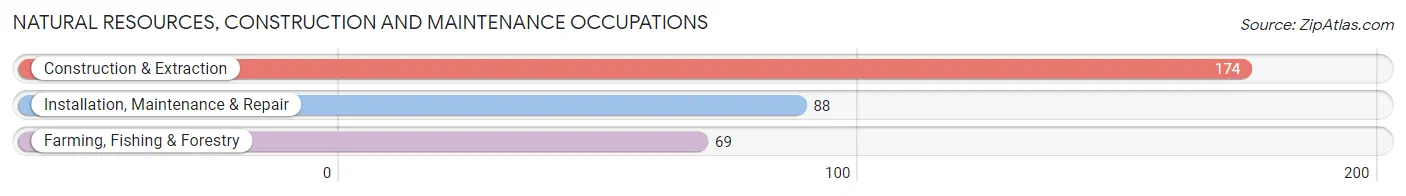
Natural Resources, Construction and Maintenance Occupations by Sex
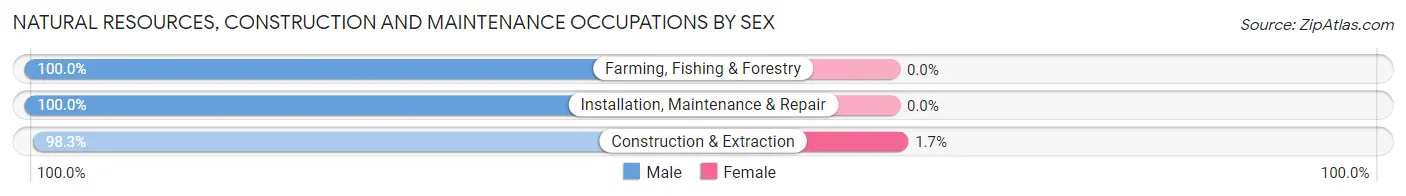
| Occupation | Male | Female |
| Farming, Fishing & Forestry | 69 (100.0%) | 0 (0.0%) |
| Construction & Extraction | 171 (98.3%) | 3 (1.7%) |
| Installation, Maintenance & Repair | 88 (100.0%) | 0 (0.0%) |
| Total (Category) | 328 (99.1%) | 3 (0.9%) |
| Total (Overall) | 3,984 (55.2%) | 3,236 (44.8%) |
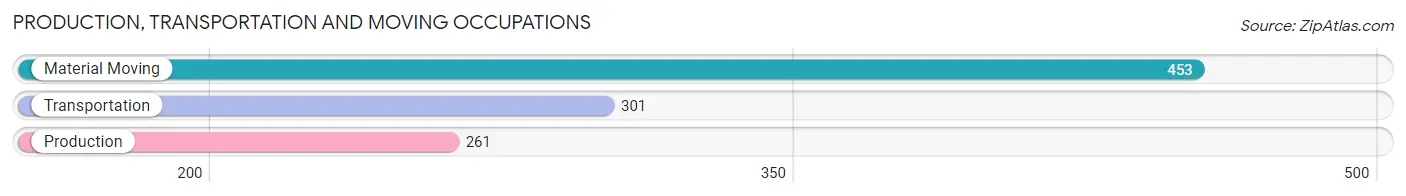
Production, Transportation and Moving Occupations
The most common Production, Transportation and Moving occupations in Cumberland are Material Moving (453 | 6.3%), Transportation (301 | 4.2%), and Production (261 | 3.6%).
Production, Transportation and Moving Occupations by Sex
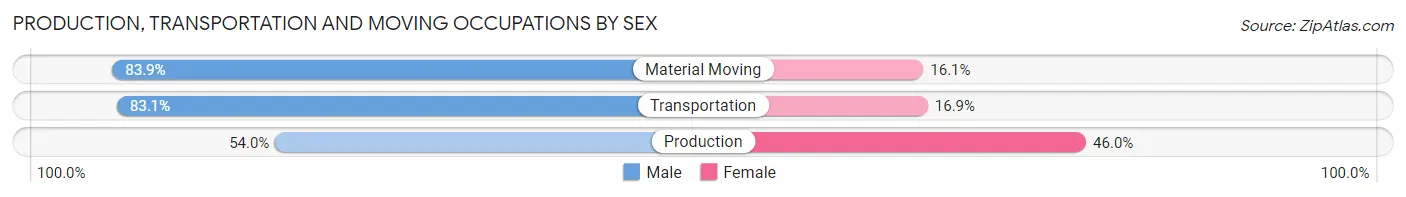
| Occupation | Male | Female |
| Production | 141 (54.0%) | 120 (46.0%) |
| Transportation | 250 (83.1%) | 51 (16.9%) |
| Material Moving | 380 (83.9%) | 73 (16.1%) |
| Total (Category) | 771 (76.0%) | 244 (24.0%) |
| Total (Overall) | 3,984 (55.2%) | 3,236 (44.8%) |
Employment Industries by Sex in Cumberland
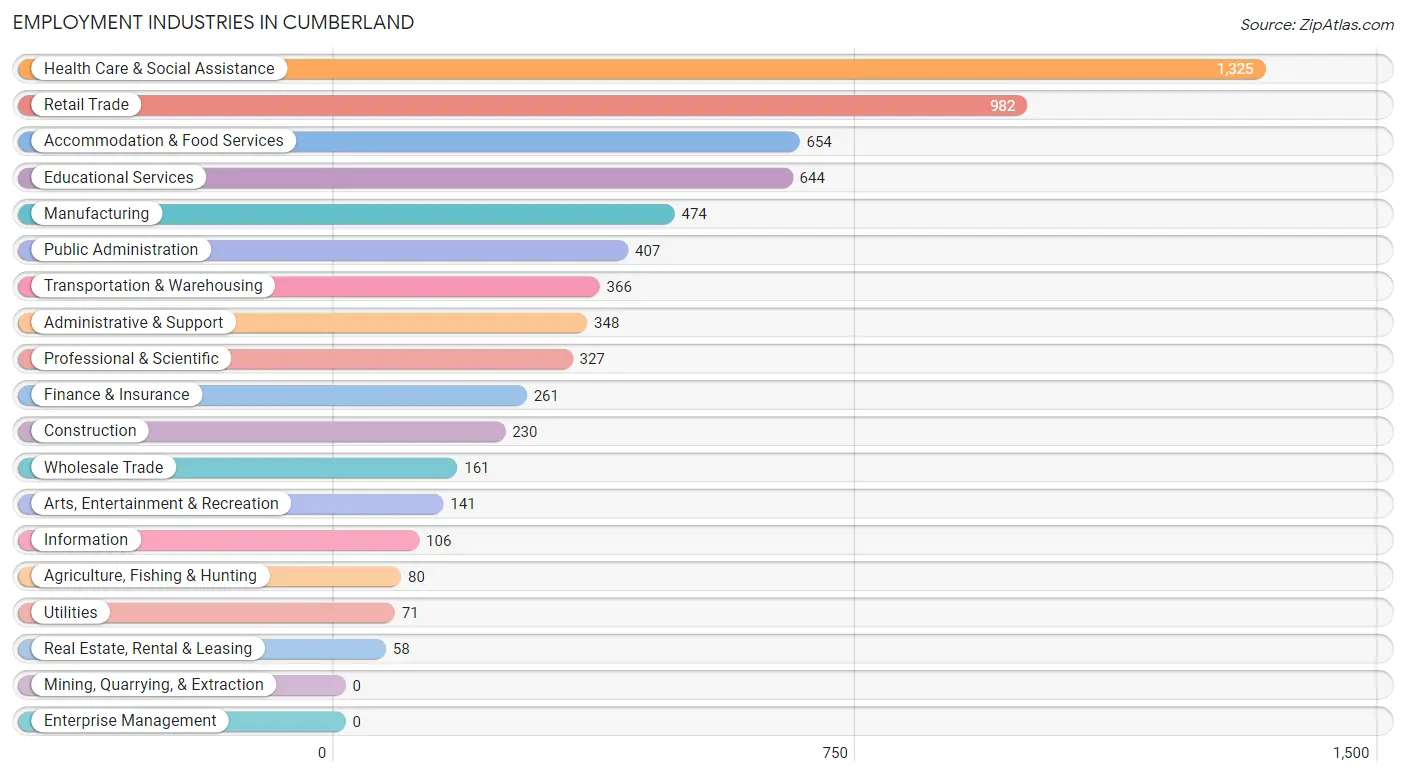
Employment Industries in Cumberland
The major employment industries in Cumberland include Health Care & Social Assistance (1,325 | 18.3%), Retail Trade (982 | 13.6%), Accommodation & Food Services (654 | 9.1%), Educational Services (644 | 8.9%), and Manufacturing (474 | 6.6%).
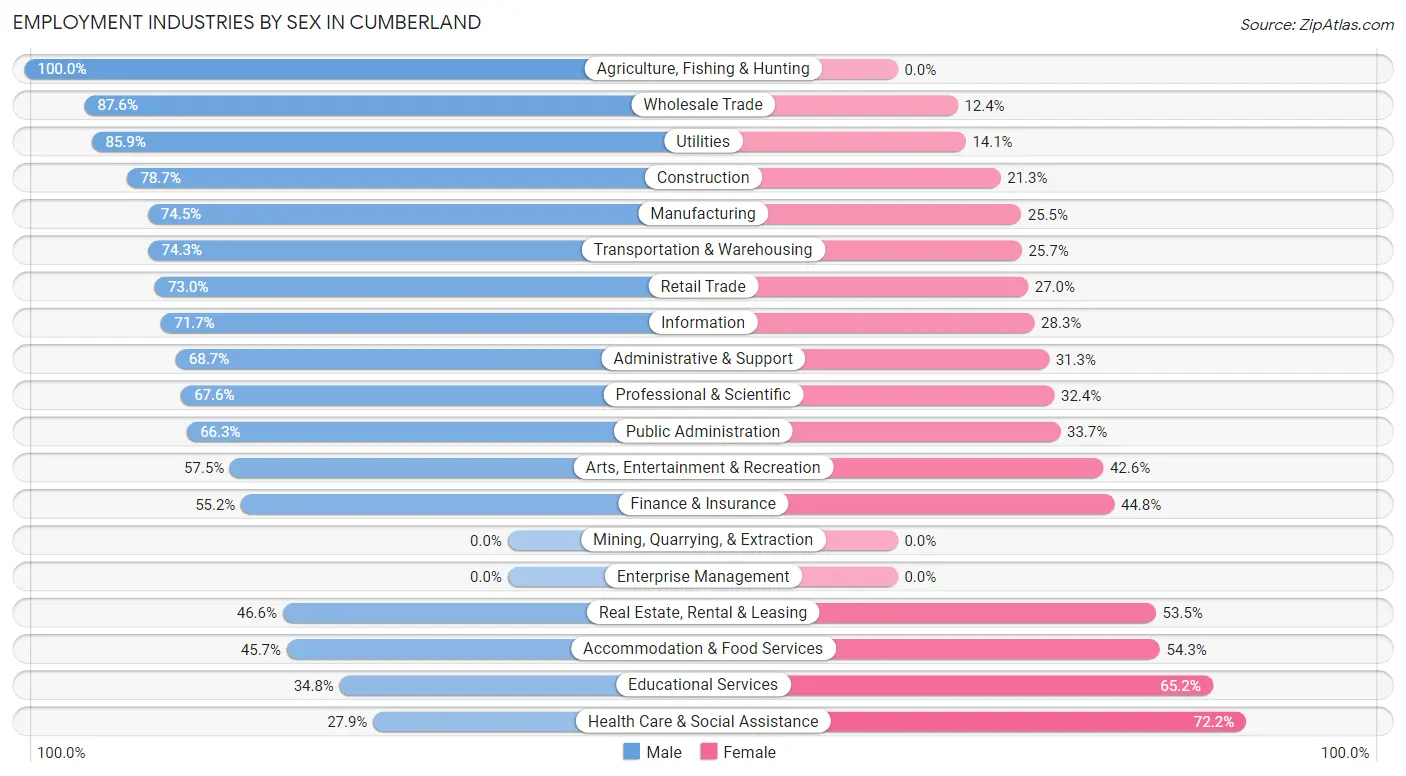
Employment Industries by Sex in Cumberland
The Cumberland industries that see more men than women are Agriculture, Fishing & Hunting (100.0%), Wholesale Trade (87.6%), and Utilities (85.9%), whereas the industries that tend to have a higher number of women are Health Care & Social Assistance (72.2%), Educational Services (65.2%), and Accommodation & Food Services (54.3%).
| Industry | Male | Female |
| Agriculture, Fishing & Hunting | 80 (100.0%) | 0 (0.0%) |
| Mining, Quarrying, & Extraction | 0 (0.0%) | 0 (0.0%) |
| Construction | 181 (78.7%) | 49 (21.3%) |
| Manufacturing | 353 (74.5%) | 121 (25.5%) |
| Wholesale Trade | 141 (87.6%) | 20 (12.4%) |
| Retail Trade | 717 (73.0%) | 265 (27.0%) |
| Transportation & Warehousing | 272 (74.3%) | 94 (25.7%) |
| Utilities | 61 (85.9%) | 10 (14.1%) |
| Information | 76 (71.7%) | 30 (28.3%) |
| Finance & Insurance | 144 (55.2%) | 117 (44.8%) |
| Real Estate, Rental & Leasing | 27 (46.6%) | 31 (53.4%) |
| Professional & Scientific | 221 (67.6%) | 106 (32.4%) |
| Enterprise Management | 0 (0.0%) | 0 (0.0%) |
| Administrative & Support | 239 (68.7%) | 109 (31.3%) |
| Educational Services | 224 (34.8%) | 420 (65.2%) |
| Health Care & Social Assistance | 369 (27.9%) | 956 (72.2%) |
| Arts, Entertainment & Recreation | 81 (57.5%) | 60 (42.5%) |
| Accommodation & Food Services | 299 (45.7%) | 355 (54.3%) |
| Public Administration | 270 (66.3%) | 137 (33.7%) |
| Total | 3,984 (55.2%) | 3,236 (44.8%) |
Education in Cumberland
School Enrollment in Cumberland
The most common levels of schooling among the 4,294 students in Cumberland are high school (1,102 | 25.7%), middle school (888 | 20.7%), and college / undergraduate (878 | 20.4%).
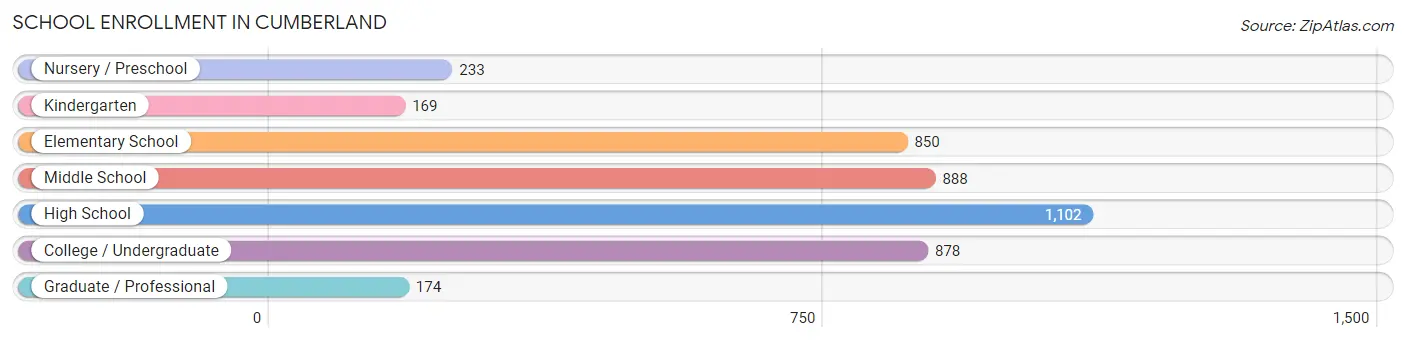
| School Level | # Students | % Students |
| Nursery / Preschool | 233 | 5.4% |
| Kindergarten | 169 | 3.9% |
| Elementary School | 850 | 19.8% |
| Middle School | 888 | 20.7% |
| High School | 1,102 | 25.7% |
| College / Undergraduate | 878 | 20.4% |
| Graduate / Professional | 174 | 4.1% |
| Total | 4,294 | 100.0% |
School Enrollment by Age by Funding Source in Cumberland
Out of a total of 4,294 students who are enrolled in schools in Cumberland, 567 (13.2%) attend a private institution, while the remaining 3,727 (86.8%) are enrolled in public schools. The age group of 3 to 4 year olds has the highest likelihood of being enrolled in private schools, with 52 (41.9% in the age bracket) enrolled. Conversely, the age group of 25 to 34 year olds has the lowest likelihood of being enrolled in a private school, with 75 (98.7% in the age bracket) attending a public institution.
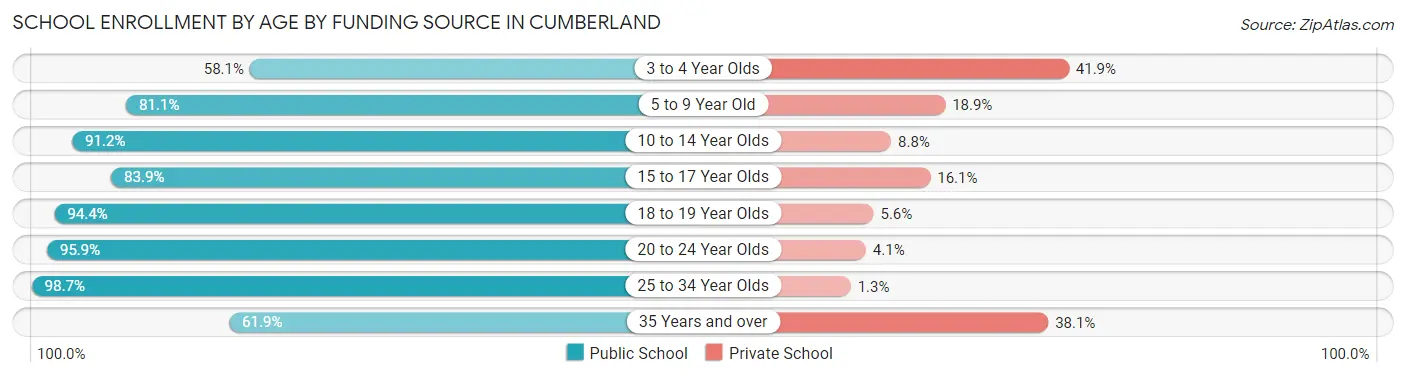
| Age Bracket | Public School | Private School |
| 3 to 4 Year Olds | 72 (58.1%) | 52 (41.9%) |
| 5 to 9 Year Old | 832 (81.1%) | 194 (18.9%) |
| 10 to 14 Year Olds | 1,073 (91.2%) | 104 (8.8%) |
| 15 to 17 Year Olds | 603 (83.9%) | 116 (16.1%) |
| 18 to 19 Year Olds | 577 (94.4%) | 34 (5.6%) |
| 20 to 24 Year Olds | 417 (95.9%) | 18 (4.1%) |
| 25 to 34 Year Olds | 75 (98.7%) | 1 (1.3%) |
| 35 Years and over | 78 (61.9%) | 48 (38.1%) |
| Total | 3,727 (86.8%) | 567 (13.2%) |
Educational Attainment by Field of Study in Cumberland
Education (484 | 15.3%), business (435 | 13.8%), social sciences (367 | 11.6%), arts & humanities (272 | 8.6%), and bio, nature & agricultural (248 | 7.9%) are the most common fields of study among 3,157 individuals in Cumberland who have obtained a bachelor's degree or higher.
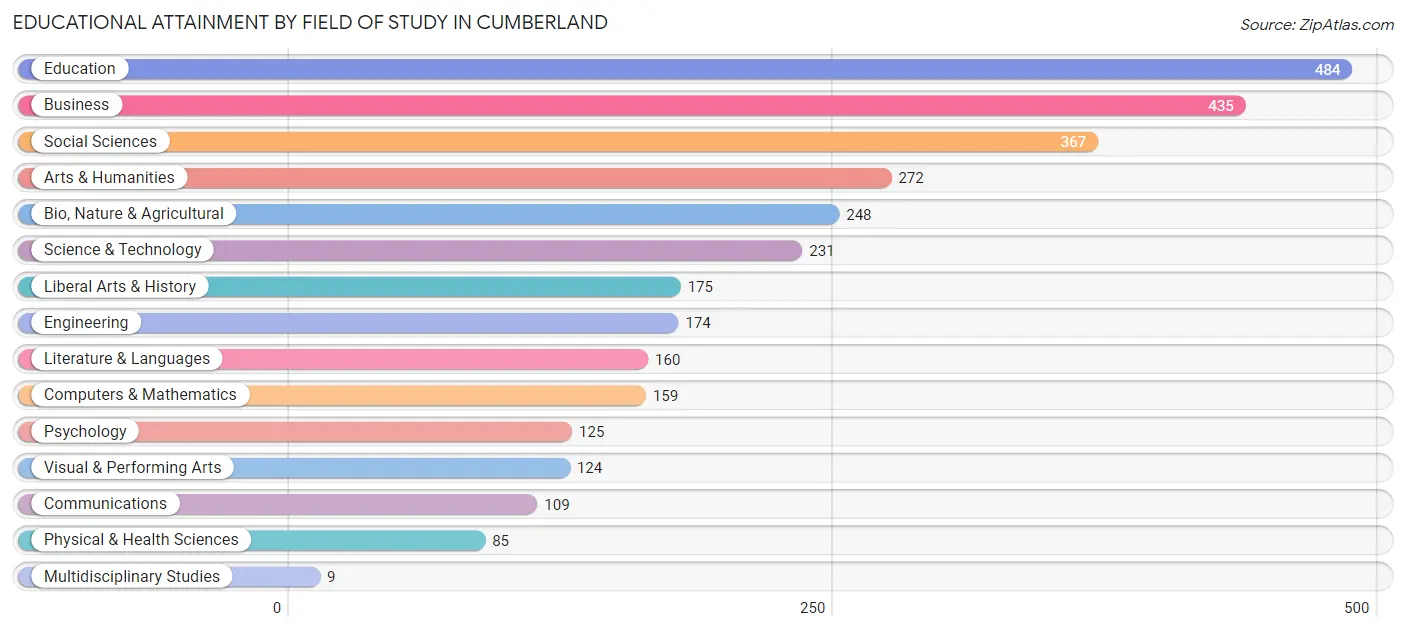
| Field of Study | # Graduates | % Graduates |
| Computers & Mathematics | 159 | 5.0% |
| Bio, Nature & Agricultural | 248 | 7.9% |
| Physical & Health Sciences | 85 | 2.7% |
| Psychology | 125 | 4.0% |
| Social Sciences | 367 | 11.6% |
| Engineering | 174 | 5.5% |
| Multidisciplinary Studies | 9 | 0.3% |
| Science & Technology | 231 | 7.3% |
| Business | 435 | 13.8% |
| Education | 484 | 15.3% |
| Literature & Languages | 160 | 5.1% |
| Liberal Arts & History | 175 | 5.5% |
| Visual & Performing Arts | 124 | 3.9% |
| Communications | 109 | 3.5% |
| Arts & Humanities | 272 | 8.6% |
| Total | 3,157 | 100.0% |
Transportation & Commute in Cumberland
Vehicle Availability by Sex in Cumberland
The most prevalent vehicle ownership categories in Cumberland are males with 2 vehicles (1,507, accounting for 39.1%) and females with 2 vehicles (1,240, making up 47.6%).
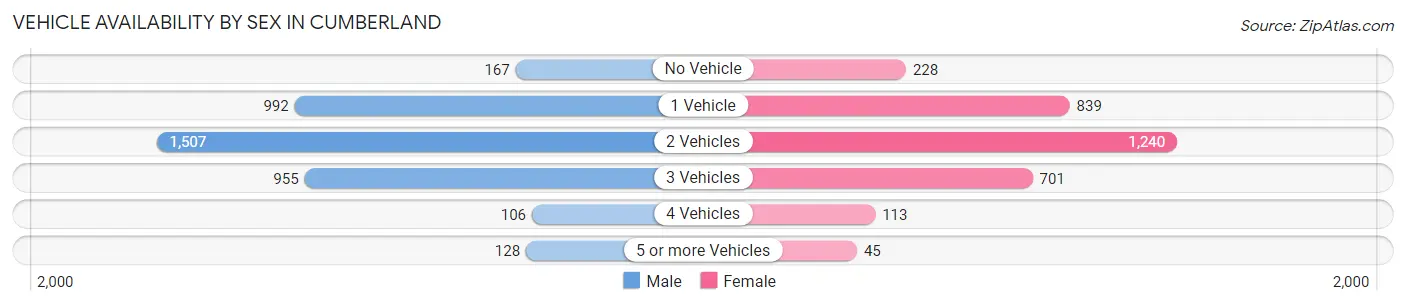
| Vehicles Available | Male | Female |
| No Vehicle | 167 (4.3%) | 228 (7.2%) |
| 1 Vehicle | 992 (25.7%) | 839 (26.5%) |
| 2 Vehicles | 1,507 (39.1%) | 1,240 (39.2%) |
| 3 Vehicles | 955 (24.8%) | 701 (22.1%) |
| 4 Vehicles | 106 (2.8%) | 113 (3.6%) |
| 5 or more Vehicles | 128 (3.3%) | 45 (1.4%) |
| Total | 3,855 (100.0%) | 3,166 (100.0%) |
Commute Time in Cumberland
The most frequently occuring commute durations in Cumberland are 10 to 14 minutes (1,663 commuters, 25.1%), 5 to 9 minutes (1,539 commuters, 23.3%), and 15 to 19 minutes (1,388 commuters, 21.0%).
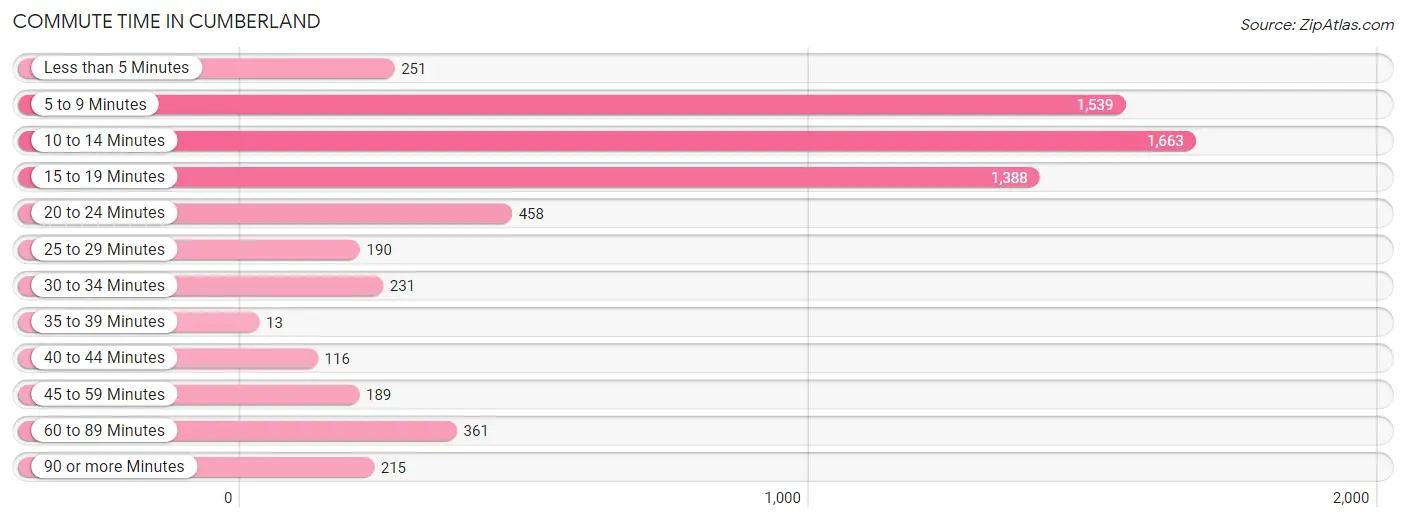
| Commute Time | # Commuters | % Commuters |
| Less than 5 Minutes | 251 | 3.8% |
| 5 to 9 Minutes | 1,539 | 23.3% |
| 10 to 14 Minutes | 1,663 | 25.1% |
| 15 to 19 Minutes | 1,388 | 21.0% |
| 20 to 24 Minutes | 458 | 6.9% |
| 25 to 29 Minutes | 190 | 2.9% |
| 30 to 34 Minutes | 231 | 3.5% |
| 35 to 39 Minutes | 13 | 0.2% |
| 40 to 44 Minutes | 116 | 1.8% |
| 45 to 59 Minutes | 189 | 2.9% |
| 60 to 89 Minutes | 361 | 5.5% |
| 90 or more Minutes | 215 | 3.3% |
Commute Time by Sex in Cumberland
The most common commute times in Cumberland are 10 to 14 minutes (939 commuters, 25.2%) for males and 5 to 9 minutes (724 commuters, 25.1%) for females.
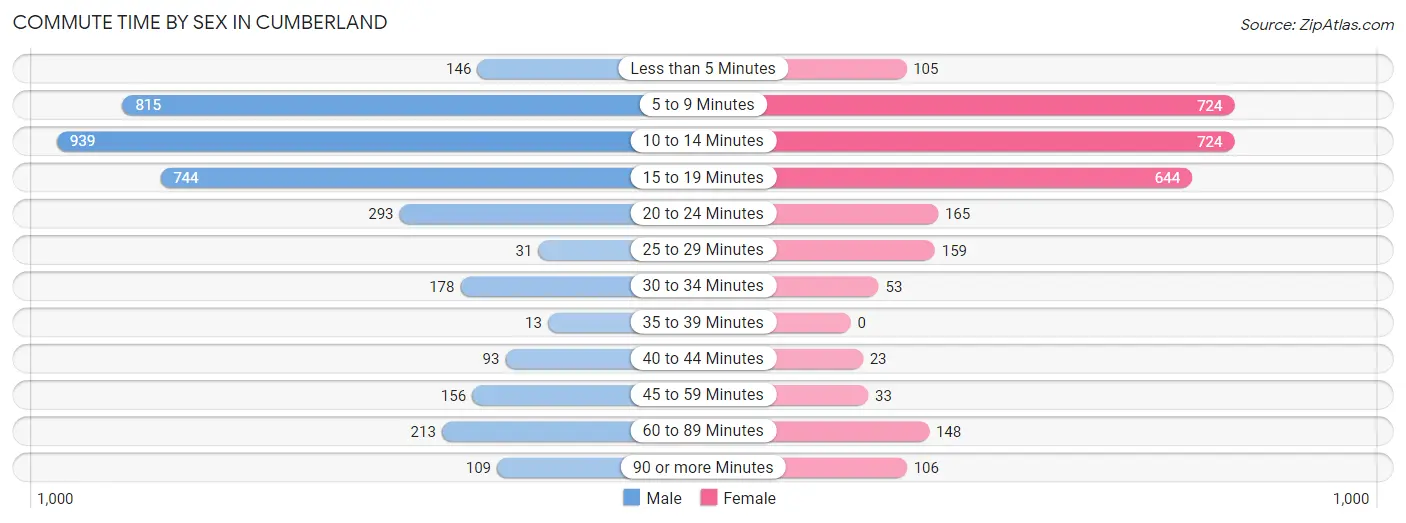
| Commute Time | Male | Female |
| Less than 5 Minutes | 146 (3.9%) | 105 (3.6%) |
| 5 to 9 Minutes | 815 (21.8%) | 724 (25.1%) |
| 10 to 14 Minutes | 939 (25.2%) | 724 (25.1%) |
| 15 to 19 Minutes | 744 (20.0%) | 644 (22.3%) |
| 20 to 24 Minutes | 293 (7.9%) | 165 (5.7%) |
| 25 to 29 Minutes | 31 (0.8%) | 159 (5.5%) |
| 30 to 34 Minutes | 178 (4.8%) | 53 (1.8%) |
| 35 to 39 Minutes | 13 (0.4%) | 0 (0.0%) |
| 40 to 44 Minutes | 93 (2.5%) | 23 (0.8%) |
| 45 to 59 Minutes | 156 (4.2%) | 33 (1.1%) |
| 60 to 89 Minutes | 213 (5.7%) | 148 (5.1%) |
| 90 or more Minutes | 109 (2.9%) | 106 (3.7%) |
Time of Departure to Work by Sex in Cumberland
The most frequent times of departure to work in Cumberland are 12:00 PM to 3:59 PM (533, 14.3%) for males and 7:00 AM to 7:29 AM (456, 15.8%) for females.
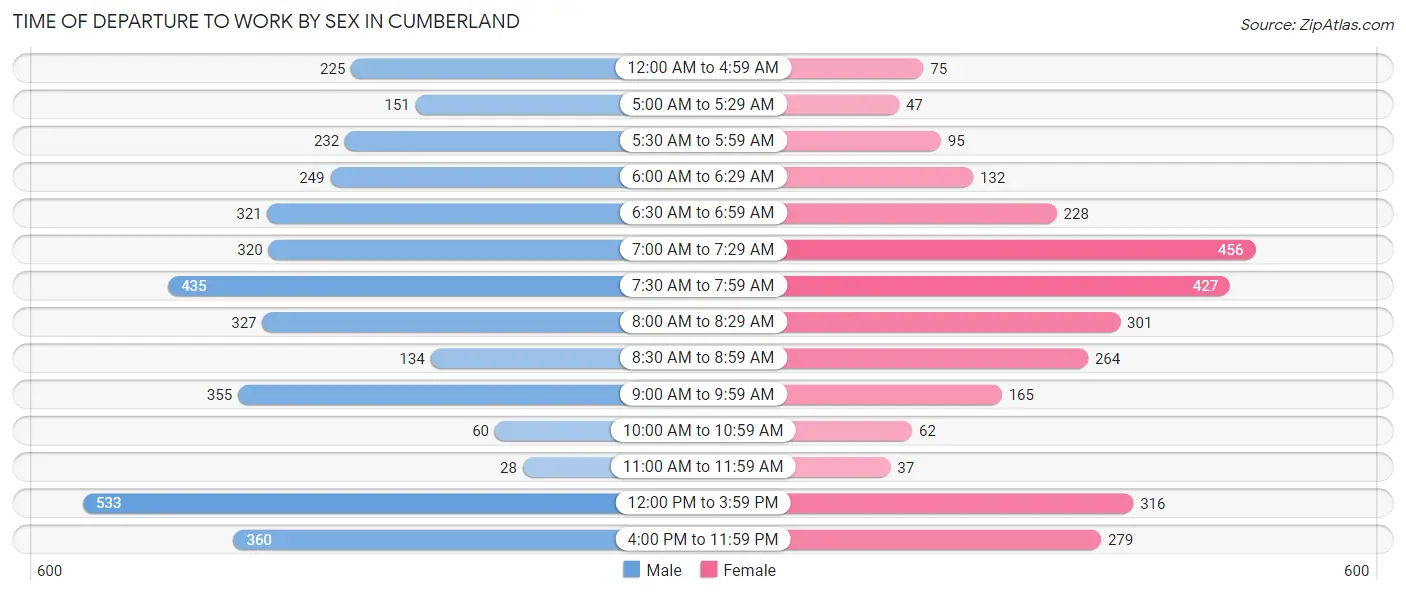
| Time of Departure | Male | Female |
| 12:00 AM to 4:59 AM | 225 (6.0%) | 75 (2.6%) |
| 5:00 AM to 5:29 AM | 151 (4.1%) | 47 (1.6%) |
| 5:30 AM to 5:59 AM | 232 (6.2%) | 95 (3.3%) |
| 6:00 AM to 6:29 AM | 249 (6.7%) | 132 (4.6%) |
| 6:30 AM to 6:59 AM | 321 (8.6%) | 228 (7.9%) |
| 7:00 AM to 7:29 AM | 320 (8.6%) | 456 (15.8%) |
| 7:30 AM to 7:59 AM | 435 (11.7%) | 427 (14.8%) |
| 8:00 AM to 8:29 AM | 327 (8.8%) | 301 (10.4%) |
| 8:30 AM to 8:59 AM | 134 (3.6%) | 264 (9.1%) |
| 9:00 AM to 9:59 AM | 355 (9.5%) | 165 (5.7%) |
| 10:00 AM to 10:59 AM | 60 (1.6%) | 62 (2.1%) |
| 11:00 AM to 11:59 AM | 28 (0.7%) | 37 (1.3%) |
| 12:00 PM to 3:59 PM | 533 (14.3%) | 316 (11.0%) |
| 4:00 PM to 11:59 PM | 360 (9.7%) | 279 (9.7%) |
| Total | 3,730 (100.0%) | 2,884 (100.0%) |
Housing Occupancy in Cumberland
Occupancy by Ownership in Cumberland
Of the total 8,343 dwellings in Cumberland, owner-occupied units account for 4,934 (59.1%), while renter-occupied units make up 3,409 (40.9%).
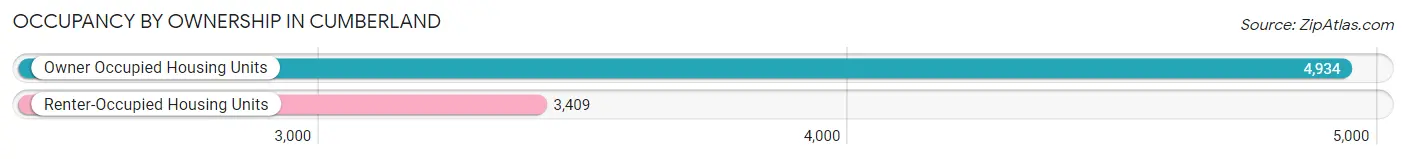
| Occupancy | # Housing Units | % Housing Units |
| Owner Occupied Housing Units | 4,934 | 59.1% |
| Renter-Occupied Housing Units | 3,409 | 40.9% |
| Total Occupied Housing Units | 8,343 | 100.0% |
Occupancy by Household Size in Cumberland
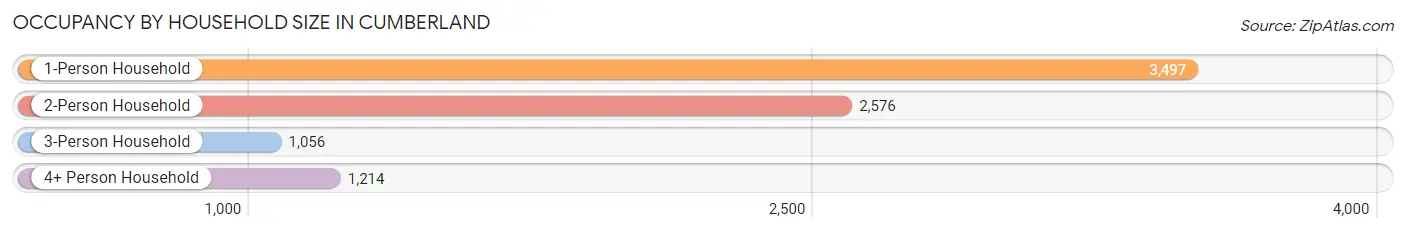
| Household Size | # Housing Units | % Housing Units |
| 1-Person Household | 3,497 | 41.9% |
| 2-Person Household | 2,576 | 30.9% |
| 3-Person Household | 1,056 | 12.7% |
| 4+ Person Household | 1,214 | 14.5% |
| Total Housing Units | 8,343 | 100.0% |
Occupancy by Ownership by Household Size in Cumberland
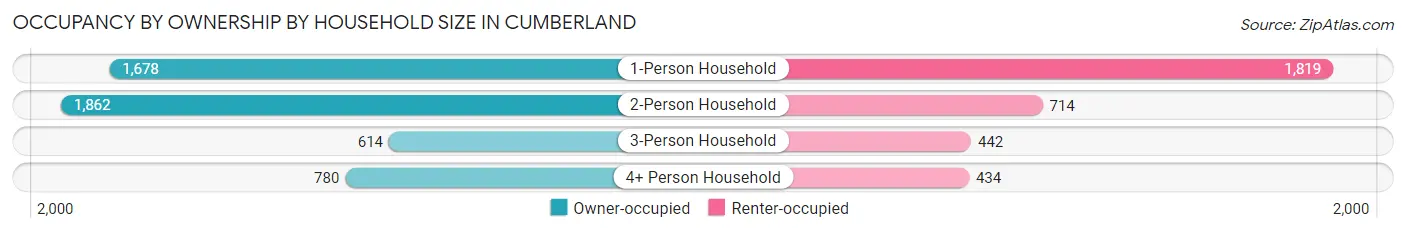
| Household Size | Owner-occupied | Renter-occupied |
| 1-Person Household | 1,678 (48.0%) | 1,819 (52.0%) |
| 2-Person Household | 1,862 (72.3%) | 714 (27.7%) |
| 3-Person Household | 614 (58.1%) | 442 (41.9%) |
| 4+ Person Household | 780 (64.2%) | 434 (35.7%) |
| Total Housing Units | 4,934 (59.1%) | 3,409 (40.9%) |
Occupancy by Educational Attainment in Cumberland
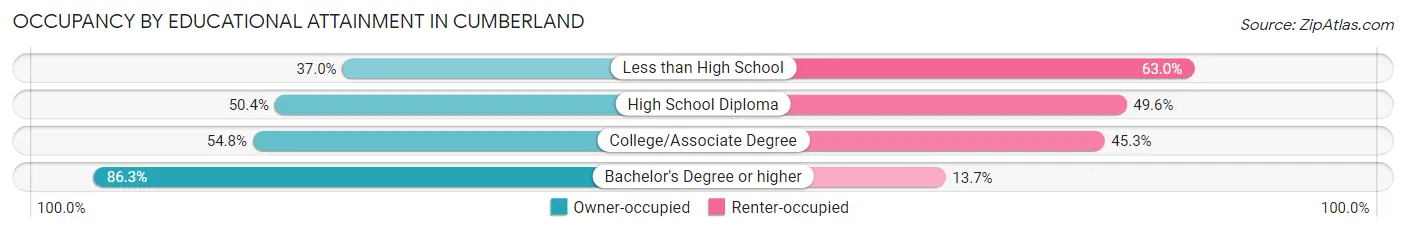
| Household Size | Owner-occupied | Renter-occupied |
| Less than High School | 260 (37.0%) | 443 (63.0%) |
| High School Diploma | 1,413 (50.4%) | 1,390 (49.6%) |
| College/Associate Degree | 1,584 (54.7%) | 1,309 (45.3%) |
| Bachelor's Degree or higher | 1,677 (86.3%) | 267 (13.7%) |
Occupancy by Age of Householder in Cumberland
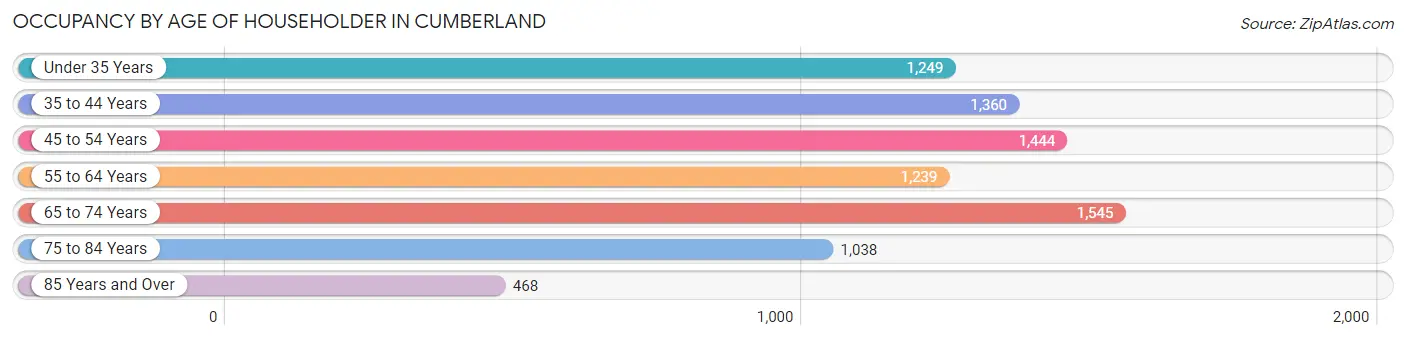
| Age Bracket | # Households | % Households |
| Under 35 Years | 1,249 | 15.0% |
| 35 to 44 Years | 1,360 | 16.3% |
| 45 to 54 Years | 1,444 | 17.3% |
| 55 to 64 Years | 1,239 | 14.8% |
| 65 to 74 Years | 1,545 | 18.5% |
| 75 to 84 Years | 1,038 | 12.4% |
| 85 Years and Over | 468 | 5.6% |
| Total | 8,343 | 100.0% |
Housing Finances in Cumberland
Median Income by Occupancy in Cumberland
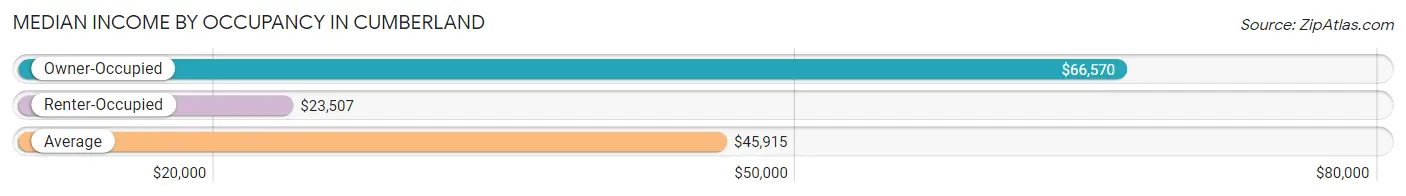
| Occupancy Type | # Households | Median Income |
| Owner-Occupied | 4,934 (59.1%) | $66,570 |
| Renter-Occupied | 3,409 (40.9%) | $23,507 |
| Average | 8,343 (100.0%) | $45,915 |
Occupancy by Householder Income Bracket in Cumberland
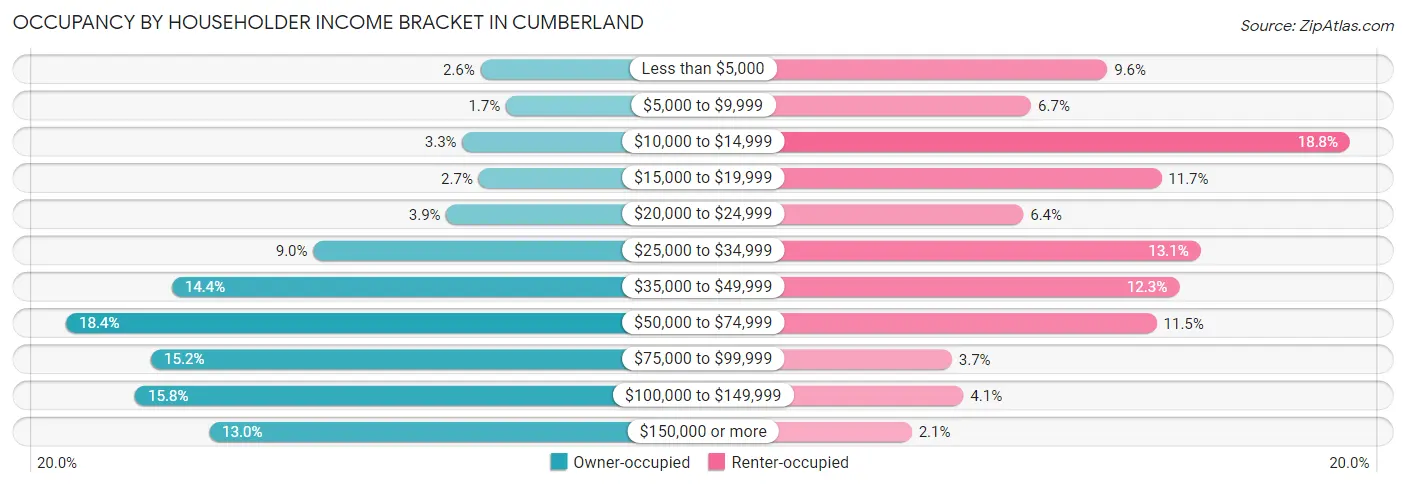
| Income Bracket | Owner-occupied | Renter-occupied |
| Less than $5,000 | 130 (2.6%) | 327 (9.6%) |
| $5,000 to $9,999 | 82 (1.7%) | 228 (6.7%) |
| $10,000 to $14,999 | 164 (3.3%) | 642 (18.8%) |
| $15,000 to $19,999 | 133 (2.7%) | 397 (11.7%) |
| $20,000 to $24,999 | 194 (3.9%) | 218 (6.4%) |
| $25,000 to $34,999 | 444 (9.0%) | 448 (13.1%) |
| $35,000 to $49,999 | 710 (14.4%) | 420 (12.3%) |
| $50,000 to $74,999 | 909 (18.4%) | 391 (11.5%) |
| $75,000 to $99,999 | 749 (15.2%) | 125 (3.7%) |
| $100,000 to $149,999 | 779 (15.8%) | 140 (4.1%) |
| $150,000 or more | 640 (13.0%) | 73 (2.1%) |
| Total | 4,934 (100.0%) | 3,409 (100.0%) |
Monthly Housing Cost Tiers in Cumberland
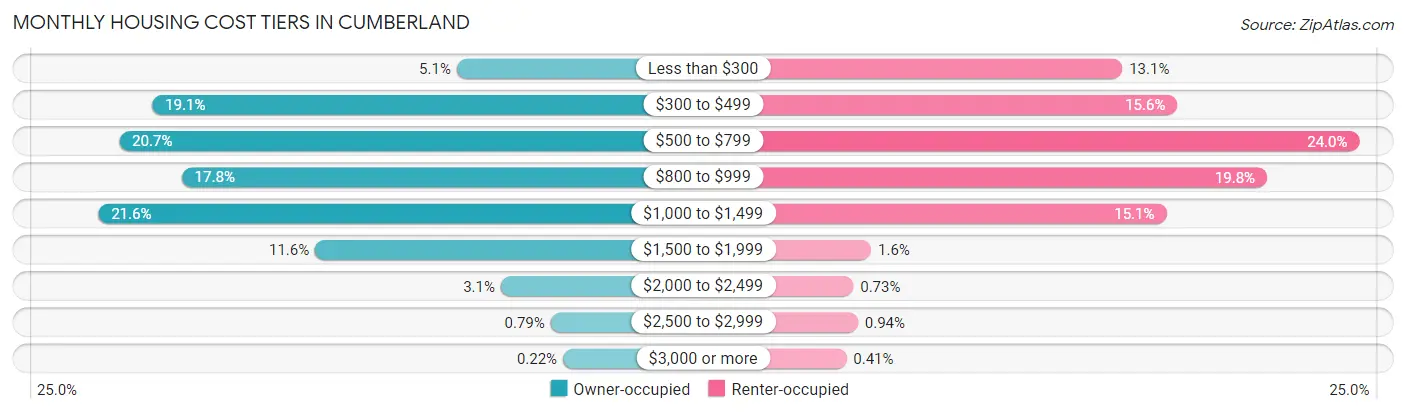
| Monthly Cost | Owner-occupied | Renter-occupied |
| Less than $300 | 252 (5.1%) | 447 (13.1%) |
| $300 to $499 | 944 (19.1%) | 533 (15.6%) |
| $500 to $799 | 1,019 (20.6%) | 819 (24.0%) |
| $800 to $999 | 877 (17.8%) | 674 (19.8%) |
| $1,000 to $1,499 | 1,066 (21.6%) | 516 (15.1%) |
| $1,500 to $1,999 | 574 (11.6%) | 53 (1.5%) |
| $2,000 to $2,499 | 152 (3.1%) | 25 (0.7%) |
| $2,500 to $2,999 | 39 (0.8%) | 32 (0.9%) |
| $3,000 or more | 11 (0.2%) | 14 (0.4%) |
| Total | 4,934 (100.0%) | 3,409 (100.0%) |
Physical Housing Characteristics in Cumberland
Housing Structures in Cumberland
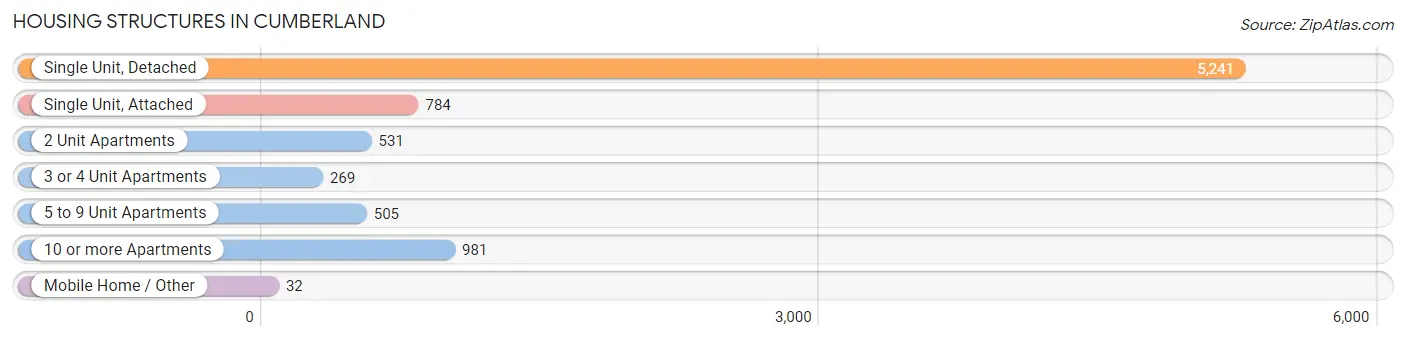
| Structure Type | # Housing Units | % Housing Units |
| Single Unit, Detached | 5,241 | 62.8% |
| Single Unit, Attached | 784 | 9.4% |
| 2 Unit Apartments | 531 | 6.4% |
| 3 or 4 Unit Apartments | 269 | 3.2% |
| 5 to 9 Unit Apartments | 505 | 6.0% |
| 10 or more Apartments | 981 | 11.8% |
| Mobile Home / Other | 32 | 0.4% |
| Total | 8,343 | 100.0% |
Housing Structures by Occupancy in Cumberland
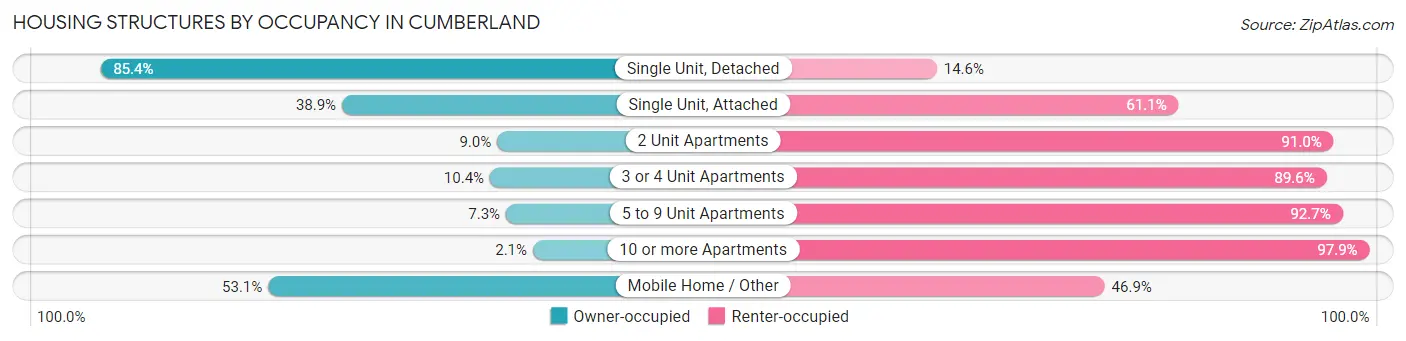
| Structure Type | Owner-occupied | Renter-occupied |
| Single Unit, Detached | 4,478 (85.4%) | 763 (14.6%) |
| Single Unit, Attached | 305 (38.9%) | 479 (61.1%) |
| 2 Unit Apartments | 48 (9.0%) | 483 (91.0%) |
| 3 or 4 Unit Apartments | 28 (10.4%) | 241 (89.6%) |
| 5 to 9 Unit Apartments | 37 (7.3%) | 468 (92.7%) |
| 10 or more Apartments | 21 (2.1%) | 960 (97.9%) |
| Mobile Home / Other | 17 (53.1%) | 15 (46.9%) |
| Total | 4,934 (59.1%) | 3,409 (40.9%) |
Housing Structures by Number of Rooms in Cumberland
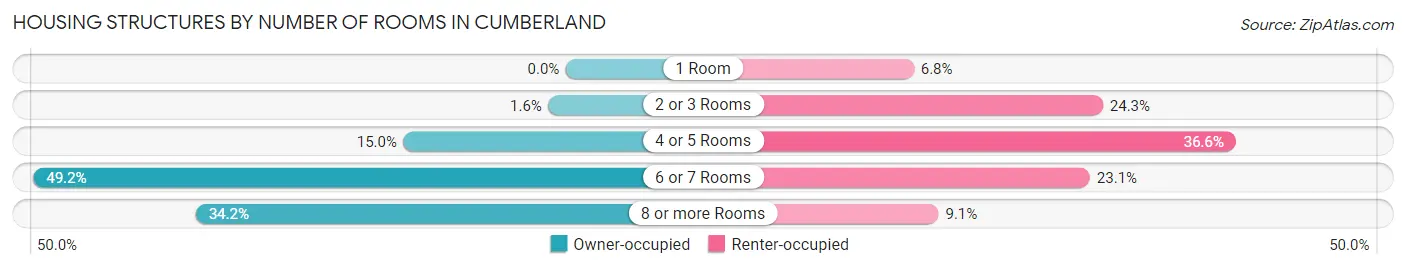
| Number of Rooms | Owner-occupied | Renter-occupied |
| 1 Room | 0 (0.0%) | 233 (6.8%) |
| 2 or 3 Rooms | 80 (1.6%) | 829 (24.3%) |
| 4 or 5 Rooms | 741 (15.0%) | 1,248 (36.6%) |
| 6 or 7 Rooms | 2,427 (49.2%) | 788 (23.1%) |
| 8 or more Rooms | 1,686 (34.2%) | 311 (9.1%) |
| Total | 4,934 (100.0%) | 3,409 (100.0%) |
Housing Structure by Heating Type in Cumberland
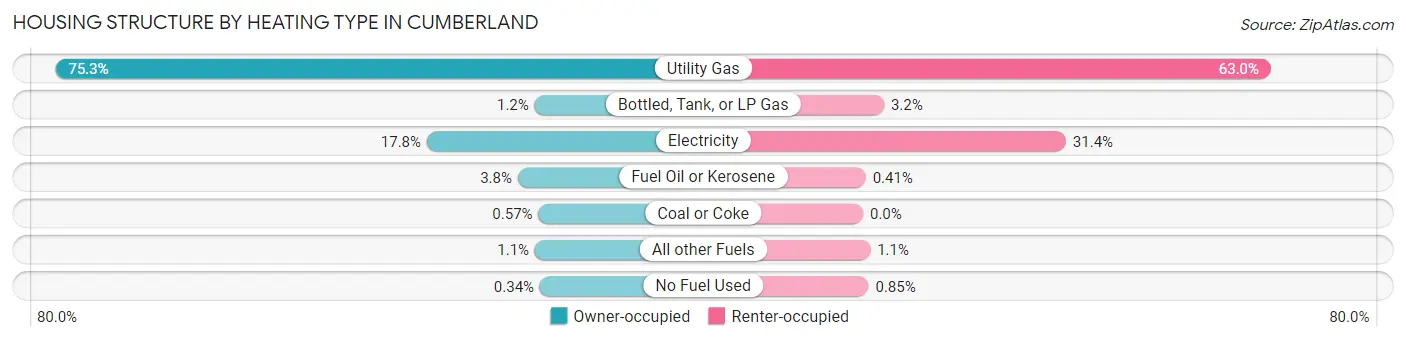
| Heating Type | Owner-occupied | Renter-occupied |
| Utility Gas | 3,713 (75.2%) | 2,149 (63.0%) |
| Bottled, Tank, or LP Gas | 57 (1.2%) | 110 (3.2%) |
| Electricity | 879 (17.8%) | 1,069 (31.4%) |
| Fuel Oil or Kerosene | 185 (3.7%) | 14 (0.4%) |
| Coal or Coke | 28 (0.6%) | 0 (0.0%) |
| All other Fuels | 55 (1.1%) | 38 (1.1%) |
| No Fuel Used | 17 (0.3%) | 29 (0.9%) |
| Total | 4,934 (100.0%) | 3,409 (100.0%) |
Household Vehicle Usage in Cumberland
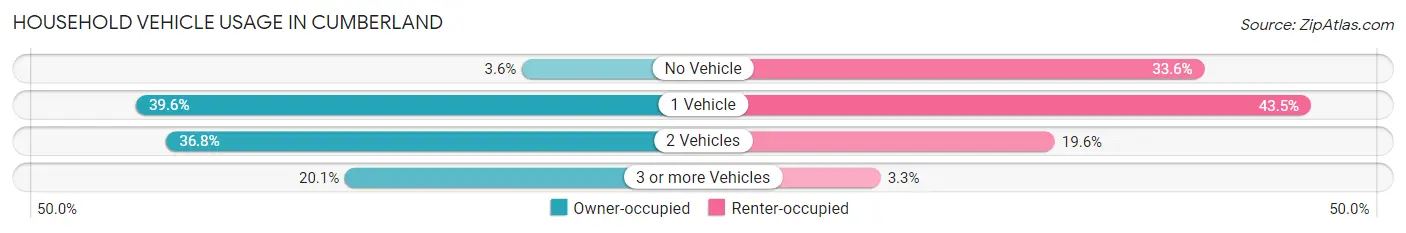
| Vehicles per Household | Owner-occupied | Renter-occupied |
| No Vehicle | 175 (3.5%) | 1,144 (33.6%) |
| 1 Vehicle | 1,954 (39.6%) | 1,483 (43.5%) |
| 2 Vehicles | 1,814 (36.8%) | 668 (19.6%) |
| 3 or more Vehicles | 991 (20.1%) | 114 (3.3%) |
| Total | 4,934 (100.0%) | 3,409 (100.0%) |
Real Estate & Mortgages in Cumberland
Real Estate and Mortgage Overview in Cumberland
| Characteristic | Without Mortgage | With Mortgage |
| Housing Units | 2,282 | 2,652 |
| Median Property Value | $116,500 | $122,000 |
| Median Household Income | $53,636 | $339 |
| Monthly Housing Costs | $498 | $11 |
| Real Estate Taxes | $1,827 | $29 |
Property Value by Mortgage Status in Cumberland
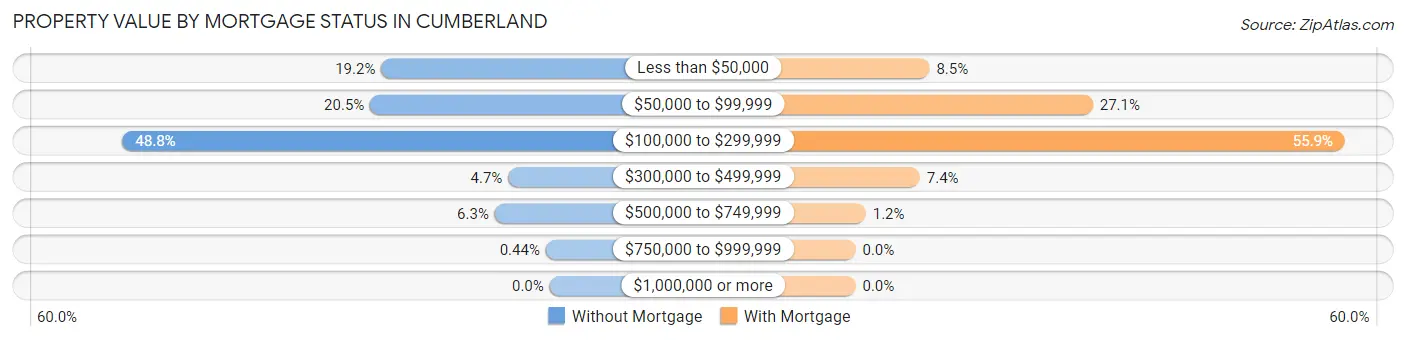
| Property Value | Without Mortgage | With Mortgage |
| Less than $50,000 | 439 (19.2%) | 224 (8.5%) |
| $50,000 to $99,999 | 468 (20.5%) | 719 (27.1%) |
| $100,000 to $299,999 | 1,114 (48.8%) | 1,483 (55.9%) |
| $300,000 to $499,999 | 108 (4.7%) | 195 (7.3%) |
| $500,000 to $749,999 | 143 (6.3%) | 31 (1.2%) |
| $750,000 to $999,999 | 10 (0.4%) | 0 (0.0%) |
| $1,000,000 or more | 0 (0.0%) | 0 (0.0%) |
| Total | 2,282 (100.0%) | 2,652 (100.0%) |
Household Income by Mortgage Status in Cumberland
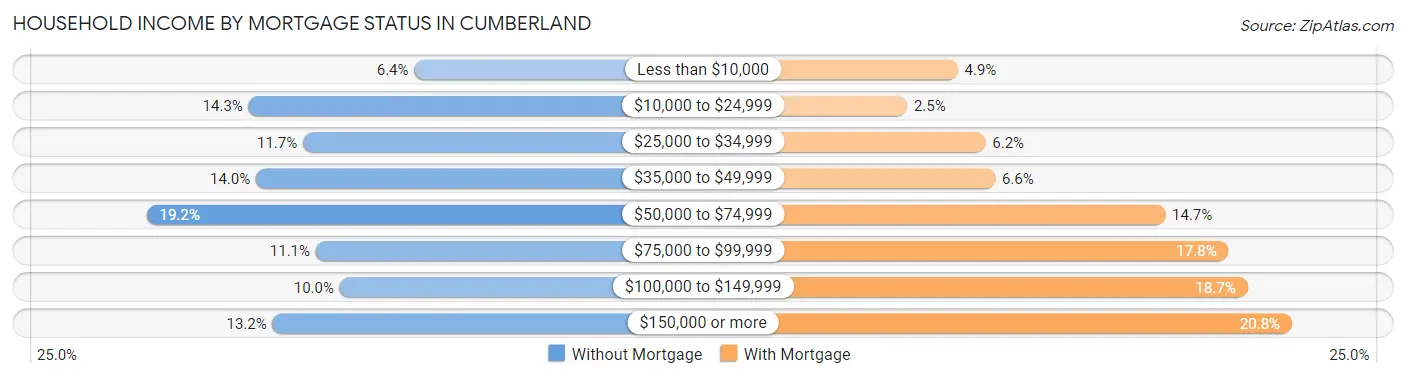
| Household Income | Without Mortgage | With Mortgage |
| Less than $10,000 | 147 (6.4%) | 129 (4.9%) |
| $10,000 to $24,999 | 327 (14.3%) | 65 (2.5%) |
| $25,000 to $34,999 | 268 (11.7%) | 164 (6.2%) |
| $35,000 to $49,999 | 319 (14.0%) | 176 (6.6%) |
| $50,000 to $74,999 | 438 (19.2%) | 391 (14.7%) |
| $75,000 to $99,999 | 254 (11.1%) | 471 (17.8%) |
| $100,000 to $149,999 | 228 (10.0%) | 495 (18.7%) |
| $150,000 or more | 301 (13.2%) | 551 (20.8%) |
| Total | 2,282 (100.0%) | 2,652 (100.0%) |
Property Value to Household Income Ratio in Cumberland
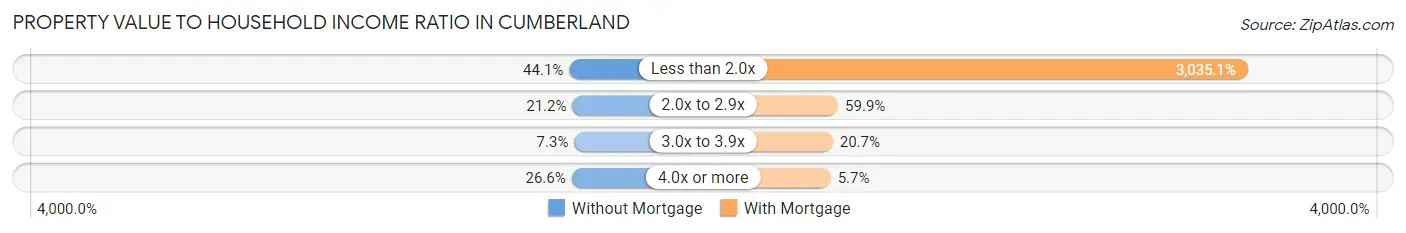
| Value-to-Income Ratio | Without Mortgage | With Mortgage |
| Less than 2.0x | 1,007 (44.1%) | 80,492 (3,035.1%) |
| 2.0x to 2.9x | 484 (21.2%) | 1,588 (59.9%) |
| 3.0x to 3.9x | 166 (7.3%) | 550 (20.7%) |
| 4.0x or more | 607 (26.6%) | 152 (5.7%) |
| Total | 2,282 (100.0%) | 2,652 (100.0%) |
Real Estate Taxes by Mortgage Status in Cumberland
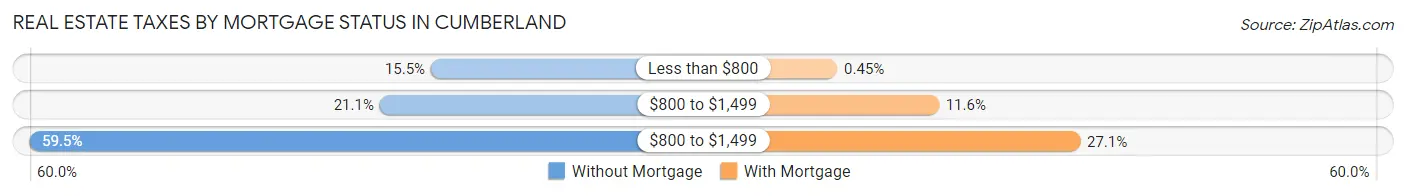
| Property Taxes | Without Mortgage | With Mortgage |
| Less than $800 | 353 (15.5%) | 12 (0.4%) |
| $800 to $1,499 | 481 (21.1%) | 307 (11.6%) |
| $800 to $1,499 | 1,358 (59.5%) | 718 (27.1%) |
| Total | 2,282 (100.0%) | 2,652 (100.0%) |
Health & Disability in Cumberland
Health Insurance Coverage by Age in Cumberland
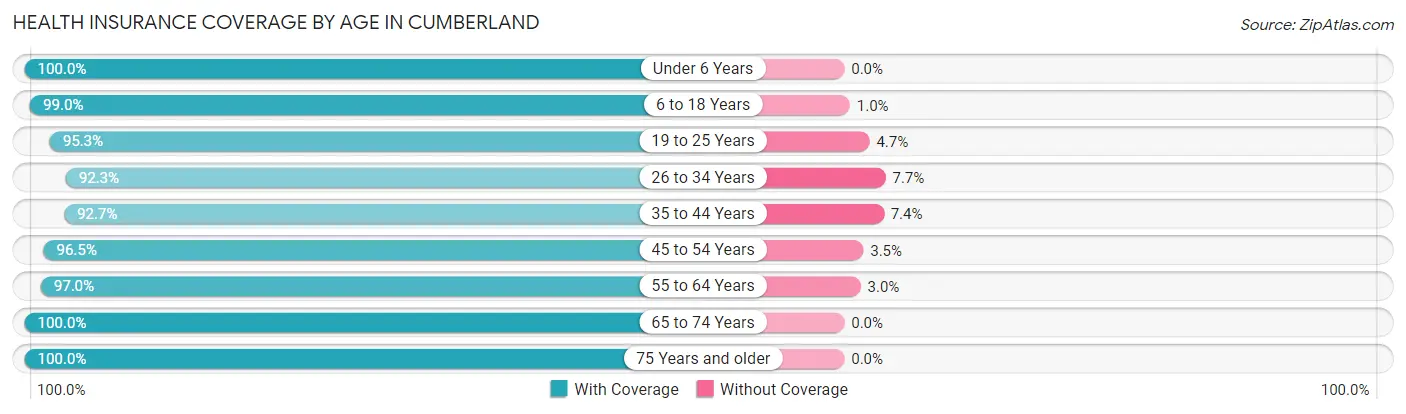
| Age Bracket | With Coverage | Without Coverage |
| Under 6 Years | 1,079 (100.0%) | 0 (0.0%) |
| 6 to 18 Years | 3,136 (99.0%) | 33 (1.0%) |
| 19 to 25 Years | 1,948 (95.3%) | 96 (4.7%) |
| 26 to 34 Years | 1,417 (92.3%) | 118 (7.7%) |
| 35 to 44 Years | 2,155 (92.6%) | 171 (7.3%) |
| 45 to 54 Years | 1,988 (96.5%) | 73 (3.5%) |
| 55 to 64 Years | 2,171 (97.0%) | 68 (3.0%) |
| 65 to 74 Years | 2,224 (100.0%) | 0 (0.0%) |
| 75 Years and older | 1,897 (100.0%) | 0 (0.0%) |
| Total | 18,015 (97.0%) | 559 (3.0%) |
Health Insurance Coverage by Citizenship Status in Cumberland
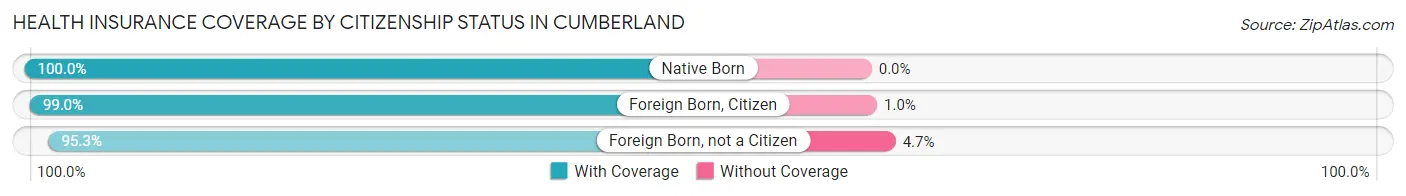
| Citizenship Status | With Coverage | Without Coverage |
| Native Born | 1,079 (100.0%) | 0 (0.0%) |
| Foreign Born, Citizen | 3,136 (99.0%) | 33 (1.0%) |
| Foreign Born, not a Citizen | 1,948 (95.3%) | 96 (4.7%) |
Health Insurance Coverage by Household Income in Cumberland
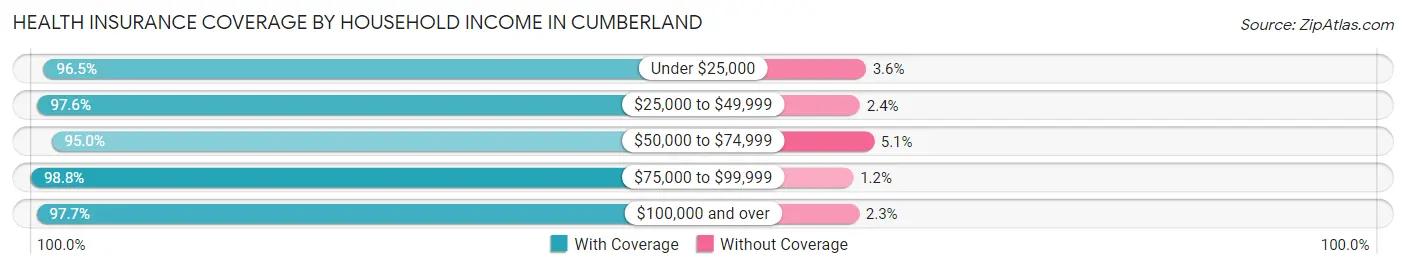
| Household Income | With Coverage | Without Coverage |
| Under $25,000 | 3,564 (96.5%) | 131 (3.5%) |
| $25,000 to $49,999 | 4,287 (97.6%) | 107 (2.4%) |
| $50,000 to $74,999 | 2,744 (95.0%) | 146 (5.1%) |
| $75,000 to $99,999 | 2,223 (98.8%) | 27 (1.2%) |
| $100,000 and over | 4,546 (97.7%) | 105 (2.3%) |
Public vs Private Health Insurance Coverage by Age in Cumberland
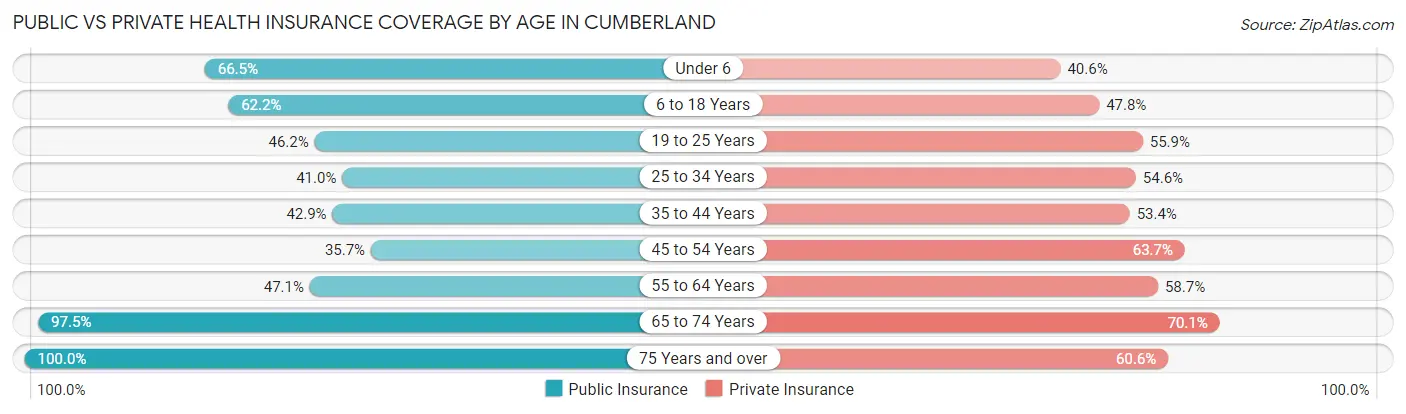
| Age Bracket | Public Insurance | Private Insurance |
| Under 6 | 718 (66.5%) | 438 (40.6%) |
| 6 to 18 Years | 1,971 (62.2%) | 1,514 (47.8%) |
| 19 to 25 Years | 944 (46.2%) | 1,142 (55.9%) |
| 25 to 34 Years | 630 (41.0%) | 838 (54.6%) |
| 35 to 44 Years | 997 (42.9%) | 1,243 (53.4%) |
| 45 to 54 Years | 736 (35.7%) | 1,312 (63.7%) |
| 55 to 64 Years | 1,054 (47.1%) | 1,314 (58.7%) |
| 65 to 74 Years | 2,168 (97.5%) | 1,560 (70.1%) |
| 75 Years and over | 1,897 (100.0%) | 1,149 (60.6%) |
| Total | 11,115 (59.8%) | 10,510 (56.6%) |
Disability Status by Sex by Age in Cumberland
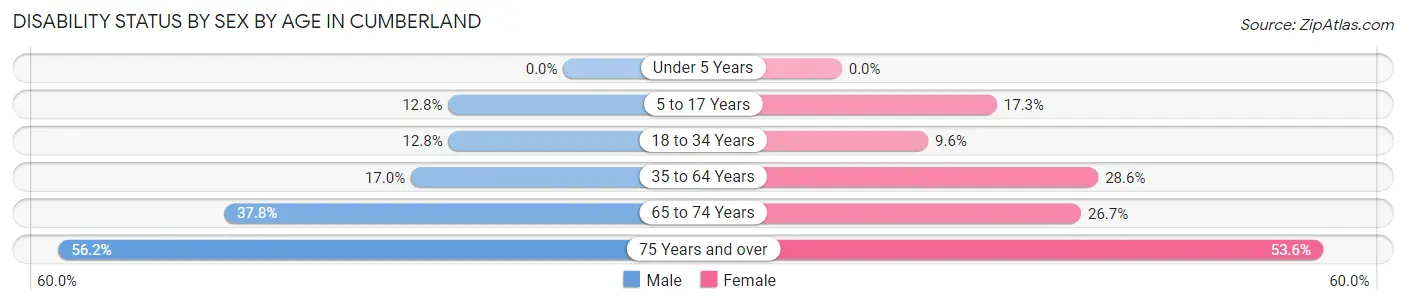
| Age Bracket | Male | Female |
| Under 5 Years | 0 (0.0%) | 0 (0.0%) |
| 5 to 17 Years | 216 (12.8%) | 224 (17.3%) |
| 18 to 34 Years | 266 (12.8%) | 185 (9.6%) |
| 35 to 64 Years | 557 (17.0%) | 955 (28.6%) |
| 65 to 74 Years | 418 (37.8%) | 298 (26.7%) |
| 75 Years and over | 419 (56.2%) | 617 (53.6%) |
Disability Class by Sex by Age in Cumberland
Disability Class: Hearing Difficulty
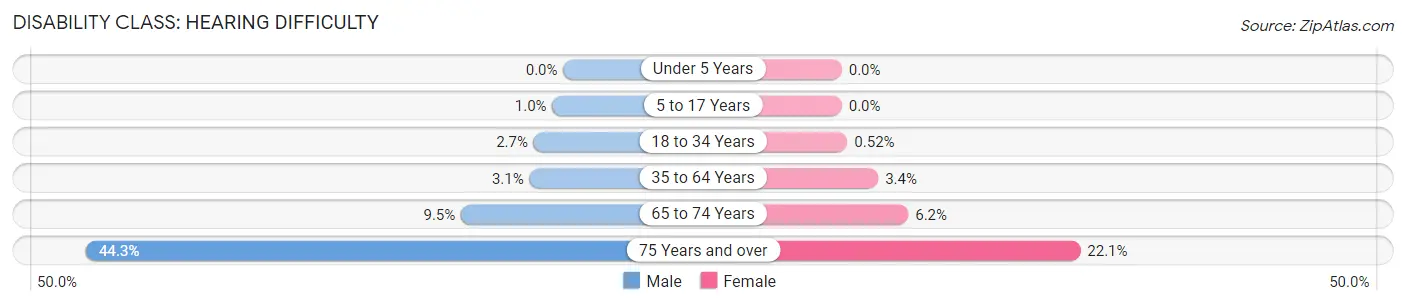
| Age Bracket | Male | Female |
| Under 5 Years | 0 (0.0%) | 0 (0.0%) |
| 5 to 17 Years | 17 (1.0%) | 0 (0.0%) |
| 18 to 34 Years | 57 (2.7%) | 10 (0.5%) |
| 35 to 64 Years | 103 (3.1%) | 113 (3.4%) |
| 65 to 74 Years | 105 (9.5%) | 69 (6.2%) |
| 75 Years and over | 330 (44.3%) | 255 (22.1%) |
Disability Class: Vision Difficulty
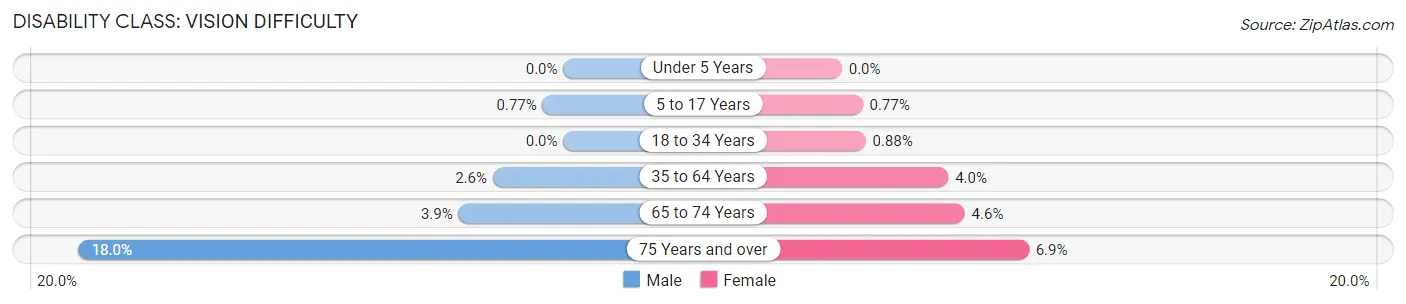
| Age Bracket | Male | Female |
| Under 5 Years | 0 (0.0%) | 0 (0.0%) |
| 5 to 17 Years | 13 (0.8%) | 10 (0.8%) |
| 18 to 34 Years | 0 (0.0%) | 17 (0.9%) |
| 35 to 64 Years | 86 (2.6%) | 132 (4.0%) |
| 65 to 74 Years | 43 (3.9%) | 51 (4.6%) |
| 75 Years and over | 134 (18.0%) | 80 (6.9%) |
Disability Class: Cognitive Difficulty
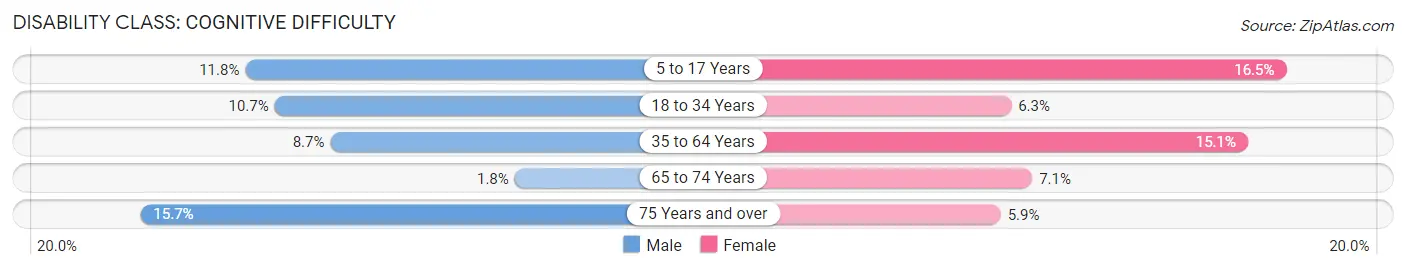
| Age Bracket | Male | Female |
| 5 to 17 Years | 199 (11.8%) | 214 (16.5%) |
| 18 to 34 Years | 223 (10.7%) | 121 (6.3%) |
| 35 to 64 Years | 284 (8.6%) | 504 (15.1%) |
| 65 to 74 Years | 20 (1.8%) | 79 (7.1%) |
| 75 Years and over | 117 (15.7%) | 68 (5.9%) |
Disability Class: Ambulatory Difficulty
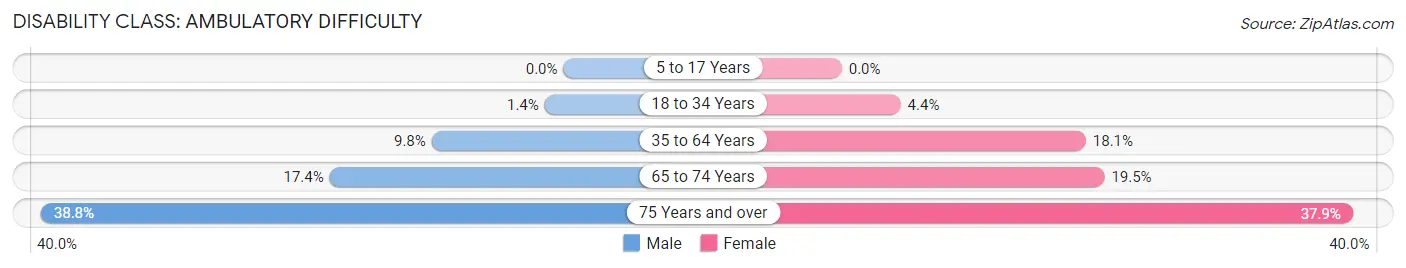
| Age Bracket | Male | Female |
| 5 to 17 Years | 0 (0.0%) | 0 (0.0%) |
| 18 to 34 Years | 29 (1.4%) | 84 (4.4%) |
| 35 to 64 Years | 321 (9.8%) | 606 (18.1%) |
| 65 to 74 Years | 192 (17.4%) | 218 (19.5%) |
| 75 Years and over | 289 (38.8%) | 437 (37.9%) |
Disability Class: Self-Care Difficulty
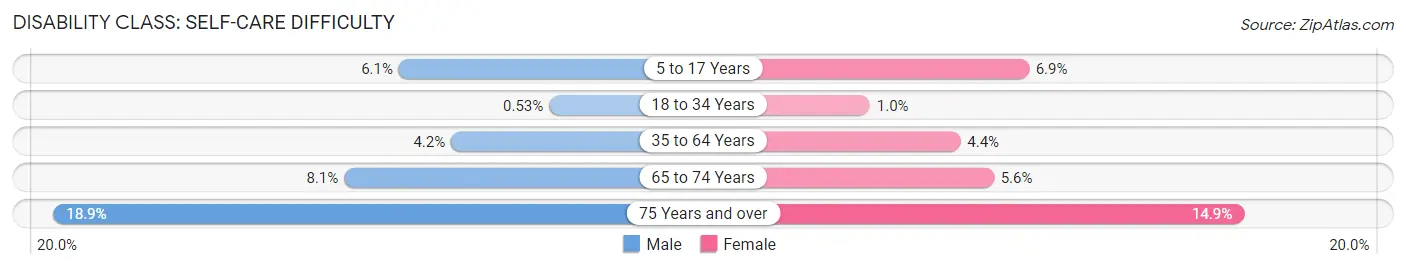
| Age Bracket | Male | Female |
| 5 to 17 Years | 103 (6.1%) | 90 (6.9%) |
| 18 to 34 Years | 11 (0.5%) | 20 (1.0%) |
| 35 to 64 Years | 137 (4.2%) | 147 (4.4%) |
| 65 to 74 Years | 90 (8.1%) | 63 (5.6%) |
| 75 Years and over | 141 (18.9%) | 172 (14.9%) |
Technology Access in Cumberland
Computing Device Access in Cumberland
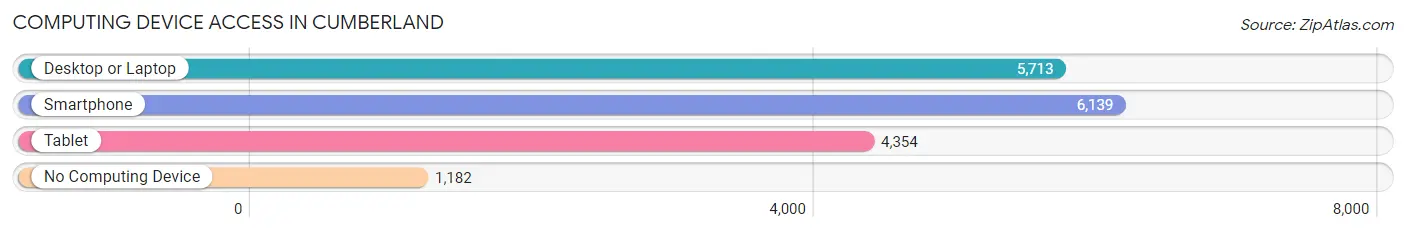
| Device Type | # Households | % Households |
| Desktop or Laptop | 5,713 | 68.5% |
| Smartphone | 6,139 | 73.6% |
| Tablet | 4,354 | 52.2% |
| No Computing Device | 1,182 | 14.2% |
| Total | 8,343 | 100.0% |
Internet Access in Cumberland
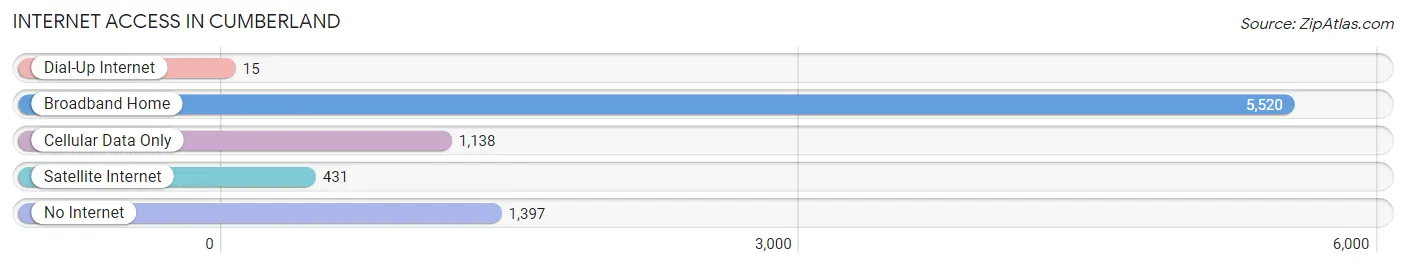
| Internet Type | # Households | % Households |
| Dial-Up Internet | 15 | 0.2% |
| Broadband Home | 5,520 | 66.2% |
| Cellular Data Only | 1,138 | 13.6% |
| Satellite Internet | 431 | 5.2% |
| No Internet | 1,397 | 16.7% |
| Total | 8,343 | 100.0% |
Cumberland Summary
Cumberland, Maryland is a city located in Allegany County, Maryland, United States. It is the county seat of Allegany County and the primary city of the Cumberland, MD-WV Metropolitan Statistical Area. The population of Cumberland was 20,859 at the 2010 census, making it the second-largest city in the state after Baltimore.
History
Cumberland was first settled in 1750 by English and German settlers. The town was named after the Duke of Cumberland, a son of King George II. The town was incorporated in 1787 and became an important transportation hub in the 19th century due to its location at the junction of the Chesapeake and Ohio Canal and the Baltimore and Ohio Railroad. The city was an important industrial center during the 19th and early 20th centuries, with industries such as steel, coal, and textiles.
Geography
Cumberland is located in the Appalachian Mountains of western Maryland, at the confluence of the Potomac and North Branch Potomac Rivers. The city is situated at the base of Wills Mountain, which rises to an elevation of 2,260 feet (689 m). The city has a total area of 8.2 square miles (21.2 km2), of which 8.1 square miles (21.0 km2) is land and 0.1 square miles (0.2 km2) is water.
Economy
Cumberland is a major economic center for western Maryland. The city is home to a variety of industries, including manufacturing, healthcare, retail, and tourism. The city is also home to several major employers, including Allegany County Public Schools, Allegany County Government, and the Allegany County Health Department.
Demographics
As of the 2010 census, there were 20,859 people, 8,637 households, and 5,072 families residing in the city. The population density was 2,567.2 people per square mile (991.2/km2). There were 9,521 housing units at an average density of 1,173.3 per square mile (453.2/km2). The racial makeup of the city was 87.2% White, 8.7% African American, 0.3% Native American, 0.7% Asian, 0.1% Pacific Islander, 1.2% from other races, and 2.0% from two or more races. Hispanic or Latino of any race were 3.2% of the population.
The median income for a household in the city was $31,919, and the median income for a family was $41,945. Males had a median income of $31,919 versus $25,945 for females. The per capita income for the city was $17,845. About 13.2% of families and 16.3% of the population were below the poverty line, including 22.2% of those under age 18 and 10.2% of those age 65 or over.
Common Questions
What is Per Capita Income in Cumberland?
Per Capita income in Cumberland is $29,863.
What is the Median Family Income in Cumberland?
Median Family Income in Cumberland is $63,672.
What is the Median Household income in Cumberland?
Median Household Income in Cumberland is $45,915.
What is Income or Wage Gap in Cumberland?
Income or Wage Gap in Cumberland is 23.6%.
Women in Cumberland earn 76.4 cents for every dollar earned by a man.
What is Family Income Deficit in Cumberland?
Family Income Deficit in Cumberland is $9,061.
Families that are below poverty line in Cumberland earn $9,061 less on average than the poverty threshold level.
What is Inequality or Gini Index in Cumberland?
Inequality or Gini Index in Cumberland is 0.50.
What is the Total Population of Cumberland?
Total Population of Cumberland is 19,041.
What is the Total Male Population of Cumberland?
Total Male Population of Cumberland is 9,505.
What is the Total Female Population of Cumberland?
Total Female Population of Cumberland is 9,536.
What is the Ratio of Males per 100 Females in Cumberland?
There are 99.67 Males per 100 Females in Cumberland.
What is the Ratio of Females per 100 Males in Cumberland?
There are 100.33 Females per 100 Males in Cumberland.
What is the Median Population Age in Cumberland?
Median Population Age in Cumberland is 41.8 Years.
What is the Average Family Size in Cumberland
Average Family Size in Cumberland is 2.9 People.
What is the Average Household Size in Cumberland
Average Household Size in Cumberland is 2.1 People.
How Large is the Labor Force in Cumberland?
There are 7,953 People in the Labor Forcein in Cumberland.
What is the Percentage of People in the Labor Force in Cumberland?
50.9% of People are in the Labor Force in Cumberland.
What is the Unemployment Rate in Cumberland?
Unemployment Rate in Cumberland is 9.1%.