Cities with the Highest Percentage of Households with Income Above $200,000 in Maryland
RELATED REPORTS & OPTIONS
Household Income | $200k+
Maryland
Compare Cities
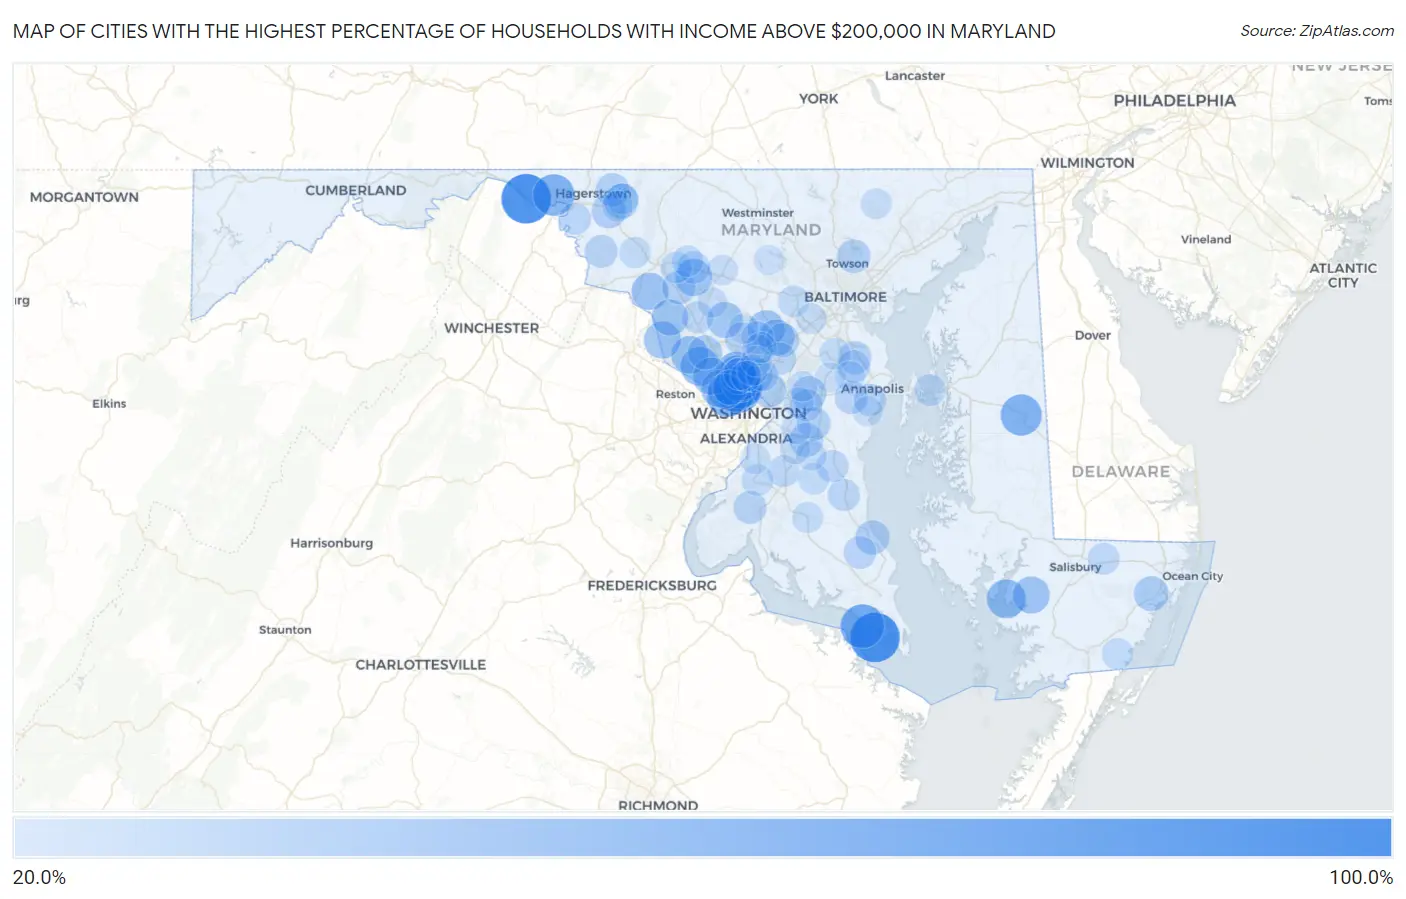
Map of Cities with the Highest Percentage of Households with Income Above $200,000 in Maryland
0.0%
100.0%
Cities with the Highest Percentage of Households with Income Above $200,000 in Maryland
| City | Households with Income > $200k | vs State | vs National | |
| 1. | St George Island | 100.0% | 17.9%(+82.1)#1 | 11.4%(+88.6)#2 |
| 2. | Big Pool | 100.0% | 17.9%(+82.1)#2 | 11.4%(+88.6)#10 |
| 3. | Tall Timbers | 78.8% | 17.9%(+60.9)#3 | 11.4%(+67.4)#36 |
| 4. | Chevy Chase Section Five | 76.5% | 17.9%(+58.6)#4 | 11.4%(+65.1)#40 |
| 5. | Chevy Chase Village | 76.4% | 17.9%(+58.5)#5 | 11.4%(+65.0)#42 |
| 6. | Lisbon | 75.0% | 17.9%(+57.1)#6 | 11.4%(+63.6)#50 |
| 7. | Chevy Chase View | 73.0% | 17.9%(+55.1)#7 | 11.4%(+61.6)#58 |
| 8. | Martin S Additions | 72.0% | 17.9%(+54.1)#8 | 11.4%(+60.6)#62 |
| 9. | Chevy Chase Section Three | 71.3% | 17.9%(+53.4)#9 | 11.4%(+59.9)#67 |
| 10. | Charlton | 70.8% | 17.9%(+52.9)#10 | 11.4%(+59.4)#70 |
| 11. | Somerset | 69.8% | 17.9%(+51.9)#11 | 11.4%(+58.4)#77 |
| 12. | Brookmont | 69.4% | 17.9%(+51.5)#12 | 11.4%(+58.0)#82 |
| 13. | West Denton | 69.2% | 17.9%(+51.3)#13 | 11.4%(+57.8)#84 |
| 14. | Garrett Park | 61.7% | 17.9%(+43.8)#14 | 11.4%(+50.3)#152 |
| 15. | Travilah | 61.3% | 17.9%(+43.4)#15 | 11.4%(+49.9)#156 |
| 16. | Nanticoke Acres | 60.9% | 17.9%(+43.0)#16 | 11.4%(+49.5)#168 |
| 17. | North Chevy Chase | 60.2% | 17.9%(+42.3)#17 | 11.4%(+48.8)#181 |
| 18. | Cabin John | 56.6% | 17.9%(+38.7)#18 | 11.4%(+45.2)#255 |
| 19. | Darnestown | 56.4% | 17.9%(+38.5)#19 | 11.4%(+45.0)#261 |
| 20. | Poolesville | 54.6% | 17.9%(+36.7)#20 | 11.4%(+43.2)#309 |
| 21. | Potomac | 54.4% | 17.9%(+36.5)#21 | 11.4%(+43.0)#315 |
| 22. | Monrovia | 54.4% | 17.9%(+36.5)#22 | 11.4%(+43.0)#316 |
| 23. | Whitehaven | 54.3% | 17.9%(+36.4)#23 | 11.4%(+42.9)#325 |
| 24. | Adamstown | 54.1% | 17.9%(+36.2)#24 | 11.4%(+42.7)#329 |
| 25. | Chevy Chase | 54.0% | 17.9%(+36.1)#25 | 11.4%(+42.6)#332 |
| 26. | Highland | 53.8% | 17.9%(+35.9)#26 | 11.4%(+42.4)#337 |
| 27. | Fulton | 51.6% | 17.9%(+33.7)#27 | 11.4%(+40.2)#400 |
| 28. | Barnesville | 51.6% | 17.9%(+33.7)#28 | 11.4%(+40.2)#404 |
| 29. | Laytonsville | 50.4% | 17.9%(+32.5)#29 | 11.4%(+39.0)#436 |
| 30. | South Kensington | 50.0% | 17.9%(+32.1)#30 | 11.4%(+38.6)#443 |
| 31. | Glen Echo | 47.6% | 17.9%(+29.7)#31 | 11.4%(+36.2)#517 |
| 32. | Fairwood | 46.8% | 17.9%(+28.9)#32 | 11.4%(+35.4)#542 |
| 33. | Four Corners | 46.7% | 17.9%(+28.8)#33 | 11.4%(+35.3)#551 |
| 34. | University Park | 46.6% | 17.9%(+28.7)#34 | 11.4%(+35.2)#561 |
| 35. | Bethesda | 46.3% | 17.9%(+28.4)#35 | 11.4%(+34.9)#567 |
| 36. | Newark | 46.2% | 17.9%(+28.3)#36 | 11.4%(+34.8)#572 |
| 37. | Jugtown | 45.7% | 17.9%(+27.8)#37 | 11.4%(+34.3)#590 |
| 38. | North Potomac | 44.4% | 17.9%(+26.5)#38 | 11.4%(+33.0)#635 |
| 39. | Beaver Creek | 44.4% | 17.9%(+26.5)#39 | 11.4%(+33.0)#638 |
| 40. | St Leonard | 44.2% | 17.9%(+26.3)#40 | 11.4%(+32.8)#647 |
| 41. | Queensland | 42.9% | 17.9%(+25.0)#41 | 11.4%(+31.5)#697 |
| 42. | Chewsville | 42.7% | 17.9%(+24.8)#42 | 11.4%(+31.3)#706 |
| 43. | Scaggsville | 42.0% | 17.9%(+24.1)#43 | 11.4%(+30.6)#735 |
| 44. | Urbana | 41.7% | 17.9%(+23.8)#44 | 11.4%(+30.3)#746 |
| 45. | Brock Hall | 41.6% | 17.9%(+23.7)#45 | 11.4%(+30.2)#752 |
| 46. | Hampton | 41.6% | 17.9%(+23.7)#46 | 11.4%(+30.2)#755 |
| 47. | Severna Park | 40.0% | 17.9%(+22.1)#47 | 11.4%(+28.6)#829 |
| 48. | Pomfret | 39.9% | 17.9%(+22.0)#48 | 11.4%(+28.5)#845 |
| 49. | Riva | 39.7% | 17.9%(+21.8)#49 | 11.4%(+28.3)#852 |
| 50. | Olney | 39.4% | 17.9%(+21.5)#50 | 11.4%(+28.0)#872 |
| 51. | Mount Briar | 39.4% | 17.9%(+21.5)#51 | 11.4%(+28.0)#877 |
| 52. | Broomes Island | 39.1% | 17.9%(+21.2)#52 | 11.4%(+27.7)#898 |
| 53. | Kensington | 38.7% | 17.9%(+20.8)#53 | 11.4%(+27.3)#918 |
| 54. | Herald Harbor | 38.6% | 17.9%(+20.7)#54 | 11.4%(+27.2)#922 |
| 55. | New Market | 38.5% | 17.9%(+20.6)#55 | 11.4%(+27.1)#929 |
| 56. | Ashton Sandy Spring | 38.0% | 17.9%(+20.1)#56 | 11.4%(+26.6)#960 |
| 57. | Annapolis Neck | 37.8% | 17.9%(+19.9)#57 | 11.4%(+26.4)#975 |
| 58. | Konterra | 37.8% | 17.9%(+19.9)#58 | 11.4%(+26.4)#976 |
| 59. | Huntingtown | 37.4% | 17.9%(+19.5)#59 | 11.4%(+26.0)#990 |
| 60. | Woodmore | 37.3% | 17.9%(+19.4)#60 | 11.4%(+25.9)#991 |
| 61. | Dunkirk | 36.7% | 17.9%(+18.8)#61 | 11.4%(+25.3)#1,037 |
| 62. | Downsville | 36.4% | 17.9%(+18.5)#62 | 11.4%(+25.0)#1,054 |
| 63. | Brandywine | 36.1% | 17.9%(+18.2)#63 | 11.4%(+24.7)#1,071 |
| 64. | Hillandale | 36.1% | 17.9%(+18.2)#64 | 11.4%(+24.7)#1,072 |
| 65. | Kent Narrows | 36.0% | 17.9%(+18.1)#65 | 11.4%(+24.6)#1,085 |
| 66. | Parsonsburg | 35.9% | 17.9%(+18.0)#66 | 11.4%(+24.5)#1,091 |
| 67. | Clarksburg | 35.4% | 17.9%(+17.5)#67 | 11.4%(+24.0)#1,133 |
| 68. | Green Valley | 35.4% | 17.9%(+17.5)#68 | 11.4%(+24.0)#1,135 |
| 69. | Accokeek | 34.9% | 17.9%(+17.0)#69 | 11.4%(+23.5)#1,184 |
| 70. | Bartonsville | 34.8% | 17.9%(+16.9)#70 | 11.4%(+23.4)#1,191 |
| 71. | Baden | 34.6% | 17.9%(+16.7)#71 | 11.4%(+23.2)#1,202 |
| 72. | Middletown | 34.4% | 17.9%(+16.5)#72 | 11.4%(+23.0)#1,220 |
| 73. | Ellicott City | 34.2% | 17.9%(+16.3)#73 | 11.4%(+22.8)#1,227 |
| 74. | Gambrills | 34.2% | 17.9%(+16.3)#74 | 11.4%(+22.8)#1,229 |
| 75. | Pondsville | 34.1% | 17.9%(+16.2)#75 | 11.4%(+22.7)#1,236 |
| 76. | Linganore | 34.0% | 17.9%(+16.1)#76 | 11.4%(+22.6)#1,240 |
| 77. | Stockton | 34.0% | 17.9%(+16.1)#77 | 11.4%(+22.6)#1,249 |
| 78. | Cloverly | 33.9% | 17.9%(+16.0)#78 | 11.4%(+22.5)#1,252 |
| 79. | Kemp Mill | 33.7% | 17.9%(+15.8)#79 | 11.4%(+22.3)#1,268 |
| 80. | Hughesville | 33.7% | 17.9%(+15.8)#80 | 11.4%(+22.3)#1,273 |
| 81. | Mount Aetna | 32.7% | 17.9%(+14.8)#81 | 11.4%(+21.3)#1,366 |
| 82. | Croom | 32.6% | 17.9%(+14.7)#82 | 11.4%(+21.2)#1,369 |
| 83. | Jarrettsville | 32.6% | 17.9%(+14.7)#83 | 11.4%(+21.2)#1,370 |
| 84. | Colesville | 32.5% | 17.9%(+14.6)#84 | 11.4%(+21.1)#1,375 |
| 85. | Honeygo | 32.3% | 17.9%(+14.4)#85 | 11.4%(+20.9)#1,398 |
| 86. | Ilchester | 32.2% | 17.9%(+14.3)#86 | 11.4%(+20.8)#1,410 |
| 87. | Spencerville | 32.2% | 17.9%(+14.3)#87 | 11.4%(+20.8)#1,415 |
| 88. | Mount Airy | 31.9% | 17.9%(+14.0)#88 | 11.4%(+20.5)#1,437 |
| 89. | Fort Washington | 31.7% | 17.9%(+13.8)#89 | 11.4%(+20.3)#1,457 |
| 90. | Rosaryville | 31.7% | 17.9%(+13.8)#90 | 11.4%(+20.3)#1,458 |
| 91. | Forest Glen | 31.3% | 17.9%(+13.4)#91 | 11.4%(+19.9)#1,490 |
| 92. | Mitchellville | 30.9% | 17.9%(+13.0)#92 | 11.4%(+19.5)#1,522 |
| 93. | Glenn Dale | 30.7% | 17.9%(+12.8)#93 | 11.4%(+19.3)#1,542 |
| 94. | Westphalia | 30.7% | 17.9%(+12.8)#94 | 11.4%(+19.3)#1,545 |
| 95. | Damascus | 30.6% | 17.9%(+12.7)#95 | 11.4%(+19.2)#1,555 |
| 96. | Mayo | 30.5% | 17.9%(+12.6)#96 | 11.4%(+19.1)#1,567 |
| 97. | Crownsville | 30.2% | 17.9%(+12.3)#97 | 11.4%(+18.8)#1,597 |
| 98. | Brookeville | 30.2% | 17.9%(+12.3)#98 | 11.4%(+18.8)#1,599 |
| 99. | Eldersburg | 30.1% | 17.9%(+12.2)#99 | 11.4%(+18.7)#1,603 |
| 100. | Crofton | 29.9% | 17.9%(+12.0)#100 | 11.4%(+18.5)#1,627 |
Common Questions
What are the Top 10 Cities with the Highest Percentage of Households with Income Above $200,000 in Maryland?
Top 10 Cities with the Highest Percentage of Households with Income Above $200,000 in Maryland are:
#1
100.0%
#2
100.0%
#3
78.8%
#4
76.5%
#5
76.4%
#6
73.0%
#7
72.0%
#8
71.3%
#9
70.8%
#10
69.8%
What city has the Highest Percentage of Households with Income Above $200,000 in Maryland?
St George Island has the Highest Percentage of Households with Income Above $200,000 in Maryland with 100.0%.
What is the Percentage of Households with Income Above $200,000 in the State of Maryland?
Percentage of Households with Income Above $200,000 in Maryland is 17.9%.
What is the Percentage of Households with Income Above $200,000 in the United States?
Percentage of Households with Income Above $200,000 in the United States is 11.4%.