Cities with the Most Immigrants from Morocco in Maryland
RELATED REPORTS & OPTIONS
Morocco
Maryland
Compare Cities
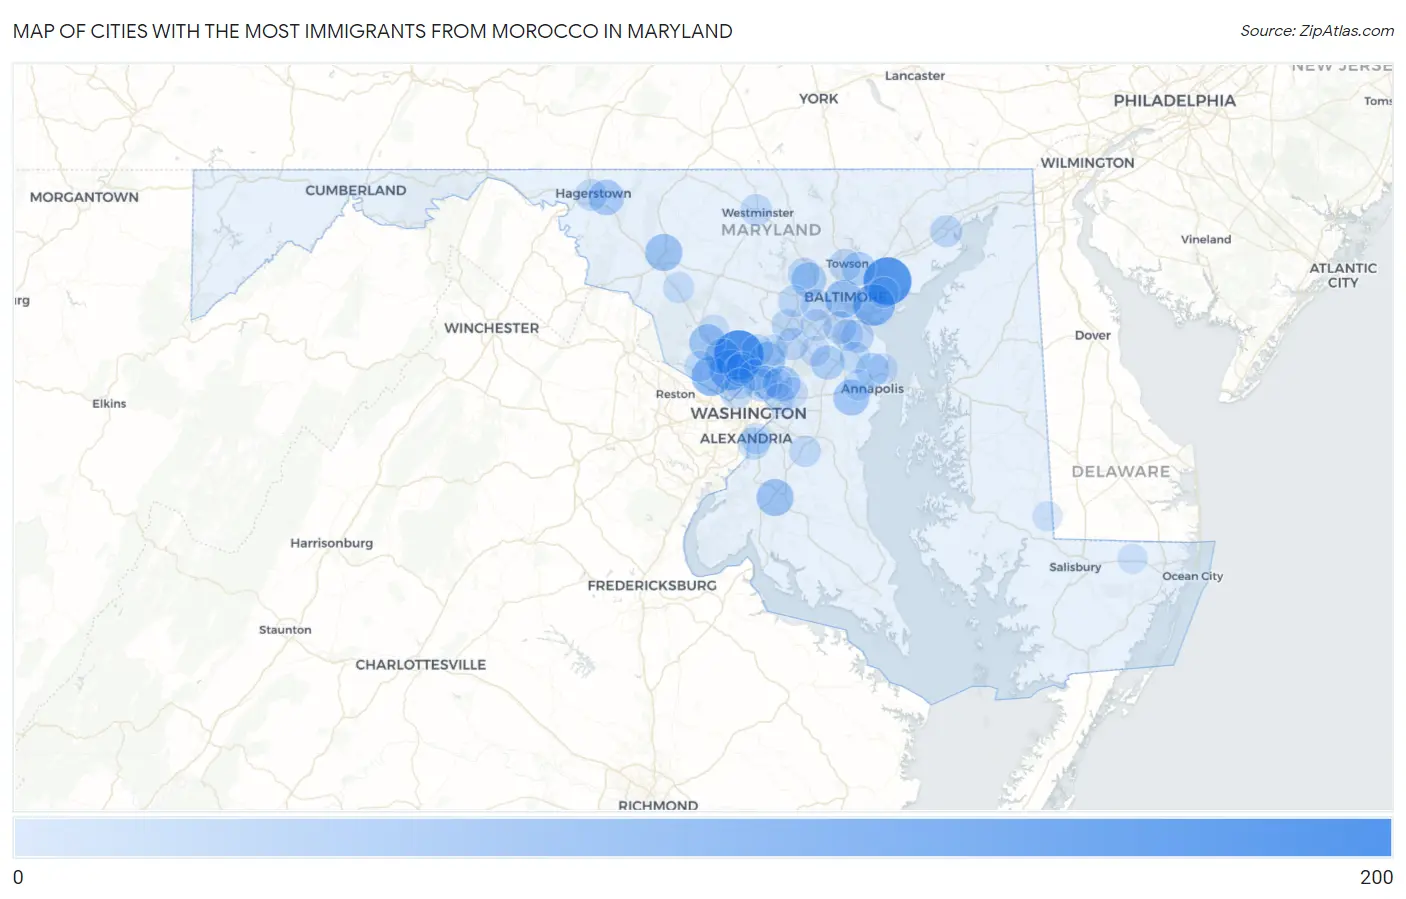
Map of Cities with the Most Immigrants from Morocco in Maryland
0
200
Cities with the Most Immigrants from Morocco in Maryland
| City | Morocco | vs State | vs National | |
| 1. | Aspen Hill | 185 | 2,063(8.97%)#1 | 88,055(0.21%)#70 |
| 2. | Middle River | 169 | 2,063(8.19%)#2 | 88,055(0.19%)#78 |
| 3. | Dundalk | 107 | 2,063(5.19%)#3 | 88,055(0.12%)#138 |
| 4. | North Bethesda | 98 | 2,063(4.75%)#4 | 88,055(0.11%)#153 |
| 5. | Woodlawn Cdp Baltimore County | 91 | 2,063(4.41%)#5 | 88,055(0.10%)#163 |
| 6. | Potomac | 87 | 2,063(4.22%)#6 | 88,055(0.10%)#170 |
| 7. | Baltimore | 71 | 2,063(3.44%)#7 | 88,055(0.08%)#213 |
| 8. | Waldorf | 64 | 2,063(3.10%)#8 | 88,055(0.07%)#240 |
| 9. | Frederick | 64 | 2,063(3.10%)#9 | 88,055(0.07%)#241 |
| 10. | Gaithersburg | 59 | 2,063(2.86%)#10 | 88,055(0.07%)#264 |
| 11. | Riva | 55 | 2,063(2.67%)#11 | 88,055(0.06%)#283 |
| 12. | Fairland | 52 | 2,063(2.52%)#12 | 88,055(0.06%)#302 |
| 13. | Greenbelt | 50 | 2,063(2.42%)#13 | 88,055(0.06%)#313 |
| 14. | Robinwood | 50 | 2,063(2.42%)#14 | 88,055(0.06%)#315 |
| 15. | Rockville | 48 | 2,063(2.33%)#15 | 88,055(0.05%)#325 |
| 16. | Milford Mill | 45 | 2,063(2.18%)#16 | 88,055(0.05%)#352 |
| 17. | Odenton | 38 | 2,063(1.84%)#17 | 88,055(0.04%)#401 |
| 18. | Arnold | 35 | 2,063(1.70%)#18 | 88,055(0.04%)#430 |
| 19. | Parkville | 33 | 2,063(1.60%)#19 | 88,055(0.04%)#450 |
| 20. | Adelphi | 32 | 2,063(1.55%)#20 | 88,055(0.04%)#464 |
| 21. | Langley Park | 27 | 2,063(1.31%)#21 | 88,055(0.03%)#534 |
| 22. | Pasadena | 25 | 2,063(1.21%)#22 | 88,055(0.03%)#566 |
| 23. | Ferndale | 23 | 2,063(1.11%)#23 | 88,055(0.03%)#609 |
| 24. | Towson | 22 | 2,063(1.07%)#24 | 88,055(0.02%)#619 |
| 25. | Friendship Heights Village | 21 | 2,063(1.02%)#25 | 88,055(0.02%)#653 |
| 26. | North Laurel | 20 | 2,063(0.97%)#26 | 88,055(0.02%)#666 |
| 27. | Flower Hill | 20 | 2,063(0.97%)#27 | 88,055(0.02%)#669 |
| 28. | National Harbor | 19 | 2,063(0.92%)#28 | 88,055(0.02%)#695 |
| 29. | Randallstown | 18 | 2,063(0.87%)#29 | 88,055(0.02%)#702 |
| 30. | Aberdeen | 18 | 2,063(0.87%)#30 | 88,055(0.02%)#713 |
| 31. | Columbia | 17 | 2,063(0.82%)#31 | 88,055(0.02%)#725 |
| 32. | North Kensington | 17 | 2,063(0.82%)#32 | 88,055(0.02%)#740 |
| 33. | Ellicott City | 16 | 2,063(0.78%)#33 | 88,055(0.02%)#749 |
| 34. | Wheaton | 16 | 2,063(0.78%)#34 | 88,055(0.02%)#752 |
| 35. | Hagerstown | 16 | 2,063(0.78%)#35 | 88,055(0.02%)#753 |
| 36. | Westminster | 16 | 2,063(0.78%)#36 | 88,055(0.02%)#757 |
| 37. | Four Corners | 16 | 2,063(0.78%)#37 | 88,055(0.02%)#763 |
| 38. | Catonsville | 15 | 2,063(0.73%)#38 | 88,055(0.02%)#775 |
| 39. | Elkridge | 15 | 2,063(0.73%)#39 | 88,055(0.02%)#779 |
| 40. | Glen Burnie | 14 | 2,063(0.68%)#40 | 88,055(0.02%)#800 |
| 41. | Marlton | 14 | 2,063(0.68%)#41 | 88,055(0.02%)#817 |
| 42. | Cloverly | 13 | 2,063(0.63%)#42 | 88,055(0.01%)#836 |
| 43. | Severna Park | 12 | 2,063(0.58%)#43 | 88,055(0.01%)#858 |
| 44. | Urbana | 12 | 2,063(0.58%)#44 | 88,055(0.01%)#869 |
| 45. | Forest Heights | 11 | 2,063(0.53%)#45 | 88,055(0.01%)#901 |
| 46. | Parole | 10 | 2,063(0.48%)#46 | 88,055(0.01%)#930 |
| 47. | Burtonsville | 10 | 2,063(0.48%)#47 | 88,055(0.01%)#934 |
| 48. | Travilah | 9 | 2,063(0.44%)#48 | 88,055(0.01%)#976 |
| 49. | Chevy Chase | 9 | 2,063(0.44%)#49 | 88,055(0.01%)#979 |
| 50. | Essex | 8 | 2,063(0.39%)#50 | 88,055(0.01%)#1,000 |
| 51. | Montgomery Village | 7 | 2,063(0.34%)#51 | 88,055(0.01%)#1,034 |
| 52. | Lanham | 7 | 2,063(0.34%)#52 | 88,055(0.01%)#1,043 |
| 53. | Cape St Claire | 6 | 2,063(0.29%)#53 | 88,055(0.01%)#1,069 |
| 54. | Fort Meade | 5 | 2,063(0.24%)#54 | 88,055(0.01%)#1,089 |
| 55. | Berwyn Heights | 4 | 2,063(0.19%)#55 | 88,055(0.00%)#1,115 |
| 56. | Landover Hills | 3 | 2,063(0.15%)#56 | 88,055(0.00%)#1,132 |
| 57. | Willards | 1 | 2,063(0.05%)#57 | 88,055(0.00%)#1,166 |
| 58. | Sharptown | 1 | 2,063(0.05%)#58 | 88,055(0.00%)#1,168 |
Common Questions
What are the Top 10 Cities with the Most Immigrants from Morocco in Maryland?
Top 10 Cities with the Most Immigrants from Morocco in Maryland are:
#1
185
#2
169
#3
107
#4
98
#5
87
#6
71
#7
64
#8
64
#9
59
#10
55
What city has the Most Immigrants from Morocco in Maryland?
Aspen Hill has the Most Immigrants from Morocco in Maryland with 185.
What is the Total Immigrants from Morocco in the State of Maryland?
Total Immigrants from Morocco in Maryland is 2,063.
What is the Total Immigrants from Morocco in the United States?
Total Immigrants from Morocco in the United States is 88,055.