Cities with the Highest Percentage of Immigrants from Belgium in Maryland
RELATED REPORTS & OPTIONS
Belgium
Maryland
Compare Cities
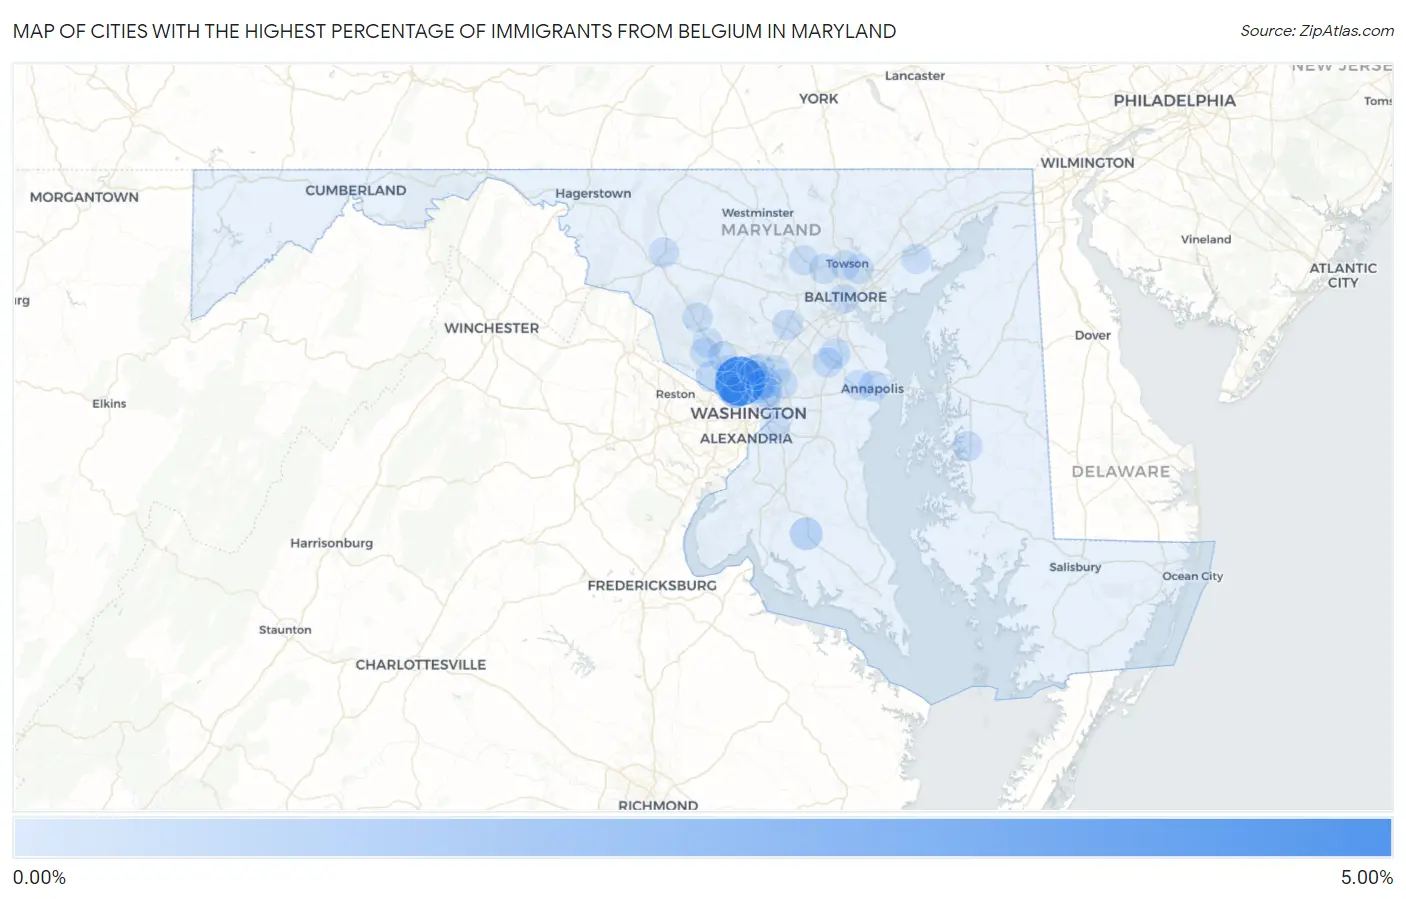
Map of Cities with the Highest Percentage of Immigrants from Belgium in Maryland
0.00%
5.00%
Cities with the Highest Percentage of Immigrants from Belgium in Maryland
| City | Belgium | vs State | vs National | |
| 1. | North Chevy Chase | 4.41% | 0.018%(+4.39)#1 | 0.010%(+4.39)#6 |
| 2. | Somerset | 0.58% | 0.018%(+0.566)#2 | 0.010%(+0.573)#91 |
| 3. | Charlotte Hall | 0.57% | 0.018%(+0.550)#3 | 0.010%(+0.557)#93 |
| 4. | Takoma Park | 0.38% | 0.018%(+0.358)#4 | 0.010%(+0.366)#127 |
| 5. | Friendship Heights Village | 0.23% | 0.018%(+0.214)#5 | 0.010%(+0.221)#196 |
| 6. | Potomac | 0.21% | 0.018%(+0.193)#6 | 0.010%(+0.200)#221 |
| 7. | Naval Academy | 0.20% | 0.018%(+0.181)#7 | 0.010%(+0.188)#232 |
| 8. | Gambrills | 0.19% | 0.018%(+0.175)#8 | 0.010%(+0.182)#238 |
| 9. | Bethesda | 0.18% | 0.018%(+0.165)#9 | 0.010%(+0.172)#246 |
| 10. | Columbia | 0.17% | 0.018%(+0.154)#10 | 0.010%(+0.161)#255 |
| 11. | Adelphi | 0.17% | 0.018%(+0.153)#11 | 0.010%(+0.161)#256 |
| 12. | Mount Rainier | 0.15% | 0.018%(+0.127)#12 | 0.010%(+0.135)#289 |
| 13. | White Oak | 0.11% | 0.018%(+0.092)#13 | 0.010%(+0.099)#346 |
| 14. | Chevy Chase View | 0.089% | 0.018%(+0.071)#14 | 0.010%(+0.079)#388 |
| 15. | Edgewood | 0.084% | 0.018%(+0.066)#15 | 0.010%(+0.073)#400 |
| 16. | Parole | 0.081% | 0.018%(+0.063)#16 | 0.010%(+0.070)#404 |
| 17. | Frederick | 0.079% | 0.018%(+0.061)#17 | 0.010%(+0.069)#411 |
| 18. | Greenbelt | 0.069% | 0.018%(+0.051)#18 | 0.010%(+0.058)#444 |
| 19. | Langley Park | 0.069% | 0.018%(+0.051)#19 | 0.010%(+0.058)#445 |
| 20. | Parkville | 0.066% | 0.018%(+0.048)#20 | 0.010%(+0.055)#453 |
| 21. | Easton | 0.064% | 0.018%(+0.046)#21 | 0.010%(+0.054)#460 |
| 22. | Odenton | 0.040% | 0.018%(+0.022)#22 | 0.010%(+0.029)#558 |
| 23. | Gaithersburg | 0.035% | 0.018%(+0.017)#23 | 0.010%(+0.024)#593 |
| 24. | Clarksburg | 0.032% | 0.018%(+0.014)#24 | 0.010%(+0.021)#612 |
| 25. | Beltsville | 0.030% | 0.018%(+0.013)#25 | 0.010%(+0.020)#621 |
| 26. | North Potomac | 0.028% | 0.018%(+0.011)#26 | 0.010%(+0.018)#634 |
| 27. | North Bethesda | 0.028% | 0.018%(+0.010)#27 | 0.010%(+0.018)#637 |
| 28. | Hyattsville | 0.024% | 0.018%(+0.006)#28 | 0.010%(+0.013)#664 |
| 29. | Baltimore | 0.021% | 0.018%(+0.003)#29 | 0.010%(+0.011)#699 |
| 30. | Kemp Mill | 0.014% | 0.018%(-0.004)#30 | 0.010%(+0.004)#787 |
| 31. | Four Corners | 0.013% | 0.018%(-0.005)#31 | 0.010%(+0.002)#806 |
| 32. | Towson | 0.012% | 0.018%(-0.006)#32 | 0.010%(+0.002)#818 |
| 33. | Rockville | 0.012% | 0.018%(-0.006)#33 | 0.010%(+0.001)#825 |
| 34. | Owings Mills | 0.011% | 0.018%(-0.006)#34 | 0.010%(+0.001)#835 |
| 35. | Pikesville | 0.0088% | 0.018%(-0.009)#35 | 0.010%(-0.002)#874 |
| 36. | Suitland | 0.0039% | 0.018%(-0.014)#36 | 0.010%(-0.007)#945 |
Common Questions
What are the Top 10 Cities with the Highest Percentage of Immigrants from Belgium in Maryland?
Top 10 Cities with the Highest Percentage of Immigrants from Belgium in Maryland are:
#1
4.41%
#2
0.58%
#3
0.57%
#4
0.38%
#5
0.23%
#6
0.21%
#7
0.20%
#8
0.19%
#9
0.18%
#10
0.17%
What city has the Highest Percentage of Immigrants from Belgium in Maryland?
North Chevy Chase has the Highest Percentage of Immigrants from Belgium in Maryland with 4.41%.
What is the Percentage of Immigrants from Belgium in the State of Maryland?
Percentage of Immigrants from Belgium in Maryland is 0.018%.
What is the Percentage of Immigrants from Belgium in the United States?
Percentage of Immigrants from Belgium in the United States is 0.010%.