Cities with the Most Immigrants from Sri Lanka in Maryland
RELATED REPORTS & OPTIONS
Sri Lanka
Maryland
Compare Cities
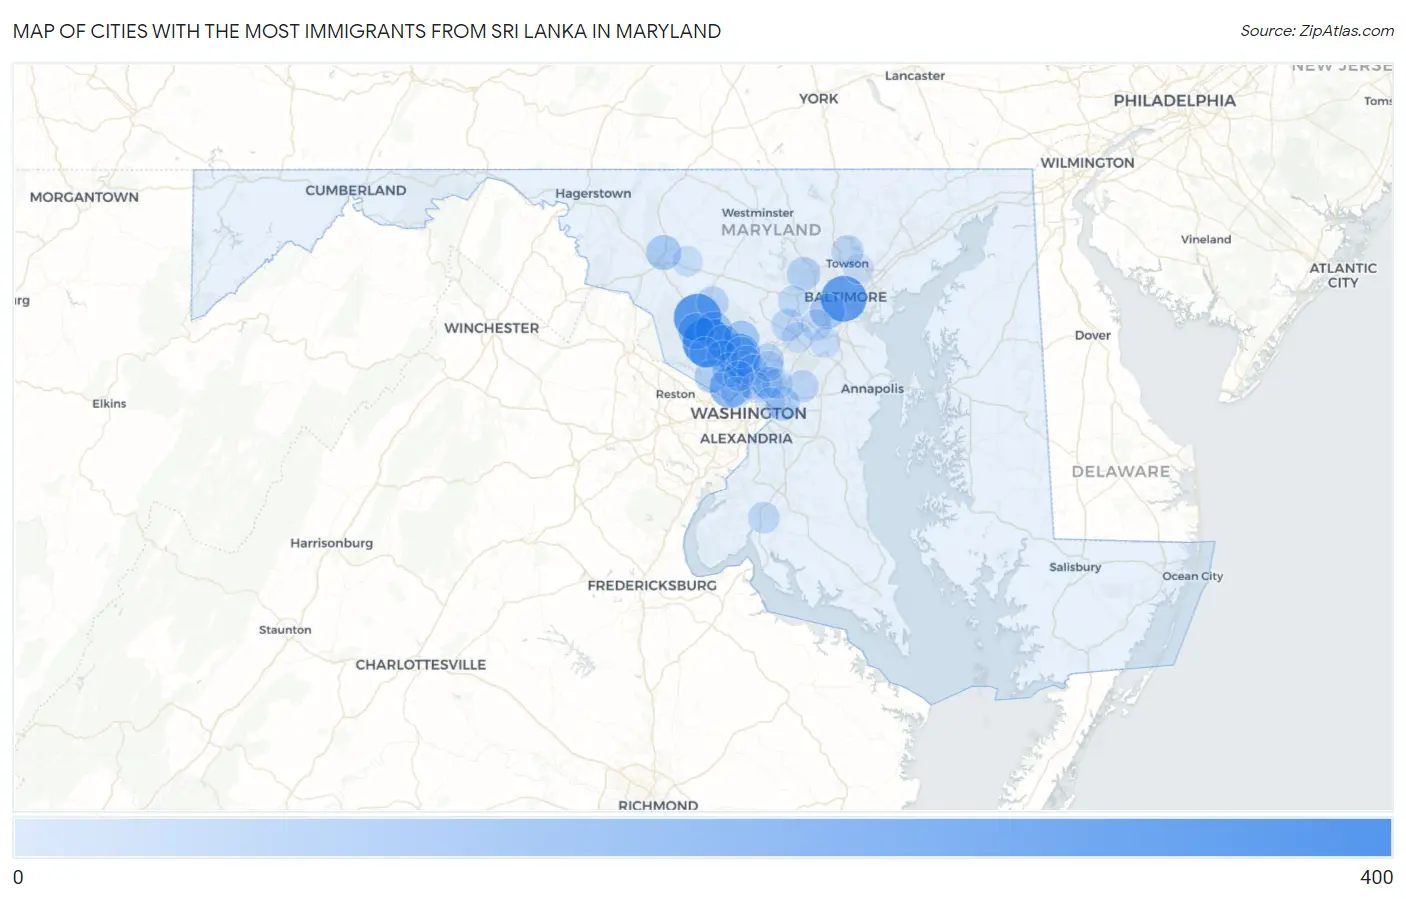
Map of Cities with the Most Immigrants from Sri Lanka in Maryland
0
400
Cities with the Most Immigrants from Sri Lanka in Maryland
| City | Sri Lanka | vs State | vs National | |
| 1. | Gaithersburg | 392 | 3,410(11.50%)#1 | 56,619(0.69%)#7 |
| 2. | Clarksburg | 346 | 3,410(10.15%)#2 | 56,619(0.61%)#9 |
| 3. | Baltimore | 314 | 3,410(9.21%)#3 | 56,619(0.55%)#13 |
| 4. | Aspen Hill | 255 | 3,410(7.48%)#4 | 56,619(0.45%)#22 |
| 5. | Bethesda | 208 | 3,410(6.10%)#5 | 56,619(0.37%)#29 |
| 6. | Montgomery Village | 129 | 3,410(3.78%)#6 | 56,619(0.23%)#61 |
| 7. | Germantown | 119 | 3,410(3.49%)#7 | 56,619(0.21%)#70 |
| 8. | Olney | 113 | 3,410(3.31%)#8 | 56,619(0.20%)#80 |
| 9. | Arbutus | 102 | 3,410(2.99%)#9 | 56,619(0.18%)#93 |
| 10. | Frederick | 95 | 3,410(2.79%)#10 | 56,619(0.17%)#103 |
| 11. | Redland | 95 | 3,410(2.79%)#11 | 56,619(0.17%)#105 |
| 12. | North Bethesda | 90 | 3,410(2.64%)#12 | 56,619(0.16%)#114 |
| 13. | Landover | 76 | 3,410(2.23%)#13 | 56,619(0.13%)#145 |
| 14. | Randallstown | 68 | 3,410(1.99%)#14 | 56,619(0.12%)#160 |
| 15. | Potomac | 64 | 3,410(1.88%)#15 | 56,619(0.11%)#176 |
| 16. | Silver Spring | 62 | 3,410(1.82%)#16 | 56,619(0.11%)#187 |
| 17. | Wheaton | 59 | 3,410(1.73%)#17 | 56,619(0.10%)#197 |
| 18. | Fairland | 53 | 3,410(1.55%)#18 | 56,619(0.09%)#227 |
| 19. | Flower Hill | 46 | 3,410(1.35%)#19 | 56,619(0.08%)#264 |
| 20. | Damascus | 44 | 3,410(1.29%)#20 | 56,619(0.08%)#276 |
| 21. | Columbia | 43 | 3,410(1.26%)#21 | 56,619(0.08%)#282 |
| 22. | Adelphi | 43 | 3,410(1.26%)#22 | 56,619(0.08%)#290 |
| 23. | Timonium | 41 | 3,410(1.20%)#23 | 56,619(0.07%)#305 |
| 24. | Glenn Dale | 38 | 3,410(1.11%)#24 | 56,619(0.07%)#321 |
| 25. | La Plata | 31 | 3,410(0.91%)#25 | 56,619(0.05%)#380 |
| 26. | Ellicott City | 29 | 3,410(0.85%)#26 | 56,619(0.05%)#396 |
| 27. | Rockville | 28 | 3,410(0.82%)#27 | 56,619(0.05%)#416 |
| 28. | College Park | 26 | 3,410(0.76%)#28 | 56,619(0.05%)#441 |
| 29. | Leisure World | 26 | 3,410(0.76%)#29 | 56,619(0.05%)#447 |
| 30. | Elkridge | 22 | 3,410(0.65%)#30 | 56,619(0.04%)#487 |
| 31. | North Potomac | 21 | 3,410(0.62%)#31 | 56,619(0.04%)#496 |
| 32. | Glenmont | 19 | 3,410(0.56%)#32 | 56,619(0.03%)#523 |
| 33. | Friendship Heights Village | 19 | 3,410(0.56%)#33 | 56,619(0.03%)#527 |
| 34. | Kemp Mill | 16 | 3,410(0.47%)#34 | 56,619(0.03%)#580 |
| 35. | Severn | 14 | 3,410(0.41%)#35 | 56,619(0.02%)#615 |
| 36. | Linganore | 11 | 3,410(0.32%)#36 | 56,619(0.02%)#691 |
| 37. | Savage | 10 | 3,410(0.29%)#37 | 56,619(0.02%)#724 |
| 38. | Berwyn Heights | 10 | 3,410(0.29%)#38 | 56,619(0.02%)#729 |
| 39. | Parkville | 9 | 3,410(0.26%)#39 | 56,619(0.02%)#736 |
| 40. | Takoma Park | 9 | 3,410(0.26%)#40 | 56,619(0.02%)#739 |
| 41. | Calverton | 8 | 3,410(0.23%)#41 | 56,619(0.01%)#761 |
| 42. | South Kensington | 4 | 3,410(0.12%)#42 | 56,619(0.01%)#824 |
| 43. | Colmar Manor | 2 | 3,410(0.06%)#43 | 56,619(0.00%)#851 |
Common Questions
What are the Top 10 Cities with the Most Immigrants from Sri Lanka in Maryland?
Top 10 Cities with the Most Immigrants from Sri Lanka in Maryland are:
#1
392
#2
346
#3
314
#4
255
#5
208
#6
129
#7
119
#8
113
#9
102
#10
95
What city has the Most Immigrants from Sri Lanka in Maryland?
Gaithersburg has the Most Immigrants from Sri Lanka in Maryland with 392.
What is the Total Immigrants from Sri Lanka in the State of Maryland?
Total Immigrants from Sri Lanka in Maryland is 3,410.
What is the Total Immigrants from Sri Lanka in the United States?
Total Immigrants from Sri Lanka in the United States is 56,619.