Cities with the Highest Percentage of Immigrants from South Eastern Asia in Maryland
RELATED REPORTS & OPTIONS
South Eastern Asia
Maryland
Compare Cities
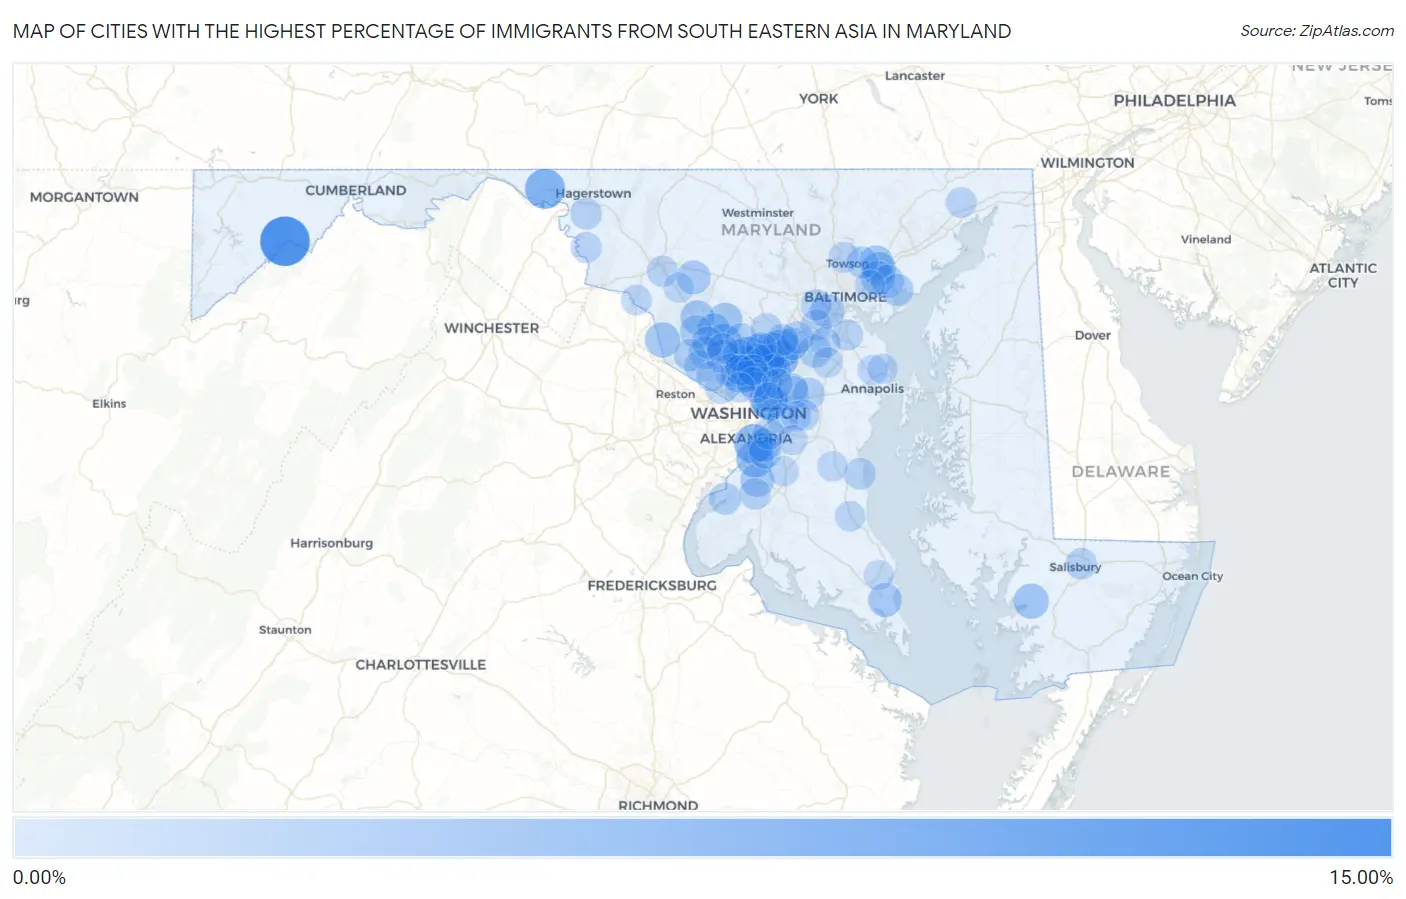
Map of Cities with the Highest Percentage of Immigrants from South Eastern Asia in Maryland
0.00%
15.00%
Cities with the Highest Percentage of Immigrants from South Eastern Asia in Maryland
| City | South Eastern Asia | vs State | vs National | |
| 1. | Bloomington | 12.78% | 1.16%(+11.6)#-1 | 1.30%(+11.5)#0 |
| 2. | Clear Spring | 7.06% | 1.16%(+5.89)#0 | 1.30%(+5.76)#1 |
| 3. | National Harbor | 6.61% | 1.16%(+5.45)#1 | 1.30%(+5.31)#2 |
| 4. | Layhill | 6.44% | 1.16%(+5.28)#2 | 1.30%(+5.14)#3 |
| 5. | West Laurel | 5.91% | 1.16%(+4.75)#3 | 1.30%(+4.61)#4 |
| 6. | Cottage City | 5.74% | 1.16%(+4.58)#4 | 1.30%(+4.44)#5 |
| 7. | Kensington | 5.44% | 1.16%(+4.28)#5 | 1.30%(+4.15)#6 |
| 8. | Fort Washington | 5.41% | 1.16%(+4.24)#6 | 1.30%(+4.11)#7 |
| 9. | Konterra | 5.25% | 1.16%(+4.09)#7 | 1.30%(+3.95)#8 |
| 10. | Redland | 5.16% | 1.16%(+4.00)#8 | 1.30%(+3.87)#9 |
| 11. | Burnt Mills | 4.99% | 1.16%(+3.83)#9 | 1.30%(+3.70)#10 |
| 12. | Calverton | 4.90% | 1.16%(+3.74)#10 | 1.30%(+3.60)#11 |
| 13. | Colmar Manor | 4.75% | 1.16%(+3.59)#11 | 1.30%(+3.45)#12 |
| 14. | Flower Hill | 4.69% | 1.16%(+3.53)#12 | 1.30%(+3.39)#13 |
| 15. | Burtonsville | 4.46% | 1.16%(+3.30)#13 | 1.30%(+3.16)#14 |
| 16. | Wheaton | 4.34% | 1.16%(+3.18)#14 | 1.30%(+3.04)#15 |
| 17. | Poolesville | 4.26% | 1.16%(+3.10)#15 | 1.30%(+2.96)#16 |
| 18. | Mount Vernon | 4.25% | 1.16%(+3.09)#16 | 1.30%(+2.95)#17 |
| 19. | Colesville | 4.12% | 1.16%(+2.96)#17 | 1.30%(+2.83)#18 |
| 20. | Laytonsville | 3.80% | 1.16%(+2.64)#18 | 1.30%(+2.51)#19 |
| 21. | Perry Hall | 3.64% | 1.16%(+2.48)#19 | 1.30%(+2.34)#20 |
| 22. | Arbutus | 3.63% | 1.16%(+2.46)#20 | 1.30%(+2.33)#21 |
| 23. | Clarksburg | 3.62% | 1.16%(+2.46)#21 | 1.30%(+2.33)#22 |
| 24. | White Marsh | 3.52% | 1.16%(+2.36)#22 | 1.30%(+2.23)#23 |
| 25. | Accokeek | 3.51% | 1.16%(+2.35)#23 | 1.30%(+2.21)#24 |
| 26. | Monrovia | 3.49% | 1.16%(+2.33)#24 | 1.30%(+2.19)#25 |
| 27. | Lexington Park | 3.44% | 1.16%(+2.28)#25 | 1.30%(+2.15)#26 |
| 28. | Rossville | 3.39% | 1.16%(+2.23)#26 | 1.30%(+2.10)#27 |
| 29. | Fairland | 3.32% | 1.16%(+2.16)#27 | 1.30%(+2.03)#28 |
| 30. | Montgomery Village | 3.25% | 1.16%(+2.09)#28 | 1.30%(+1.96)#349 |
| 31. | Oxon Hill | 3.18% | 1.16%(+2.02)#29 | 1.30%(+1.89)#350 |
| 32. | Rockville | 3.17% | 1.16%(+2.01)#30 | 1.30%(+1.88)#351 |
| 33. | Middle River | 3.09% | 1.16%(+1.93)#31 | 1.30%(+1.79)#352 |
| 34. | Lanham | 3.00% | 1.16%(+1.84)#32 | 1.30%(+1.70)#353 |
| 35. | Glenmont | 2.97% | 1.16%(+1.81)#33 | 1.30%(+1.67)#354 |
| 36. | Germantown | 2.81% | 1.16%(+1.65)#34 | 1.30%(+1.52)#355 |
| 37. | Fort Meade | 2.81% | 1.16%(+1.65)#35 | 1.30%(+1.51)#356 |
| 38. | Cloverly | 2.73% | 1.16%(+1.57)#36 | 1.30%(+1.44)#357 |
| 39. | North Potomac | 2.71% | 1.16%(+1.55)#37 | 1.30%(+1.42)#358 |
| 40. | Friendly | 2.69% | 1.16%(+1.53)#38 | 1.30%(+1.39)#359 |
| 41. | Adelphi | 2.69% | 1.16%(+1.52)#39 | 1.30%(+1.39)#360 |
| 42. | North Bethesda | 2.64% | 1.16%(+1.48)#40 | 1.30%(+1.34)#361 |
| 43. | North Laurel | 2.63% | 1.16%(+1.47)#41 | 1.30%(+1.34)#362 |
| 44. | Savage | 2.60% | 1.16%(+1.44)#42 | 1.30%(+1.31)#363 |
| 45. | Beltsville | 2.59% | 1.16%(+1.43)#43 | 1.30%(+1.29)#364 |
| 46. | Darnestown | 2.56% | 1.16%(+1.40)#44 | 1.30%(+1.27)#365 |
| 47. | Bowleys Quarters | 2.55% | 1.16%(+1.39)#45 | 1.30%(+1.25)#366 |
| 48. | Callaway | 2.55% | 1.16%(+1.39)#46 | 1.30%(+1.25)#367 |
| 49. | Travilah | 2.54% | 1.16%(+1.37)#47 | 1.30%(+1.24)#368 |
| 50. | Gaithersburg | 2.52% | 1.16%(+1.36)#48 | 1.30%(+1.23)#369 |
| 51. | Fairwood | 2.52% | 1.16%(+1.36)#49 | 1.30%(+1.23)#370 |
| 52. | Potomac Heights | 2.49% | 1.16%(+1.33)#50 | 1.30%(+1.19)#371 |
| 53. | Aspen Hill | 2.44% | 1.16%(+1.28)#51 | 1.30%(+1.14)#372 |
| 54. | Carney | 2.31% | 1.16%(+1.15)#52 | 1.30%(+1.02)#373 |
| 55. | Scaggsville | 2.26% | 1.16%(+1.10)#53 | 1.30%(+0.964)#374 |
| 56. | Marlow Heights | 2.22% | 1.16%(+1.06)#54 | 1.30%(+0.926)#375 |
| 57. | Olney | 2.20% | 1.16%(+1.03)#55 | 1.30%(+0.900)#376 |
| 58. | Salisbury | 2.14% | 1.16%(+0.978)#56 | 1.30%(+0.843)#377 |
| 59. | Chesapeake Beach | 2.09% | 1.16%(+0.931)#57 | 1.30%(+0.796)#378 |
| 60. | Bensville | 2.09% | 1.16%(+0.930)#58 | 1.30%(+0.795)#379 |
| 61. | Four Corners | 2.07% | 1.16%(+0.912)#59 | 1.30%(+0.777)#380 |
| 62. | St James | 2.07% | 1.16%(+0.909)#60 | 1.30%(+0.774)#381 |
| 63. | Woodlawn Cdp Baltimore County | 2.05% | 1.16%(+0.889)#61 | 1.30%(+0.754)#382 |
| 64. | Forest Glen | 2.03% | 1.16%(+0.866)#62 | 1.30%(+0.730)#383 |
| 65. | Derwood | 2.00% | 1.16%(+0.839)#63 | 1.30%(+0.704)#384 |
| 66. | Elkridge | 1.97% | 1.16%(+0.811)#64 | 1.30%(+0.676)#385 |
| 67. | Ballenger Creek | 1.96% | 1.16%(+0.800)#65 | 1.30%(+0.665)#386 |
| 68. | Catonsville | 1.95% | 1.16%(+0.787)#66 | 1.30%(+0.651)#387 |
| 69. | Highland | 1.94% | 1.16%(+0.781)#67 | 1.30%(+0.645)#388 |
| 70. | Takoma Park | 1.91% | 1.16%(+0.749)#68 | 1.30%(+0.613)#389 |
| 71. | Walker Mill | 1.90% | 1.16%(+0.734)#69 | 1.30%(+0.599)#390 |
| 72. | Kettering | 1.88% | 1.16%(+0.720)#70 | 1.30%(+0.585)#391 |
| 73. | North Kensington | 1.85% | 1.16%(+0.692)#71 | 1.30%(+0.557)#392 |
| 74. | Glen Burnie | 1.85% | 1.16%(+0.686)#72 | 1.30%(+0.550)#393 |
| 75. | Sharpsburg | 1.80% | 1.16%(+0.640)#73 | 1.30%(+0.504)#394 |
| 76. | Lutherville | 1.77% | 1.16%(+0.613)#74 | 1.30%(+0.478)#395 |
| 77. | Seabrook | 1.76% | 1.16%(+0.594)#75 | 1.30%(+0.459)#396 |
| 78. | Silver Spring | 1.75% | 1.16%(+0.591)#76 | 1.30%(+0.455)#397 |
| 79. | Spencerville | 1.72% | 1.16%(+0.562)#77 | 1.30%(+0.426)#398 |
| 80. | Port Deposit | 1.70% | 1.16%(+0.543)#78 | 1.30%(+0.407)#399 |
| 81. | Severn | 1.67% | 1.16%(+0.513)#79 | 1.30%(+0.378)#400 |
| 82. | Honeygo | 1.67% | 1.16%(+0.508)#80 | 1.30%(+0.372)#401 |
| 83. | Point Of Rocks | 1.61% | 1.16%(+0.449)#81 | 1.30%(+0.314)#402 |
| 84. | Kemp Mill | 1.61% | 1.16%(+0.449)#82 | 1.30%(+0.314)#403 |
| 85. | Odenton | 1.59% | 1.16%(+0.427)#83 | 1.30%(+0.292)#404 |
| 86. | Largo | 1.58% | 1.16%(+0.421)#84 | 1.30%(+0.286)#405 |
| 87. | Berwyn Heights | 1.54% | 1.16%(+0.379)#85 | 1.30%(+0.244)#406 |
| 88. | Dunkirk | 1.54% | 1.16%(+0.376)#86 | 1.30%(+0.241)#407 |
| 89. | Prince Frederick | 1.53% | 1.16%(+0.365)#87 | 1.30%(+0.229)#408 |
| 90. | Cabin John | 1.50% | 1.16%(+0.342)#88 | 1.30%(+0.206)#409 |
| 91. | Melwood | 1.48% | 1.16%(+0.322)#89 | 1.30%(+0.187)#410 |
| 92. | Urbana | 1.47% | 1.16%(+0.305)#90 | 1.30%(+0.169)#411 |
| 93. | Chevy Chase Section Three | 1.46% | 1.16%(+0.301)#91 | 1.30%(+0.166)#412 |
| 94. | North Brentwood | 1.44% | 1.16%(+0.275)#92 | 1.30%(+0.140)#413 |
| 95. | Arnold | 1.43% | 1.16%(+0.273)#93 | 1.30%(+0.138)#414 |
| 96. | Cape St Claire | 1.40% | 1.16%(+0.239)#94 | 1.30%(+0.104)#415 |
| 97. | Solomons | 1.38% | 1.16%(+0.222)#95 | 1.30%(+0.086)#416 |
| 98. | Brandywine | 1.38% | 1.16%(+0.217)#96 | 1.30%(+0.082)#417 |
| 99. | Rosedale | 1.37% | 1.16%(+0.210)#97 | 1.30%(+0.075)#418 |
| 100. | Potomac | 1.36% | 1.16%(+0.202)#98 | 1.30%(+0.067)#419 |
Common Questions
What are the Top 10 Cities with the Highest Percentage of Immigrants from South Eastern Asia in Maryland?
Top 10 Cities with the Highest Percentage of Immigrants from South Eastern Asia in Maryland are:
#1
12.78%
#2
7.06%
#3
6.61%
#4
6.44%
#5
5.91%
#6
5.74%
#7
5.44%
#8
5.41%
#9
5.25%
#10
5.16%
What city has the Highest Percentage of Immigrants from South Eastern Asia in Maryland?
Bloomington has the Highest Percentage of Immigrants from South Eastern Asia in Maryland with 12.78%.
What is the Percentage of Immigrants from South Eastern Asia in the State of Maryland?
Percentage of Immigrants from South Eastern Asia in Maryland is 1.16%.
What is the Percentage of Immigrants from South Eastern Asia in the United States?
Percentage of Immigrants from South Eastern Asia in the United States is 1.30%.