Cities with the Highest Percentage of Sierra Leonean Population in Maryland
RELATED REPORTS & OPTIONS
Sierra Leonean
Maryland
Compare Cities
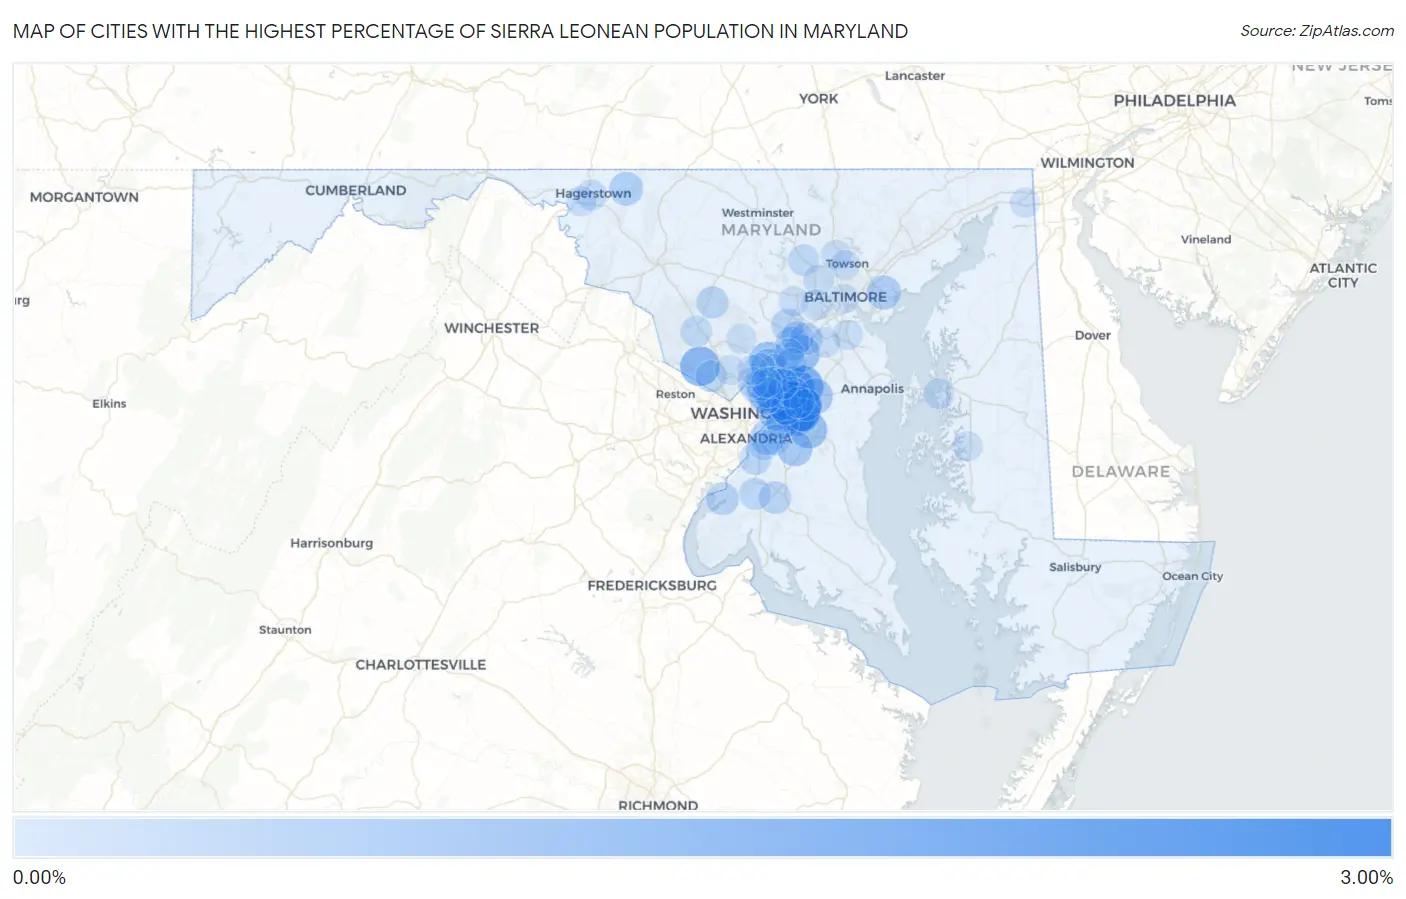
Map of Cities with the Highest Percentage of Sierra Leonean Population in Maryland
0.00%
3.00%
Cities with the Highest Percentage of Sierra Leonean Population in Maryland
| City | Sierra Leonean | vs State | vs National | |
| 1. | Lake Arbor | 2.89% | 0.10%(+2.78)#1 | 0.010%(+2.88)#7 |
| 2. | Seabrook | 2.01% | 0.10%(+1.91)#2 | 0.010%(+2.00)#9 |
| 3. | Woodlawn Cdp Prince George S County | 1.77% | 0.10%(+1.67)#3 | 0.010%(+1.76)#10 |
| 4. | Glenn Dale | 1.65% | 0.10%(+1.55)#4 | 0.010%(+1.64)#11 |
| 5. | Travilah | 1.38% | 0.10%(+1.28)#5 | 0.010%(+1.37)#15 |
| 6. | Springdale | 1.33% | 0.10%(+1.23)#6 | 0.010%(+1.32)#16 |
| 7. | Largo | 1.28% | 0.10%(+1.18)#7 | 0.010%(+1.27)#18 |
| 8. | Fairmount Heights | 1.01% | 0.10%(+0.904)#8 | 0.010%(+0.996)#24 |
| 9. | Marlboro Village | 1.00% | 0.10%(+0.894)#9 | 0.010%(+0.987)#25 |
| 10. | Cheverly | 0.98% | 0.10%(+0.875)#10 | 0.010%(+0.968)#27 |
| 11. | Maryland City | 0.96% | 0.10%(+0.856)#11 | 0.010%(+0.949)#28 |
| 12. | Fairland | 0.93% | 0.10%(+0.828)#12 | 0.010%(+0.921)#31 |
| 13. | Bowie | 0.81% | 0.10%(+0.703)#13 | 0.010%(+0.796)#35 |
| 14. | Rosaryville | 0.72% | 0.10%(+0.612)#14 | 0.010%(+0.705)#39 |
| 15. | Calverton | 0.71% | 0.10%(+0.612)#15 | 0.010%(+0.705)#40 |
| 16. | Temple Hills | 0.66% | 0.10%(+0.559)#16 | 0.010%(+0.651)#45 |
| 17. | Burnt Mills | 0.63% | 0.10%(+0.530)#17 | 0.010%(+0.622)#47 |
| 18. | Glenarden | 0.63% | 0.10%(+0.528)#18 | 0.010%(+0.621)#48 |
| 19. | Essex | 0.61% | 0.10%(+0.504)#19 | 0.010%(+0.597)#49 |
| 20. | Ten Mile Creek | 0.61% | 0.10%(+0.502)#20 | 0.010%(+0.595)#50 |
| 21. | North Laurel | 0.58% | 0.10%(+0.479)#21 | 0.010%(+0.571)#52 |
| 22. | Smithsburg | 0.53% | 0.10%(+0.425)#22 | 0.010%(+0.518)#58 |
| 23. | Kettering | 0.43% | 0.10%(+0.329)#23 | 0.010%(+0.422)#72 |
| 24. | Landover | 0.43% | 0.10%(+0.327)#24 | 0.010%(+0.419)#73 |
| 25. | Edmonston | 0.40% | 0.10%(+0.297)#25 | 0.010%(+0.389)#79 |
| 26. | District Heights | 0.39% | 0.10%(+0.286)#26 | 0.010%(+0.379)#81 |
| 27. | Indian Head | 0.38% | 0.10%(+0.278)#27 | 0.010%(+0.371)#84 |
| 28. | Columbia | 0.38% | 0.10%(+0.275)#28 | 0.010%(+0.368)#86 |
| 29. | New Carrollton | 0.36% | 0.10%(+0.258)#29 | 0.010%(+0.350)#90 |
| 30. | Jessup | 0.34% | 0.10%(+0.241)#30 | 0.010%(+0.333)#93 |
| 31. | Waldorf | 0.33% | 0.10%(+0.230)#31 | 0.010%(+0.323)#94 |
| 32. | Fort Washington | 0.33% | 0.10%(+0.230)#32 | 0.010%(+0.323)#95 |
| 33. | Savage | 0.33% | 0.10%(+0.229)#33 | 0.010%(+0.322)#96 |
| 34. | Chillum | 0.32% | 0.10%(+0.217)#34 | 0.010%(+0.310)#97 |
| 35. | Damascus | 0.30% | 0.10%(+0.200)#35 | 0.010%(+0.292)#98 |
| 36. | Beltsville | 0.28% | 0.10%(+0.181)#36 | 0.010%(+0.274)#100 |
| 37. | Brentwood | 0.26% | 0.10%(+0.161)#37 | 0.010%(+0.254)#107 |
| 38. | Bensville | 0.26% | 0.10%(+0.157)#38 | 0.010%(+0.250)#109 |
| 39. | Summerfield | 0.24% | 0.10%(+0.142)#39 | 0.010%(+0.234)#112 |
| 40. | Lanham | 0.23% | 0.10%(+0.128)#40 | 0.010%(+0.221)#116 |
| 41. | Woodmore | 0.23% | 0.10%(+0.125)#41 | 0.010%(+0.218)#117 |
| 42. | Potomac | 0.23% | 0.10%(+0.125)#42 | 0.010%(+0.218)#118 |
| 43. | Mount Rainier | 0.22% | 0.10%(+0.115)#43 | 0.010%(+0.207)#120 |
| 44. | Takoma Park | 0.21% | 0.10%(+0.102)#44 | 0.010%(+0.195)#127 |
| 45. | South Laurel | 0.20% | 0.10%(+0.094)#45 | 0.010%(+0.187)#130 |
| 46. | Owings Mills | 0.19% | 0.10%(+0.091)#46 | 0.010%(+0.184)#132 |
| 47. | Germantown | 0.19% | 0.10%(+0.089)#47 | 0.010%(+0.181)#135 |
| 48. | White Oak | 0.18% | 0.10%(+0.078)#48 | 0.010%(+0.170)#137 |
| 49. | College Park | 0.18% | 0.10%(+0.077)#49 | 0.010%(+0.170)#138 |
| 50. | Mitchellville | 0.17% | 0.10%(+0.062)#50 | 0.010%(+0.155)#146 |
| 51. | Greenbelt | 0.15% | 0.10%(+0.051)#51 | 0.010%(+0.144)#149 |
| 52. | Langley Park | 0.12% | 0.10%(+0.021)#52 | 0.010%(+0.114)#158 |
| 53. | Grasonville | 0.12% | 0.10%(+0.017)#53 | 0.010%(+0.110)#159 |
| 54. | Lochearn | 0.12% | 0.10%(+0.015)#54 | 0.010%(+0.108)#161 |
| 55. | Hagerstown | 0.12% | 0.10%(+0.014)#55 | 0.010%(+0.107)#162 |
| 56. | Camp Springs | 0.10% | 0.10%(+0.000)#56 | 0.010%(+0.093)#167 |
| 57. | Catonsville | 0.094% | 0.10%(-0.010)#57 | 0.010%(+0.083)#172 |
| 58. | Hyattsville | 0.086% | 0.10%(-0.017)#58 | 0.010%(+0.076)#179 |
| 59. | Mays Chapel | 0.083% | 0.10%(-0.020)#59 | 0.010%(+0.073)#184 |
| 60. | Oxon Hill | 0.081% | 0.10%(-0.022)#60 | 0.010%(+0.071)#185 |
| 61. | Silver Spring | 0.079% | 0.10%(-0.024)#61 | 0.010%(+0.069)#189 |
| 62. | Laurel | 0.078% | 0.10%(-0.025)#62 | 0.010%(+0.067)#190 |
| 63. | Glen Burnie | 0.043% | 0.10%(-0.060)#63 | 0.010%(+0.033)#227 |
| 64. | Severn | 0.043% | 0.10%(-0.061)#64 | 0.010%(+0.032)#230 |
| 65. | Halfway | 0.039% | 0.10%(-0.064)#65 | 0.010%(+0.029)#238 |
| 66. | Olney | 0.037% | 0.10%(-0.067)#66 | 0.010%(+0.026)#245 |
| 67. | Adelphi | 0.035% | 0.10%(-0.068)#67 | 0.010%(+0.025)#249 |
| 68. | Easton | 0.023% | 0.10%(-0.080)#68 | 0.010%(+0.013)#279 |
| 69. | Kemp Mill | 0.021% | 0.10%(-0.082)#69 | 0.010%(+0.011)#288 |
| 70. | Baltimore | 0.019% | 0.10%(-0.084)#70 | 0.010%(+0.009)#298 |
| 71. | Ellicott City | 0.019% | 0.10%(-0.084)#71 | 0.010%(+0.009)#300 |
| 72. | Elkton | 0.019% | 0.10%(-0.084)#72 | 0.010%(+0.009)#301 |
| 73. | Towson | 0.017% | 0.10%(-0.086)#73 | 0.010%(+0.007)#308 |
| 74. | North Bethesda | 0.014% | 0.10%(-0.089)#74 | 0.010%(+0.004)#321 |
Common Questions
What are the Top 10 Cities with the Highest Percentage of Sierra Leonean Population in Maryland?
Top 10 Cities with the Highest Percentage of Sierra Leonean Population in Maryland are:
#1
2.89%
#2
2.01%
#3
1.65%
#4
1.38%
#5
1.33%
#6
1.28%
#7
1.01%
#8
1.00%
#9
0.98%
#10
0.96%
What city has the Highest Percentage of Sierra Leonean Population in Maryland?
Lake Arbor has the Highest Percentage of Sierra Leonean Population in Maryland with 2.89%.
What is the Percentage of Sierra Leonean Population in the State of Maryland?
Percentage of Sierra Leonean Population in Maryland is 0.10%.
What is the Percentage of Sierra Leonean Population in the United States?
Percentage of Sierra Leonean Population in the United States is 0.010%.