Cities with the Highest Percentage of Korean Population in Maryland
RELATED REPORTS & OPTIONS
Korean
Maryland
Compare Cities
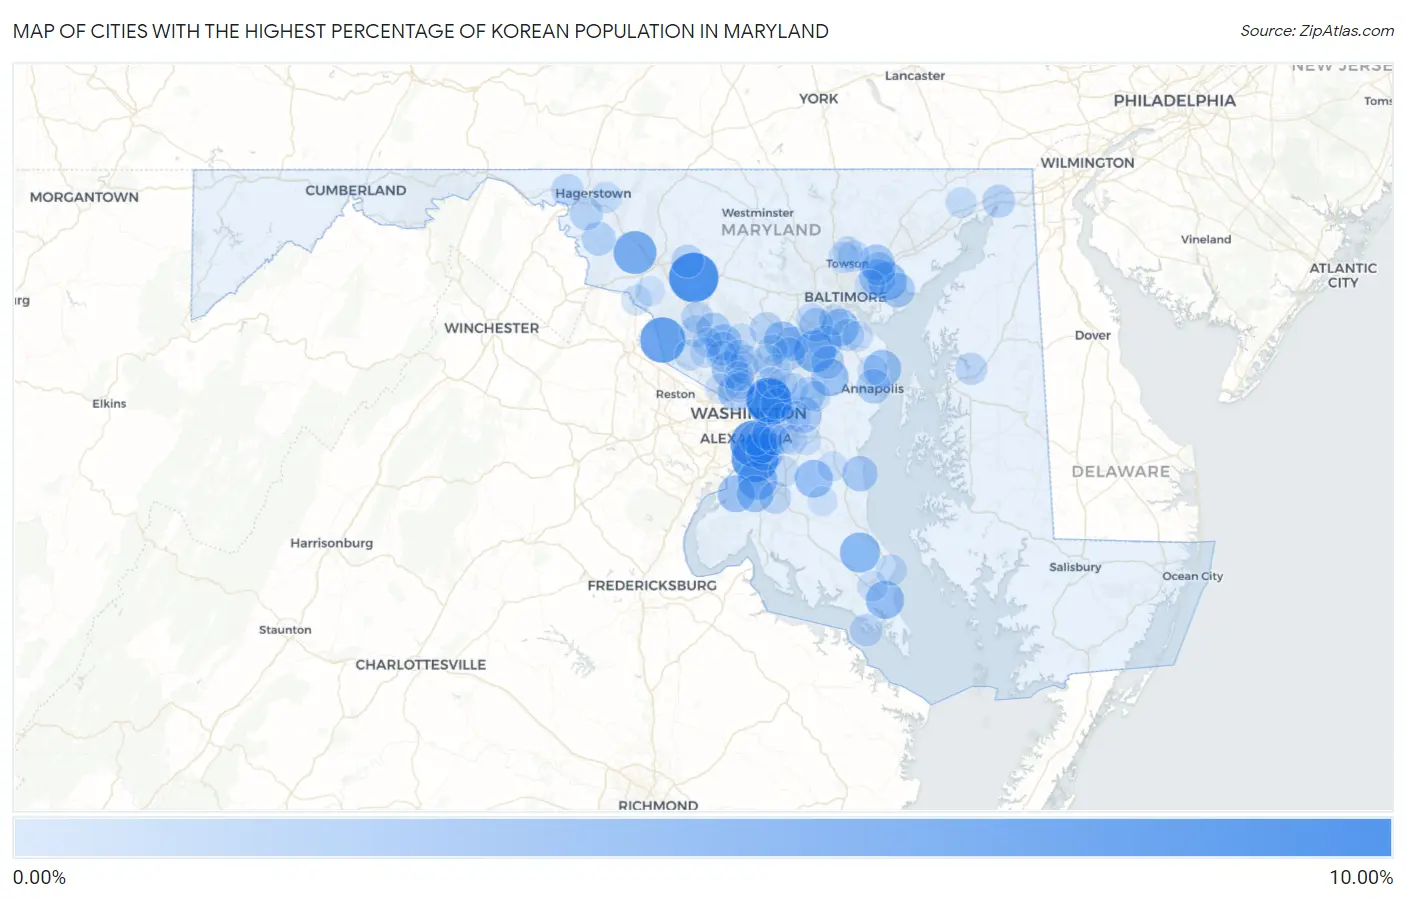
Map of Cities with the Highest Percentage of Korean Population in Maryland
0.00%
10.00%
Cities with the Highest Percentage of Korean Population in Maryland
| City | Korean | vs State | vs National | |
| 1. | Monrovia | 8.42% | 1.18%(+7.24)#1 | 1.31%(+7.11)#333 |
| 2. | Fort Washington | 7.41% | 1.18%(+6.23)#2 | 1.31%(+6.10)#400 |
| 3. | National Harbor | 7.36% | 1.18%(+6.18)#3 | 1.31%(+6.05)#404 |
| 4. | Colmar Manor | 7.12% | 1.18%(+5.94)#4 | 1.31%(+5.81)#427 |
| 5. | Poolesville | 6.89% | 1.18%(+5.71)#5 | 1.31%(+5.58)#440 |
| 6. | Cottage City | 6.73% | 1.18%(+5.55)#6 | 1.31%(+5.42)#454 |
| 7. | Middletown | 6.01% | 1.18%(+4.83)#7 | 1.31%(+4.70)#531 |
| 8. | Fort Meade | 5.61% | 1.18%(+4.43)#8 | 1.31%(+4.30)#592 |
| 9. | Callaway | 5.02% | 1.18%(+3.84)#9 | 1.31%(+3.71)#695 |
| 10. | Broomes Island | 4.96% | 1.18%(+3.78)#10 | 1.31%(+3.65)#707 |
| 11. | Accokeek | 4.61% | 1.18%(+3.43)#11 | 1.31%(+3.30)#775 |
| 12. | Middle River | 4.37% | 1.18%(+3.18)#12 | 1.31%(+3.06)#821 |
| 13. | Lexington Park | 4.29% | 1.18%(+3.11)#13 | 1.31%(+2.98)#838 |
| 14. | Baden | 4.15% | 1.18%(+2.97)#14 | 1.31%(+2.84)#882 |
| 15. | Cape St Claire | 4.03% | 1.18%(+2.85)#15 | 1.31%(+2.72)#912 |
| 16. | Ferndale | 4.00% | 1.18%(+2.82)#16 | 1.31%(+2.69)#923 |
| 17. | Flower Hill | 4.00% | 1.18%(+2.82)#17 | 1.31%(+2.69)#927 |
| 18. | Crofton | 3.97% | 1.18%(+2.79)#18 | 1.31%(+2.66)#937 |
| 19. | Bryans Road | 3.84% | 1.18%(+2.66)#19 | 1.31%(+2.53)#976 |
| 20. | Scaggsville | 3.84% | 1.18%(+2.65)#20 | 1.31%(+2.53)#978 |
| 21. | Bensville | 3.77% | 1.18%(+2.59)#21 | 1.31%(+2.46)#1,000 |
| 22. | Friendly | 3.74% | 1.18%(+2.56)#22 | 1.31%(+2.43)#1,012 |
| 23. | Oxon Hill | 3.63% | 1.18%(+2.45)#23 | 1.31%(+2.32)#1,051 |
| 24. | Friendship Heights Village | 3.62% | 1.18%(+2.43)#24 | 1.31%(+2.31)#1,054 |
| 25. | North Bethesda | 3.60% | 1.18%(+2.42)#25 | 1.31%(+2.29)#1,059 |
| 26. | Rossville | 3.56% | 1.18%(+2.38)#26 | 1.31%(+2.25)#1,078 |
| 27. | Perry Hall | 3.51% | 1.18%(+2.33)#27 | 1.31%(+2.20)#1,104 |
| 28. | Redland | 3.45% | 1.18%(+2.27)#28 | 1.31%(+2.14)#1,124 |
| 29. | Kettering | 3.26% | 1.18%(+2.08)#29 | 1.31%(+1.95)#1,213 |
| 30. | Chesapeake Beach | 3.22% | 1.18%(+2.04)#30 | 1.31%(+1.91)#1,225 |
| 31. | Bowleys Quarters | 3.08% | 1.18%(+1.90)#31 | 1.31%(+1.77)#1,288 |
| 32. | Montgomery Village | 2.96% | 1.18%(+1.78)#32 | 1.31%(+1.65)#1,350 |
| 33. | Naval Academy | 2.93% | 1.18%(+1.75)#33 | 1.31%(+1.62)#1,370 |
| 34. | North Laurel | 2.88% | 1.18%(+1.70)#34 | 1.31%(+1.57)#1,411 |
| 35. | Elkridge | 2.77% | 1.18%(+1.59)#35 | 1.31%(+1.46)#1,478 |
| 36. | Derwood | 2.76% | 1.18%(+1.58)#36 | 1.31%(+1.45)#1,484 |
| 37. | Keedysville | 2.73% | 1.18%(+1.55)#37 | 1.31%(+1.42)#1,502 |
| 38. | Forest Heights | 2.73% | 1.18%(+1.55)#38 | 1.31%(+1.42)#1,503 |
| 39. | Severn | 2.70% | 1.18%(+1.52)#39 | 1.31%(+1.39)#1,521 |
| 40. | White Marsh | 2.70% | 1.18%(+1.52)#40 | 1.31%(+1.39)#1,528 |
| 41. | Fairwood | 2.64% | 1.18%(+1.46)#41 | 1.31%(+1.33)#1,561 |
| 42. | Marlow Heights | 2.57% | 1.18%(+1.39)#42 | 1.31%(+1.26)#1,606 |
| 43. | Laurel | 2.53% | 1.18%(+1.35)#43 | 1.31%(+1.22)#1,631 |
| 44. | St James | 2.48% | 1.18%(+1.30)#44 | 1.31%(+1.17)#1,657 |
| 45. | Highland | 2.48% | 1.18%(+1.30)#45 | 1.31%(+1.17)#1,661 |
| 46. | Odenton | 2.44% | 1.18%(+1.26)#46 | 1.31%(+1.13)#1,687 |
| 47. | North East | 2.44% | 1.18%(+1.26)#47 | 1.31%(+1.13)#1,692 |
| 48. | Linganore | 2.41% | 1.18%(+1.23)#48 | 1.31%(+1.10)#1,706 |
| 49. | Glen Burnie | 2.27% | 1.18%(+1.09)#49 | 1.31%(+0.959)#1,826 |
| 50. | Wheaton | 2.25% | 1.18%(+1.07)#50 | 1.31%(+0.939)#1,839 |
| 51. | Wilson Conococheague | 2.24% | 1.18%(+1.06)#51 | 1.31%(+0.933)#1,845 |
| 52. | Abingdon | 2.23% | 1.18%(+1.05)#52 | 1.31%(+0.921)#1,859 |
| 53. | Piney Point | 2.23% | 1.18%(+1.05)#53 | 1.31%(+0.917)#1,865 |
| 54. | Centreville | 2.15% | 1.18%(+0.968)#54 | 1.31%(+0.839)#1,940 |
| 55. | Waldorf | 2.14% | 1.18%(+0.959)#55 | 1.31%(+0.830)#1,947 |
| 56. | Germantown | 2.12% | 1.18%(+0.941)#56 | 1.31%(+0.812)#1,969 |
| 57. | Clarksburg | 2.12% | 1.18%(+0.936)#57 | 1.31%(+0.807)#1,978 |
| 58. | Glenmont | 2.10% | 1.18%(+0.917)#58 | 1.31%(+0.788)#2,008 |
| 59. | Seabrook | 2.02% | 1.18%(+0.843)#59 | 1.31%(+0.714)#2,075 |
| 60. | Hampton | 1.97% | 1.18%(+0.787)#60 | 1.31%(+0.659)#2,132 |
| 61. | Lutherville | 1.91% | 1.18%(+0.729)#61 | 1.31%(+0.601)#2,200 |
| 62. | Robinwood | 1.89% | 1.18%(+0.706)#62 | 1.31%(+0.577)#2,225 |
| 63. | Walker Mill | 1.88% | 1.18%(+0.694)#63 | 1.31%(+0.565)#2,242 |
| 64. | Rockville | 1.87% | 1.18%(+0.687)#64 | 1.31%(+0.558)#2,257 |
| 65. | Chesapeake Ranch Estates | 1.87% | 1.18%(+0.686)#65 | 1.31%(+0.557)#2,258 |
| 66. | Honeygo | 1.80% | 1.18%(+0.620)#66 | 1.31%(+0.492)#2,354 |
| 67. | Ilchester | 1.77% | 1.18%(+0.584)#67 | 1.31%(+0.456)#2,404 |
| 68. | Beltsville | 1.75% | 1.18%(+0.570)#68 | 1.31%(+0.441)#2,432 |
| 69. | Cheverly | 1.74% | 1.18%(+0.564)#69 | 1.31%(+0.435)#2,441 |
| 70. | Burtonsville | 1.74% | 1.18%(+0.564)#70 | 1.31%(+0.435)#2,442 |
| 71. | Darnestown | 1.74% | 1.18%(+0.557)#71 | 1.31%(+0.429)#2,452 |
| 72. | Fairland | 1.72% | 1.18%(+0.543)#72 | 1.31%(+0.414)#2,470 |
| 73. | Bowie | 1.72% | 1.18%(+0.537)#73 | 1.31%(+0.408)#2,481 |
| 74. | Linthicum | 1.71% | 1.18%(+0.533)#74 | 1.31%(+0.405)#2,487 |
| 75. | Port Deposit | 1.70% | 1.18%(+0.522)#75 | 1.31%(+0.394)#2,504 |
| 76. | Chevy Chase | 1.70% | 1.18%(+0.515)#76 | 1.31%(+0.386)#2,516 |
| 77. | Olney | 1.69% | 1.18%(+0.514)#77 | 1.31%(+0.385)#2,521 |
| 78. | Brandywine | 1.69% | 1.18%(+0.504)#78 | 1.31%(+0.375)#2,537 |
| 79. | California | 1.64% | 1.18%(+0.462)#79 | 1.31%(+0.333)#2,604 |
| 80. | College Park | 1.61% | 1.18%(+0.431)#80 | 1.31%(+0.303)#2,659 |
| 81. | Point Of Rocks | 1.61% | 1.18%(+0.429)#81 | 1.31%(+0.300)#2,668 |
| 82. | Largo | 1.58% | 1.18%(+0.401)#82 | 1.31%(+0.272)#2,704 |
| 83. | Pasadena | 1.58% | 1.18%(+0.395)#83 | 1.31%(+0.266)#2,713 |
| 84. | Queensland | 1.57% | 1.18%(+0.392)#84 | 1.31%(+0.263)#2,719 |
| 85. | Camp Springs | 1.56% | 1.18%(+0.379)#85 | 1.31%(+0.250)#2,757 |
| 86. | Andrews Afb | 1.55% | 1.18%(+0.368)#86 | 1.31%(+0.239)#2,777 |
| 87. | Rosedale | 1.55% | 1.18%(+0.364)#87 | 1.31%(+0.236)#2,784 |
| 88. | Dunkirk | 1.54% | 1.18%(+0.356)#88 | 1.31%(+0.227)#2,797 |
| 89. | Greenbelt | 1.53% | 1.18%(+0.348)#89 | 1.31%(+0.220)#2,811 |
| 90. | Arnold | 1.52% | 1.18%(+0.337)#90 | 1.31%(+0.209)#2,835 |
| 91. | Cabin John | 1.50% | 1.18%(+0.322)#91 | 1.31%(+0.193)#2,861 |
| 92. | North Potomac | 1.49% | 1.18%(+0.305)#92 | 1.31%(+0.176)#2,891 |
| 93. | Melwood | 1.48% | 1.18%(+0.302)#93 | 1.31%(+0.173)#2,900 |
| 94. | Chevy Chase Section Three | 1.46% | 1.18%(+0.281)#94 | 1.31%(+0.152)#2,945 |
| 95. | Gaithersburg | 1.46% | 1.18%(+0.276)#95 | 1.31%(+0.148)#2,953 |
| 96. | Aspen Hill | 1.45% | 1.18%(+0.266)#96 | 1.31%(+0.137)#2,970 |
| 97. | Aquasco | 1.43% | 1.18%(+0.245)#97 | 1.31%(+0.117)#3,017 |
| 98. | Chevy Chase View | 1.42% | 1.18%(+0.244)#98 | 1.31%(+0.115)#3,021 |
| 99. | Adamstown | 1.42% | 1.18%(+0.239)#99 | 1.31%(+0.110)#3,033 |
| 100. | Timonium | 1.41% | 1.18%(+0.227)#100 | 1.31%(+0.098)#3,054 |
Common Questions
What are the Top 10 Cities with the Highest Percentage of Korean Population in Maryland?
Top 10 Cities with the Highest Percentage of Korean Population in Maryland are:
#1
8.42%
#2
7.41%
#3
7.36%
#4
7.12%
#5
6.89%
#6
6.73%
#7
6.01%
#8
5.61%
#9
4.96%
#10
4.61%
What city has the Highest Percentage of Korean Population in Maryland?
Monrovia has the Highest Percentage of Korean Population in Maryland with 8.42%.
What is the Percentage of Korean Population in the State of Maryland?
Percentage of Korean Population in Maryland is 1.18%.
What is the Percentage of Korean Population in the United States?
Percentage of Korean Population in the United States is 1.31%.