Crofton, MD Map & Demographics
Crofton Map
Crofton Overview
$59,849
PER CAPITA INCOME
$160,258
AVG FAMILY INCOME
$143,202
AVG HOUSEHOLD INCOME
30.3%
WAGE / INCOME GAP [ % ]
69.7¢/ $1
WAGE / INCOME GAP [ $ ]
$15,800
FAMILY INCOME DEFICIT
0.39
INEQUALITY / GINI INDEX
29,358
TOTAL POPULATION
14,466
MALE POPULATION
14,892
FEMALE POPULATION
97.14
MALES / 100 FEMALES
102.94
FEMALES / 100 MALES
37.1
MEDIAN AGE
3.4
AVG FAMILY SIZE
2.8
AVG HOUSEHOLD SIZE
16,269
LABOR FORCE [ PEOPLE ]
75.5%
PERCENT IN LABOR FORCE
4.1%
UNEMPLOYMENT RATE
Crofton Zip Codes
Income in Crofton
Income Overview in Crofton
Per Capita Income in Crofton is $59,849, while median incomes of families and households are $160,258 and $143,202 respectively.
| Characteristic | Number | Measure |
| Per Capita Income | 29,358 | $59,849 |
| Median Family Income | 7,622 | $160,258 |
| Mean Family Income | 7,622 | $192,084 |
| Median Household Income | 10,467 | $143,202 |
| Mean Household Income | 10,467 | $169,882 |
| Income Deficit | 7,622 | $15,800 |
| Wage / Income Gap (%) | 29,358 | 30.29% |
| Wage / Income Gap ($) | 29,358 | 69.71¢ per $1 |
| Gini / Inequality Index | 29,358 | 0.39 |
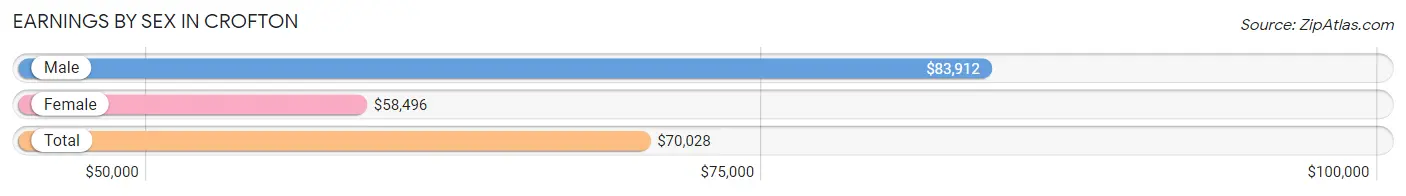
Earnings by Sex in Crofton
Average Earnings in Crofton are $70,028, $83,912 for men and $58,496 for women, a difference of 30.3%.
| Sex | Number | Average Earnings |
| Male | 8,826 (52.5%) | $83,912 |
| Female | 7,981 (47.5%) | $58,496 |
| Total | 16,807 (100.0%) | $70,028 |
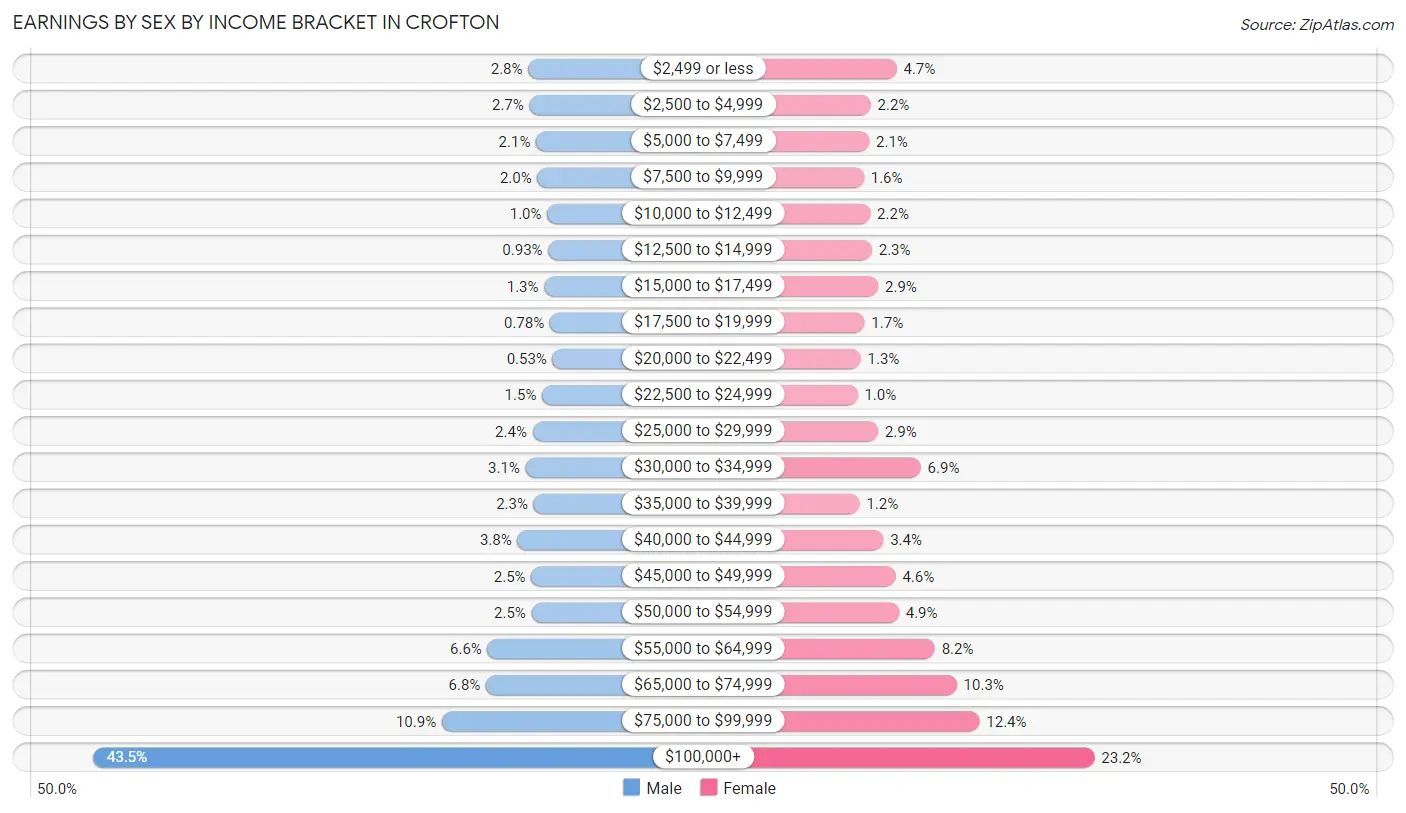
Earnings by Sex by Income Bracket in Crofton
The most common earnings brackets in Crofton are $100,000+ for men (3,840 | 43.5%) and $100,000+ for women (1,851 | 23.2%).
| Income | Male | Female |
| $2,499 or less | 248 (2.8%) | 372 (4.7%) |
| $2,500 to $4,999 | 237 (2.7%) | 178 (2.2%) |
| $5,000 to $7,499 | 183 (2.1%) | 167 (2.1%) |
| $7,500 to $9,999 | 172 (1.9%) | 127 (1.6%) |
| $10,000 to $12,499 | 91 (1.0%) | 175 (2.2%) |
| $12,500 to $14,999 | 82 (0.9%) | 187 (2.3%) |
| $15,000 to $17,499 | 116 (1.3%) | 234 (2.9%) |
| $17,500 to $19,999 | 69 (0.8%) | 132 (1.7%) |
| $20,000 to $22,499 | 47 (0.5%) | 103 (1.3%) |
| $22,500 to $24,999 | 133 (1.5%) | 80 (1.0%) |
| $25,000 to $29,999 | 212 (2.4%) | 233 (2.9%) |
| $30,000 to $34,999 | 270 (3.1%) | 552 (6.9%) |
| $35,000 to $39,999 | 203 (2.3%) | 95 (1.2%) |
| $40,000 to $44,999 | 337 (3.8%) | 272 (3.4%) |
| $45,000 to $49,999 | 222 (2.5%) | 364 (4.6%) |
| $50,000 to $54,999 | 221 (2.5%) | 389 (4.9%) |
| $55,000 to $64,999 | 584 (6.6%) | 658 (8.2%) |
| $65,000 to $74,999 | 597 (6.8%) | 821 (10.3%) |
| $75,000 to $99,999 | 962 (10.9%) | 991 (12.4%) |
| $100,000+ | 3,840 (43.5%) | 1,851 (23.2%) |
| Total | 8,826 (100.0%) | 7,981 (100.0%) |
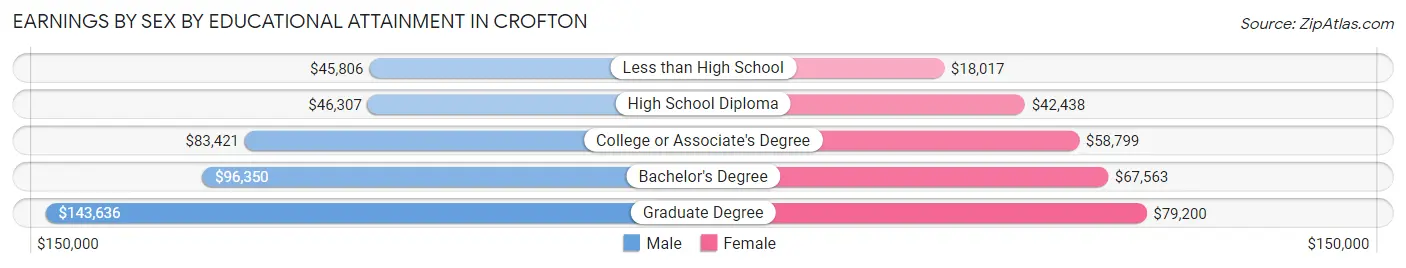
Earnings by Sex by Educational Attainment in Crofton
Average earnings in Crofton are $96,737 for men and $67,160 for women, a difference of 30.6%. Men with an educational attainment of graduate degree enjoy the highest average annual earnings of $143,636, while those with less than high school education earn the least with $45,806. Women with an educational attainment of graduate degree earn the most with the average annual earnings of $79,200, while those with less than high school education have the smallest earnings of $18,017.
| Educational Attainment | Male Income | Female Income |
| Less than High School | $45,806 | $18,017 |
| High School Diploma | $46,307 | $42,438 |
| College or Associate's Degree | $83,421 | $58,799 |
| Bachelor's Degree | $96,350 | $67,563 |
| Graduate Degree | $143,636 | $79,200 |
| Total | $96,737 | $67,160 |
Family Income in Crofton
Family Income Brackets in Crofton
According to the Crofton family income data, there are 2,797 families falling into the $200,000+ income range, which is the most common income bracket and makes up 36.7% of all families. Conversely, the $15,000 to $24,999 income bracket is the least frequent group with only 15 families (0.2%) belonging to this category.
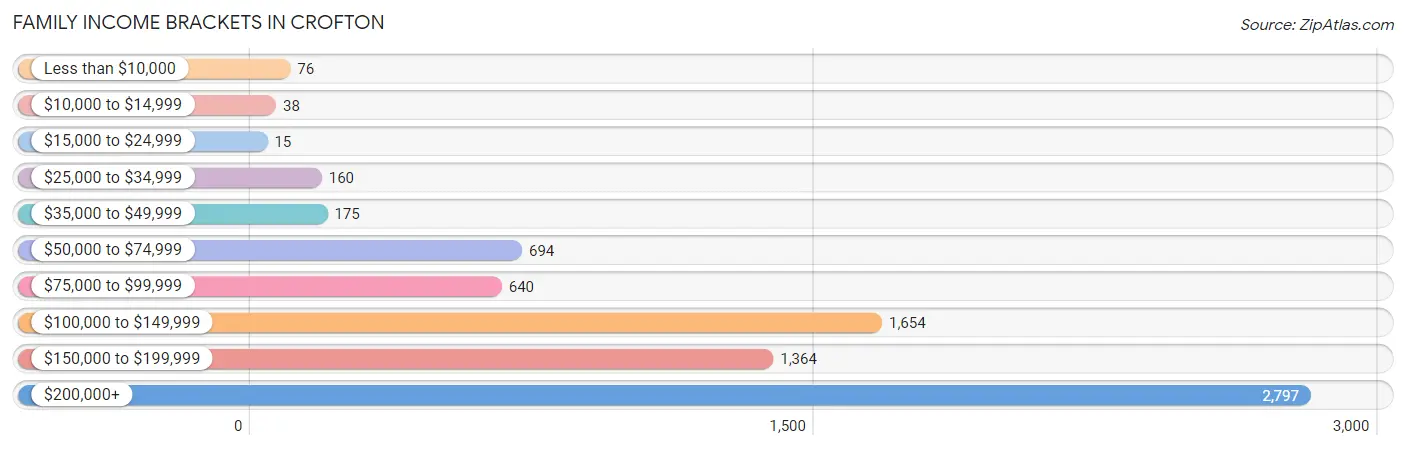
| Income Bracket | # Families | % Families |
| Less than $10,000 | 76 | 1.0% |
| $10,000 to $14,999 | 38 | 0.5% |
| $15,000 to $24,999 | 15 | 0.2% |
| $25,000 to $34,999 | 160 | 2.1% |
| $35,000 to $49,999 | 175 | 2.3% |
| $50,000 to $74,999 | 694 | 9.1% |
| $75,000 to $99,999 | 640 | 8.4% |
| $100,000 to $149,999 | 1,654 | 21.7% |
| $150,000 to $199,999 | 1,364 | 17.9% |
| $200,000+ | 2,797 | 36.7% |
Family Income by Famaliy Size in Crofton
6-person families (295 | 3.9%) account for the highest median family income in Crofton with $200,625 per family, while 2-person families (2,638 | 34.6%) have the highest median income of $64,536 per family member.
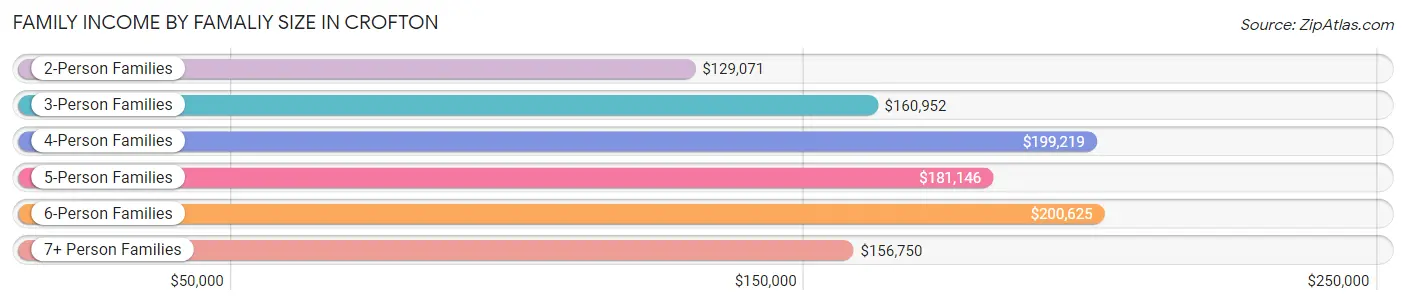
| Income Bracket | # Families | Median Income |
| 2-Person Families | 2,638 (34.6%) | $129,071 |
| 3-Person Families | 1,995 (26.2%) | $160,952 |
| 4-Person Families | 1,669 (21.9%) | $199,219 |
| 5-Person Families | 889 (11.7%) | $181,146 |
| 6-Person Families | 295 (3.9%) | $200,625 |
| 7+ Person Families | 136 (1.8%) | $156,750 |
| Total | 7,622 (100.0%) | $160,258 |
Family Income by Number of Earners in Crofton
The median family income in Crofton is $160,258, with families comprising 3+ earners (1,342) having the highest median family income of $249,265, while families with 1 earner (2,094) have the lowest median family income of $95,583, accounting for 17.6% and 27.5% of families, respectively.
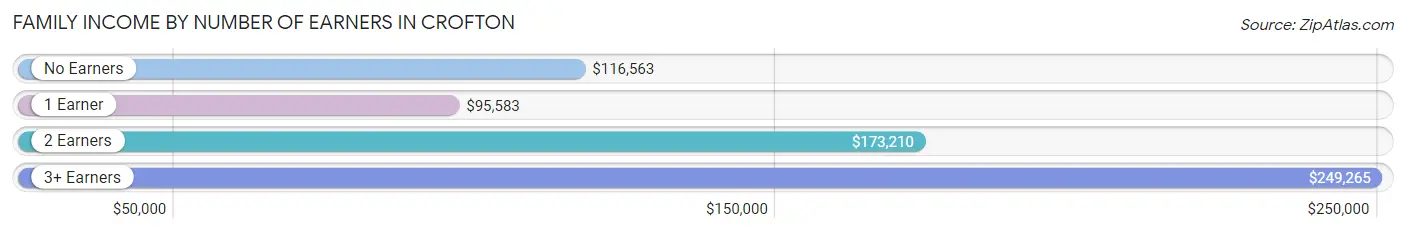
| Number of Earners | # Families | Median Income |
| No Earners | 544 (7.1%) | $116,563 |
| 1 Earner | 2,094 (27.5%) | $95,583 |
| 2 Earners | 3,642 (47.8%) | $173,210 |
| 3+ Earners | 1,342 (17.6%) | $249,265 |
| Total | 7,622 (100.0%) | $160,258 |
Household Income in Crofton
Household Income Brackets in Crofton
With 3,130 households falling in the category, the $200,000+ income range is the most frequent in Crofton, accounting for 29.9% of all households. In contrast, only 136 households (1.3%) fall into the $10,000 to $14,999 income bracket, making it the least populous group.
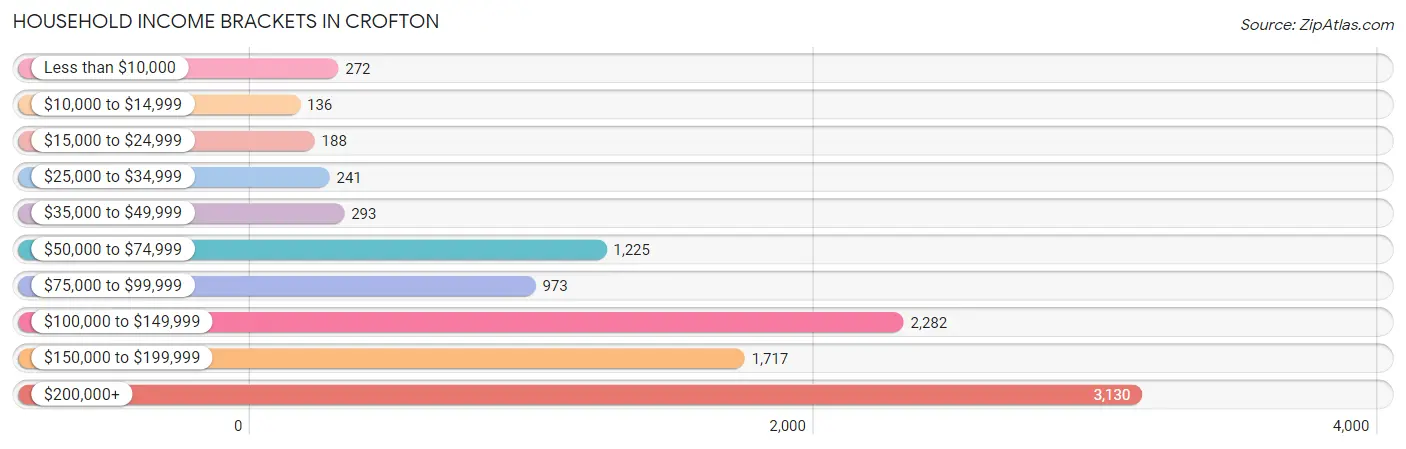
| Income Bracket | # Households | % Households |
| Less than $10,000 | 272 | 2.6% |
| $10,000 to $14,999 | 136 | 1.3% |
| $15,000 to $24,999 | 188 | 1.8% |
| $25,000 to $34,999 | 241 | 2.3% |
| $35,000 to $49,999 | 293 | 2.8% |
| $50,000 to $74,999 | 1,225 | 11.7% |
| $75,000 to $99,999 | 973 | 9.3% |
| $100,000 to $149,999 | 2,282 | 21.8% |
| $150,000 to $199,999 | 1,717 | 16.4% |
| $200,000+ | 3,130 | 29.9% |
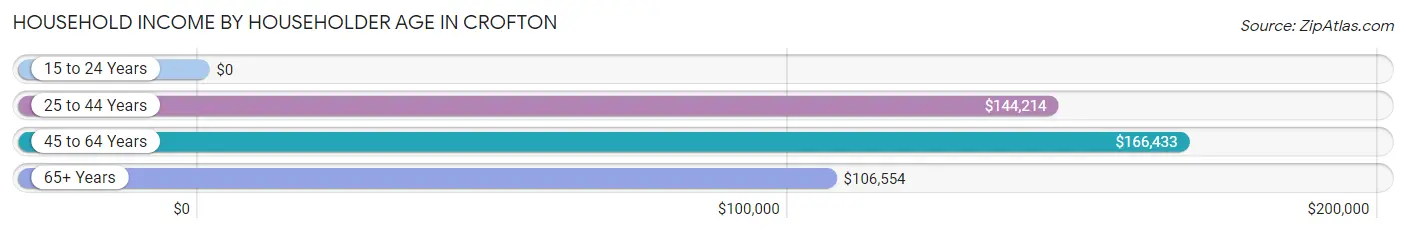
Household Income by Householder Age in Crofton
The median household income in Crofton is $143,202, with the highest median household income of $166,433 found in the 45 to 64 years age bracket for the primary householder. A total of 4,166 households (39.8%) fall into this category. Meanwhile, the 15 to 24 years age bracket for the primary householder has the lowest median household income of $0, with 87 households (0.8%) in this group.
| Income Bracket | # Households | Median Income |
| 15 to 24 Years | 87 (0.8%) | $0 |
| 25 to 44 Years | 4,244 (40.6%) | $144,214 |
| 45 to 64 Years | 4,166 (39.8%) | $166,433 |
| 65+ Years | 1,970 (18.8%) | $106,554 |
| Total | 10,467 (100.0%) | $143,202 |
Poverty in Crofton
Income Below Poverty by Sex and Age in Crofton
With 2.9% poverty level for males and 2.4% for females among the residents of Crofton, under 5 year old males and 18 to 24 year old females are the most vulnerable to poverty, with 95 males (9.5%) and 67 females (7.9%) in their respective age groups living below the poverty level.
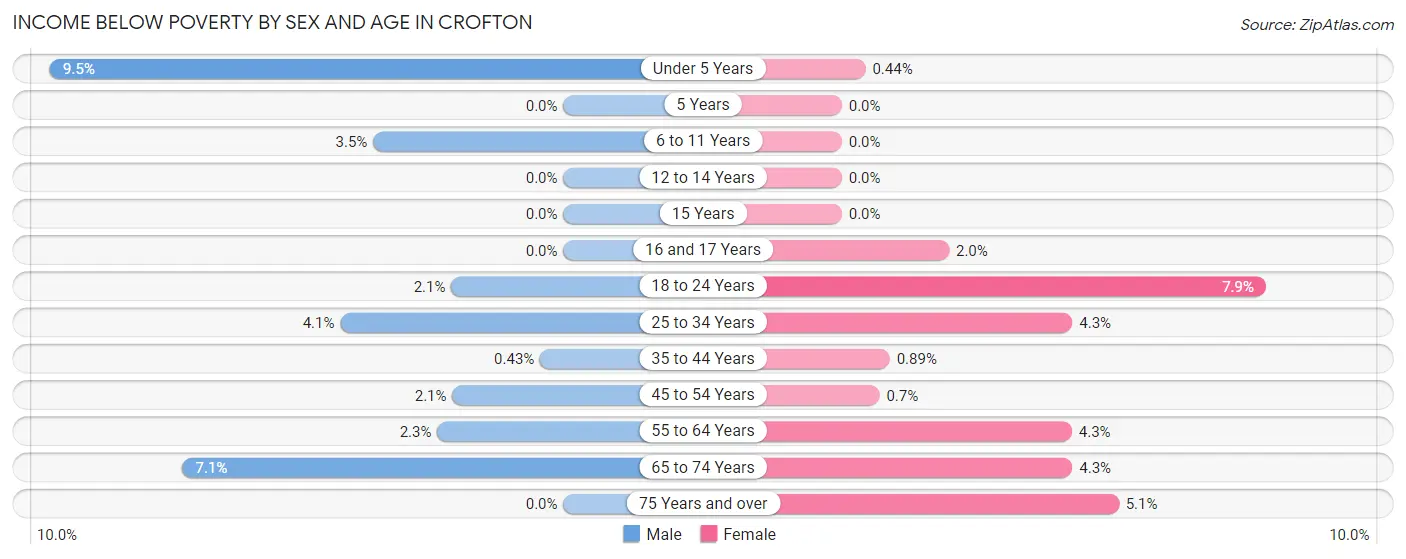
| Age Bracket | Male | Female |
| Under 5 Years | 95 (9.5%) | 5 (0.4%) |
| 5 Years | 0 (0.0%) | 0 (0.0%) |
| 6 to 11 Years | 63 (3.5%) | 0 (0.0%) |
| 12 to 14 Years | 0 (0.0%) | 0 (0.0%) |
| 15 Years | 0 (0.0%) | 0 (0.0%) |
| 16 and 17 Years | 0 (0.0%) | 7 (2.0%) |
| 18 to 24 Years | 19 (2.1%) | 67 (7.9%) |
| 25 to 34 Years | 83 (4.1%) | 72 (4.3%) |
| 35 to 44 Years | 10 (0.4%) | 22 (0.9%) |
| 45 to 54 Years | 40 (2.1%) | 14 (0.7%) |
| 55 to 64 Years | 37 (2.3%) | 80 (4.3%) |
| 65 to 74 Years | 67 (7.1%) | 54 (4.3%) |
| 75 Years and over | 0 (0.0%) | 31 (5.1%) |
| Total | 414 (2.9%) | 352 (2.4%) |
Income Above Poverty by Sex and Age in Crofton
According to the poverty statistics in Crofton, males aged 5 years and females aged 5 years are the age groups that are most secure financially, with 100.0% of males and 100.0% of females in these age groups living above the poverty line.
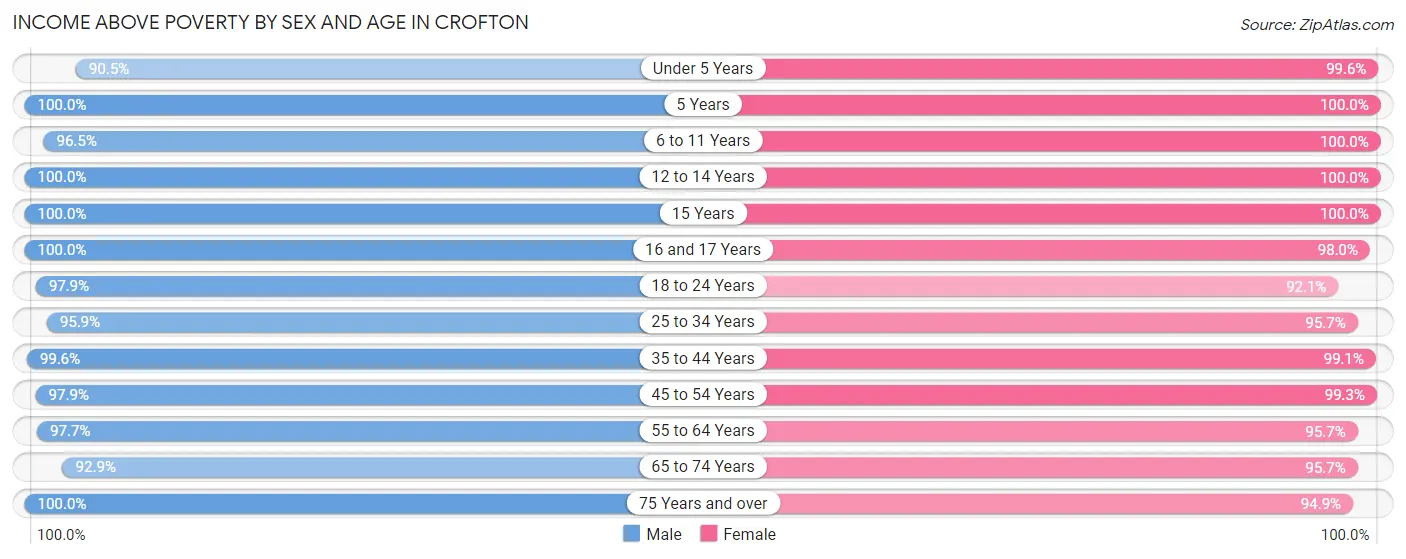
| Age Bracket | Male | Female |
| Under 5 Years | 902 (90.5%) | 1,135 (99.6%) |
| 5 Years | 320 (100.0%) | 74 (100.0%) |
| 6 to 11 Years | 1,722 (96.5%) | 1,610 (100.0%) |
| 12 to 14 Years | 680 (100.0%) | 649 (100.0%) |
| 15 Years | 284 (100.0%) | 223 (100.0%) |
| 16 and 17 Years | 279 (100.0%) | 345 (98.0%) |
| 18 to 24 Years | 894 (97.9%) | 784 (92.1%) |
| 25 to 34 Years | 1,921 (95.9%) | 1,609 (95.7%) |
| 35 to 44 Years | 2,296 (99.6%) | 2,442 (99.1%) |
| 45 to 54 Years | 1,906 (97.9%) | 1,990 (99.3%) |
| 55 to 64 Years | 1,542 (97.7%) | 1,794 (95.7%) |
| 65 to 74 Years | 880 (92.9%) | 1,208 (95.7%) |
| 75 Years and over | 281 (100.0%) | 572 (94.9%) |
| Total | 13,907 (97.1%) | 14,435 (97.6%) |
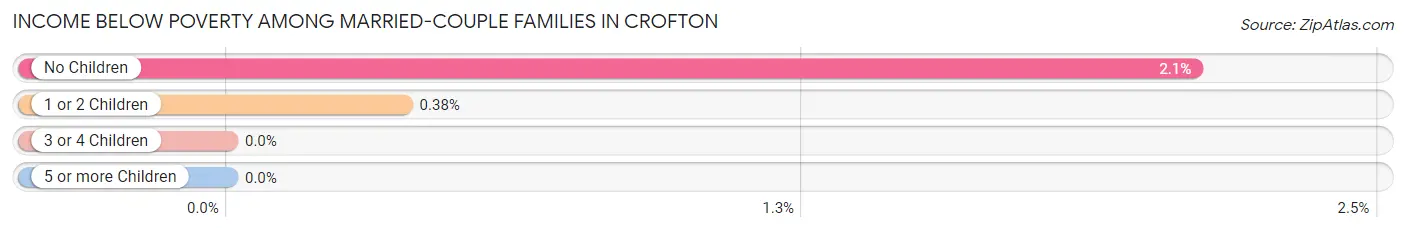
Income Below Poverty Among Married-Couple Families in Crofton
The poverty statistics for married-couple families in Crofton show that 1.1% or 65 of the total 5,855 families live below the poverty line. Families with no children have the highest poverty rate of 2.1%, comprising of 56 families. On the other hand, families with 3 or 4 children have the lowest poverty rate of 0.0%, which includes 0 families.
| Children | Above Poverty | Below Poverty |
| No Children | 2,610 (97.9%) | 56 (2.1%) |
| 1 or 2 Children | 2,348 (99.6%) | 9 (0.4%) |
| 3 or 4 Children | 801 (100.0%) | 0 (0.0%) |
| 5 or more Children | 31 (100.0%) | 0 (0.0%) |
| Total | 5,790 (98.9%) | 65 (1.1%) |
Income Below Poverty Among Single-Parent Households in Crofton
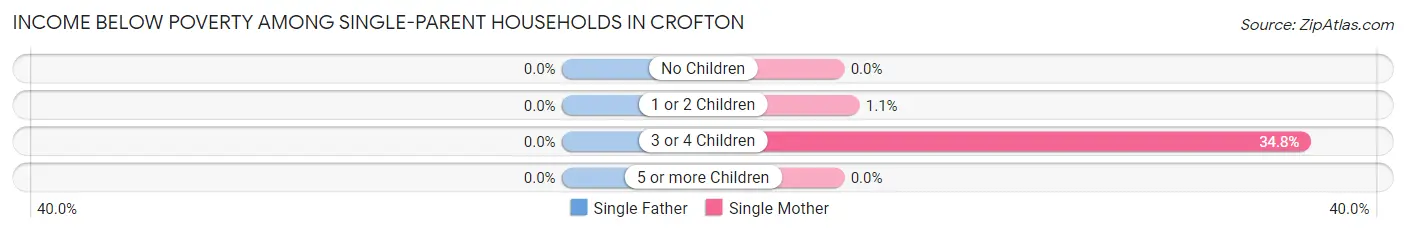
| Children | Single Father | Single Mother |
| No Children | 0 (0.0%) | 0 (0.0%) |
| 1 or 2 Children | 0 (0.0%) | 7 (1.1%) |
| 3 or 4 Children | 0 (0.0%) | 62 (34.8%) |
| 5 or more Children | 0 (0.0%) | 0 (0.0%) |
| Total | 0 (0.0%) | 69 (5.4%) |
Income Below Poverty Among Married-Couple vs Single-Parent Households in Crofton
The poverty data for Crofton shows that 65 of the married-couple family households (1.1%) and 69 of the single-parent households (3.9%) are living below the poverty level. Within the married-couple family households, those with no children have the highest poverty rate, with 56 households (2.1%) falling below the poverty line. Among the single-parent households, those with 3 or 4 children have the highest poverty rate, with 62 household (28.3%) living below poverty.
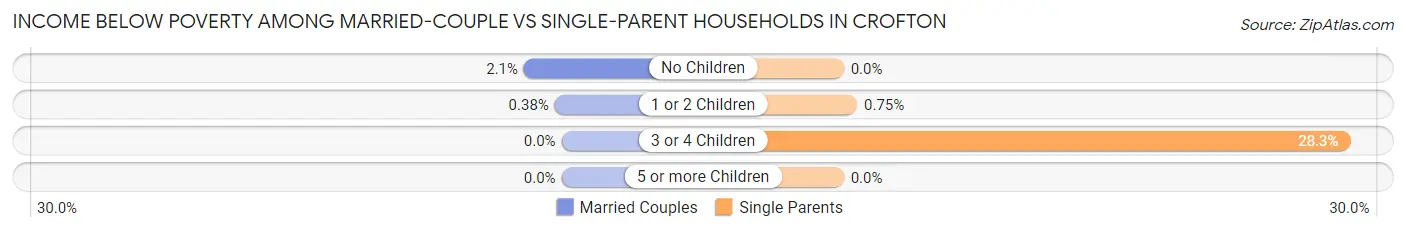
| Children | Married-Couple Families | Single-Parent Households |
| No Children | 56 (2.1%) | 0 (0.0%) |
| 1 or 2 Children | 9 (0.4%) | 7 (0.7%) |
| 3 or 4 Children | 0 (0.0%) | 62 (28.3%) |
| 5 or more Children | 0 (0.0%) | 0 (0.0%) |
| Total | 65 (1.1%) | 69 (3.9%) |
Race in Crofton
The most populous races in Crofton are White / Caucasian (19,325 | 65.8%), Black / African American (4,578 | 15.6%), and Asian (2,627 | 8.9%).
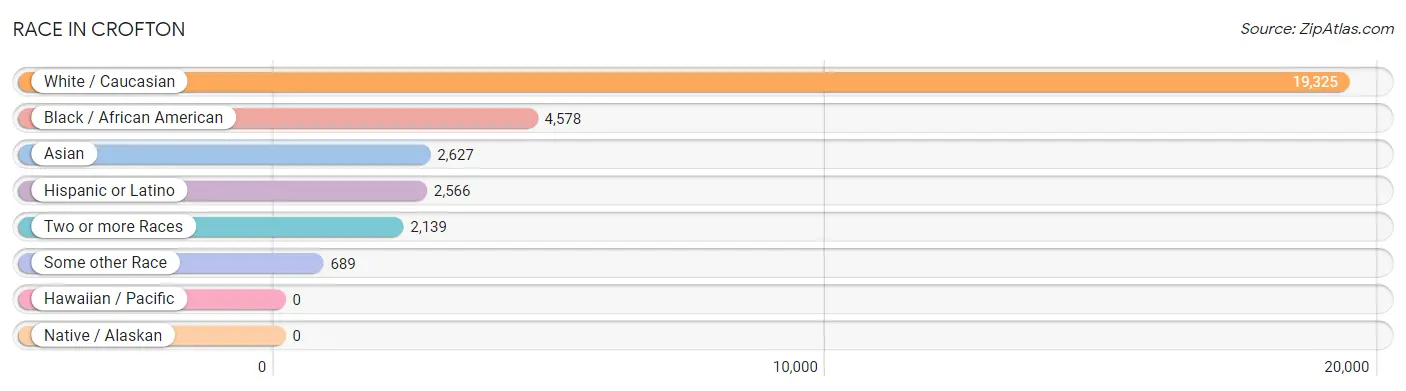
| Race | # Population | % Population |
| Asian | 2,627 | 8.9% |
| Black / African American | 4,578 | 15.6% |
| Hawaiian / Pacific | 0 | 0.0% |
| Hispanic or Latino | 2,566 | 8.7% |
| Native / Alaskan | 0 | 0.0% |
| White / Caucasian | 19,325 | 65.8% |
| Two or more Races | 2,139 | 7.3% |
| Some other Race | 689 | 2.4% |
| Total | 29,358 | 100.0% |
Ancestry in Crofton
The most populous ancestries reported in Crofton are German (4,950 | 16.9%), Irish (4,593 | 15.6%), English (3,612 | 12.3%), Italian (2,204 | 7.5%), and Korean (1,166 | 4.0%), together accounting for 56.3% of all Crofton residents.
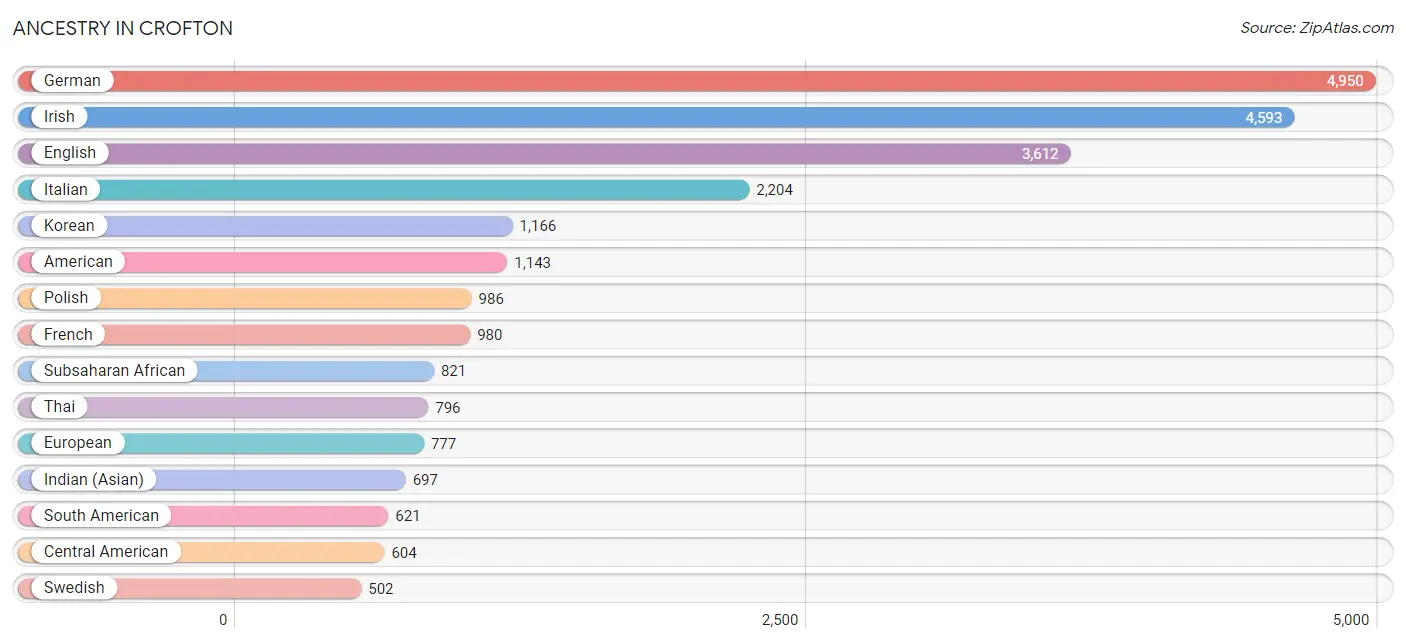
| Ancestry | # Population | % Population |
| Afghan | 99 | 0.3% |
| African | 141 | 0.5% |
| American | 1,143 | 3.9% |
| Arab | 308 | 1.1% |
| Armenian | 32 | 0.1% |
| Austrian | 90 | 0.3% |
| Belgian | 30 | 0.1% |
| Bhutanese | 42 | 0.1% |
| Bolivian | 26 | 0.1% |
| Brazilian | 38 | 0.1% |
| British | 251 | 0.9% |
| Bulgarian | 38 | 0.1% |
| Burmese | 98 | 0.3% |
| Canadian | 34 | 0.1% |
| Cape Verdean | 109 | 0.4% |
| Carpatho Rusyn | 14 | 0.1% |
| Central American | 604 | 2.1% |
| Chilean | 31 | 0.1% |
| Colombian | 18 | 0.1% |
| Creek | 28 | 0.1% |
| Cuban | 56 | 0.2% |
| Czech | 137 | 0.5% |
| Czechoslovakian | 17 | 0.1% |
| Danish | 202 | 0.7% |
| Dominican | 59 | 0.2% |
| Dutch | 283 | 1.0% |
| Eastern European | 151 | 0.5% |
| Ecuadorian | 87 | 0.3% |
| Egyptian | 98 | 0.3% |
| English | 3,612 | 12.3% |
| Ethiopian | 255 | 0.9% |
| European | 777 | 2.6% |
| Finnish | 51 | 0.2% |
| French | 980 | 3.3% |
| French Canadian | 95 | 0.3% |
| German | 4,950 | 16.9% |
| Greek | 123 | 0.4% |
| Guamanian / Chamorro | 62 | 0.2% |
| Hungarian | 168 | 0.6% |
| Indian (Asian) | 697 | 2.4% |
| Irish | 4,593 | 15.6% |
| Israeli | 22 | 0.1% |
| Italian | 2,204 | 7.5% |
| Jamaican | 32 | 0.1% |
| Japanese | 8 | 0.0% |
| Korean | 1,166 | 4.0% |
| Latvian | 61 | 0.2% |
| Lebanese | 66 | 0.2% |
| Lithuanian | 104 | 0.4% |
| Macedonian | 8 | 0.0% |
| Mexican | 468 | 1.6% |
| Native Hawaiian | 62 | 0.2% |
| Navajo | 23 | 0.1% |
| Nigerian | 279 | 0.9% |
| Northern European | 57 | 0.2% |
| Norwegian | 363 | 1.2% |
| Pakistani | 124 | 0.4% |
| Panamanian | 356 | 1.2% |
| Peruvian | 459 | 1.6% |
| Polish | 986 | 3.4% |
| Portuguese | 62 | 0.2% |
| Puerto Rican | 315 | 1.1% |
| Romanian | 73 | 0.3% |
| Russian | 235 | 0.8% |
| Salvadoran | 248 | 0.8% |
| Scandinavian | 232 | 0.8% |
| Scotch-Irish | 245 | 0.8% |
| Scottish | 495 | 1.7% |
| Slavic | 49 | 0.2% |
| Slovak | 159 | 0.5% |
| Slovene | 29 | 0.1% |
| South African | 18 | 0.1% |
| South American | 621 | 2.1% |
| Spaniard | 144 | 0.5% |
| Spanish | 151 | 0.5% |
| Sri Lankan | 82 | 0.3% |
| Subsaharan African | 821 | 2.8% |
| Swedish | 502 | 1.7% |
| Swiss | 115 | 0.4% |
| Thai | 796 | 2.7% |
| Trinidadian and Tobagonian | 19 | 0.1% |
| Turkish | 44 | 0.2% |
| Ukrainian | 98 | 0.3% |
| Welsh | 281 | 1.0% |
| West Indian | 209 | 0.7% | View All 85 Rows |
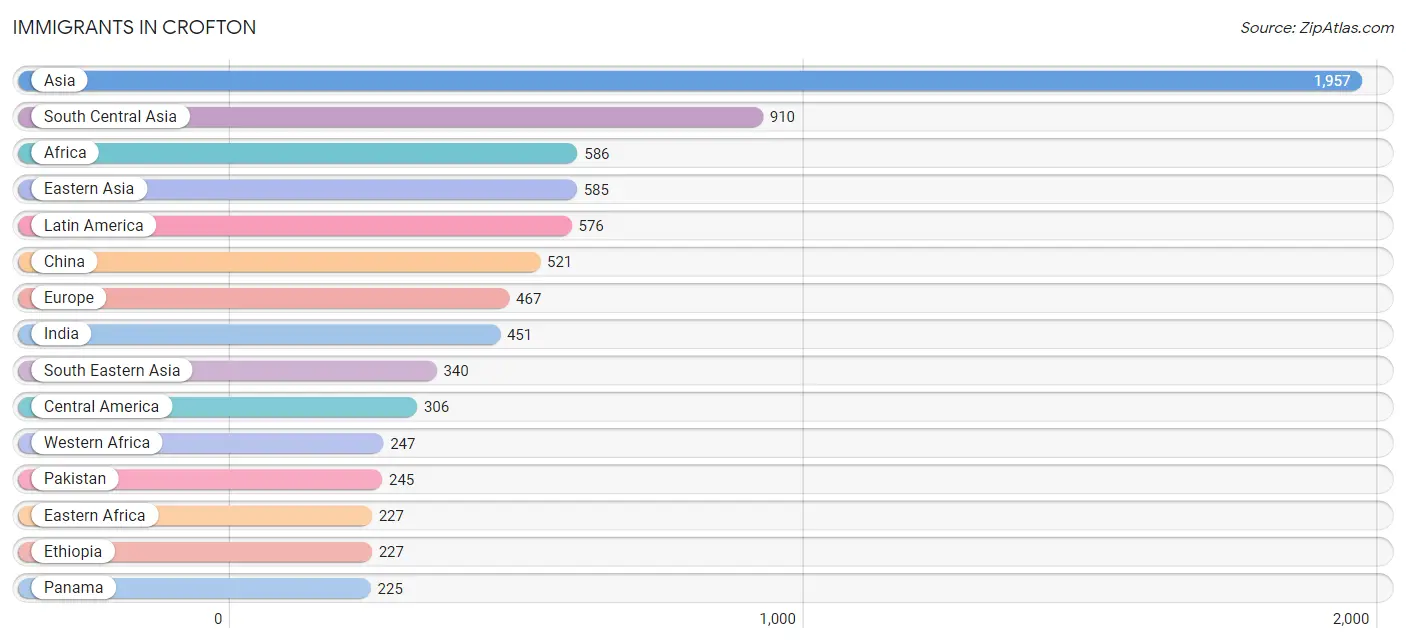
Immigrants in Crofton
The most numerous immigrant groups reported in Crofton came from Asia (1,957 | 6.7%), South Central Asia (910 | 3.1%), Africa (586 | 2.0%), Eastern Asia (585 | 2.0%), and Latin America (576 | 2.0%), together accounting for 15.7% of all Crofton residents.
| Immigration Origin | # Population | % Population |
| Afghanistan | 140 | 0.5% |
| Africa | 586 | 2.0% |
| Asia | 1,957 | 6.7% |
| Bolivia | 10 | 0.0% |
| Brazil | 44 | 0.2% |
| Bulgaria | 14 | 0.1% |
| Cambodia | 8 | 0.0% |
| Cameroon | 19 | 0.1% |
| Canada | 30 | 0.1% |
| Caribbean | 74 | 0.3% |
| Central America | 306 | 1.0% |
| China | 521 | 1.8% |
| Colombia | 18 | 0.1% |
| Dominican Republic | 51 | 0.2% |
| Eastern Africa | 227 | 0.8% |
| Eastern Asia | 585 | 2.0% |
| Eastern Europe | 181 | 0.6% |
| Egypt | 8 | 0.0% |
| El Salvador | 40 | 0.1% |
| England | 63 | 0.2% |
| Ethiopia | 227 | 0.8% |
| Europe | 467 | 1.6% |
| Germany | 8 | 0.0% |
| Ghana | 106 | 0.4% |
| Guyana | 124 | 0.4% |
| Hong Kong | 130 | 0.4% |
| Hungary | 12 | 0.0% |
| India | 451 | 1.5% |
| Italy | 28 | 0.1% |
| Korea | 64 | 0.2% |
| Latin America | 576 | 2.0% |
| Latvia | 15 | 0.1% |
| Lithuania | 12 | 0.0% |
| Mexico | 41 | 0.1% |
| Middle Africa | 19 | 0.1% |
| Moldova | 14 | 0.1% |
| Nepal | 74 | 0.3% |
| Nigeria | 130 | 0.4% |
| Northern Africa | 8 | 0.0% |
| Northern Europe | 133 | 0.4% |
| Norway | 30 | 0.1% |
| Pakistan | 245 | 0.8% |
| Panama | 225 | 0.8% |
| Philippines | 193 | 0.7% |
| Poland | 10 | 0.0% |
| Russia | 81 | 0.3% |
| Sierra Leone | 11 | 0.0% |
| South Africa | 85 | 0.3% |
| South America | 196 | 0.7% |
| South Central Asia | 910 | 3.1% |
| South Eastern Asia | 340 | 1.2% |
| Southern Europe | 145 | 0.5% |
| Spain | 117 | 0.4% |
| Sweden | 19 | 0.1% |
| Thailand | 90 | 0.3% |
| Trinidad and Tobago | 23 | 0.1% |
| Turkey | 26 | 0.1% |
| Ukraine | 23 | 0.1% |
| Vietnam | 49 | 0.2% |
| Western Africa | 247 | 0.8% |
| Western Asia | 26 | 0.1% |
| Western Europe | 8 | 0.0% | View All 62 Rows |
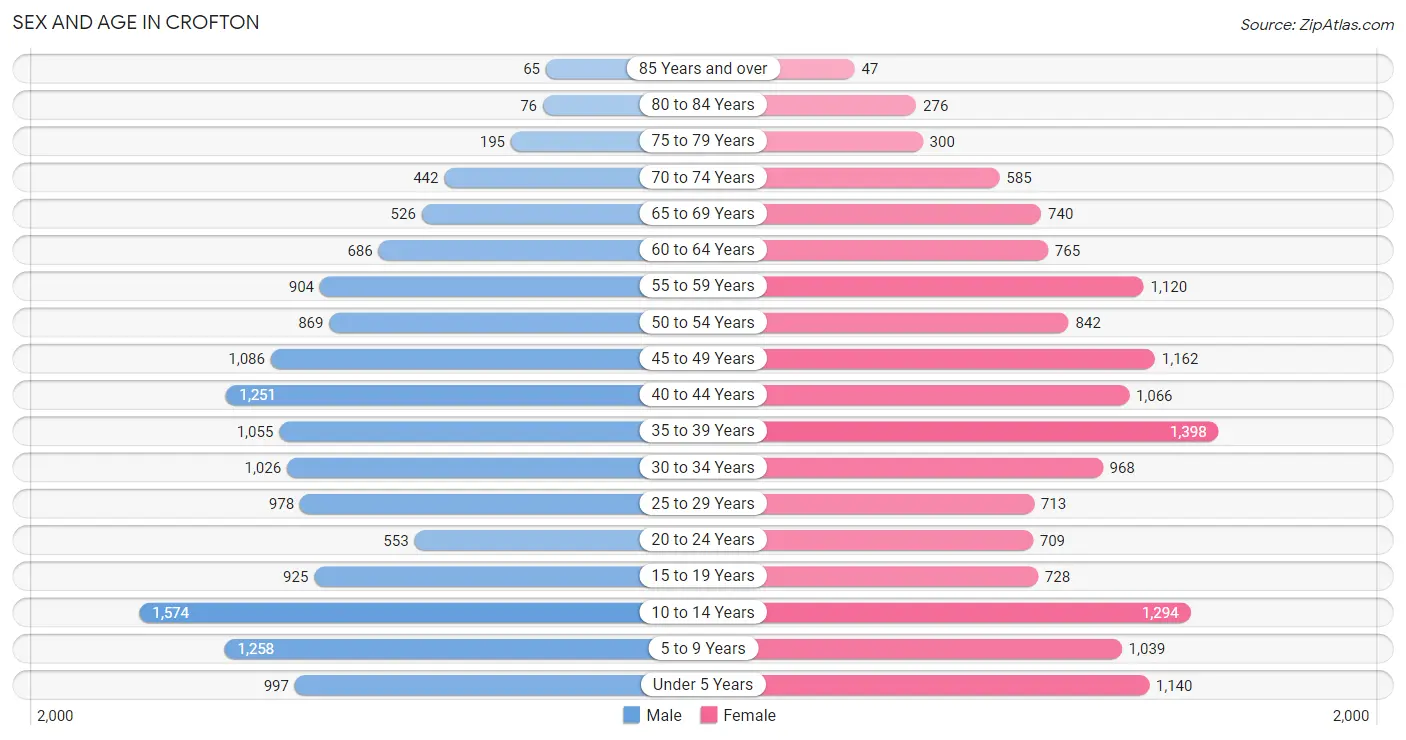
Sex and Age in Crofton
Sex and Age in Crofton
The most populous age groups in Crofton are 10 to 14 Years (1,574 | 10.9%) for men and 35 to 39 Years (1,398 | 9.4%) for women.
| Age Bracket | Male | Female |
| Under 5 Years | 997 (6.9%) | 1,140 (7.7%) |
| 5 to 9 Years | 1,258 (8.7%) | 1,039 (7.0%) |
| 10 to 14 Years | 1,574 (10.9%) | 1,294 (8.7%) |
| 15 to 19 Years | 925 (6.4%) | 728 (4.9%) |
| 20 to 24 Years | 553 (3.8%) | 709 (4.8%) |
| 25 to 29 Years | 978 (6.8%) | 713 (4.8%) |
| 30 to 34 Years | 1,026 (7.1%) | 968 (6.5%) |
| 35 to 39 Years | 1,055 (7.3%) | 1,398 (9.4%) |
| 40 to 44 Years | 1,251 (8.6%) | 1,066 (7.2%) |
| 45 to 49 Years | 1,086 (7.5%) | 1,162 (7.8%) |
| 50 to 54 Years | 869 (6.0%) | 842 (5.7%) |
| 55 to 59 Years | 904 (6.2%) | 1,120 (7.5%) |
| 60 to 64 Years | 686 (4.7%) | 765 (5.1%) |
| 65 to 69 Years | 526 (3.6%) | 740 (5.0%) |
| 70 to 74 Years | 442 (3.1%) | 585 (3.9%) |
| 75 to 79 Years | 195 (1.3%) | 300 (2.0%) |
| 80 to 84 Years | 76 (0.5%) | 276 (1.8%) |
| 85 Years and over | 65 (0.4%) | 47 (0.3%) |
| Total | 14,466 (100.0%) | 14,892 (100.0%) |
Families and Households in Crofton
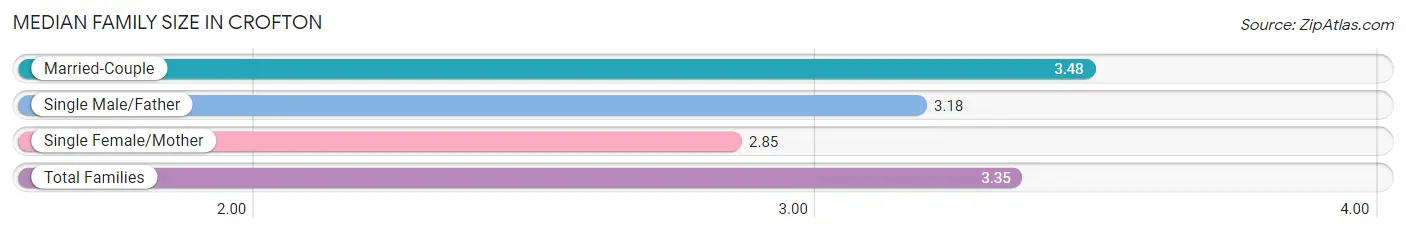
Median Family Size in Crofton
The median family size in Crofton is 3.35 persons per family, with married-couple families (5,855 | 76.8%) accounting for the largest median family size of 3.48 persons per family. On the other hand, single female/mother families (1,275 | 16.7%) represent the smallest median family size with 2.85 persons per family.
| Family Type | # Families | Family Size |
| Married-Couple | 5,855 (76.8%) | 3.48 |
| Single Male/Father | 492 (6.5%) | 3.18 |
| Single Female/Mother | 1,275 (16.7%) | 2.85 |
| Total Families | 7,622 (100.0%) | 3.35 |
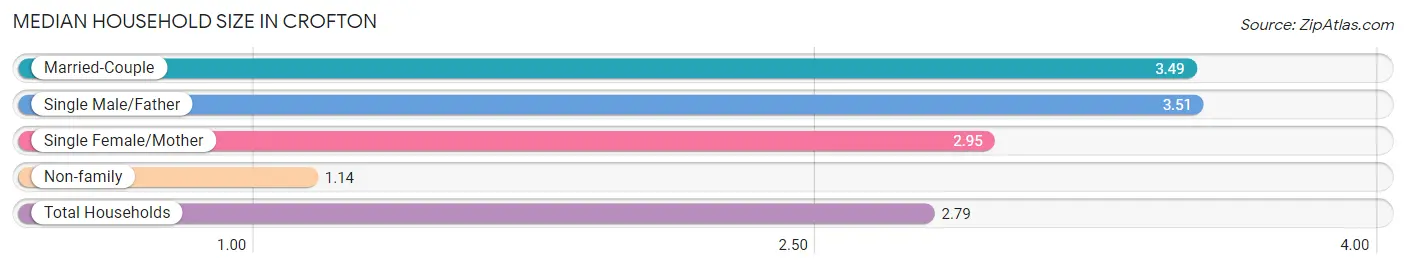
Median Household Size in Crofton
The median household size in Crofton is 2.79 persons per household, with single male/father households (492 | 4.7%) accounting for the largest median household size of 3.51 persons per household. non-family households (2,845 | 27.2%) represent the smallest median household size with 1.14 persons per household.
| Household Type | # Households | Household Size |
| Married-Couple | 5,855 (55.9%) | 3.49 |
| Single Male/Father | 492 (4.7%) | 3.51 |
| Single Female/Mother | 1,275 (12.2%) | 2.95 |
| Non-family | 2,845 (27.2%) | 1.14 |
| Total Households | 10,467 (100.0%) | 2.79 |
Household Size by Marriage Status in Crofton
Out of a total of 10,467 households in Crofton, 7,622 (72.8%) are family households, while 2,845 (27.2%) are nonfamily households. The most numerous type of family households are 2-person households, comprising 2,605, and the most common type of nonfamily households are 1-person households, comprising 2,470.
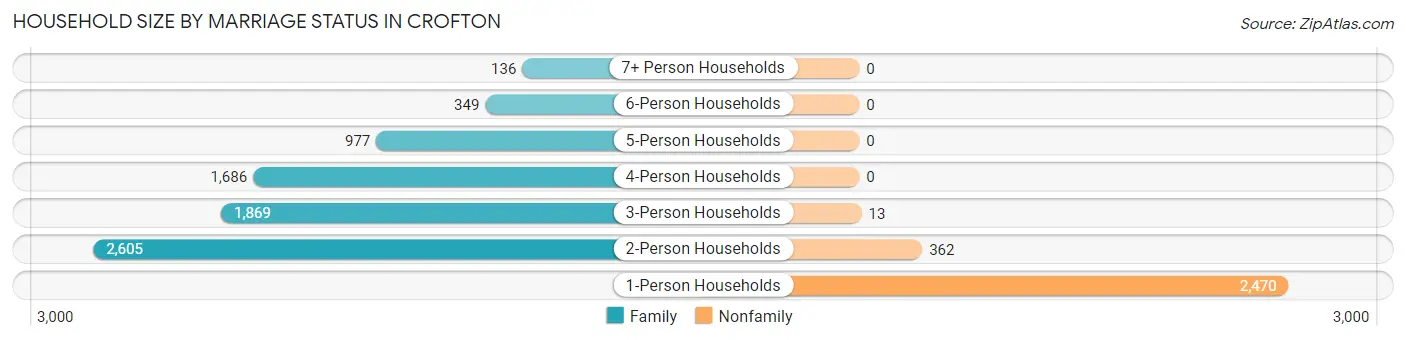
| Household Size | Family Households | Nonfamily Households |
| 1-Person Households | - | 2,470 (23.6%) |
| 2-Person Households | 2,605 (24.9%) | 362 (3.5%) |
| 3-Person Households | 1,869 (17.9%) | 13 (0.1%) |
| 4-Person Households | 1,686 (16.1%) | 0 (0.0%) |
| 5-Person Households | 977 (9.3%) | 0 (0.0%) |
| 6-Person Households | 349 (3.3%) | 0 (0.0%) |
| 7+ Person Households | 136 (1.3%) | 0 (0.0%) |
| Total | 7,622 (72.8%) | 2,845 (27.2%) |
Female Fertility in Crofton
Fertility by Age in Crofton
Average fertility rate in Crofton is 61.0 births per 1,000 women. Women in the age bracket of 20 to 34 years have the highest fertility rate with 128.0 births per 1,000 women. Women in the age bracket of 20 to 34 years acount for 72.6% of all women with births.
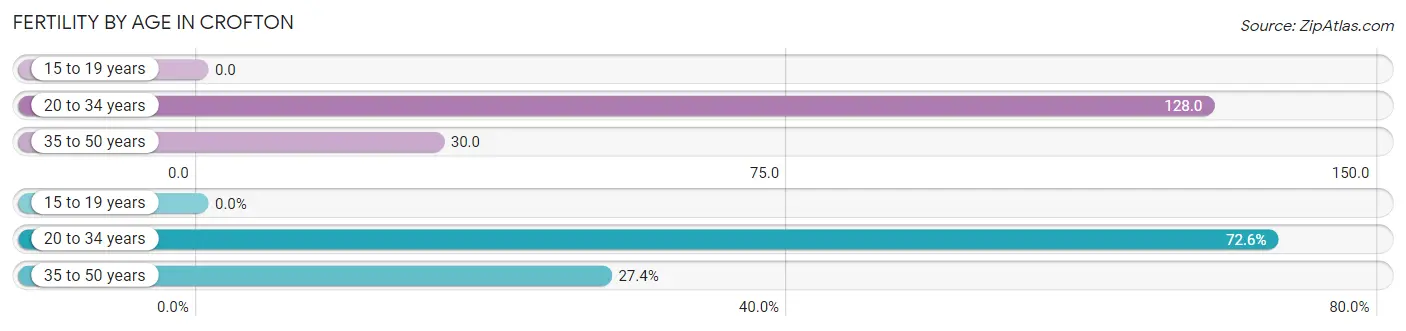
| Age Bracket | Women with Births | Births / 1,000 Women |
| 15 to 19 years | 0 (0.0%) | 0.0 |
| 20 to 34 years | 305 (72.6%) | 128.0 |
| 35 to 50 years | 115 (27.4%) | 30.0 |
| Total | 420 (100.0%) | 61.0 |
Fertility by Age by Marriage Status in Crofton
72.4% of women with births (420) in Crofton are married. The highest percentage of unmarried women with births falls into 35 to 50 years age bracket with 40.0% of them unmarried at the time of birth, while the lowest percentage of unmarried women with births belong to 20 to 34 years age bracket with 23.0% of them unmarried.
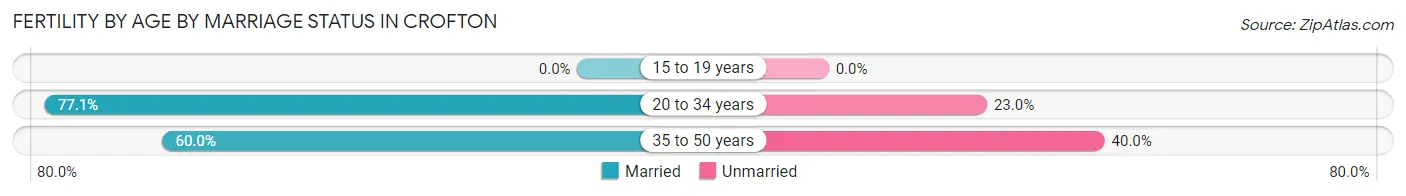
| Age Bracket | Married | Unmarried |
| 15 to 19 years | 0 (0.0%) | 0 (0.0%) |
| 20 to 34 years | 235 (77.0%) | 70 (23.0%) |
| 35 to 50 years | 69 (60.0%) | 46 (40.0%) |
| Total | 304 (72.4%) | 116 (27.6%) |
Fertility by Education in Crofton
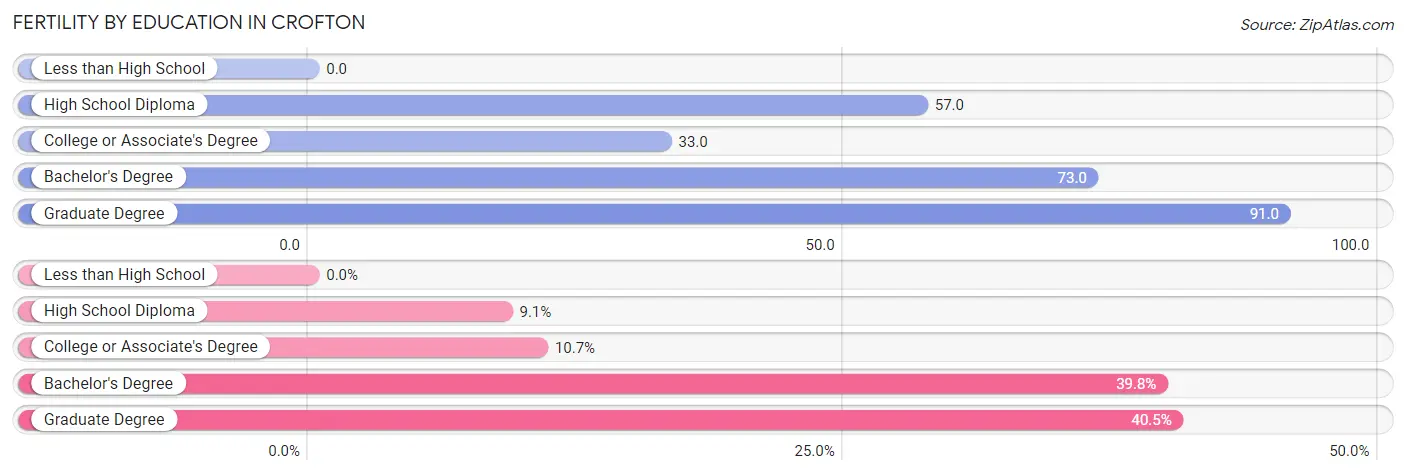
| Educational Attainment | Women with Births | Births / 1,000 Women |
| Less than High School | 0 (0.0%) | 0.0 |
| High School Diploma | 38 (9.0%) | 57.0 |
| College or Associate's Degree | 45 (10.7%) | 33.0 |
| Bachelor's Degree | 167 (39.8%) | 73.0 |
| Graduate Degree | 170 (40.5%) | 91.0 |
| Total | 420 (100.0%) | 61.0 |
Fertility by Education by Marriage Status in Crofton
27.6% of women with births in Crofton are unmarried. Women with the educational attainment of college or associate's degree are most likely to be married with 100.0% of them married at childbirth, while women with the educational attainment of high school diploma are least likely to be married with 34.2% of them unmarried at childbirth.
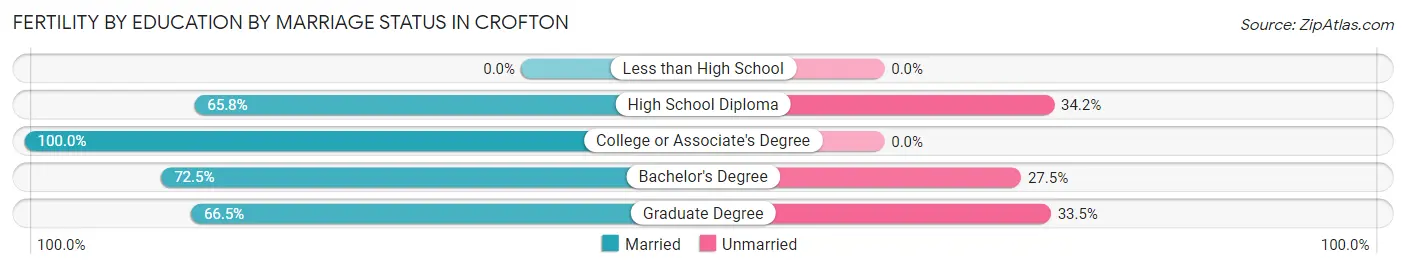
| Educational Attainment | Married | Unmarried |
| Less than High School | 0 (0.0%) | 0 (0.0%) |
| High School Diploma | 25 (65.8%) | 13 (34.2%) |
| College or Associate's Degree | 45 (100.0%) | 0 (0.0%) |
| Bachelor's Degree | 121 (72.5%) | 46 (27.5%) |
| Graduate Degree | 113 (66.5%) | 57 (33.5%) |
| Total | 304 (72.4%) | 116 (27.6%) |
Employment Characteristics in Crofton
Employment by Class of Employer in Crofton
Among the 15,327 employed individuals in Crofton, private company employees (8,561 | 55.9%), federal government employees (2,599 | 17.0%), and local government employees (1,235 | 8.1%) make up the most common classes of employment.
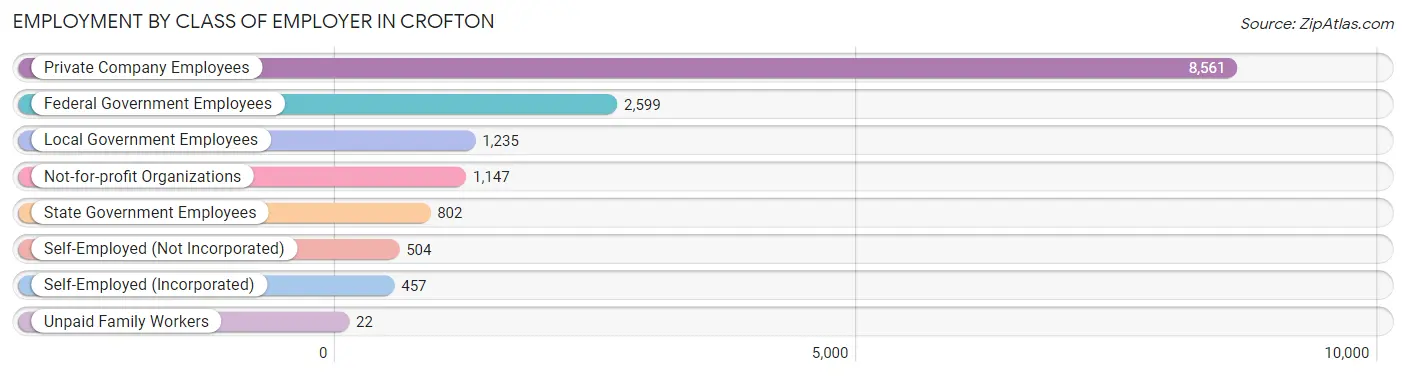
| Employer Class | # Employees | % Employees |
| Private Company Employees | 8,561 | 55.9% |
| Self-Employed (Incorporated) | 457 | 3.0% |
| Self-Employed (Not Incorporated) | 504 | 3.3% |
| Not-for-profit Organizations | 1,147 | 7.5% |
| Local Government Employees | 1,235 | 8.1% |
| State Government Employees | 802 | 5.2% |
| Federal Government Employees | 2,599 | 17.0% |
| Unpaid Family Workers | 22 | 0.1% |
| Total | 15,327 | 100.0% |
Employment Status by Age in Crofton
According to the labor force statistics for Crofton, out of the total population over 16 years of age (21,549), 75.5% or 16,269 individuals are in the labor force, with 4.1% or 667 of them unemployed. The age group with the highest labor force participation rate is 45 to 54 years, with 92.2% or 3,650 individuals in the labor force. Within the labor force, the 25 to 29 years age range has the highest percentage of unemployed individuals, with 10.2% or 145 of them being unemployed.
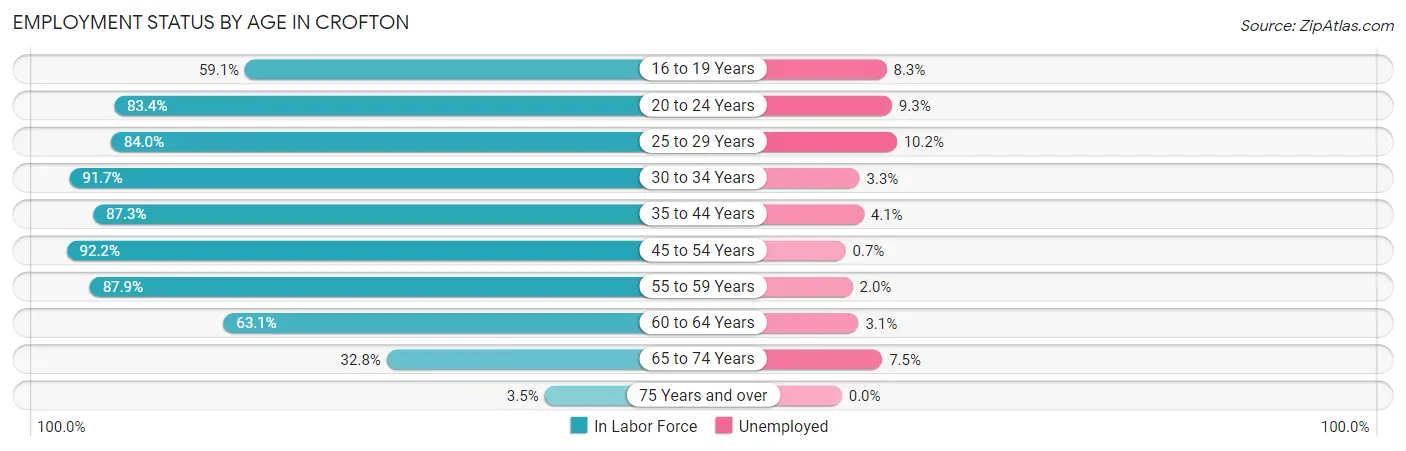
| Age Bracket | In Labor Force | Unemployed |
| 16 to 19 Years | 677 (59.1%) | 56 (8.3%) |
| 20 to 24 Years | 1,053 (83.4%) | 98 (9.3%) |
| 25 to 29 Years | 1,420 (84.0%) | 145 (10.2%) |
| 30 to 34 Years | 1,828 (91.7%) | 60 (3.3%) |
| 35 to 44 Years | 4,164 (87.3%) | 171 (4.1%) |
| 45 to 54 Years | 3,650 (92.2%) | 26 (0.7%) |
| 55 to 59 Years | 1,779 (87.9%) | 36 (2.0%) |
| 60 to 64 Years | 916 (63.1%) | 28 (3.1%) |
| 65 to 74 Years | 752 (32.8%) | 56 (7.5%) |
| 75 Years and over | 34 (3.5%) | 0 (0.0%) |
| Total | 16,269 (75.5%) | 667 (4.1%) |
Employment Status by Educational Attainment in Crofton
According to labor force statistics for Crofton, 86.6% of individuals (13,760) out of the total population between 25 and 64 years of age (15,889) are in the labor force, with 3.3% or 454 of them being unemployed. The group with the highest labor force participation rate are those with the educational attainment of bachelor's degree or higher, with 89.0% or 8,856 individuals in the labor force. Within the labor force, individuals with high school diploma education have the highest percentage of unemployment, with 9.9% or 135 of them being unemployed.
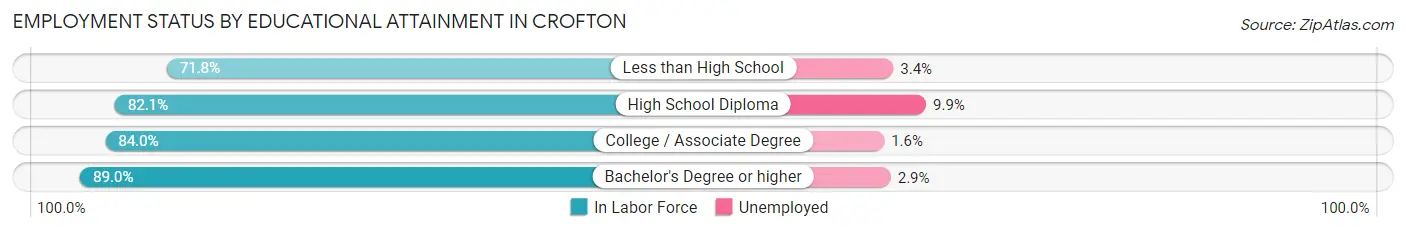
| Educational Attainment | In Labor Force | Unemployed |
| Less than High School | 290 (71.8%) | 14 (3.4%) |
| High School Diploma | 1,360 (82.1%) | 164 (9.9%) |
| College / Associate Degree | 3,258 (84.0%) | 62 (1.6%) |
| Bachelor's Degree or higher | 8,856 (89.0%) | 289 (2.9%) |
| Total | 13,760 (86.6%) | 524 (3.3%) |
Employment Occupations by Sex in Crofton
Management, Business, Science and Arts Occupations
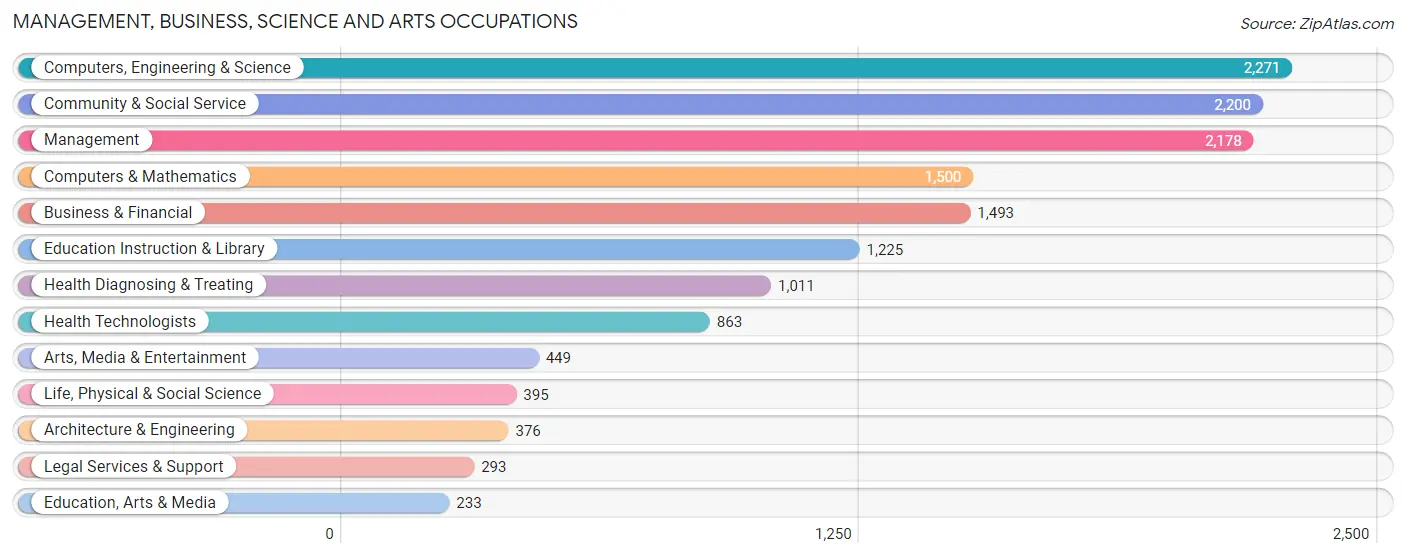
The most common Management, Business, Science and Arts occupations in Crofton are Computers, Engineering & Science (2,271 | 14.9%), Community & Social Service (2,200 | 14.5%), Management (2,178 | 14.3%), Computers & Mathematics (1,500 | 9.9%), and Business & Financial (1,493 | 9.8%).
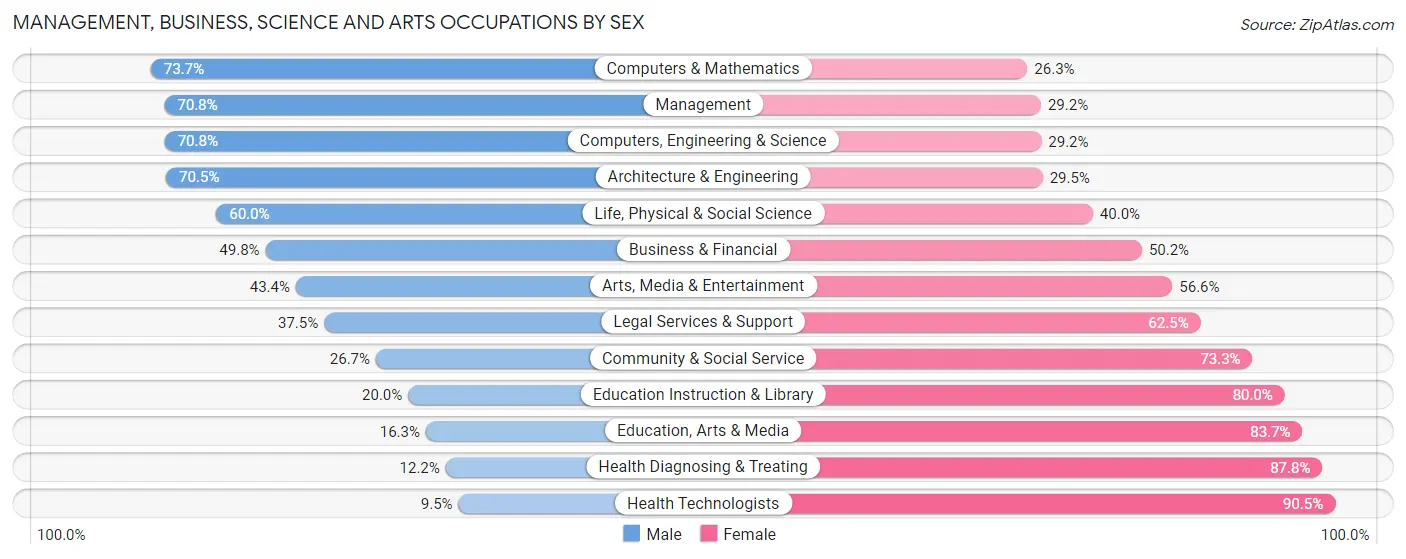
Management, Business, Science and Arts Occupations by Sex
Within the Management, Business, Science and Arts occupations in Crofton, the most male-oriented occupations are Computers & Mathematics (73.7%), Management (70.8%), and Computers, Engineering & Science (70.8%), while the most female-oriented occupations are Health Technologists (90.5%), Health Diagnosing & Treating (87.8%), and Education, Arts & Media (83.7%).
| Occupation | Male | Female |
| Management | 1,543 (70.8%) | 635 (29.2%) |
| Business & Financial | 743 (49.8%) | 750 (50.2%) |
| Computers, Engineering & Science | 1,607 (70.8%) | 664 (29.2%) |
| Computers & Mathematics | 1,105 (73.7%) | 395 (26.3%) |
| Architecture & Engineering | 265 (70.5%) | 111 (29.5%) |
| Life, Physical & Social Science | 237 (60.0%) | 158 (40.0%) |
| Community & Social Service | 588 (26.7%) | 1,612 (73.3%) |
| Education, Arts & Media | 38 (16.3%) | 195 (83.7%) |
| Legal Services & Support | 110 (37.5%) | 183 (62.5%) |
| Education Instruction & Library | 245 (20.0%) | 980 (80.0%) |
| Arts, Media & Entertainment | 195 (43.4%) | 254 (56.6%) |
| Health Diagnosing & Treating | 123 (12.2%) | 888 (87.8%) |
| Health Technologists | 82 (9.5%) | 781 (90.5%) |
| Total (Category) | 4,604 (50.3%) | 4,549 (49.7%) |
| Total (Overall) | 7,882 (51.8%) | 7,319 (48.1%) |
Services Occupations
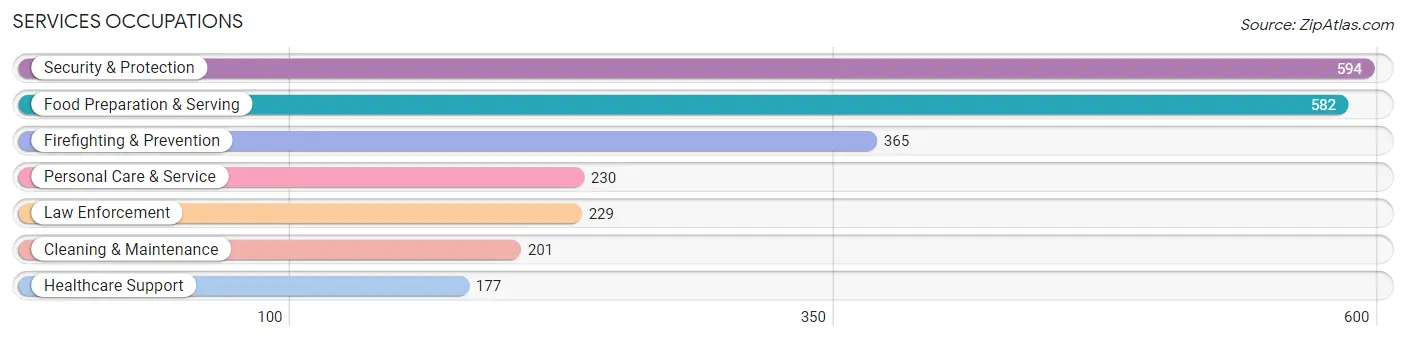
The most common Services occupations in Crofton are Security & Protection (594 | 3.9%), Food Preparation & Serving (582 | 3.8%), Firefighting & Prevention (365 | 2.4%), Personal Care & Service (230 | 1.5%), and Law Enforcement (229 | 1.5%).
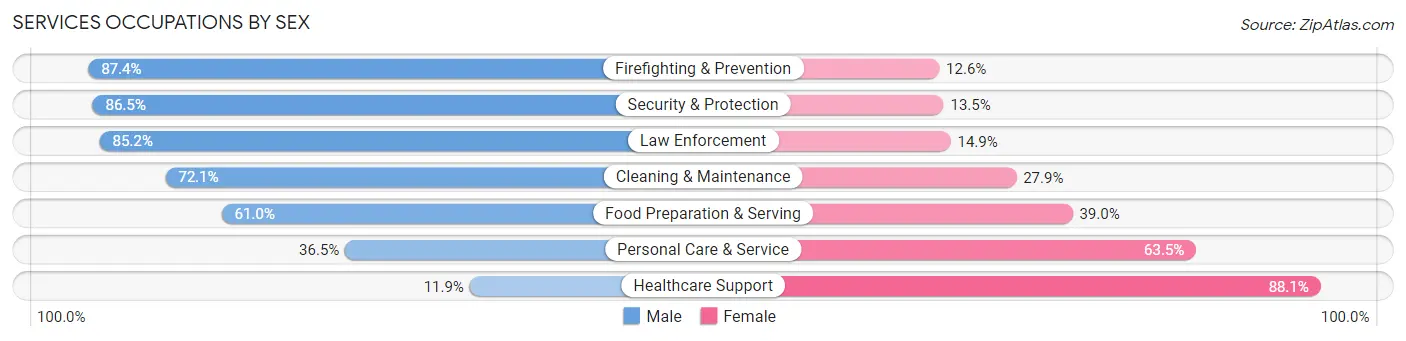
Services Occupations by Sex
Within the Services occupations in Crofton, the most male-oriented occupations are Firefighting & Prevention (87.4%), Security & Protection (86.5%), and Law Enforcement (85.2%), while the most female-oriented occupations are Healthcare Support (88.1%), Personal Care & Service (63.5%), and Food Preparation & Serving (39.0%).
| Occupation | Male | Female |
| Healthcare Support | 21 (11.9%) | 156 (88.1%) |
| Security & Protection | 514 (86.5%) | 80 (13.5%) |
| Firefighting & Prevention | 319 (87.4%) | 46 (12.6%) |
| Law Enforcement | 195 (85.2%) | 34 (14.8%) |
| Food Preparation & Serving | 355 (61.0%) | 227 (39.0%) |
| Cleaning & Maintenance | 145 (72.1%) | 56 (27.9%) |
| Personal Care & Service | 84 (36.5%) | 146 (63.5%) |
| Total (Category) | 1,119 (62.7%) | 665 (37.3%) |
| Total (Overall) | 7,882 (51.8%) | 7,319 (48.1%) |
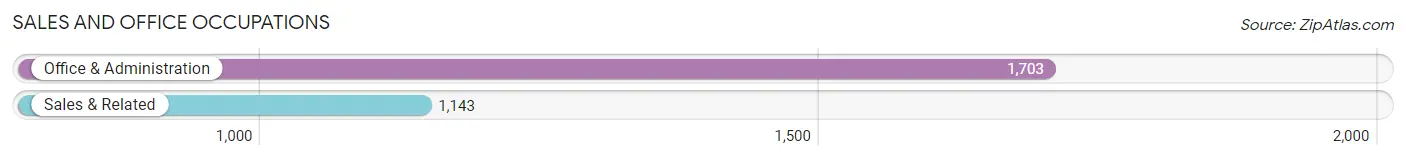
Sales and Office Occupations
The most common Sales and Office occupations in Crofton are Office & Administration (1,703 | 11.2%), and Sales & Related (1,143 | 7.5%).
Sales and Office Occupations by Sex
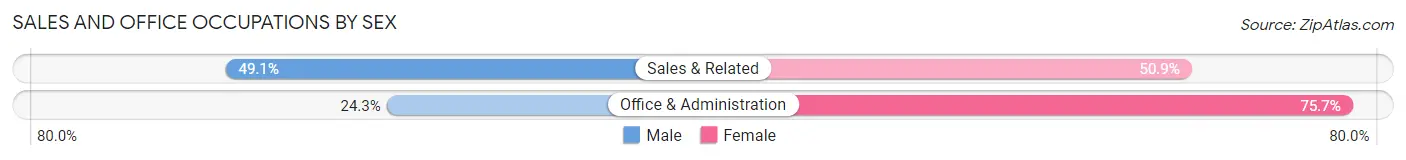
| Occupation | Male | Female |
| Sales & Related | 561 (49.1%) | 582 (50.9%) |
| Office & Administration | 414 (24.3%) | 1,289 (75.7%) |
| Total (Category) | 975 (34.3%) | 1,871 (65.7%) |
| Total (Overall) | 7,882 (51.8%) | 7,319 (48.1%) |
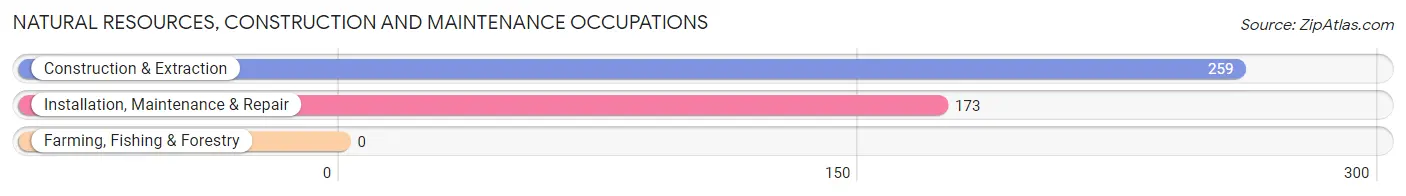
Natural Resources, Construction and Maintenance Occupations
The most common Natural Resources, Construction and Maintenance occupations in Crofton are Construction & Extraction (259 | 1.7%), and Installation, Maintenance & Repair (173 | 1.1%).
Natural Resources, Construction and Maintenance Occupations by Sex
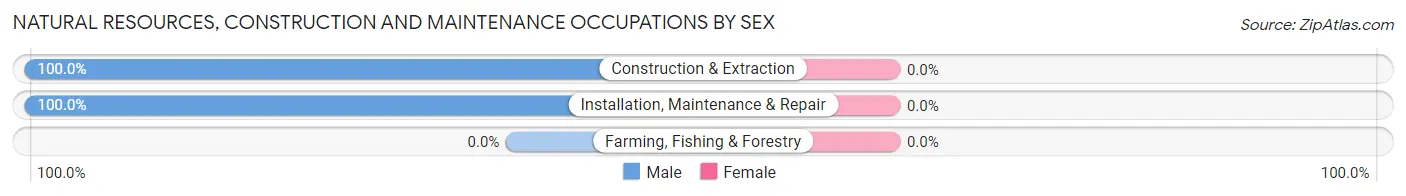
| Occupation | Male | Female |
| Farming, Fishing & Forestry | 0 (0.0%) | 0 (0.0%) |
| Construction & Extraction | 259 (100.0%) | 0 (0.0%) |
| Installation, Maintenance & Repair | 173 (100.0%) | 0 (0.0%) |
| Total (Category) | 432 (100.0%) | 0 (0.0%) |
| Total (Overall) | 7,882 (51.8%) | 7,319 (48.1%) |
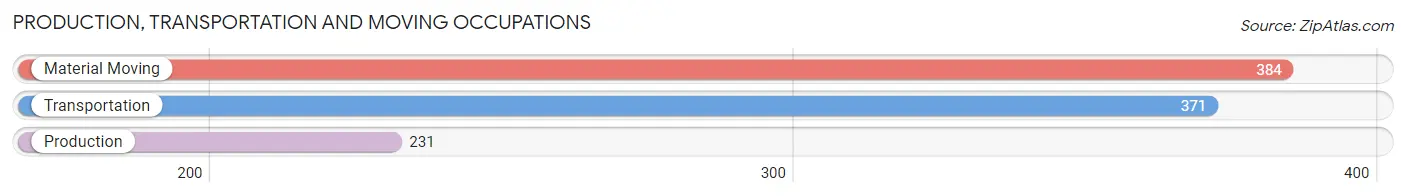
Production, Transportation and Moving Occupations
The most common Production, Transportation and Moving occupations in Crofton are Material Moving (384 | 2.5%), Transportation (371 | 2.4%), and Production (231 | 1.5%).
Production, Transportation and Moving Occupations by Sex
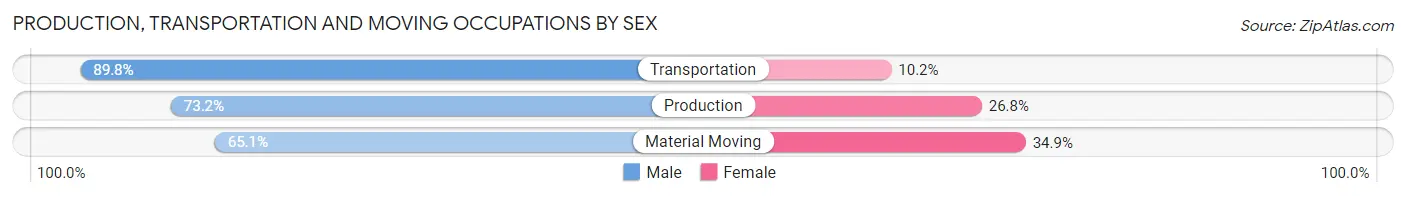
| Occupation | Male | Female |
| Production | 169 (73.2%) | 62 (26.8%) |
| Transportation | 333 (89.8%) | 38 (10.2%) |
| Material Moving | 250 (65.1%) | 134 (34.9%) |
| Total (Category) | 752 (76.3%) | 234 (23.7%) |
| Total (Overall) | 7,882 (51.8%) | 7,319 (48.1%) |
Employment Industries by Sex in Crofton
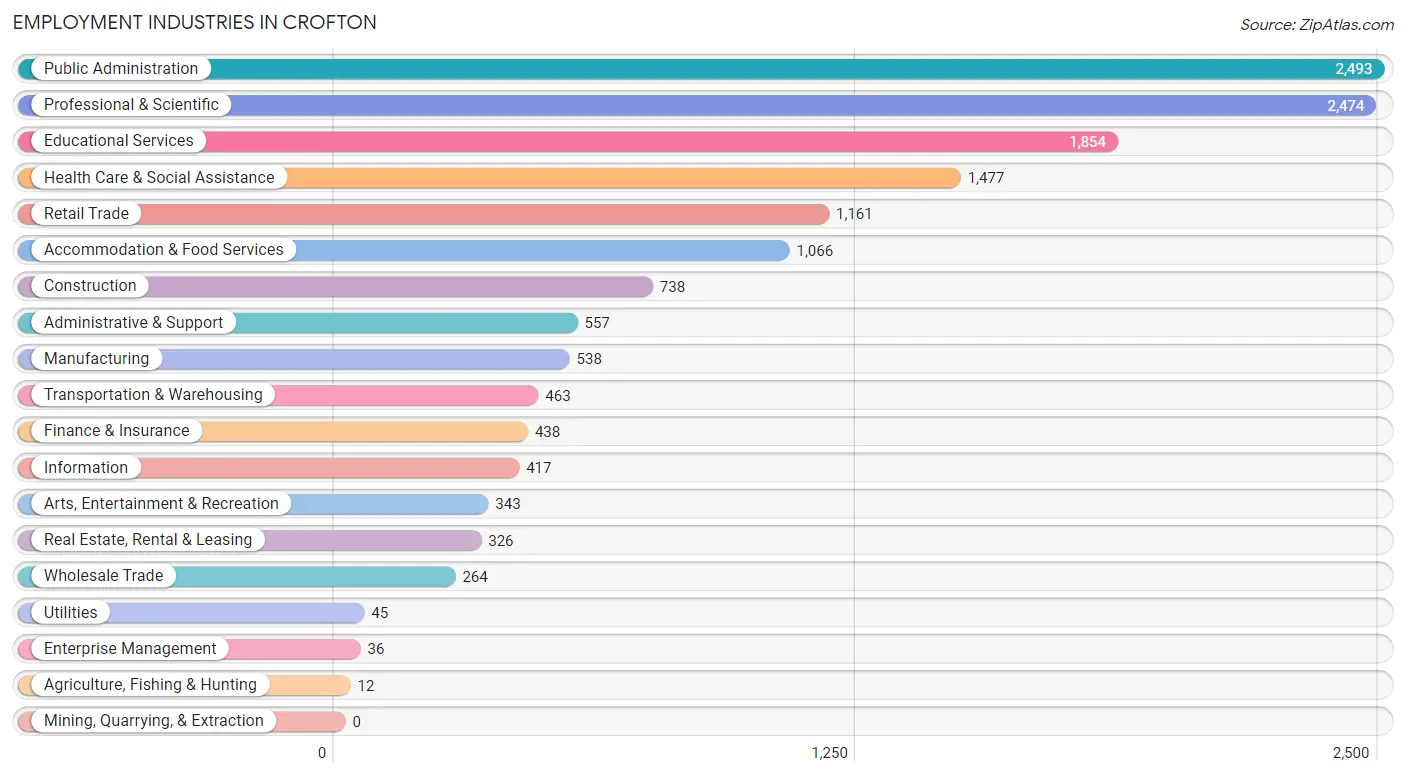
Employment Industries in Crofton
The major employment industries in Crofton include Public Administration (2,493 | 16.4%), Professional & Scientific (2,474 | 16.3%), Educational Services (1,854 | 12.2%), Health Care & Social Assistance (1,477 | 9.7%), and Retail Trade (1,161 | 7.6%).
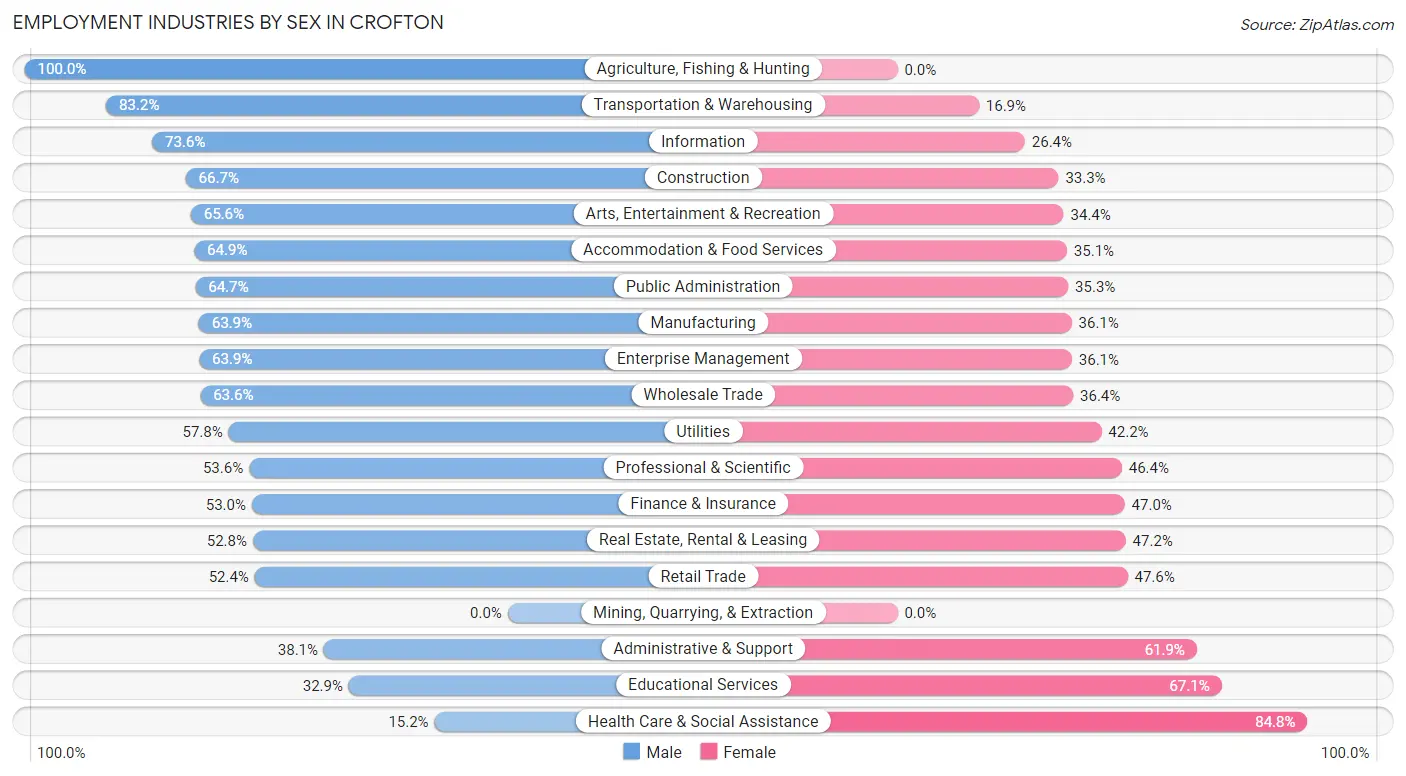
Employment Industries by Sex in Crofton
The Crofton industries that see more men than women are Agriculture, Fishing & Hunting (100.0%), Transportation & Warehousing (83.2%), and Information (73.6%), whereas the industries that tend to have a higher number of women are Health Care & Social Assistance (84.8%), Educational Services (67.1%), and Administrative & Support (61.9%).
| Industry | Male | Female |
| Agriculture, Fishing & Hunting | 12 (100.0%) | 0 (0.0%) |
| Mining, Quarrying, & Extraction | 0 (0.0%) | 0 (0.0%) |
| Construction | 492 (66.7%) | 246 (33.3%) |
| Manufacturing | 344 (63.9%) | 194 (36.1%) |
| Wholesale Trade | 168 (63.6%) | 96 (36.4%) |
| Retail Trade | 608 (52.4%) | 553 (47.6%) |
| Transportation & Warehousing | 385 (83.2%) | 78 (16.9%) |
| Utilities | 26 (57.8%) | 19 (42.2%) |
| Information | 307 (73.6%) | 110 (26.4%) |
| Finance & Insurance | 232 (53.0%) | 206 (47.0%) |
| Real Estate, Rental & Leasing | 172 (52.8%) | 154 (47.2%) |
| Professional & Scientific | 1,325 (53.6%) | 1,149 (46.4%) |
| Enterprise Management | 23 (63.9%) | 13 (36.1%) |
| Administrative & Support | 212 (38.1%) | 345 (61.9%) |
| Educational Services | 610 (32.9%) | 1,244 (67.1%) |
| Health Care & Social Assistance | 224 (15.2%) | 1,253 (84.8%) |
| Arts, Entertainment & Recreation | 225 (65.6%) | 118 (34.4%) |
| Accommodation & Food Services | 692 (64.9%) | 374 (35.1%) |
| Public Administration | 1,612 (64.7%) | 881 (35.3%) |
| Total | 7,882 (51.8%) | 7,319 (48.1%) |
Education in Crofton
School Enrollment in Crofton
The most common levels of schooling among the 9,069 students in Crofton are middle school (2,255 | 24.9%), elementary school (1,815 | 20.0%), and high school (1,586 | 17.5%).
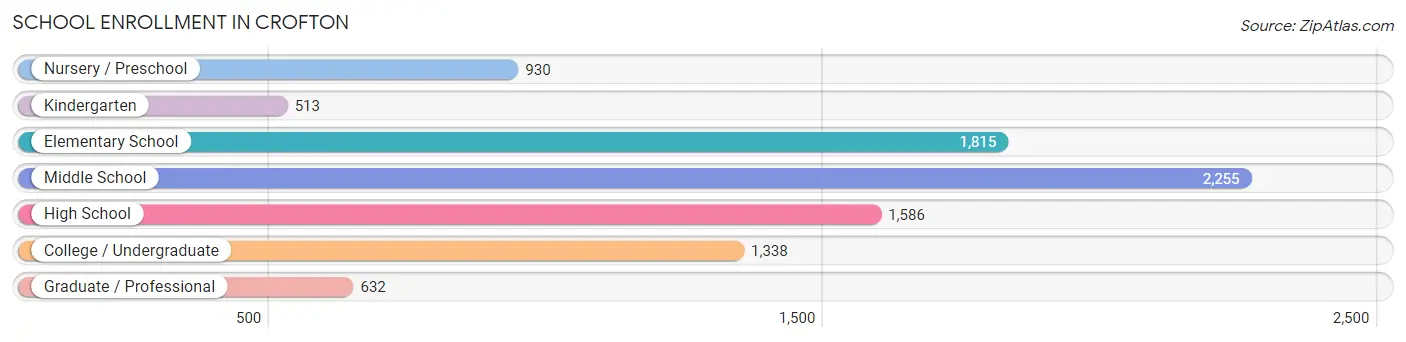
| School Level | # Students | % Students |
| Nursery / Preschool | 930 | 10.2% |
| Kindergarten | 513 | 5.7% |
| Elementary School | 1,815 | 20.0% |
| Middle School | 2,255 | 24.9% |
| High School | 1,586 | 17.5% |
| College / Undergraduate | 1,338 | 14.7% |
| Graduate / Professional | 632 | 7.0% |
| Total | 9,069 | 100.0% |
School Enrollment by Age by Funding Source in Crofton
Out of a total of 9,069 students who are enrolled in schools in Crofton, 1,859 (20.5%) attend a private institution, while the remaining 7,210 (79.5%) are enrolled in public schools. The age group of 3 to 4 year olds has the highest likelihood of being enrolled in private schools, with 327 (48.2% in the age bracket) enrolled. Conversely, the age group of 20 to 24 year olds has the lowest likelihood of being enrolled in a private school, with 678 (96.6% in the age bracket) attending a public institution.
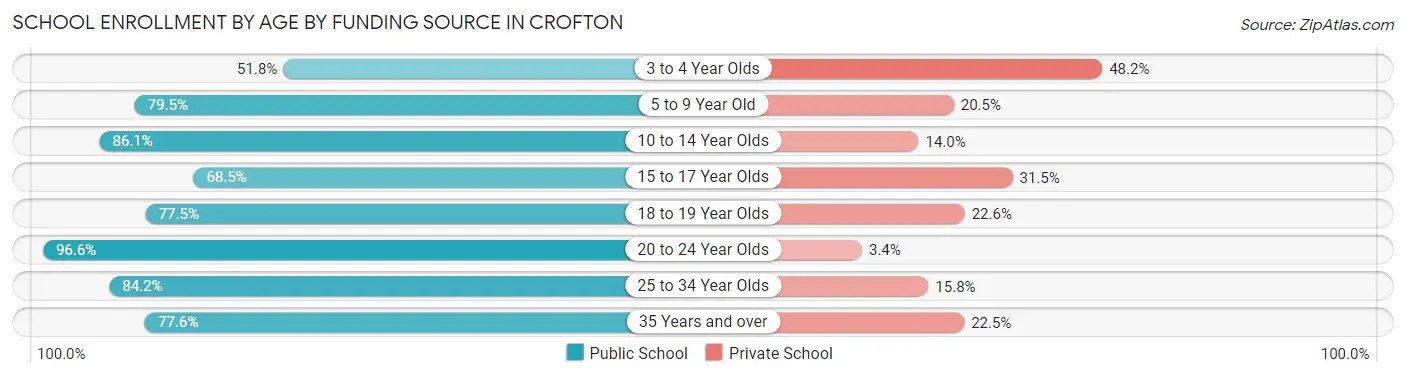
| Age Bracket | Public School | Private School |
| 3 to 4 Year Olds | 352 (51.8%) | 327 (48.2%) |
| 5 to 9 Year Old | 1,775 (79.5%) | 458 (20.5%) |
| 10 to 14 Year Olds | 2,436 (86.1%) | 395 (14.0%) |
| 15 to 17 Year Olds | 780 (68.5%) | 358 (31.5%) |
| 18 to 19 Year Olds | 371 (77.4%) | 108 (22.6%) |
| 20 to 24 Year Olds | 678 (96.6%) | 24 (3.4%) |
| 25 to 34 Year Olds | 443 (84.2%) | 83 (15.8%) |
| 35 Years and over | 373 (77.5%) | 108 (22.5%) |
| Total | 7,210 (79.5%) | 1,859 (20.5%) |
Educational Attainment by Field of Study in Crofton
Business (2,058 | 16.6%), social sciences (1,471 | 11.9%), education (1,231 | 9.9%), science & technology (1,129 | 9.1%), and engineering (993 | 8.0%) are the most common fields of study among 12,382 individuals in Crofton who have obtained a bachelor's degree or higher.
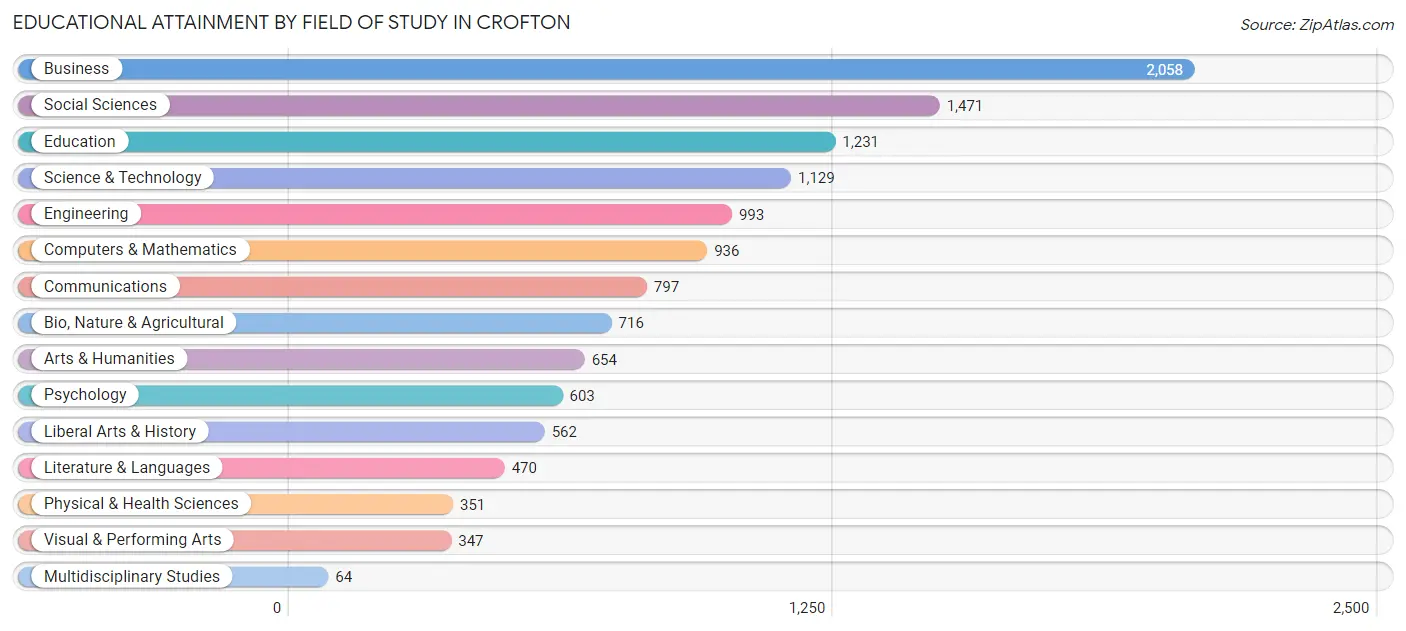
| Field of Study | # Graduates | % Graduates |
| Computers & Mathematics | 936 | 7.6% |
| Bio, Nature & Agricultural | 716 | 5.8% |
| Physical & Health Sciences | 351 | 2.8% |
| Psychology | 603 | 4.9% |
| Social Sciences | 1,471 | 11.9% |
| Engineering | 993 | 8.0% |
| Multidisciplinary Studies | 64 | 0.5% |
| Science & Technology | 1,129 | 9.1% |
| Business | 2,058 | 16.6% |
| Education | 1,231 | 9.9% |
| Literature & Languages | 470 | 3.8% |
| Liberal Arts & History | 562 | 4.5% |
| Visual & Performing Arts | 347 | 2.8% |
| Communications | 797 | 6.4% |
| Arts & Humanities | 654 | 5.3% |
| Total | 12,382 | 100.0% |
Transportation & Commute in Crofton
Vehicle Availability by Sex in Crofton
The most prevalent vehicle ownership categories in Crofton are males with 2 vehicles (3,891, accounting for 48.2%) and females with 2 vehicles (3,131, making up 53.6%).
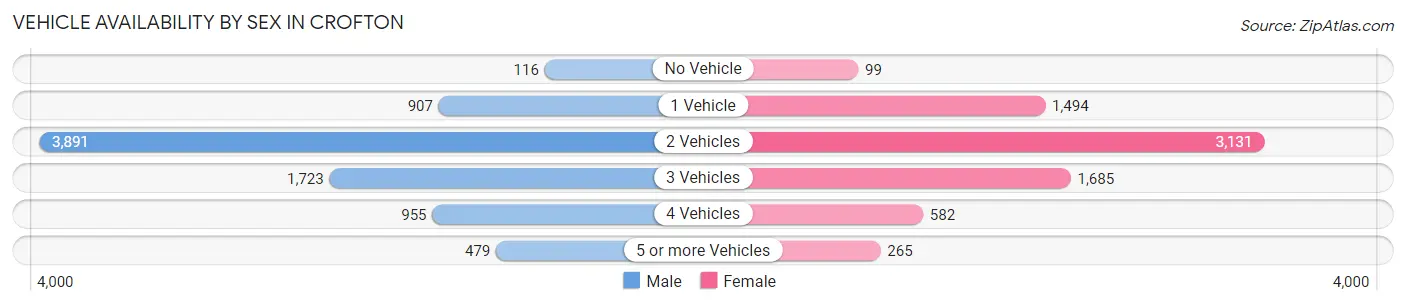
| Vehicles Available | Male | Female |
| No Vehicle | 116 (1.4%) | 99 (1.4%) |
| 1 Vehicle | 907 (11.2%) | 1,494 (20.6%) |
| 2 Vehicles | 3,891 (48.2%) | 3,131 (43.1%) |
| 3 Vehicles | 1,723 (21.3%) | 1,685 (23.2%) |
| 4 Vehicles | 955 (11.8%) | 582 (8.0%) |
| 5 or more Vehicles | 479 (5.9%) | 265 (3.6%) |
| Total | 8,071 (100.0%) | 7,256 (100.0%) |
Commute Time in Crofton
The most frequently occuring commute durations in Crofton are 30 to 34 minutes (1,954 commuters, 15.2%), 20 to 24 minutes (1,656 commuters, 12.9%), and 60 to 89 minutes (1,641 commuters, 12.7%).
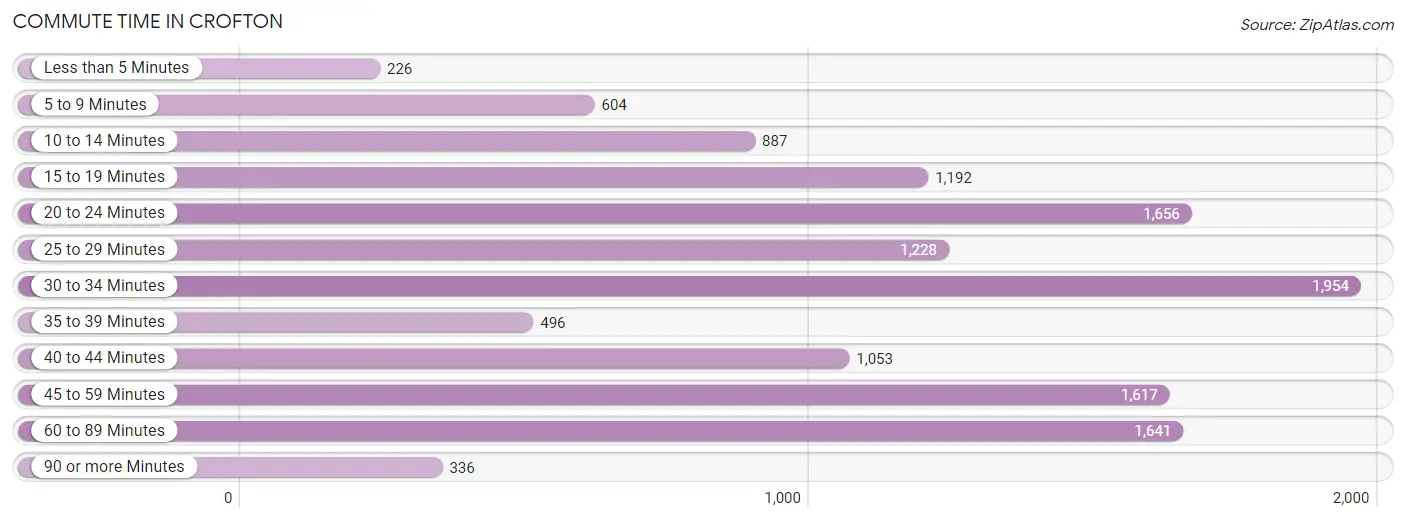
| Commute Time | # Commuters | % Commuters |
| Less than 5 Minutes | 226 | 1.8% |
| 5 to 9 Minutes | 604 | 4.7% |
| 10 to 14 Minutes | 887 | 6.9% |
| 15 to 19 Minutes | 1,192 | 9.2% |
| 20 to 24 Minutes | 1,656 | 12.9% |
| 25 to 29 Minutes | 1,228 | 9.5% |
| 30 to 34 Minutes | 1,954 | 15.2% |
| 35 to 39 Minutes | 496 | 3.8% |
| 40 to 44 Minutes | 1,053 | 8.2% |
| 45 to 59 Minutes | 1,617 | 12.5% |
| 60 to 89 Minutes | 1,641 | 12.7% |
| 90 or more Minutes | 336 | 2.6% |
Commute Time by Sex in Crofton
The most common commute times in Crofton are 60 to 89 minutes (995 commuters, 14.4%) for males and 30 to 34 minutes (1,047 commuters, 17.4%) for females.
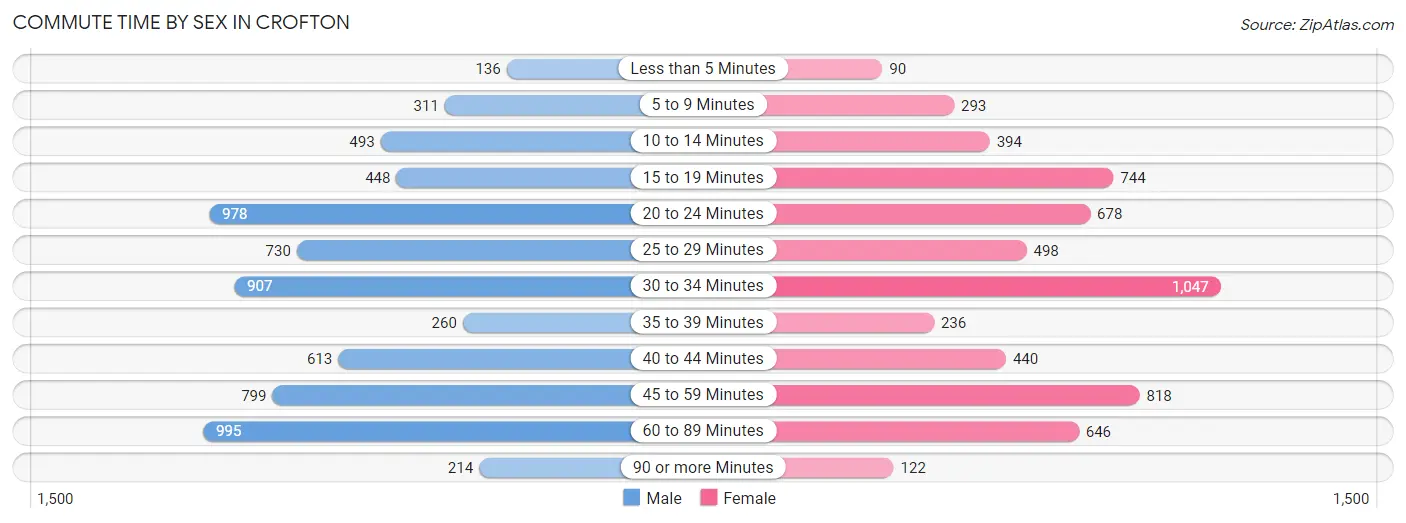
| Commute Time | Male | Female |
| Less than 5 Minutes | 136 (2.0%) | 90 (1.5%) |
| 5 to 9 Minutes | 311 (4.5%) | 293 (4.9%) |
| 10 to 14 Minutes | 493 (7.2%) | 394 (6.6%) |
| 15 to 19 Minutes | 448 (6.5%) | 744 (12.4%) |
| 20 to 24 Minutes | 978 (14.2%) | 678 (11.3%) |
| 25 to 29 Minutes | 730 (10.6%) | 498 (8.3%) |
| 30 to 34 Minutes | 907 (13.2%) | 1,047 (17.4%) |
| 35 to 39 Minutes | 260 (3.8%) | 236 (3.9%) |
| 40 to 44 Minutes | 613 (8.9%) | 440 (7.3%) |
| 45 to 59 Minutes | 799 (11.6%) | 818 (13.6%) |
| 60 to 89 Minutes | 995 (14.4%) | 646 (10.8%) |
| 90 or more Minutes | 214 (3.1%) | 122 (2.0%) |
Time of Departure to Work by Sex in Crofton
The most frequent times of departure to work in Crofton are 7:00 AM to 7:29 AM (943, 13.7%) for males and 7:00 AM to 7:29 AM (1,048, 17.4%) for females.
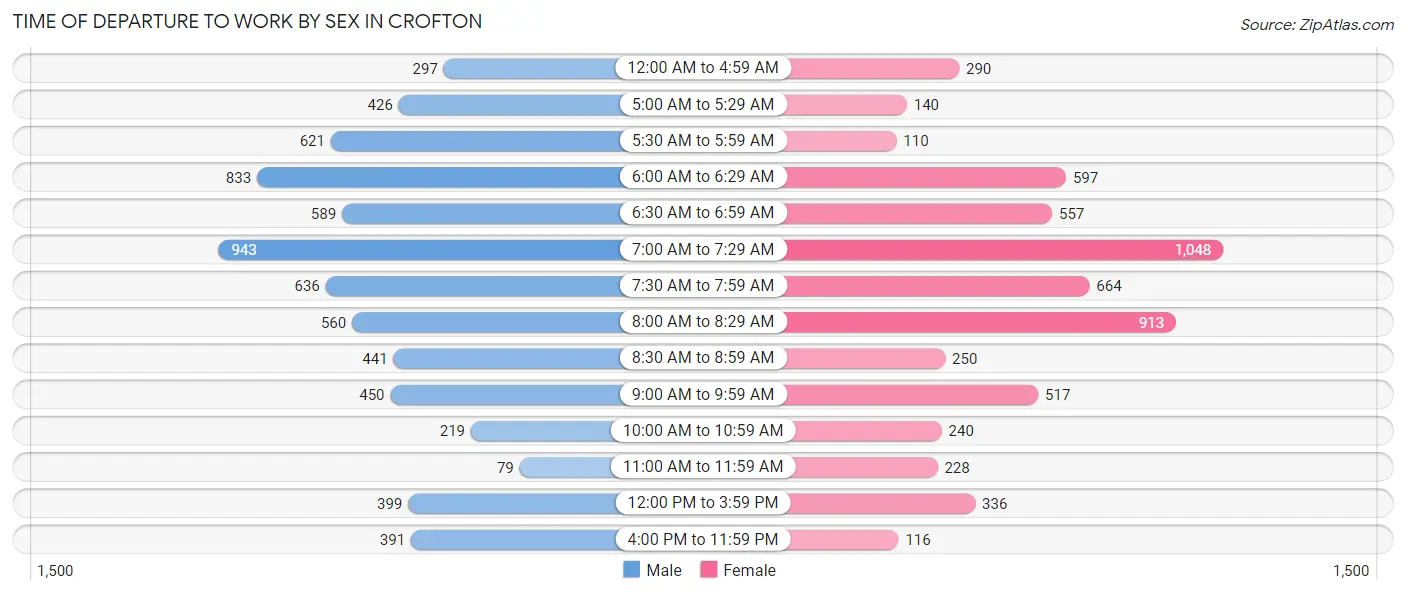
| Time of Departure | Male | Female |
| 12:00 AM to 4:59 AM | 297 (4.3%) | 290 (4.8%) |
| 5:00 AM to 5:29 AM | 426 (6.2%) | 140 (2.3%) |
| 5:30 AM to 5:59 AM | 621 (9.0%) | 110 (1.8%) |
| 6:00 AM to 6:29 AM | 833 (12.1%) | 597 (9.9%) |
| 6:30 AM to 6:59 AM | 589 (8.6%) | 557 (9.3%) |
| 7:00 AM to 7:29 AM | 943 (13.7%) | 1,048 (17.4%) |
| 7:30 AM to 7:59 AM | 636 (9.2%) | 664 (11.1%) |
| 8:00 AM to 8:29 AM | 560 (8.1%) | 913 (15.2%) |
| 8:30 AM to 8:59 AM | 441 (6.4%) | 250 (4.2%) |
| 9:00 AM to 9:59 AM | 450 (6.5%) | 517 (8.6%) |
| 10:00 AM to 10:59 AM | 219 (3.2%) | 240 (4.0%) |
| 11:00 AM to 11:59 AM | 79 (1.1%) | 228 (3.8%) |
| 12:00 PM to 3:59 PM | 399 (5.8%) | 336 (5.6%) |
| 4:00 PM to 11:59 PM | 391 (5.7%) | 116 (1.9%) |
| Total | 6,884 (100.0%) | 6,006 (100.0%) |
Housing Occupancy in Crofton
Occupancy by Ownership in Crofton
Of the total 10,467 dwellings in Crofton, owner-occupied units account for 8,495 (81.2%), while renter-occupied units make up 1,972 (18.8%).
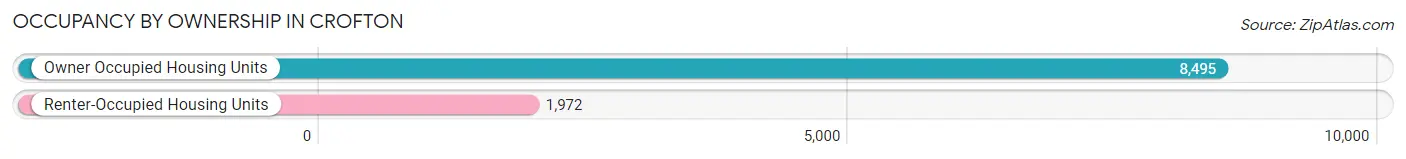
| Occupancy | # Housing Units | % Housing Units |
| Owner Occupied Housing Units | 8,495 | 81.2% |
| Renter-Occupied Housing Units | 1,972 | 18.8% |
| Total Occupied Housing Units | 10,467 | 100.0% |
Occupancy by Household Size in Crofton
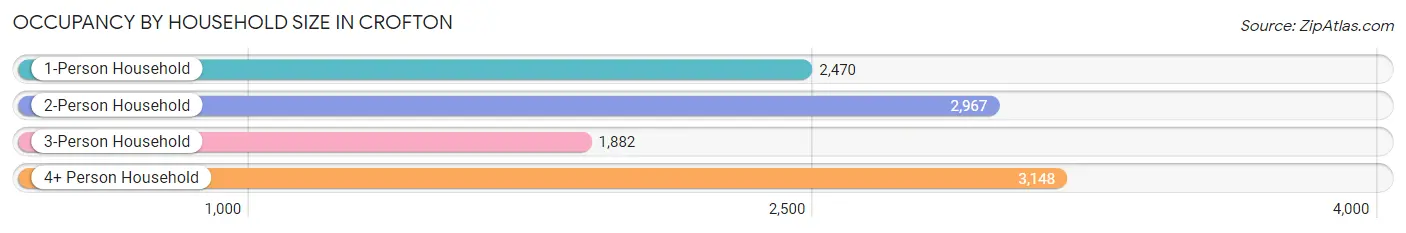
| Household Size | # Housing Units | % Housing Units |
| 1-Person Household | 2,470 | 23.6% |
| 2-Person Household | 2,967 | 28.3% |
| 3-Person Household | 1,882 | 18.0% |
| 4+ Person Household | 3,148 | 30.1% |
| Total Housing Units | 10,467 | 100.0% |
Occupancy by Ownership by Household Size in Crofton
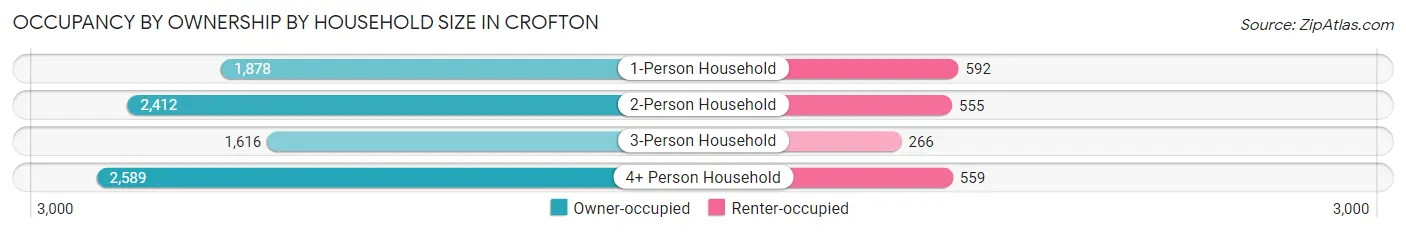
| Household Size | Owner-occupied | Renter-occupied |
| 1-Person Household | 1,878 (76.0%) | 592 (24.0%) |
| 2-Person Household | 2,412 (81.3%) | 555 (18.7%) |
| 3-Person Household | 1,616 (85.9%) | 266 (14.1%) |
| 4+ Person Household | 2,589 (82.2%) | 559 (17.8%) |
| Total Housing Units | 8,495 (81.2%) | 1,972 (18.8%) |
Occupancy by Educational Attainment in Crofton
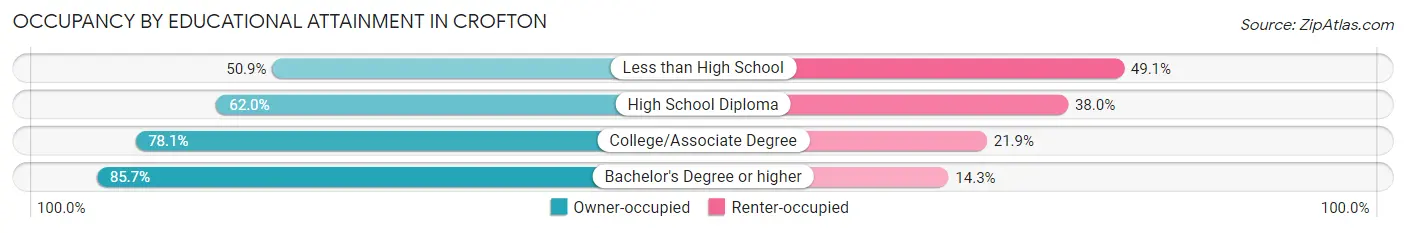
| Household Size | Owner-occupied | Renter-occupied |
| Less than High School | 86 (50.9%) | 83 (49.1%) |
| High School Diploma | 590 (62.0%) | 362 (38.0%) |
| College/Associate Degree | 1,933 (78.1%) | 543 (21.9%) |
| Bachelor's Degree or higher | 5,886 (85.7%) | 984 (14.3%) |
Occupancy by Age of Householder in Crofton
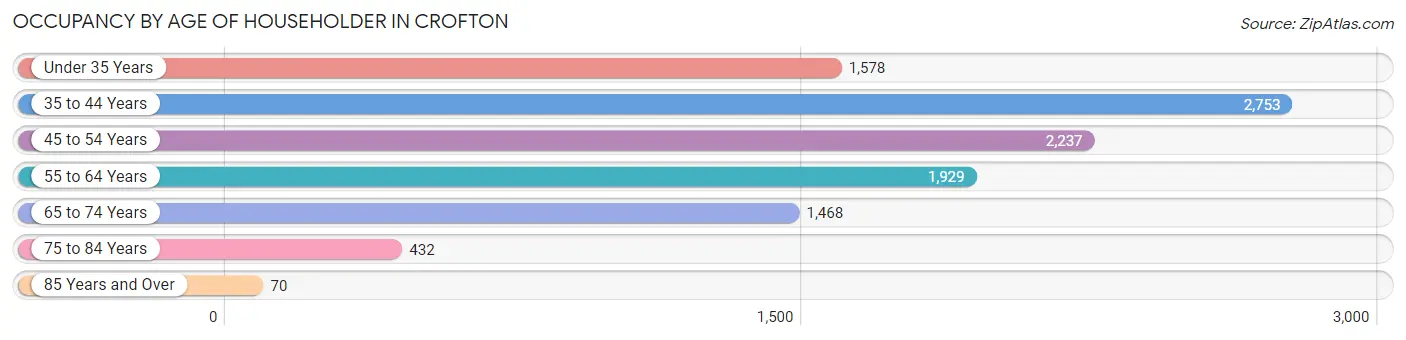
| Age Bracket | # Households | % Households |
| Under 35 Years | 1,578 | 15.1% |
| 35 to 44 Years | 2,753 | 26.3% |
| 45 to 54 Years | 2,237 | 21.4% |
| 55 to 64 Years | 1,929 | 18.4% |
| 65 to 74 Years | 1,468 | 14.0% |
| 75 to 84 Years | 432 | 4.1% |
| 85 Years and Over | 70 | 0.7% |
| Total | 10,467 | 100.0% |
Housing Finances in Crofton
Median Income by Occupancy in Crofton
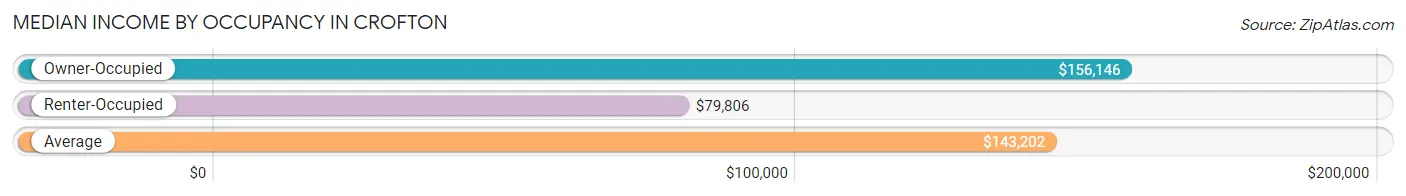
| Occupancy Type | # Households | Median Income |
| Owner-Occupied | 8,495 (81.2%) | $156,146 |
| Renter-Occupied | 1,972 (18.8%) | $79,806 |
| Average | 10,467 (100.0%) | $143,202 |
Occupancy by Householder Income Bracket in Crofton
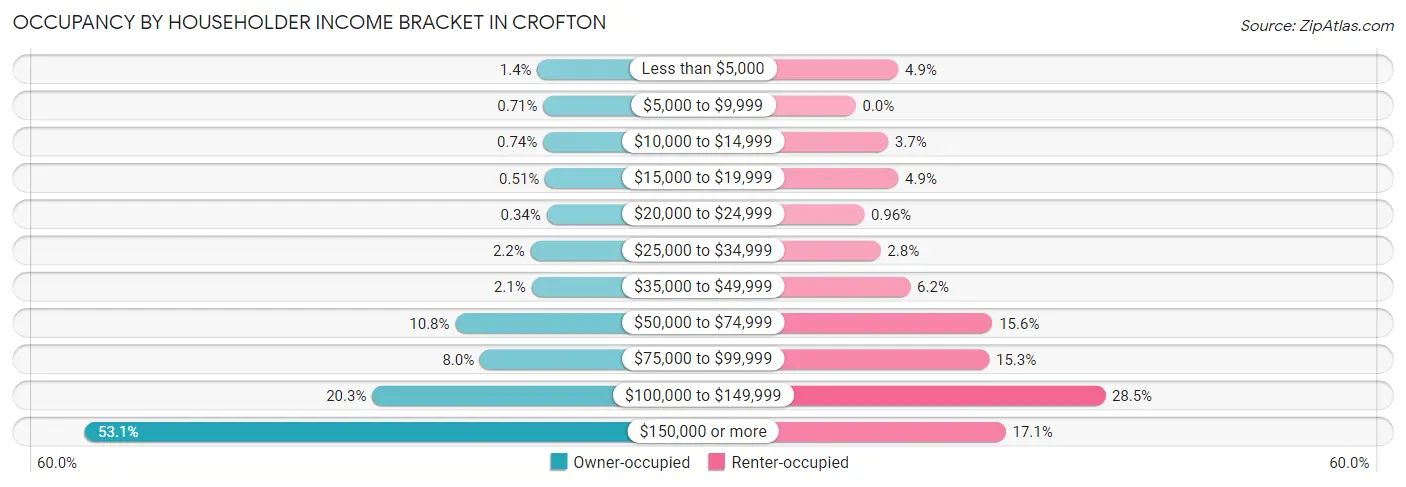
| Income Bracket | Owner-occupied | Renter-occupied |
| Less than $5,000 | 118 (1.4%) | 96 (4.9%) |
| $5,000 to $9,999 | 60 (0.7%) | 0 (0.0%) |
| $10,000 to $14,999 | 63 (0.7%) | 73 (3.7%) |
| $15,000 to $19,999 | 43 (0.5%) | 96 (4.9%) |
| $20,000 to $24,999 | 29 (0.3%) | 19 (1.0%) |
| $25,000 to $34,999 | 185 (2.2%) | 56 (2.8%) |
| $35,000 to $49,999 | 175 (2.1%) | 123 (6.2%) |
| $50,000 to $74,999 | 915 (10.8%) | 308 (15.6%) |
| $75,000 to $99,999 | 675 (8.0%) | 301 (15.3%) |
| $100,000 to $149,999 | 1,722 (20.3%) | 562 (28.5%) |
| $150,000 or more | 4,510 (53.1%) | 338 (17.1%) |
| Total | 8,495 (100.0%) | 1,972 (100.0%) |
Monthly Housing Cost Tiers in Crofton
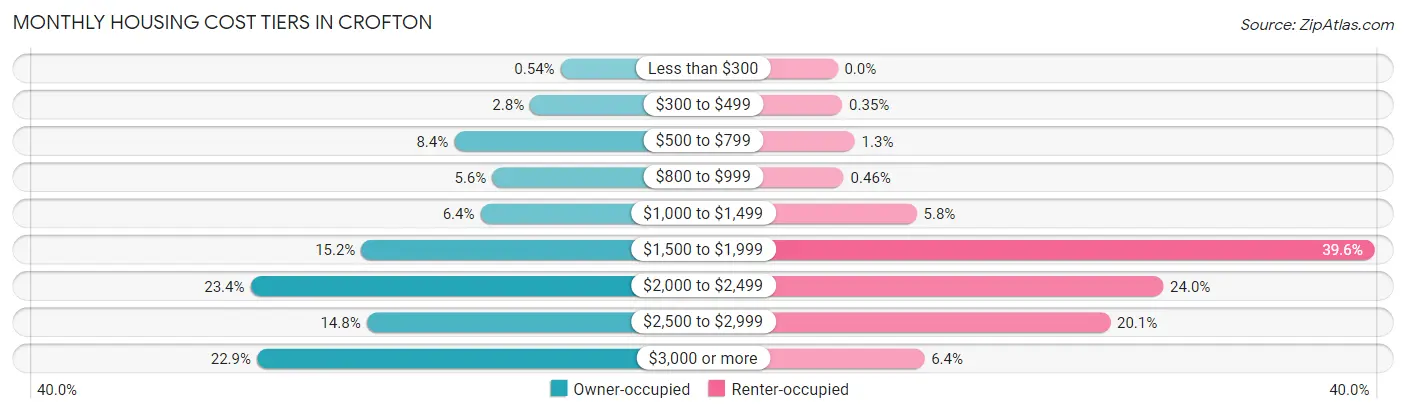
| Monthly Cost | Owner-occupied | Renter-occupied |
| Less than $300 | 46 (0.5%) | 0 (0.0%) |
| $300 to $499 | 236 (2.8%) | 7 (0.4%) |
| $500 to $799 | 711 (8.4%) | 25 (1.3%) |
| $800 to $999 | 473 (5.6%) | 9 (0.5%) |
| $1,000 to $1,499 | 547 (6.4%) | 115 (5.8%) |
| $1,500 to $1,999 | 1,292 (15.2%) | 780 (39.6%) |
| $2,000 to $2,499 | 1,986 (23.4%) | 473 (24.0%) |
| $2,500 to $2,999 | 1,259 (14.8%) | 396 (20.1%) |
| $3,000 or more | 1,945 (22.9%) | 126 (6.4%) |
| Total | 8,495 (100.0%) | 1,972 (100.0%) |
Physical Housing Characteristics in Crofton
Housing Structures in Crofton
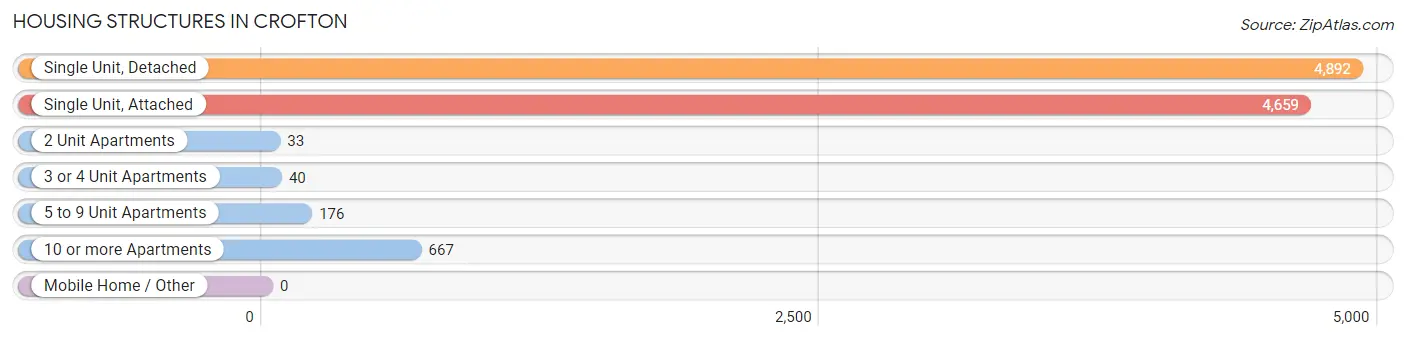
| Structure Type | # Housing Units | % Housing Units |
| Single Unit, Detached | 4,892 | 46.7% |
| Single Unit, Attached | 4,659 | 44.5% |
| 2 Unit Apartments | 33 | 0.3% |
| 3 or 4 Unit Apartments | 40 | 0.4% |
| 5 to 9 Unit Apartments | 176 | 1.7% |
| 10 or more Apartments | 667 | 6.4% |
| Mobile Home / Other | 0 | 0.0% |
| Total | 10,467 | 100.0% |
Housing Structures by Occupancy in Crofton
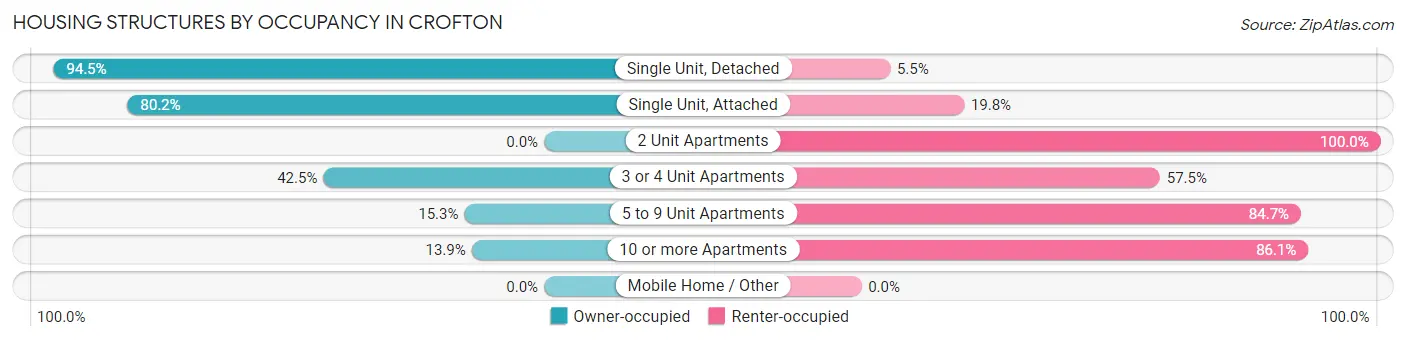
| Structure Type | Owner-occupied | Renter-occupied |
| Single Unit, Detached | 4,621 (94.5%) | 271 (5.5%) |
| Single Unit, Attached | 3,737 (80.2%) | 922 (19.8%) |
| 2 Unit Apartments | 0 (0.0%) | 33 (100.0%) |
| 3 or 4 Unit Apartments | 17 (42.5%) | 23 (57.5%) |
| 5 to 9 Unit Apartments | 27 (15.3%) | 149 (84.7%) |
| 10 or more Apartments | 93 (13.9%) | 574 (86.1%) |
| Mobile Home / Other | 0 (0.0%) | 0 (0.0%) |
| Total | 8,495 (81.2%) | 1,972 (18.8%) |
Housing Structures by Number of Rooms in Crofton
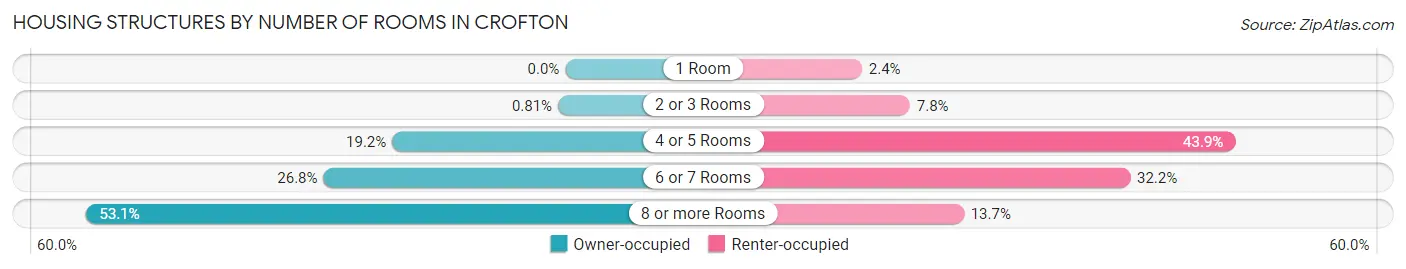
| Number of Rooms | Owner-occupied | Renter-occupied |
| 1 Room | 0 (0.0%) | 48 (2.4%) |
| 2 or 3 Rooms | 69 (0.8%) | 153 (7.8%) |
| 4 or 5 Rooms | 1,632 (19.2%) | 865 (43.9%) |
| 6 or 7 Rooms | 2,280 (26.8%) | 635 (32.2%) |
| 8 or more Rooms | 4,514 (53.1%) | 271 (13.7%) |
| Total | 8,495 (100.0%) | 1,972 (100.0%) |
Housing Structure by Heating Type in Crofton
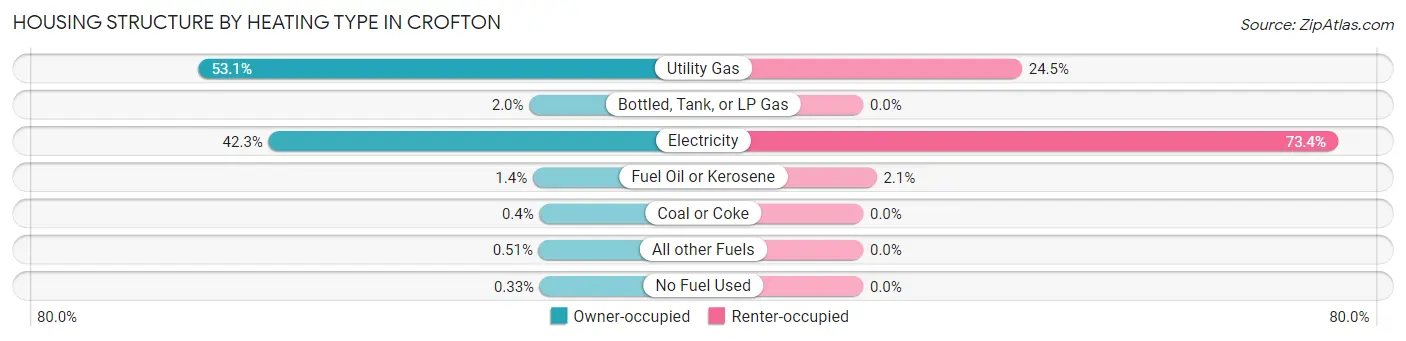
| Heating Type | Owner-occupied | Renter-occupied |
| Utility Gas | 4,512 (53.1%) | 484 (24.5%) |
| Bottled, Tank, or LP Gas | 167 (2.0%) | 0 (0.0%) |
| Electricity | 3,591 (42.3%) | 1,447 (73.4%) |
| Fuel Oil or Kerosene | 120 (1.4%) | 41 (2.1%) |
| Coal or Coke | 34 (0.4%) | 0 (0.0%) |
| All other Fuels | 43 (0.5%) | 0 (0.0%) |
| No Fuel Used | 28 (0.3%) | 0 (0.0%) |
| Total | 8,495 (100.0%) | 1,972 (100.0%) |
Household Vehicle Usage in Crofton
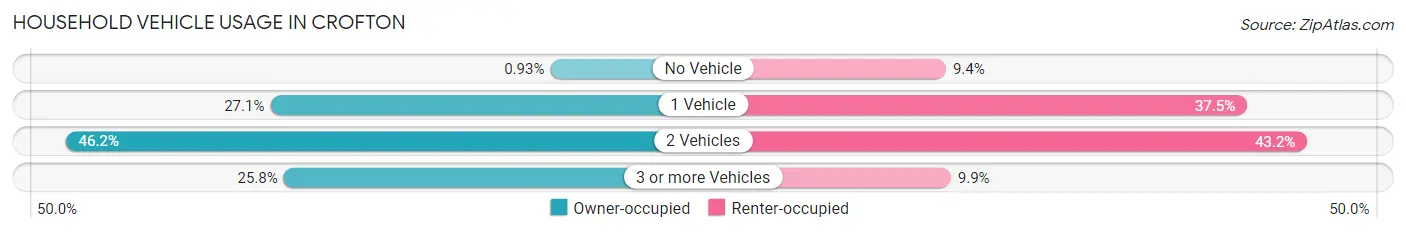
| Vehicles per Household | Owner-occupied | Renter-occupied |
| No Vehicle | 79 (0.9%) | 186 (9.4%) |
| 1 Vehicle | 2,300 (27.1%) | 740 (37.5%) |
| 2 Vehicles | 3,922 (46.2%) | 851 (43.1%) |
| 3 or more Vehicles | 2,194 (25.8%) | 195 (9.9%) |
| Total | 8,495 (100.0%) | 1,972 (100.0%) |
Real Estate & Mortgages in Crofton
Real Estate and Mortgage Overview in Crofton
| Characteristic | Without Mortgage | With Mortgage |
| Housing Units | 1,464 | 7,031 |
| Median Property Value | $536,800 | $471,300 |
| Median Household Income | $116,250 | $3,941 |
| Monthly Housing Costs | $750 | $1,945 |
| Real Estate Taxes | $4,068 | $70 |
Property Value by Mortgage Status in Crofton
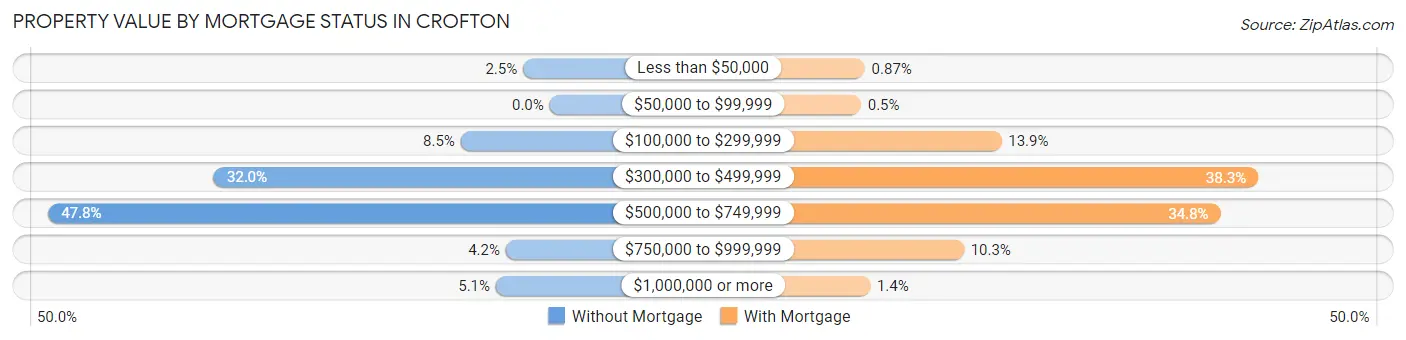
| Property Value | Without Mortgage | With Mortgage |
| Less than $50,000 | 37 (2.5%) | 61 (0.9%) |
| $50,000 to $99,999 | 0 (0.0%) | 35 (0.5%) |
| $100,000 to $299,999 | 124 (8.5%) | 976 (13.9%) |
| $300,000 to $499,999 | 468 (32.0%) | 2,696 (38.3%) |
| $500,000 to $749,999 | 699 (47.7%) | 2,443 (34.7%) |
| $750,000 to $999,999 | 61 (4.2%) | 724 (10.3%) |
| $1,000,000 or more | 75 (5.1%) | 96 (1.4%) |
| Total | 1,464 (100.0%) | 7,031 (100.0%) |
Household Income by Mortgage Status in Crofton
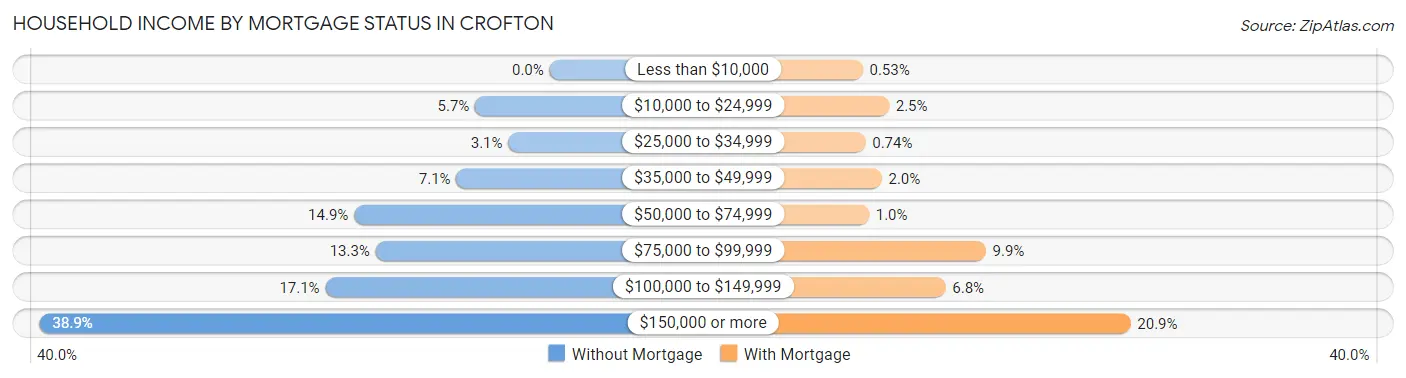
| Household Income | Without Mortgage | With Mortgage |
| Less than $10,000 | 0 (0.0%) | 37 (0.5%) |
| $10,000 to $24,999 | 83 (5.7%) | 178 (2.5%) |
| $25,000 to $34,999 | 46 (3.1%) | 52 (0.7%) |
| $35,000 to $49,999 | 104 (7.1%) | 139 (2.0%) |
| $50,000 to $74,999 | 218 (14.9%) | 71 (1.0%) |
| $75,000 to $99,999 | 194 (13.3%) | 697 (9.9%) |
| $100,000 to $149,999 | 250 (17.1%) | 481 (6.8%) |
| $150,000 or more | 569 (38.9%) | 1,472 (20.9%) |
| Total | 1,464 (100.0%) | 7,031 (100.0%) |
Property Value to Household Income Ratio in Crofton
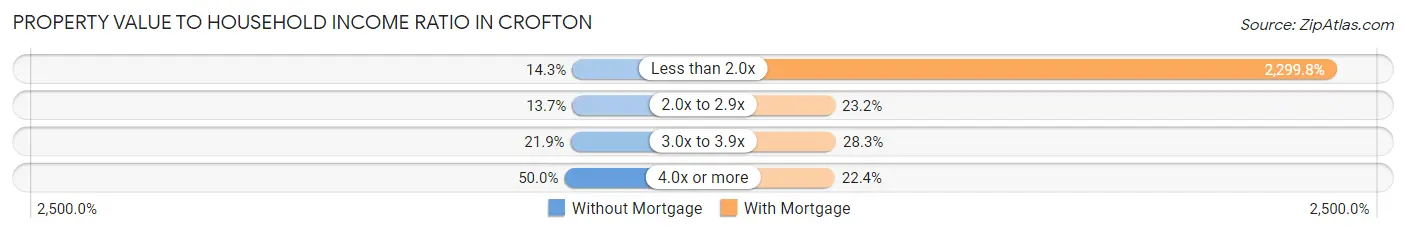
| Value-to-Income Ratio | Without Mortgage | With Mortgage |
| Less than 2.0x | 210 (14.3%) | 161,702 (2,299.8%) |
| 2.0x to 2.9x | 201 (13.7%) | 1,633 (23.2%) |
| 3.0x to 3.9x | 321 (21.9%) | 1,988 (28.3%) |
| 4.0x or more | 732 (50.0%) | 1,578 (22.4%) |
| Total | 1,464 (100.0%) | 7,031 (100.0%) |
Real Estate Taxes by Mortgage Status in Crofton
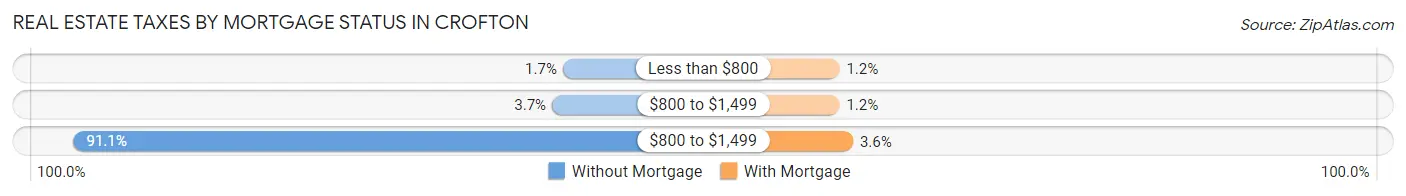
| Property Taxes | Without Mortgage | With Mortgage |
| Less than $800 | 25 (1.7%) | 82 (1.2%) |
| $800 to $1,499 | 54 (3.7%) | 83 (1.2%) |
| $800 to $1,499 | 1,333 (91.0%) | 256 (3.6%) |
| Total | 1,464 (100.0%) | 7,031 (100.0%) |
Health & Disability in Crofton
Health Insurance Coverage by Age in Crofton
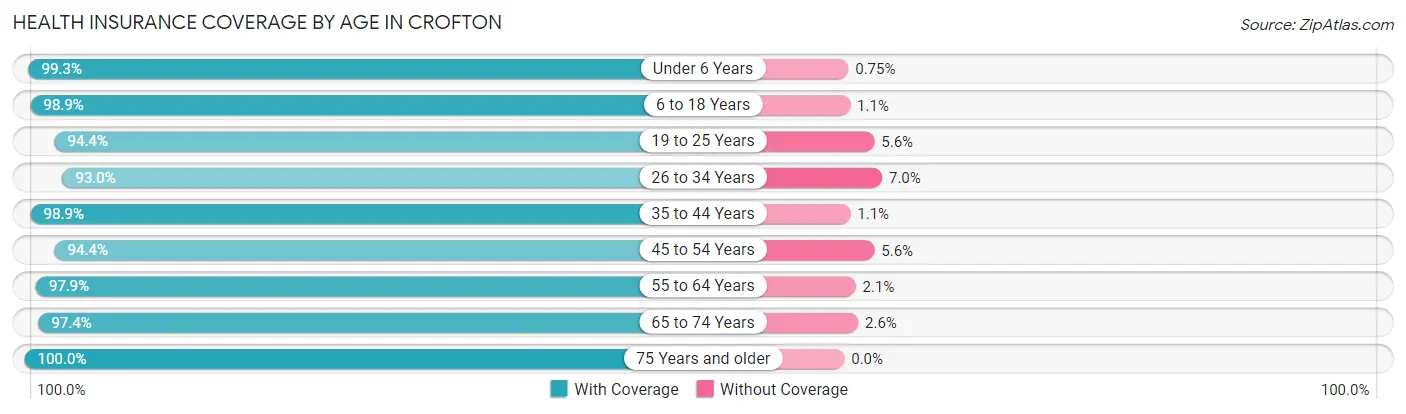
| Age Bracket | With Coverage | Without Coverage |
| Under 6 Years | 2,512 (99.3%) | 19 (0.7%) |
| 6 to 18 Years | 6,150 (98.9%) | 68 (1.1%) |
| 19 to 25 Years | 1,619 (94.4%) | 96 (5.6%) |
| 26 to 34 Years | 2,983 (93.0%) | 226 (7.0%) |
| 35 to 44 Years | 4,553 (98.9%) | 52 (1.1%) |
| 45 to 54 Years | 3,692 (94.4%) | 219 (5.6%) |
| 55 to 64 Years | 3,380 (97.9%) | 73 (2.1%) |
| 65 to 74 Years | 2,152 (97.4%) | 57 (2.6%) |
| 75 Years and older | 884 (100.0%) | 0 (0.0%) |
| Total | 27,925 (97.2%) | 810 (2.8%) |
Health Insurance Coverage by Citizenship Status in Crofton
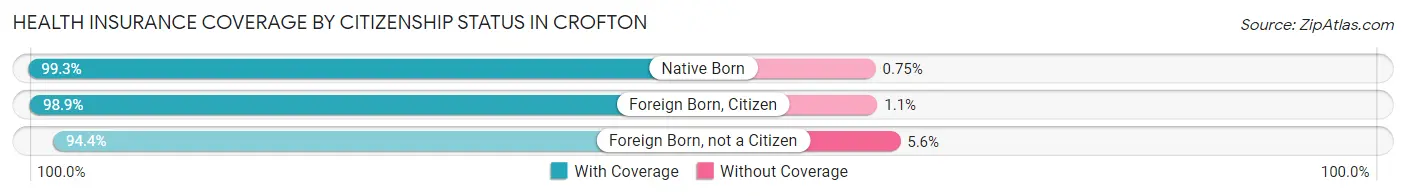
| Citizenship Status | With Coverage | Without Coverage |
| Native Born | 2,512 (99.3%) | 19 (0.7%) |
| Foreign Born, Citizen | 6,150 (98.9%) | 68 (1.1%) |
| Foreign Born, not a Citizen | 1,619 (94.4%) | 96 (5.6%) |
Health Insurance Coverage by Household Income in Crofton
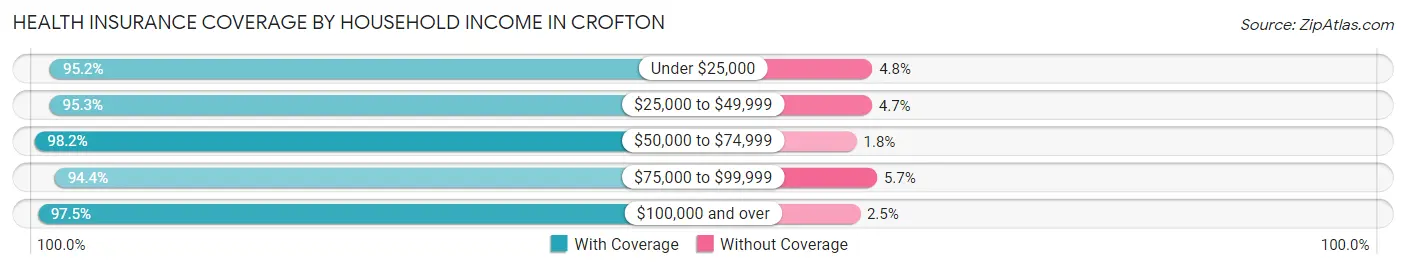
| Household Income | With Coverage | Without Coverage |
| Under $25,000 | 819 (95.2%) | 41 (4.8%) |
| $25,000 to $49,999 | 1,216 (95.3%) | 60 (4.7%) |
| $50,000 to $74,999 | 2,293 (98.2%) | 43 (1.8%) |
| $75,000 to $99,999 | 2,039 (94.4%) | 122 (5.7%) |
| $100,000 and over | 21,558 (97.5%) | 544 (2.5%) |
Public vs Private Health Insurance Coverage by Age in Crofton
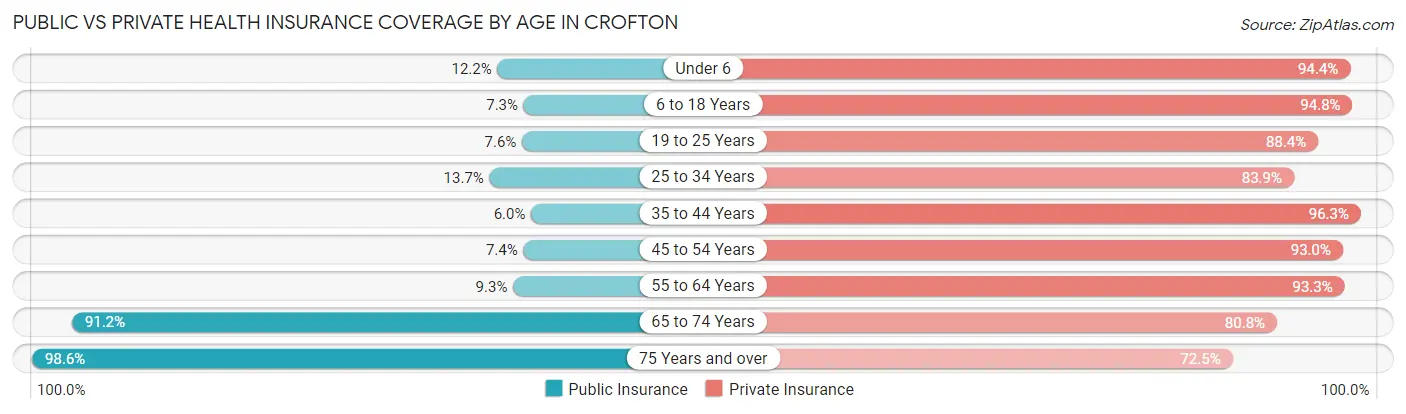
| Age Bracket | Public Insurance | Private Insurance |
| Under 6 | 309 (12.2%) | 2,388 (94.4%) |
| 6 to 18 Years | 456 (7.3%) | 5,893 (94.8%) |
| 19 to 25 Years | 131 (7.6%) | 1,516 (88.4%) |
| 25 to 34 Years | 439 (13.7%) | 2,692 (83.9%) |
| 35 to 44 Years | 274 (5.9%) | 4,436 (96.3%) |
| 45 to 54 Years | 289 (7.4%) | 3,637 (93.0%) |
| 55 to 64 Years | 321 (9.3%) | 3,222 (93.3%) |
| 65 to 74 Years | 2,015 (91.2%) | 1,784 (80.8%) |
| 75 Years and over | 872 (98.6%) | 641 (72.5%) |
| Total | 5,106 (17.8%) | 26,209 (91.2%) |
Disability Status by Sex by Age in Crofton
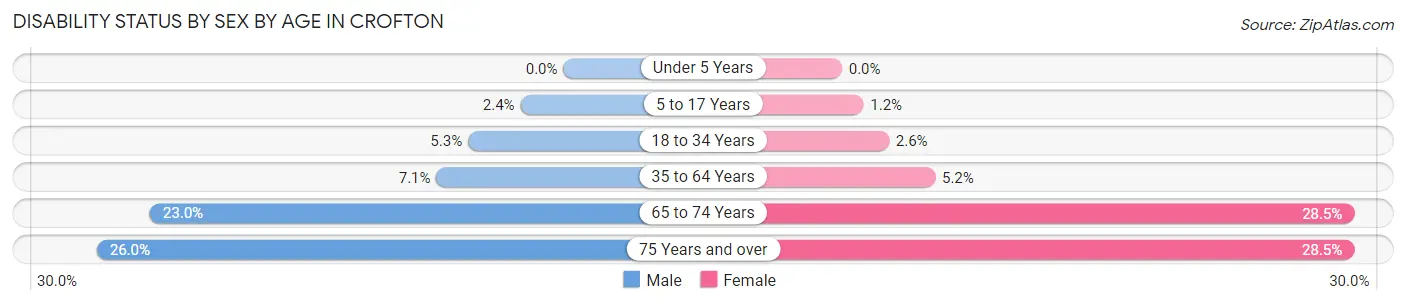
| Age Bracket | Male | Female |
| Under 5 Years | 0 (0.0%) | 0 (0.0%) |
| 5 to 17 Years | 81 (2.4%) | 35 (1.2%) |
| 18 to 34 Years | 146 (5.3%) | 65 (2.6%) |
| 35 to 64 Years | 400 (7.1%) | 328 (5.2%) |
| 65 to 74 Years | 218 (23.0%) | 360 (28.5%) |
| 75 Years and over | 73 (26.0%) | 172 (28.5%) |
Disability Class by Sex by Age in Crofton
Disability Class: Hearing Difficulty
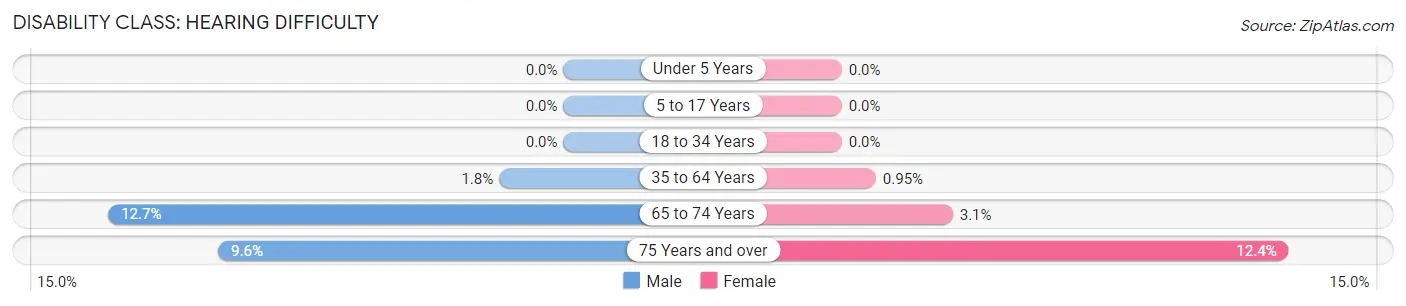
| Age Bracket | Male | Female |
| Under 5 Years | 0 (0.0%) | 0 (0.0%) |
| 5 to 17 Years | 0 (0.0%) | 0 (0.0%) |
| 18 to 34 Years | 0 (0.0%) | 0 (0.0%) |
| 35 to 64 Years | 101 (1.8%) | 60 (0.9%) |
| 65 to 74 Years | 120 (12.7%) | 39 (3.1%) |
| 75 Years and over | 27 (9.6%) | 75 (12.4%) |
Disability Class: Vision Difficulty
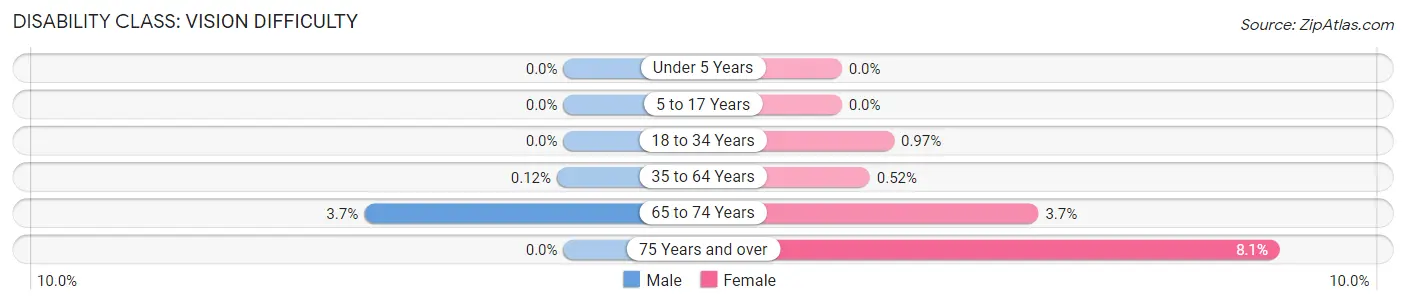
| Age Bracket | Male | Female |
| Under 5 Years | 0 (0.0%) | 0 (0.0%) |
| 5 to 17 Years | 0 (0.0%) | 0 (0.0%) |
| 18 to 34 Years | 0 (0.0%) | 24 (1.0%) |
| 35 to 64 Years | 7 (0.1%) | 33 (0.5%) |
| 65 to 74 Years | 35 (3.7%) | 46 (3.6%) |
| 75 Years and over | 0 (0.0%) | 49 (8.1%) |
Disability Class: Cognitive Difficulty
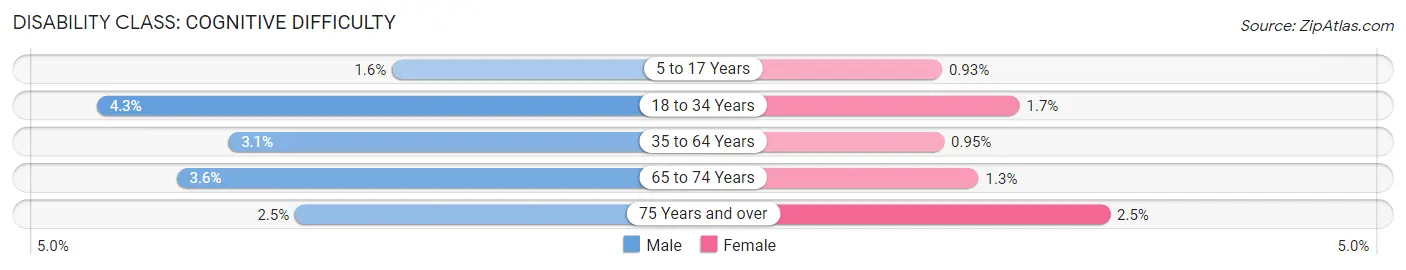
| Age Bracket | Male | Female |
| 5 to 17 Years | 54 (1.6%) | 27 (0.9%) |
| 18 to 34 Years | 119 (4.3%) | 41 (1.7%) |
| 35 to 64 Years | 176 (3.1%) | 60 (0.9%) |
| 65 to 74 Years | 34 (3.6%) | 16 (1.3%) |
| 75 Years and over | 7 (2.5%) | 15 (2.5%) |
Disability Class: Ambulatory Difficulty
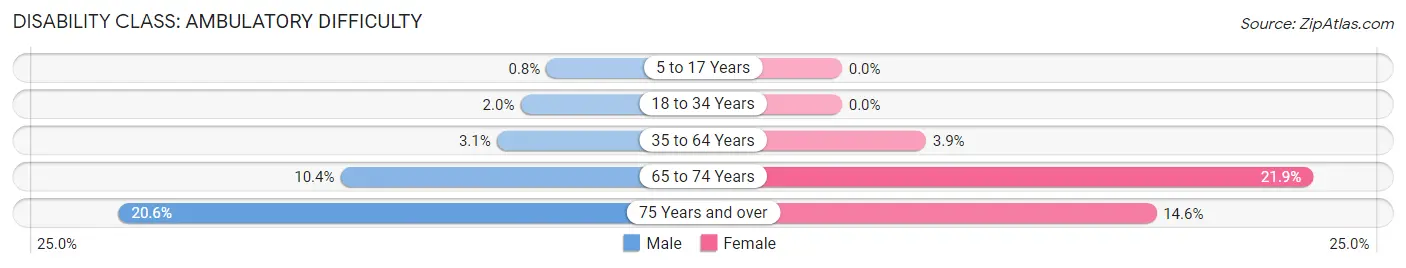
| Age Bracket | Male | Female |
| 5 to 17 Years | 27 (0.8%) | 0 (0.0%) |
| 18 to 34 Years | 55 (2.0%) | 0 (0.0%) |
| 35 to 64 Years | 175 (3.1%) | 246 (3.9%) |
| 65 to 74 Years | 98 (10.3%) | 276 (21.9%) |
| 75 Years and over | 58 (20.6%) | 88 (14.6%) |
Disability Class: Self-Care Difficulty
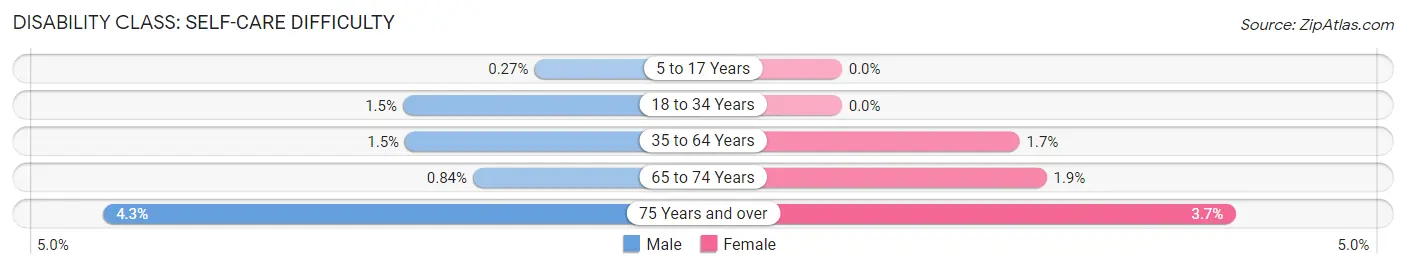
| Age Bracket | Male | Female |
| 5 to 17 Years | 9 (0.3%) | 0 (0.0%) |
| 18 to 34 Years | 41 (1.5%) | 0 (0.0%) |
| 35 to 64 Years | 83 (1.5%) | 104 (1.7%) |
| 65 to 74 Years | 8 (0.8%) | 24 (1.9%) |
| 75 Years and over | 12 (4.3%) | 22 (3.6%) |
Technology Access in Crofton
Computing Device Access in Crofton
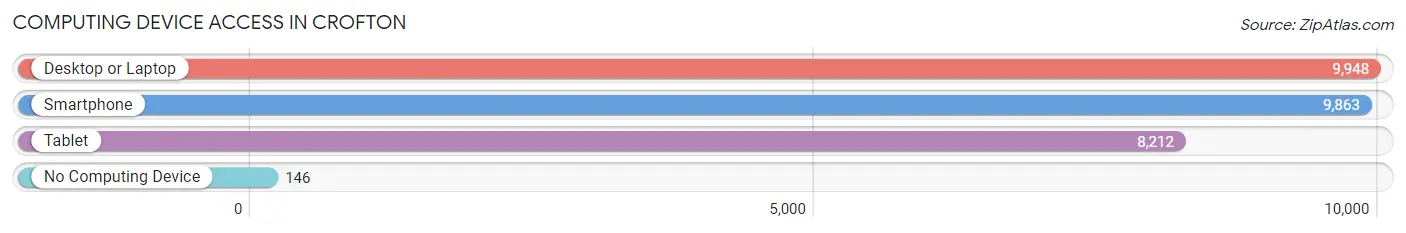
| Device Type | # Households | % Households |
| Desktop or Laptop | 9,948 | 95.0% |
| Smartphone | 9,863 | 94.2% |
| Tablet | 8,212 | 78.5% |
| No Computing Device | 146 | 1.4% |
| Total | 10,467 | 100.0% |
Internet Access in Crofton
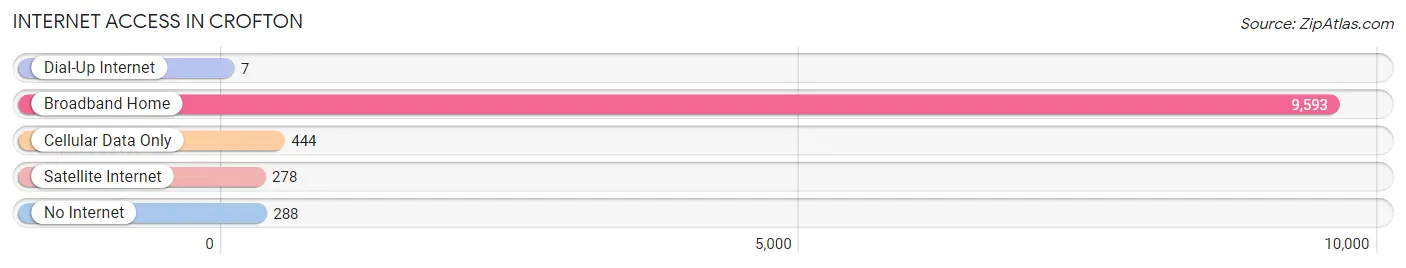
| Internet Type | # Households | % Households |
| Dial-Up Internet | 7 | 0.1% |
| Broadband Home | 9,593 | 91.6% |
| Cellular Data Only | 444 | 4.2% |
| Satellite Internet | 278 | 2.7% |
| No Internet | 288 | 2.8% |
| Total | 10,467 | 100.0% |
Crofton Summary
Crofton, Maryland is a small, unincorporated community located in Anne Arundel County, Maryland. It is situated approximately 15 miles south of Baltimore and 25 miles east of Washington, D.C. The community is bordered by the Patuxent River to the north, the Severn River to the east, and the South River to the south.
History
Crofton was founded in 1964 by developer William Callahan, who named the community after his ancestral home in England. The community was designed to be a self-contained, planned community with its own schools, shopping centers, and recreational facilities. The first homes were built in 1965, and the community was officially incorporated in 1967.
Geography
Crofton is located in Anne Arundel County, Maryland, approximately 15 miles south of Baltimore and 25 miles east of Washington, D.C. The community is bordered by the Patuxent River to the north, the Severn River to the east, and the South River to the south. The community is situated on a plateau, with an elevation of approximately 100 feet above sea level.
Economy
Crofton is primarily a residential community, with a small commercial district located along Route 3. The commercial district includes a variety of restaurants, retail stores, and professional services. The community is also home to several large employers, including the Anne Arundel Medical Center, the Crofton Country Club, and the Crofton Athletic Club.
Demographics
As of the 2010 census, the population of Crofton was 25,224. The racial makeup of the community was 79.3% White, 11.3% African American, 4.2% Asian, and 4.2% Hispanic or Latino. The median household income was $107,817, and the median home value was $400,000.
Crofton is a diverse community, with a variety of religious and cultural backgrounds represented. The community is home to a variety of churches, including Catholic, Protestant, and Jewish congregations. The community also hosts a variety of cultural events throughout the year, including the Crofton Summer Concert Series and the Crofton Arts Festival.
Conclusion
Crofton, Maryland is a small, unincorporated community located in Anne Arundel County, Maryland. It was founded in 1964 by developer William Callahan, and was designed to be a self-contained, planned community. The community is primarily residential, with a small commercial district located along Route 3. As of the 2010 census, the population of Crofton was 25,224, with a median household income of $107,817 and a median home value of $400,000. The community is diverse, with a variety of religious and cultural backgrounds represented. Crofton is a vibrant community, with a variety of recreational and cultural activities available for residents and visitors alike.
Common Questions
What is Per Capita Income in Crofton?
Per Capita income in Crofton is $59,849.
What is the Median Family Income in Crofton?
Median Family Income in Crofton is $160,258.
What is the Median Household income in Crofton?
Median Household Income in Crofton is $143,202.
What is Income or Wage Gap in Crofton?
Income or Wage Gap in Crofton is 30.3%.
Women in Crofton earn 69.7 cents for every dollar earned by a man.
What is Family Income Deficit in Crofton?
Family Income Deficit in Crofton is $15,800.
Families that are below poverty line in Crofton earn $15,800 less on average than the poverty threshold level.
What is Inequality or Gini Index in Crofton?
Inequality or Gini Index in Crofton is 0.39.
What is the Total Population of Crofton?
Total Population of Crofton is 29,358.
What is the Total Male Population of Crofton?
Total Male Population of Crofton is 14,466.
What is the Total Female Population of Crofton?
Total Female Population of Crofton is 14,892.
What is the Ratio of Males per 100 Females in Crofton?
There are 97.14 Males per 100 Females in Crofton.
What is the Ratio of Females per 100 Males in Crofton?
There are 102.94 Females per 100 Males in Crofton.
What is the Median Population Age in Crofton?
Median Population Age in Crofton is 37.1 Years.
What is the Average Family Size in Crofton
Average Family Size in Crofton is 3.4 People.
What is the Average Household Size in Crofton
Average Household Size in Crofton is 2.8 People.
How Large is the Labor Force in Crofton?
There are 16,269 People in the Labor Forcein in Crofton.
What is the Percentage of People in the Labor Force in Crofton?
75.5% of People are in the Labor Force in Crofton.
What is the Unemployment Rate in Crofton?
Unemployment Rate in Crofton is 4.1%.