Cities with the Highest Percentage of Immigrants from Cameroon in Maryland
RELATED REPORTS & OPTIONS
Cameroon
Maryland
Compare Cities
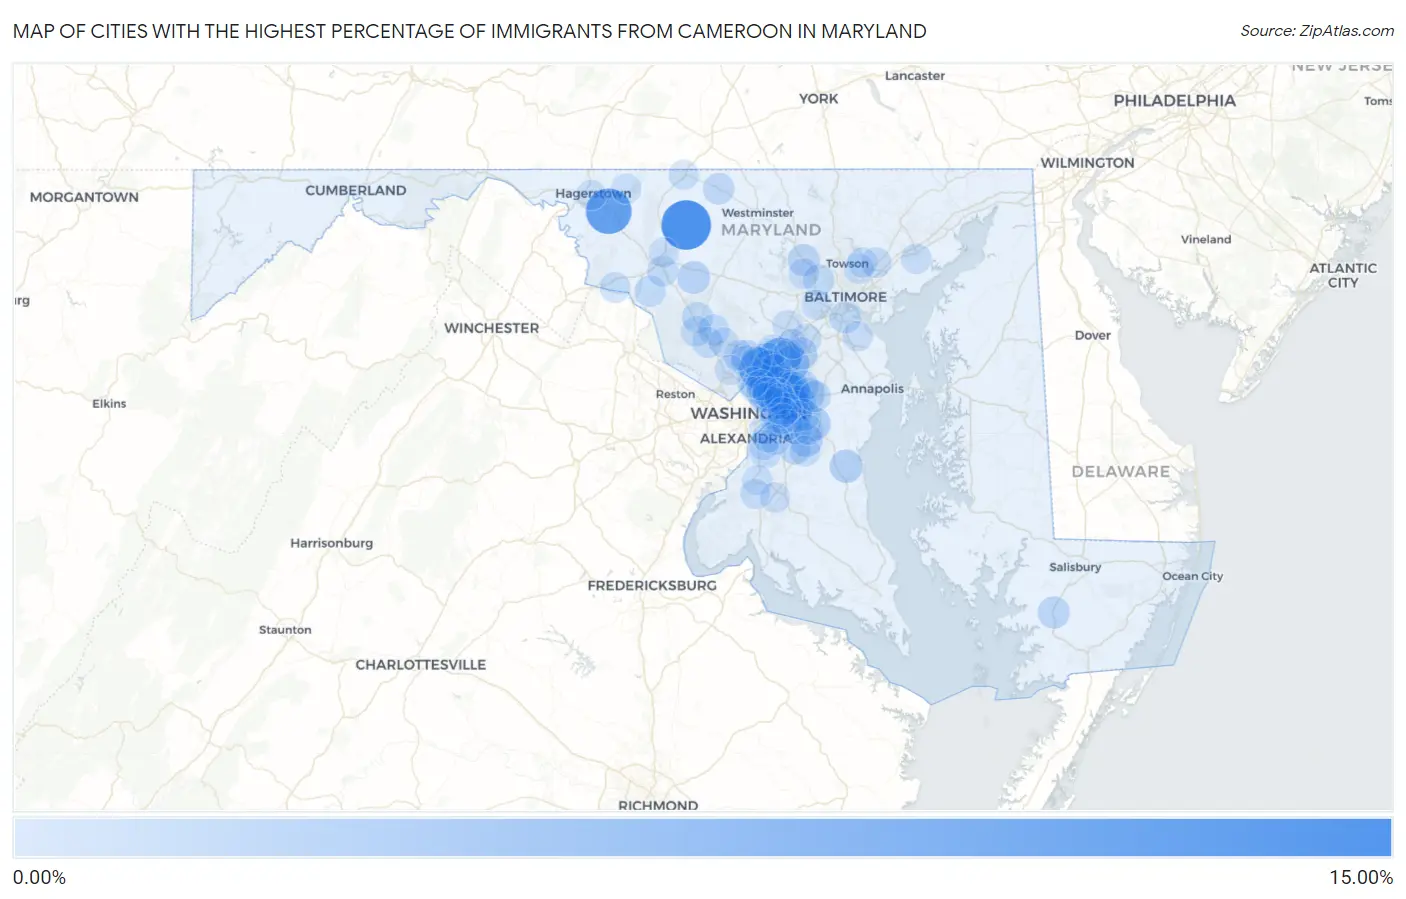
Map of Cities with the Highest Percentage of Immigrants from Cameroon in Maryland
0.00%
15.00%
Cities with the Highest Percentage of Immigrants from Cameroon in Maryland
| City | Cameroon | vs State | vs National | |
| 1. | Woodsboro | 14.52% | 0.39%(+14.1)#-1 | 0.025%(+14.5)#0 |
| 2. | Beaver Creek | 11.61% | 0.39%(+11.2)#0 | 0.025%(+11.6)#1 |
| 3. | Cedar Heights | 11.42% | 0.39%(+11.0)#1 | 0.025%(+11.4)#2 |
| 4. | Konterra | 8.92% | 0.39%(+8.53)#2 | 0.025%(+8.90)#3 |
| 5. | White Oak | 8.24% | 0.39%(+7.86)#3 | 0.025%(+8.22)#4 |
| 6. | New Carrollton | 7.84% | 0.39%(+7.45)#4 | 0.025%(+7.81)#5 |
| 7. | Adelphi | 4.65% | 0.39%(+4.26)#8 | 0.025%(+4.63)#70 |
| 8. | South Laurel | 4.30% | 0.39%(+3.91)#9 | 0.025%(+4.28)#71 |
| 9. | Burnt Mills | 3.80% | 0.39%(+3.41)#10 | 0.025%(+3.77)#72 |
| 10. | Greenbelt | 3.73% | 0.39%(+3.34)#11 | 0.025%(+3.71)#73 |
| 11. | Lanham | 3.46% | 0.39%(+3.07)#12 | 0.025%(+3.43)#74 |
| 12. | Fairland | 3.24% | 0.39%(+2.85)#21 | 0.025%(+3.21)#275 |
| 13. | Brown Station | 3.21% | 0.39%(+2.82)#22 | 0.025%(+3.18)#276 |
| 14. | Seabrook | 3.17% | 0.39%(+2.78)#23 | 0.025%(+3.15)#277 |
| 15. | Mitchellville | 3.02% | 0.39%(+2.63)#24 | 0.025%(+2.99)#278 |
| 16. | Brock Hall | 2.87% | 0.39%(+2.48)#25 | 0.025%(+2.85)#279 |
| 17. | Fairmount Heights | 2.75% | 0.39%(+2.36)#26 | 0.025%(+2.73)#280 |
| 18. | Lake Arbor | 2.55% | 0.39%(+2.16)#27 | 0.025%(+2.53)#281 |
| 19. | Queensland | 2.51% | 0.39%(+2.12)#28 | 0.025%(+2.48)#282 |
| 20. | Owings | 2.31% | 0.39%(+1.93)#29 | 0.025%(+2.29)#283 |
| 21. | Hillandale | 2.18% | 0.39%(+1.79)#30 | 0.025%(+2.15)#284 |
| 22. | Bladensburg | 2.05% | 0.39%(+1.66)#31 | 0.025%(+2.02)#285 |
| 23. | Monrovia | 2.05% | 0.39%(+1.66)#32 | 0.025%(+2.02)#286 |
| 24. | Maryland City | 2.00% | 0.39%(+1.61)#33 | 0.025%(+1.98)#287 |
| 25. | District Heights | 1.98% | 0.39%(+1.59)#34 | 0.025%(+1.96)#288 |
| 26. | Springdale | 1.88% | 0.39%(+1.49)#35 | 0.025%(+1.85)#289 |
| 27. | Layhill | 1.86% | 0.39%(+1.47)#36 | 0.025%(+1.84)#290 |
| 28. | Fairwood | 1.79% | 0.39%(+1.40)#37 | 0.025%(+1.77)#291 |
| 29. | Landover | 1.67% | 0.39%(+1.28)#38 | 0.025%(+1.65)#292 |
| 30. | Chillum | 1.66% | 0.39%(+1.27)#39 | 0.025%(+1.63)#293 |
| 31. | Glenn Dale | 1.65% | 0.39%(+1.26)#40 | 0.025%(+1.63)#294 |
| 32. | Calverton | 1.61% | 0.39%(+1.22)#41 | 0.025%(+1.58)#295 |
| 33. | Princess Anne | 1.54% | 0.39%(+1.15)#42 | 0.025%(+1.52)#296 |
| 34. | Kettering | 1.54% | 0.39%(+1.15)#43 | 0.025%(+1.51)#297 |
| 35. | Owings Mills | 1.45% | 0.39%(+1.06)#44 | 0.025%(+1.42)#298 |
| 36. | Takoma Park | 1.44% | 0.39%(+1.05)#45 | 0.025%(+1.41)#299 |
| 37. | Largo | 1.28% | 0.39%(+0.895)#46 | 0.025%(+1.26)#300 |
| 38. | Edmonston | 1.26% | 0.39%(+0.867)#47 | 0.025%(+1.23)#301 |
| 39. | Brooklyn Park | 1.25% | 0.39%(+0.862)#48 | 0.025%(+1.23)#302 |
| 40. | Taneytown | 1.23% | 0.39%(+0.841)#49 | 0.025%(+1.21)#303 |
| 41. | Beltsville | 1.23% | 0.39%(+0.839)#50 | 0.025%(+1.20)#304 |
| 42. | Rosaryville | 1.21% | 0.39%(+0.825)#51 | 0.025%(+1.19)#305 |
| 43. | East Riverdale | 1.21% | 0.39%(+0.822)#52 | 0.025%(+1.19)#306 |
| 44. | Bowie | 1.18% | 0.39%(+0.792)#53 | 0.025%(+1.16)#307 |
| 45. | Friendly | 1.07% | 0.39%(+0.683)#54 | 0.025%(+1.05)#308 |
| 46. | Westphalia | 1.04% | 0.39%(+0.650)#55 | 0.025%(+1.01)#309 |
| 47. | Mount Rainier | 0.97% | 0.39%(+0.579)#56 | 0.025%(+0.943)#310 |
| 48. | Adamstown | 0.96% | 0.39%(+0.572)#57 | 0.025%(+0.936)#311 |
| 49. | Lochearn | 0.95% | 0.39%(+0.564)#58 | 0.025%(+0.928)#312 |
| 50. | Clarksburg | 0.94% | 0.39%(+0.550)#59 | 0.025%(+0.914)#313 |
| 51. | Glenmont | 0.94% | 0.39%(+0.549)#60 | 0.025%(+0.913)#314 |
| 52. | Montgomery Village | 0.88% | 0.39%(+0.489)#61 | 0.025%(+0.853)#315 |
| 53. | Burtonsville | 0.87% | 0.39%(+0.483)#62 | 0.025%(+0.847)#316 |
| 54. | Ballenger Creek | 0.84% | 0.39%(+0.454)#63 | 0.025%(+0.818)#317 |
| 55. | Summerfield | 0.82% | 0.39%(+0.433)#64 | 0.025%(+0.797)#318 |
| 56. | Gaithersburg | 0.82% | 0.39%(+0.430)#65 | 0.025%(+0.794)#319 |
| 57. | Cheverly | 0.80% | 0.39%(+0.410)#66 | 0.025%(+0.774)#320 |
| 58. | Flower Hill | 0.74% | 0.39%(+0.356)#67 | 0.025%(+0.720)#321 |
| 59. | Brentwood | 0.69% | 0.39%(+0.298)#68 | 0.025%(+0.662)#322 |
| 60. | Hillcrest Heights | 0.67% | 0.39%(+0.285)#69 | 0.025%(+0.649)#323 |
| 61. | Silver Spring | 0.65% | 0.39%(+0.265)#70 | 0.025%(+0.629)#324 |
| 62. | Brunswick | 0.64% | 0.39%(+0.254)#71 | 0.025%(+0.618)#325 |
| 63. | Woodlawn Cdp Baltimore County | 0.60% | 0.39%(+0.215)#72 | 0.025%(+0.579)#326 |
| 64. | Germantown | 0.60% | 0.39%(+0.213)#73 | 0.025%(+0.577)#327 |
| 65. | Langley Park | 0.56% | 0.39%(+0.167)#74 | 0.025%(+0.531)#328 |
| 66. | Aspen Hill | 0.53% | 0.39%(+0.142)#75 | 0.025%(+0.506)#329 |
| 67. | Marlton | 0.52% | 0.39%(+0.132)#76 | 0.025%(+0.496)#330 |
| 68. | Randallstown | 0.50% | 0.39%(+0.108)#77 | 0.025%(+0.472)#331 |
| 69. | Perry Hall | 0.48% | 0.39%(+0.093)#78 | 0.025%(+0.457)#332 |
| 70. | Coral Hills | 0.46% | 0.39%(+0.068)#79 | 0.025%(+0.432)#333 |
| 71. | Honeygo | 0.46% | 0.39%(+0.068)#80 | 0.025%(+0.432)#334 |
| 72. | Landover Hills | 0.42% | 0.39%(+0.036)#81 | 0.025%(+0.400)#335 |
| 73. | Forestville | 0.41% | 0.39%(+0.019)#82 | 0.025%(+0.383)#336 |
| 74. | Edgewood | 0.37% | 0.39%(-0.015)#83 | 0.025%(+0.349)#337 |
| 75. | Hyattsville | 0.35% | 0.39%(-0.039)#84 | 0.025%(+0.325)#338 |
| 76. | Jessup | 0.34% | 0.39%(-0.045)#85 | 0.025%(+0.319)#339 |
| 77. | Redland | 0.34% | 0.39%(-0.046)#86 | 0.025%(+0.318)#340 |
| 78. | Walker Mill | 0.33% | 0.39%(-0.058)#87 | 0.025%(+0.306)#341 |
| 79. | Peppermill Village | 0.32% | 0.39%(-0.069)#88 | 0.025%(+0.295)#342 |
| 80. | Laurel | 0.31% | 0.39%(-0.081)#89 | 0.025%(+0.283)#343 |
| 81. | Emmitsburg | 0.28% | 0.39%(-0.105)#90 | 0.025%(+0.259)#344 |
| 82. | Columbia | 0.28% | 0.39%(-0.106)#91 | 0.025%(+0.258)#345 |
| 83. | Hagerstown | 0.28% | 0.39%(-0.110)#92 | 0.025%(+0.254)#346 |
| 84. | Frederick | 0.27% | 0.39%(-0.121)#93 | 0.025%(+0.243)#347 |
| 85. | North Bethesda | 0.27% | 0.39%(-0.122)#94 | 0.025%(+0.242)#449 |
| 86. | Parkville | 0.26% | 0.39%(-0.133)#95 | 0.025%(+0.231)#450 |
| 87. | Camp Springs | 0.25% | 0.39%(-0.135)#96 | 0.025%(+0.229)#451 |
| 88. | Accokeek | 0.24% | 0.39%(-0.146)#97 | 0.025%(+0.218)#452 |
| 89. | Oxon Hill | 0.24% | 0.39%(-0.146)#98 | 0.025%(+0.218)#453 |
| 90. | Abingdon | 0.23% | 0.39%(-0.154)#99 | 0.025%(+0.210)#454 |
| 91. | Temple Hills | 0.23% | 0.39%(-0.160)#100 | 0.025%(+0.204)#455 |
| 92. | Bensville | 0.23% | 0.39%(-0.164)#101 | 0.025%(+0.200)#456 |
| 93. | North Laurel | 0.22% | 0.39%(-0.168)#102 | 0.025%(+0.196)#457 |
| 94. | Waldorf | 0.22% | 0.39%(-0.169)#103 | 0.025%(+0.195)#458 |
| 95. | Smithsburg | 0.20% | 0.39%(-0.191)#104 | 0.025%(+0.173)#459 |
| 96. | Carney | 0.20% | 0.39%(-0.191)#105 | 0.025%(+0.173)#460 |
| 97. | Catonsville | 0.19% | 0.39%(-0.202)#106 | 0.025%(+0.162)#461 |
| 98. | Colesville | 0.18% | 0.39%(-0.207)#107 | 0.025%(+0.157)#462 |
| 99. | Marlboro Village | 0.18% | 0.39%(-0.214)#108 | 0.025%(+0.150)#463 |
| 100. | Pasadena | 0.15% | 0.39%(-0.237)#109 | 0.025%(+0.127)#464 |
Common Questions
What are the Top 10 Cities with the Highest Percentage of Immigrants from Cameroon in Maryland?
Top 10 Cities with the Highest Percentage of Immigrants from Cameroon in Maryland are:
#1
14.52%
#2
11.61%
#3
8.92%
#4
8.24%
#5
7.84%
#6
4.65%
#7
4.30%
#8
3.73%
#9
3.46%
#10
3.24%
What city has the Highest Percentage of Immigrants from Cameroon in Maryland?
Woodsboro has the Highest Percentage of Immigrants from Cameroon in Maryland with 14.52%.
What is the Percentage of Immigrants from Cameroon in the State of Maryland?
Percentage of Immigrants from Cameroon in Maryland is 0.39%.
What is the Percentage of Immigrants from Cameroon in the United States?
Percentage of Immigrants from Cameroon in the United States is 0.025%.