Cities with the Most Immigrants from Russia in Michigan
RELATED REPORTS & OPTIONS
Russia
Michigan
Compare Cities
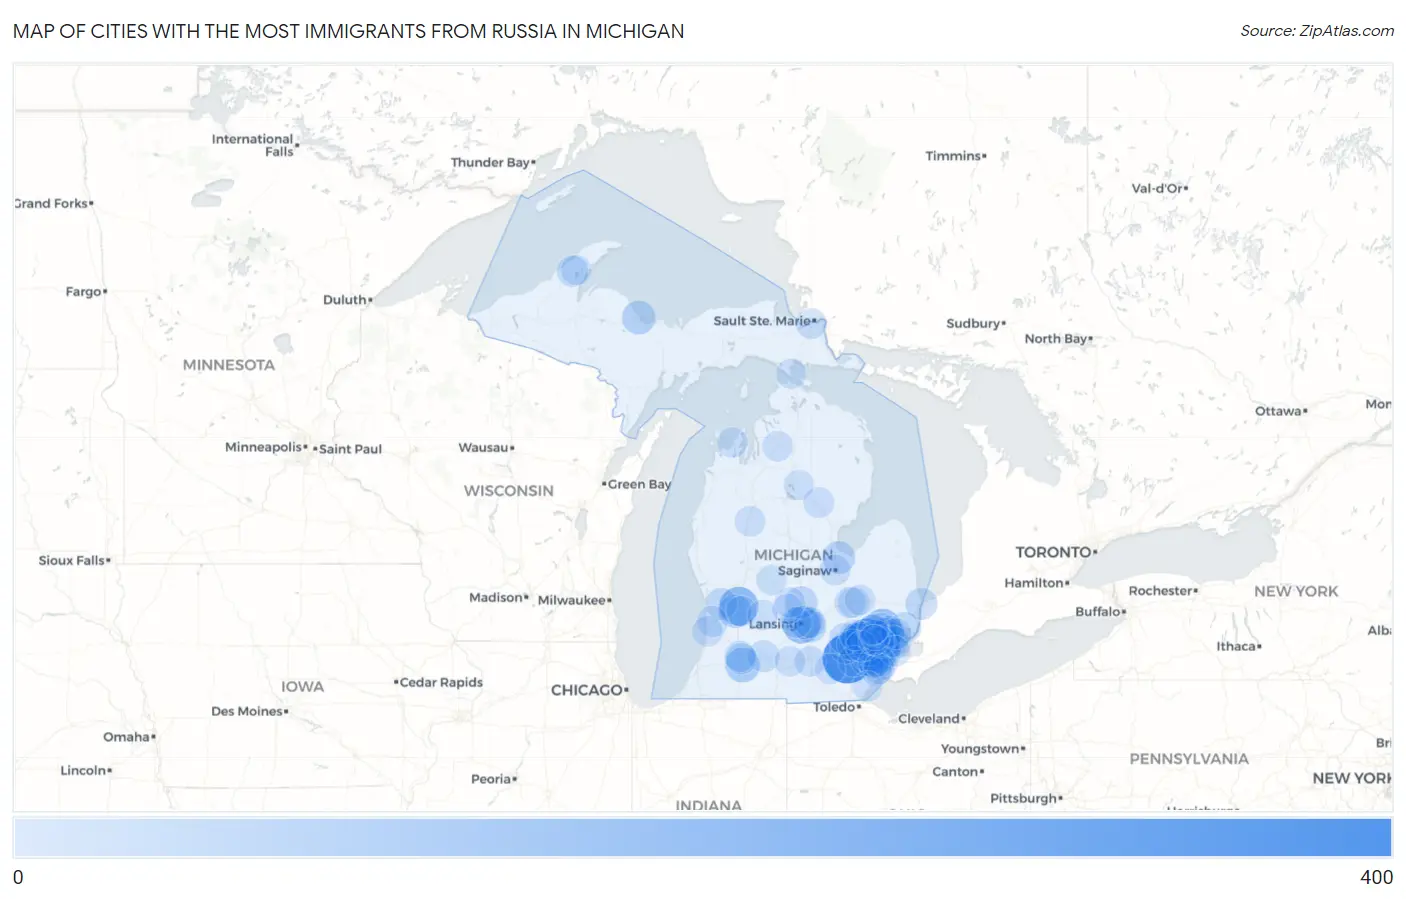
Map of Cities with the Most Immigrants from Russia in Michigan
0
400
Cities with the Most Immigrants from Russia in Michigan
| City | Russia | vs State | vs National | |
| 1. | Ann Arbor | 355 | 6,326(5.61%)#1 | 406,732(0.09%)#140 |
| 2. | Farmington Hills | 325 | 6,326(5.14%)#2 | 406,732(0.08%)#157 |
| 3. | Novi | 229 | 6,326(3.62%)#3 | 406,732(0.06%)#226 |
| 4. | Oak Park | 198 | 6,326(3.13%)#4 | 406,732(0.05%)#276 |
| 5. | Southfield | 192 | 6,326(3.04%)#5 | 406,732(0.05%)#294 |
| 6. | Royal Oak | 178 | 6,326(2.81%)#6 | 406,732(0.04%)#323 |
| 7. | Grand Rapids | 158 | 6,326(2.50%)#7 | 406,732(0.04%)#368 |
| 8. | Rochester | 128 | 6,326(2.02%)#8 | 406,732(0.03%)#448 |
| 9. | Lansing | 124 | 6,326(1.96%)#9 | 406,732(0.03%)#462 |
| 10. | Dearborn | 93 | 6,326(1.47%)#10 | 406,732(0.02%)#609 |
| 11. | Hazel Park | 93 | 6,326(1.47%)#11 | 406,732(0.02%)#613 |
| 12. | Troy | 89 | 6,326(1.41%)#12 | 406,732(0.02%)#639 |
| 13. | Sterling Heights | 83 | 6,326(1.31%)#13 | 406,732(0.02%)#690 |
| 14. | Portage | 80 | 6,326(1.26%)#14 | 406,732(0.02%)#716 |
| 15. | Dearborn Heights | 78 | 6,326(1.23%)#15 | 406,732(0.02%)#730 |
| 16. | Wayne | 74 | 6,326(1.17%)#16 | 406,732(0.02%)#765 |
| 17. | Walled Lake | 67 | 6,326(1.06%)#17 | 406,732(0.02%)#853 |
| 18. | Wixom | 61 | 6,326(0.96%)#18 | 406,732(0.01%)#921 |
| 19. | Marquette | 58 | 6,326(0.92%)#19 | 406,732(0.01%)#961 |
| 20. | East Lansing | 57 | 6,326(0.90%)#20 | 406,732(0.01%)#972 |
| 21. | Wyoming | 56 | 6,326(0.89%)#21 | 406,732(0.01%)#993 |
| 22. | Birmingham | 52 | 6,326(0.82%)#22 | 406,732(0.01%)#1,065 |
| 23. | Detroit | 51 | 6,326(0.81%)#23 | 406,732(0.01%)#1,075 |
| 24. | Madison Heights | 50 | 6,326(0.79%)#24 | 406,732(0.01%)#1,108 |
| 25. | Westland | 45 | 6,326(0.71%)#25 | 406,732(0.01%)#1,196 |
| 26. | Bay City | 45 | 6,326(0.71%)#26 | 406,732(0.01%)#1,202 |
| 27. | Okemos | 41 | 6,326(0.65%)#27 | 406,732(0.01%)#1,313 |
| 28. | Whitmore Lake | 39 | 6,326(0.62%)#28 | 406,732(0.01%)#1,384 |
| 29. | St Johns | 38 | 6,326(0.60%)#29 | 406,732(0.01%)#1,406 |
| 30. | Inkster | 32 | 6,326(0.51%)#30 | 406,732(0.01%)#1,575 |
| 31. | St Clair Shores | 31 | 6,326(0.49%)#31 | 406,732(0.01%)#1,603 |
| 32. | Allen Park | 30 | 6,326(0.47%)#32 | 406,732(0.01%)#1,649 |
| 33. | Lincoln Park | 28 | 6,326(0.44%)#33 | 406,732(0.01%)#1,709 |
| 34. | Port Huron | 28 | 6,326(0.44%)#34 | 406,732(0.01%)#1,714 |
| 35. | Allendale | 28 | 6,326(0.44%)#35 | 406,732(0.01%)#1,715 |
| 36. | Livonia | 27 | 6,326(0.43%)#36 | 406,732(0.01%)#1,741 |
| 37. | Rochester Hills | 27 | 6,326(0.43%)#37 | 406,732(0.01%)#1,742 |
| 38. | Wyandotte | 26 | 6,326(0.41%)#38 | 406,732(0.01%)#1,789 |
| 39. | Battle Creek | 24 | 6,326(0.38%)#39 | 406,732(0.01%)#1,869 |
| 40. | New Baltimore | 22 | 6,326(0.35%)#40 | 406,732(0.01%)#1,989 |
| 41. | Brighton | 21 | 6,326(0.33%)#41 | 406,732(0.01%)#2,048 |
| 42. | Farmington | 20 | 6,326(0.32%)#42 | 406,732(0.00%)#2,099 |
| 43. | Roseville | 19 | 6,326(0.30%)#43 | 406,732(0.00%)#2,131 |
| 44. | Wolverine Lake | 19 | 6,326(0.30%)#44 | 406,732(0.00%)#2,160 |
| 45. | Houghton | 18 | 6,326(0.28%)#45 | 406,732(0.00%)#2,208 |
| 46. | Westwood | 17 | 6,326(0.27%)#46 | 406,732(0.00%)#2,272 |
| 47. | Huntington Woods | 16 | 6,326(0.25%)#47 | 406,732(0.00%)#2,346 |
| 48. | Utica | 16 | 6,326(0.25%)#48 | 406,732(0.00%)#2,347 |
| 49. | Kalamazoo | 15 | 6,326(0.24%)#49 | 406,732(0.00%)#2,361 |
| 50. | Woodhaven | 15 | 6,326(0.24%)#50 | 406,732(0.00%)#2,388 |
| 51. | Burton | 14 | 6,326(0.22%)#51 | 406,732(0.00%)#2,438 |
| 52. | Mount Clemens | 13 | 6,326(0.21%)#52 | 406,732(0.00%)#2,539 |
| 53. | South Lyon | 13 | 6,326(0.21%)#53 | 406,732(0.00%)#2,546 |
| 54. | Grosse Pointe | 13 | 6,326(0.21%)#54 | 406,732(0.00%)#2,564 |
| 55. | Holland | 12 | 6,326(0.19%)#55 | 406,732(0.00%)#2,597 |
| 56. | Ypsilanti | 12 | 6,326(0.19%)#56 | 406,732(0.00%)#2,606 |
| 57. | Haslett | 12 | 6,326(0.19%)#57 | 406,732(0.00%)#2,607 |
| 58. | Flint | 11 | 6,326(0.17%)#58 | 406,732(0.00%)#2,675 |
| 59. | Waverly | 11 | 6,326(0.17%)#59 | 406,732(0.00%)#2,697 |
| 60. | Milford | 11 | 6,326(0.17%)#60 | 406,732(0.00%)#2,744 |
| 61. | Saginaw | 10 | 6,326(0.16%)#61 | 406,732(0.00%)#2,785 |
| 62. | Taylor | 9 | 6,326(0.14%)#62 | 406,732(0.00%)#2,894 |
| 63. | Jackson | 9 | 6,326(0.14%)#63 | 406,732(0.00%)#2,909 |
| 64. | Berkley | 9 | 6,326(0.14%)#64 | 406,732(0.00%)#2,934 |
| 65. | Sault Ste Marie | 9 | 6,326(0.14%)#65 | 406,732(0.00%)#2,939 |
| 66. | Douglas | 8 | 6,326(0.13%)#66 | 406,732(0.00%)#3,087 |
| 67. | Alba | 8 | 6,326(0.13%)#67 | 406,732(0.00%)#3,097 |
| 68. | Trenton | 7 | 6,326(0.11%)#68 | 406,732(0.00%)#3,126 |
| 69. | Albion | 7 | 6,326(0.11%)#69 | 406,732(0.00%)#3,140 |
| 70. | Northville | 7 | 6,326(0.11%)#70 | 406,732(0.00%)#3,146 |
| 71. | Davison | 7 | 6,326(0.11%)#71 | 406,732(0.00%)#3,152 |
| 72. | West Branch | 7 | 6,326(0.11%)#72 | 406,732(0.00%)#3,172 |
| 73. | Bloomfield Hills | 6 | 6,326(0.09%)#73 | 406,732(0.00%)#3,236 |
| 74. | Fowler | 6 | 6,326(0.09%)#74 | 406,732(0.00%)#3,265 |
| 75. | Kentwood | 5 | 6,326(0.08%)#75 | 406,732(0.00%)#3,287 |
| 76. | Auburn Hills | 5 | 6,326(0.08%)#76 | 406,732(0.00%)#3,294 |
| 77. | Leland | 5 | 6,326(0.08%)#77 | 406,732(0.00%)#3,376 |
| 78. | Pontiac | 4 | 6,326(0.06%)#78 | 406,732(0.00%)#3,380 |
| 79. | Manchester | 4 | 6,326(0.06%)#79 | 406,732(0.00%)#3,417 |
| 80. | Stanton | 4 | 6,326(0.06%)#80 | 406,732(0.00%)#3,440 |
| 81. | Dollar Bay | 4 | 6,326(0.06%)#81 | 406,732(0.00%)#3,444 |
| 82. | Le Roy | 4 | 6,326(0.06%)#82 | 406,732(0.00%)#3,471 |
| 83. | Bingham Farms | 3 | 6,326(0.05%)#83 | 406,732(0.00%)#3,523 |
| 84. | Monroe | 2 | 6,326(0.03%)#84 | 406,732(0.00%)#3,592 |
| 85. | Westphalia | 2 | 6,326(0.03%)#85 | 406,732(0.00%)#3,631 |
| 86. | St Ignace | 1 | 6,326(0.02%)#86 | 406,732(0.00%)#3,711 |
| 87. | Roscommon | 1 | 6,326(0.02%)#87 | 406,732(0.00%)#3,717 |
| 88. | Clarksville | 1 | 6,326(0.02%)#88 | 406,732(0.00%)#3,744 |
Common Questions
What are the Top 10 Cities with the Most Immigrants from Russia in Michigan?
Top 10 Cities with the Most Immigrants from Russia in Michigan are:
#1
355
#2
325
#3
229
#4
198
#5
192
#6
178
#7
158
#8
128
#9
124
#10
93
What city has the Most Immigrants from Russia in Michigan?
Ann Arbor has the Most Immigrants from Russia in Michigan with 355.
What is the Total Immigrants from Russia in the State of Michigan?
Total Immigrants from Russia in Michigan is 6,326.
What is the Total Immigrants from Russia in the United States?
Total Immigrants from Russia in the United States is 406,732.