Hagerstown, MD Map & Demographics
Hagerstown Map
Hagerstown Overview
$27,990
PER CAPITA INCOME
$58,913
AVG FAMILY INCOME
$48,481
AVG HOUSEHOLD INCOME
27.0%
WAGE / INCOME GAP [ % ]
73.0¢/ $1
WAGE / INCOME GAP [ $ ]
$10,347
FAMILY INCOME DEFICIT
0.46
INEQUALITY / GINI INDEX
43,374
TOTAL POPULATION
21,116
MALE POPULATION
22,258
FEMALE POPULATION
94.87
MALES / 100 FEMALES
105.41
FEMALES / 100 MALES
35.9
MEDIAN AGE
3.1
AVG FAMILY SIZE
2.3
AVG HOUSEHOLD SIZE
20,106
LABOR FORCE [ PEOPLE ]
60.6%
PERCENT IN LABOR FORCE
7.7%
UNEMPLOYMENT RATE
Income in Hagerstown
Income Overview in Hagerstown
Per Capita Income in Hagerstown is $27,990, while median incomes of families and households are $58,913 and $48,481 respectively.
| Characteristic | Number | Measure |
| Per Capita Income | 43,374 | $27,990 |
| Median Family Income | 9,954 | $58,913 |
| Mean Family Income | 9,954 | $77,427 |
| Median Household Income | 18,159 | $48,481 |
| Mean Household Income | 18,159 | $65,544 |
| Income Deficit | 9,954 | $10,347 |
| Wage / Income Gap (%) | 43,374 | 27.01% |
| Wage / Income Gap ($) | 43,374 | 72.99¢ per $1 |
| Gini / Inequality Index | 43,374 | 0.46 |
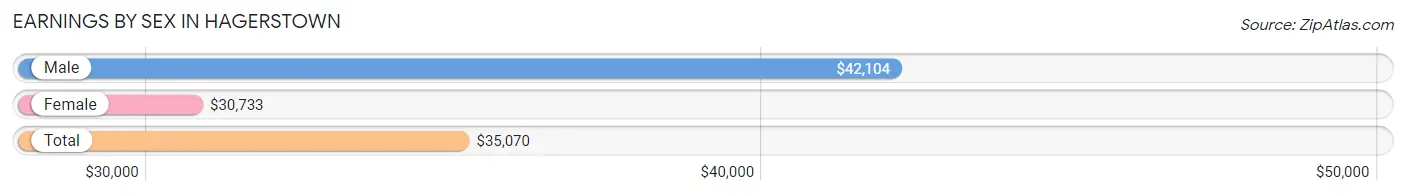
Earnings by Sex in Hagerstown
Average Earnings in Hagerstown are $35,070, $42,104 for men and $30,733 for women, a difference of 27.0%.
| Sex | Number | Average Earnings |
| Male | 10,545 (51.1%) | $42,104 |
| Female | 10,088 (48.9%) | $30,733 |
| Total | 20,633 (100.0%) | $35,070 |
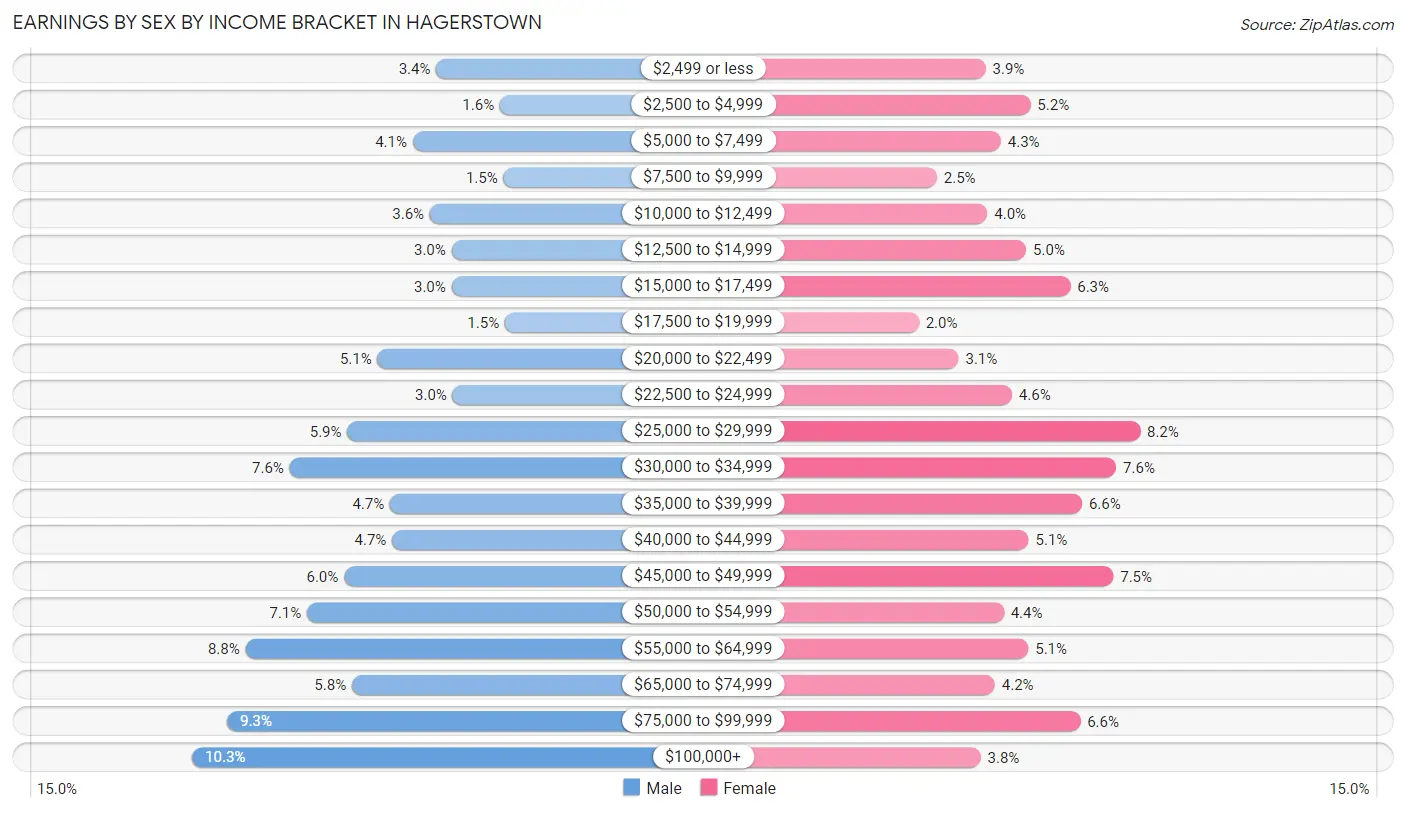
Earnings by Sex by Income Bracket in Hagerstown
The most common earnings brackets in Hagerstown are $100,000+ for men (1,085 | 10.3%) and $25,000 to $29,999 for women (831 | 8.2%).
| Income | Male | Female |
| $2,499 or less | 362 (3.4%) | 393 (3.9%) |
| $2,500 to $4,999 | 173 (1.6%) | 521 (5.2%) |
| $5,000 to $7,499 | 431 (4.1%) | 437 (4.3%) |
| $7,500 to $9,999 | 162 (1.5%) | 255 (2.5%) |
| $10,000 to $12,499 | 381 (3.6%) | 398 (4.0%) |
| $12,500 to $14,999 | 316 (3.0%) | 508 (5.0%) |
| $15,000 to $17,499 | 316 (3.0%) | 634 (6.3%) |
| $17,500 to $19,999 | 158 (1.5%) | 204 (2.0%) |
| $20,000 to $22,499 | 536 (5.1%) | 317 (3.1%) |
| $22,500 to $24,999 | 313 (3.0%) | 468 (4.6%) |
| $25,000 to $29,999 | 625 (5.9%) | 831 (8.2%) |
| $30,000 to $34,999 | 796 (7.5%) | 764 (7.6%) |
| $35,000 to $39,999 | 499 (4.7%) | 667 (6.6%) |
| $40,000 to $44,999 | 492 (4.7%) | 515 (5.1%) |
| $45,000 to $49,999 | 635 (6.0%) | 756 (7.5%) |
| $50,000 to $54,999 | 744 (7.1%) | 445 (4.4%) |
| $55,000 to $64,999 | 927 (8.8%) | 514 (5.1%) |
| $65,000 to $74,999 | 612 (5.8%) | 420 (4.2%) |
| $75,000 to $99,999 | 982 (9.3%) | 662 (6.6%) |
| $100,000+ | 1,085 (10.3%) | 379 (3.8%) |
| Total | 10,545 (100.0%) | 10,088 (100.0%) |
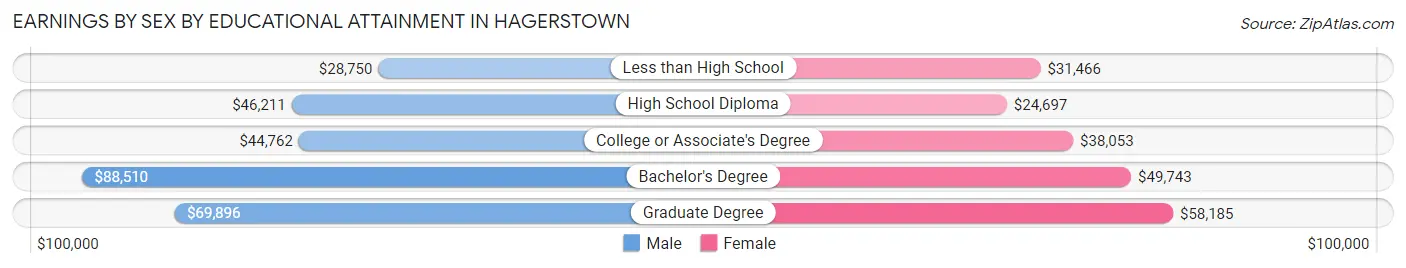
Earnings by Sex by Educational Attainment in Hagerstown
Average earnings in Hagerstown are $48,219 for men and $34,311 for women, a difference of 28.8%. Men with an educational attainment of bachelor's degree enjoy the highest average annual earnings of $88,510, while those with less than high school education earn the least with $28,750. Women with an educational attainment of graduate degree earn the most with the average annual earnings of $58,185, while those with high school diploma education have the smallest earnings of $24,697.
| Educational Attainment | Male Income | Female Income |
| Less than High School | $28,750 | $31,466 |
| High School Diploma | $46,211 | $24,697 |
| College or Associate's Degree | $44,762 | $38,053 |
| Bachelor's Degree | $88,510 | $49,743 |
| Graduate Degree | $69,896 | $58,185 |
| Total | $48,219 | $34,311 |
Family Income in Hagerstown
Family Income Brackets in Hagerstown
According to the Hagerstown family income data, there are 1,742 families falling into the $50,000 to $74,999 income range, which is the most common income bracket and makes up 17.5% of all families. Conversely, the $200,000+ income bracket is the least frequent group with only 348 families (3.5%) belonging to this category.
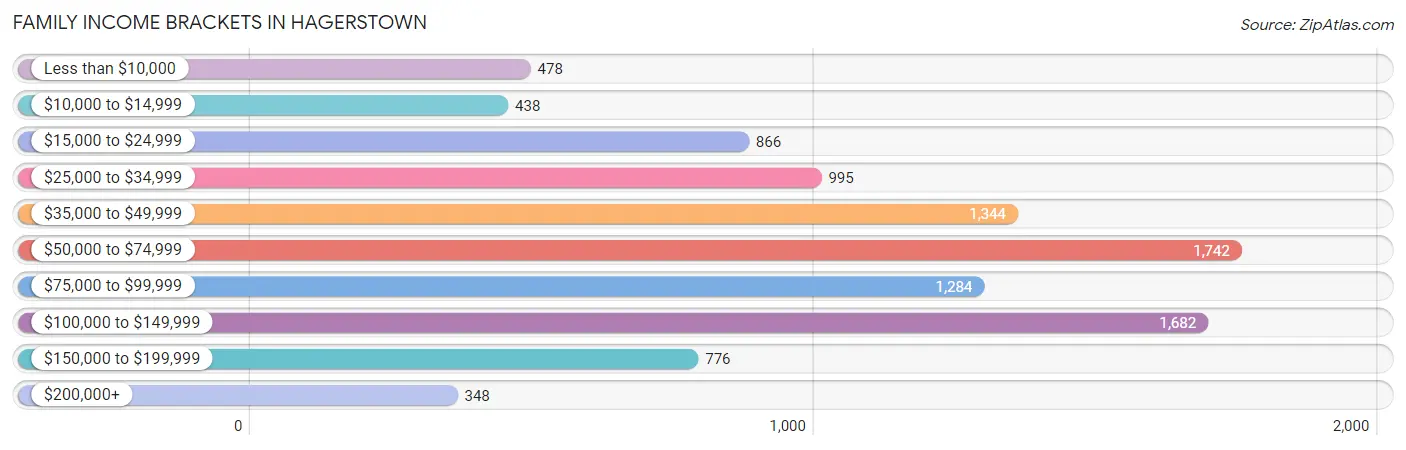
| Income Bracket | # Families | % Families |
| Less than $10,000 | 478 | 4.8% |
| $10,000 to $14,999 | 438 | 4.4% |
| $15,000 to $24,999 | 866 | 8.7% |
| $25,000 to $34,999 | 995 | 10.0% |
| $35,000 to $49,999 | 1,344 | 13.5% |
| $50,000 to $74,999 | 1,742 | 17.5% |
| $75,000 to $99,999 | 1,284 | 12.9% |
| $100,000 to $149,999 | 1,682 | 16.9% |
| $150,000 to $199,999 | 776 | 7.8% |
| $200,000+ | 348 | 3.5% |
Family Income by Famaliy Size in Hagerstown
7+ person families (153 | 1.5%) account for the highest median family income in Hagerstown with $105,684 per family, while 2-person families (4,052 | 40.7%) have the highest median income of $29,846 per family member.
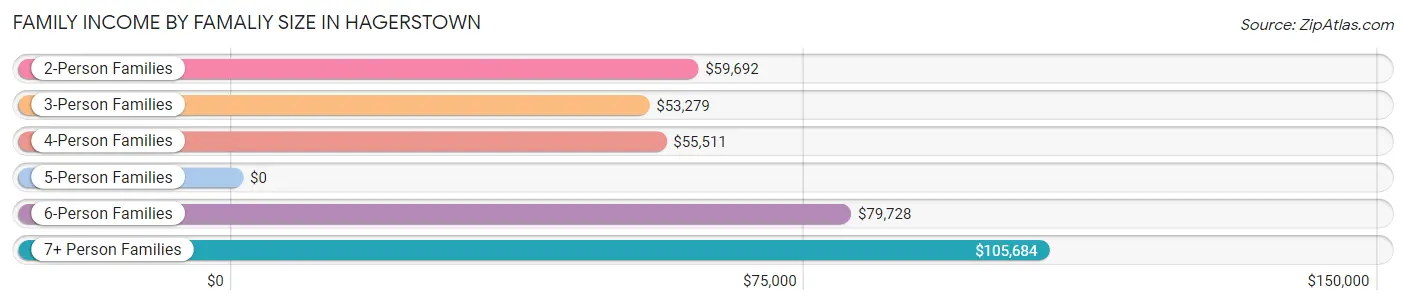
| Income Bracket | # Families | Median Income |
| 2-Person Families | 4,052 (40.7%) | $59,692 |
| 3-Person Families | 2,410 (24.2%) | $53,279 |
| 4-Person Families | 1,835 (18.4%) | $55,511 |
| 5-Person Families | 1,035 (10.4%) | $0 |
| 6-Person Families | 469 (4.7%) | $79,728 |
| 7+ Person Families | 153 (1.5%) | $105,684 |
| Total | 9,954 (100.0%) | $58,913 |
Family Income by Number of Earners in Hagerstown
The median family income in Hagerstown is $58,913, with families comprising 3+ earners (733) having the highest median family income of $123,185, while families with no earners (1,528) have the lowest median family income of $30,156, accounting for 7.4% and 15.3% of families, respectively.
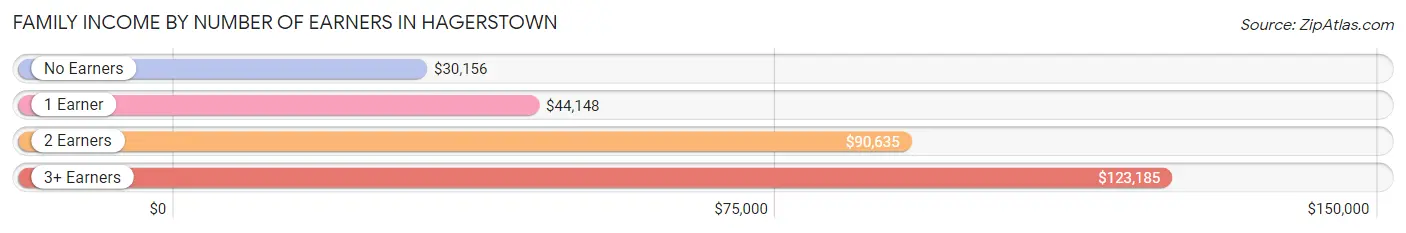
| Number of Earners | # Families | Median Income |
| No Earners | 1,528 (15.3%) | $30,156 |
| 1 Earner | 4,082 (41.0%) | $44,148 |
| 2 Earners | 3,611 (36.3%) | $90,635 |
| 3+ Earners | 733 (7.4%) | $123,185 |
| Total | 9,954 (100.0%) | $58,913 |
Household Income in Hagerstown
Household Income Brackets in Hagerstown
With 3,105 households falling in the category, the $50,000 to $74,999 income range is the most frequent in Hagerstown, accounting for 17.1% of all households. In contrast, only 545 households (3.0%) fall into the $200,000+ income bracket, making it the least populous group.
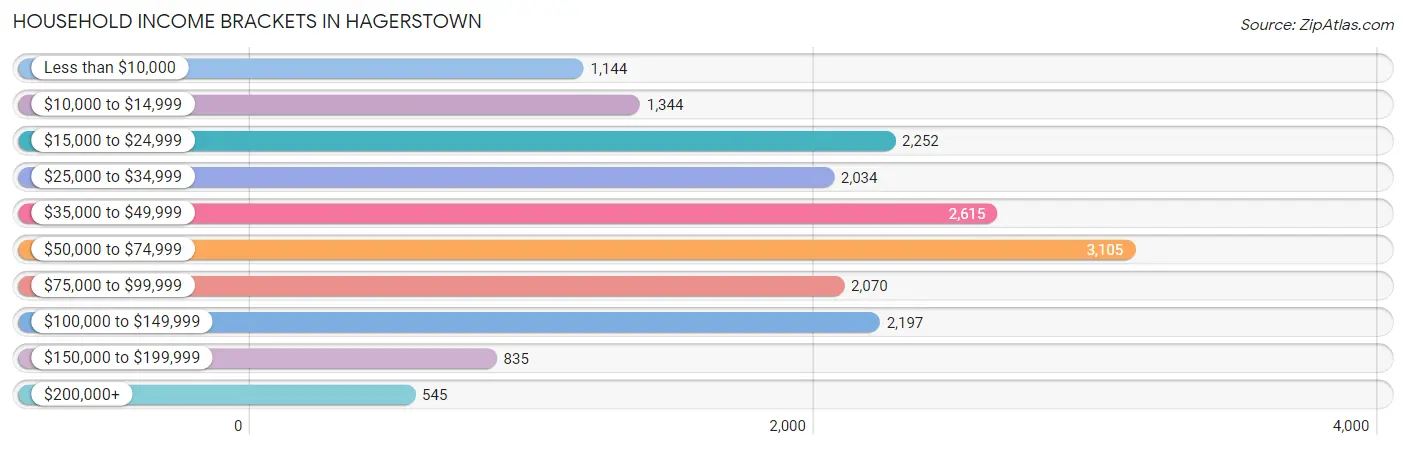
| Income Bracket | # Households | % Households |
| Less than $10,000 | 1,144 | 6.3% |
| $10,000 to $14,999 | 1,344 | 7.4% |
| $15,000 to $24,999 | 2,252 | 12.4% |
| $25,000 to $34,999 | 2,034 | 11.2% |
| $35,000 to $49,999 | 2,615 | 14.4% |
| $50,000 to $74,999 | 3,105 | 17.1% |
| $75,000 to $99,999 | 2,070 | 11.4% |
| $100,000 to $149,999 | 2,197 | 12.1% |
| $150,000 to $199,999 | 835 | 4.6% |
| $200,000+ | 545 | 3.0% |
Household Income by Householder Age in Hagerstown
The median household income in Hagerstown is $48,481, with the highest median household income of $56,438 found in the 25 to 44 years age bracket for the primary householder. A total of 6,499 households (35.8%) fall into this category. Meanwhile, the 15 to 24 years age bracket for the primary householder has the lowest median household income of $0, with 741 households (4.1%) in this group.
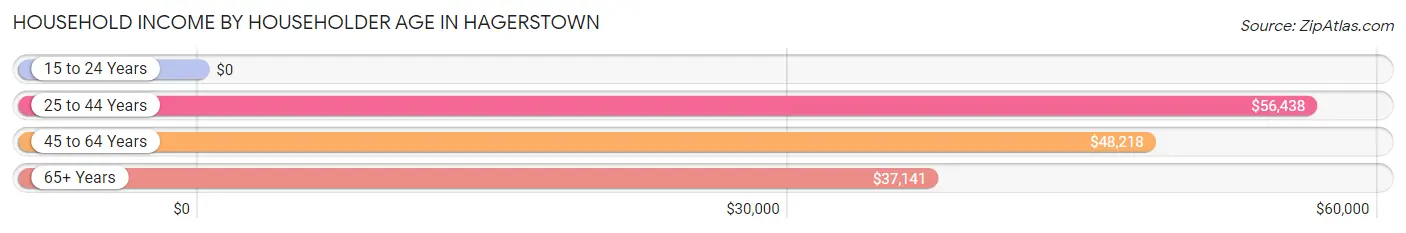
| Income Bracket | # Households | Median Income |
| 15 to 24 Years | 741 (4.1%) | $0 |
| 25 to 44 Years | 6,499 (35.8%) | $56,438 |
| 45 to 64 Years | 7,044 (38.8%) | $48,218 |
| 65+ Years | 3,875 (21.3%) | $37,141 |
| Total | 18,159 (100.0%) | $48,481 |
Poverty in Hagerstown
Income Below Poverty by Sex and Age in Hagerstown
With 21.0% poverty level for males and 24.6% for females among the residents of Hagerstown, 16 and 17 year old males and 15 year old females are the most vulnerable to poverty, with 192 males (44.1%) and 179 females (73.1%) in their respective age groups living below the poverty level.
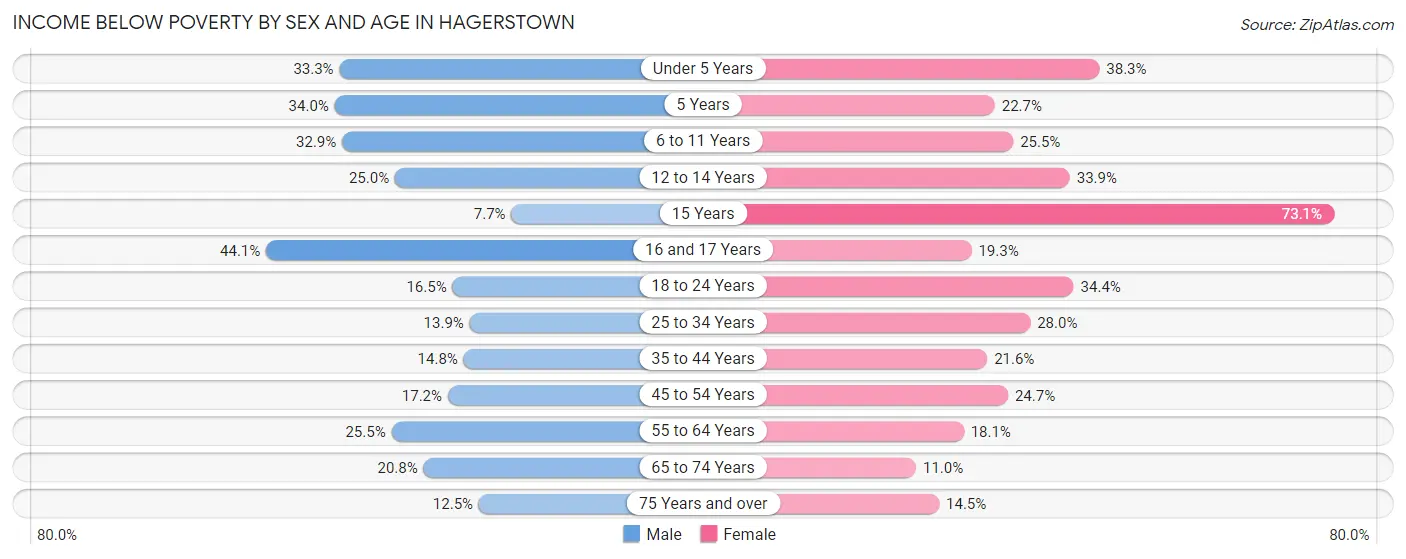
| Age Bracket | Male | Female |
| Under 5 Years | 518 (33.3%) | 640 (38.3%) |
| 5 Years | 198 (34.0%) | 87 (22.7%) |
| 6 to 11 Years | 564 (32.9%) | 484 (25.5%) |
| 12 to 14 Years | 176 (25.0%) | 255 (33.9%) |
| 15 Years | 34 (7.7%) | 179 (73.1%) |
| 16 and 17 Years | 192 (44.1%) | 110 (19.3%) |
| 18 to 24 Years | 330 (16.5%) | 490 (34.4%) |
| 25 to 34 Years | 403 (13.9%) | 983 (28.0%) |
| 35 to 44 Years | 406 (14.8%) | 561 (21.6%) |
| 45 to 54 Years | 454 (17.2%) | 695 (24.7%) |
| 55 to 64 Years | 622 (25.5%) | 458 (18.1%) |
| 65 to 74 Years | 337 (20.8%) | 202 (11.0%) |
| 75 Years and over | 121 (12.5%) | 218 (14.4%) |
| Total | 4,355 (21.0%) | 5,362 (24.6%) |
Income Above Poverty by Sex and Age in Hagerstown
According to the poverty statistics in Hagerstown, males aged 15 years and females aged 65 to 74 years are the age groups that are most secure financially, with 92.3% of males and 89.0% of females in these age groups living above the poverty line.
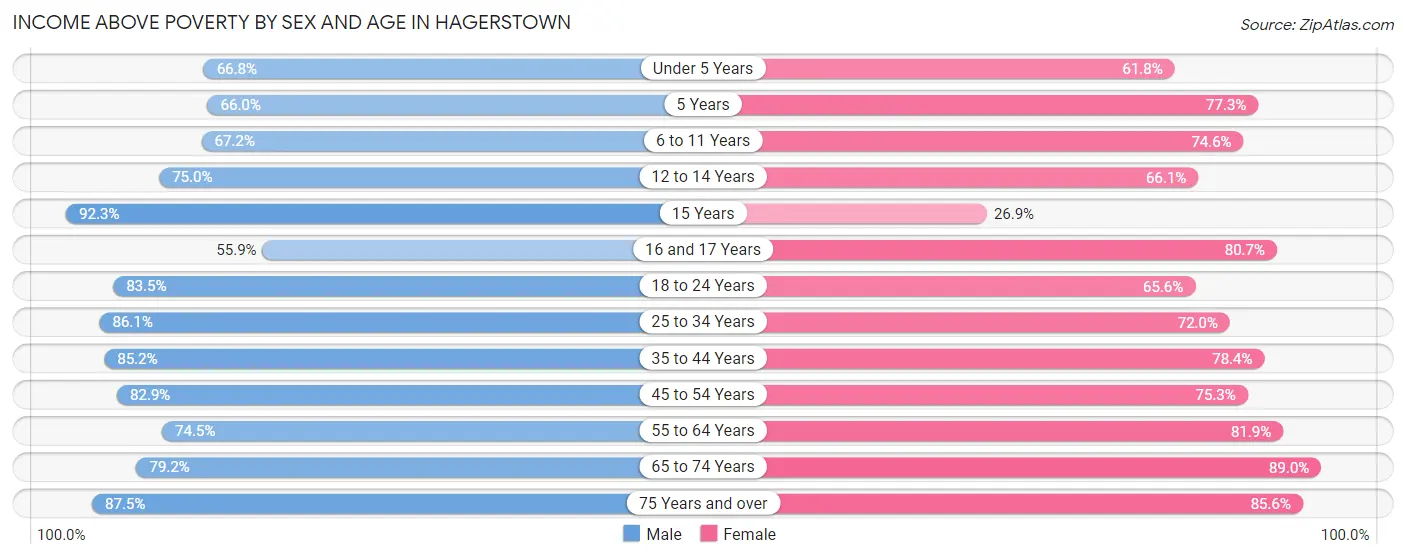
| Age Bracket | Male | Female |
| Under 5 Years | 1,040 (66.7%) | 1,033 (61.8%) |
| 5 Years | 385 (66.0%) | 296 (77.3%) |
| 6 to 11 Years | 1,153 (67.1%) | 1,418 (74.6%) |
| 12 to 14 Years | 528 (75.0%) | 498 (66.1%) |
| 15 Years | 407 (92.3%) | 66 (26.9%) |
| 16 and 17 Years | 243 (55.9%) | 461 (80.7%) |
| 18 to 24 Years | 1,675 (83.5%) | 933 (65.6%) |
| 25 to 34 Years | 2,495 (86.1%) | 2,530 (72.0%) |
| 35 to 44 Years | 2,337 (85.2%) | 2,038 (78.4%) |
| 45 to 54 Years | 2,194 (82.9%) | 2,121 (75.3%) |
| 55 to 64 Years | 1,815 (74.5%) | 2,073 (81.9%) |
| 65 to 74 Years | 1,286 (79.2%) | 1,630 (89.0%) |
| 75 Years and over | 844 (87.5%) | 1,291 (85.6%) |
| Total | 16,402 (79.0%) | 16,388 (75.3%) |
Income Below Poverty Among Married-Couple Families in Hagerstown
The poverty statistics for married-couple families in Hagerstown show that 5.5% or 315 of the total 5,740 families live below the poverty line. Families with 5 or more children have the highest poverty rate of 80.6%, comprising of 50 families. On the other hand, families with 3 or 4 children have the lowest poverty rate of 3.1%, which includes 28 families.
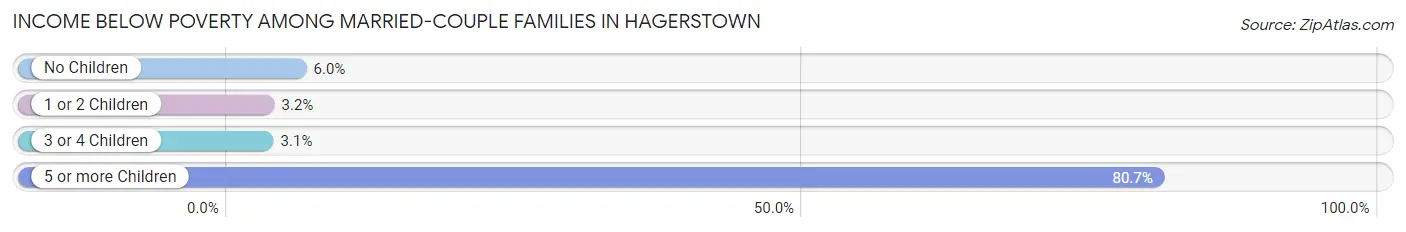
| Children | Above Poverty | Below Poverty |
| No Children | 2,866 (94.0%) | 182 (6.0%) |
| 1 or 2 Children | 1,672 (96.8%) | 55 (3.2%) |
| 3 or 4 Children | 875 (96.9%) | 28 (3.1%) |
| 5 or more Children | 12 (19.4%) | 50 (80.6%) |
| Total | 5,425 (94.5%) | 315 (5.5%) |
Income Below Poverty Among Single-Parent Households in Hagerstown
According to the poverty data in Hagerstown, 24.0% or 240 single-father households and 39.7% or 1,276 single-mother households are living below the poverty line. Among single-father households, those with 5 or more children have the highest poverty rate, with 27 households (100.0%) experiencing poverty. Likewise, among single-mother households, those with 3 or 4 children have the highest poverty rate, with 485 households (58.1%) falling below the poverty line.
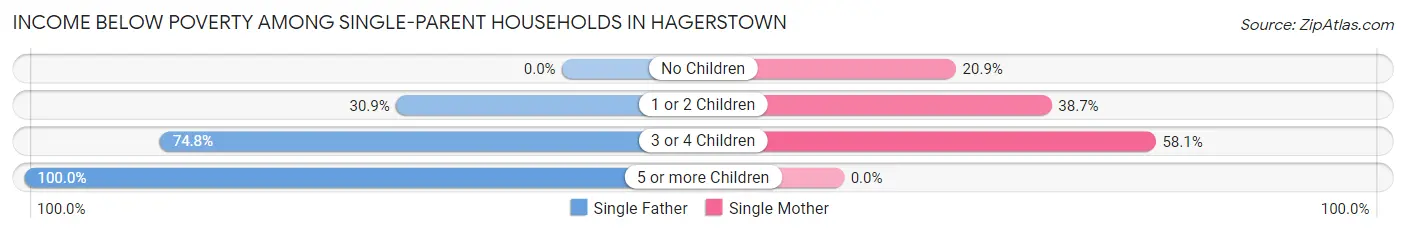
| Children | Single Father | Single Mother |
| No Children | 0 (0.0%) | 151 (20.9%) |
| 1 or 2 Children | 115 (30.9%) | 640 (38.7%) |
| 3 or 4 Children | 98 (74.8%) | 485 (58.1%) |
| 5 or more Children | 27 (100.0%) | 0 (0.0%) |
| Total | 240 (24.0%) | 1,276 (39.7%) |
Income Below Poverty Among Married-Couple vs Single-Parent Households in Hagerstown
The poverty data for Hagerstown shows that 315 of the married-couple family households (5.5%) and 1,516 of the single-parent households (36.0%) are living below the poverty level. Within the married-couple family households, those with 5 or more children have the highest poverty rate, with 50 households (80.6%) falling below the poverty line. Among the single-parent households, those with 5 or more children have the highest poverty rate, with 27 household (100.0%) living below poverty.
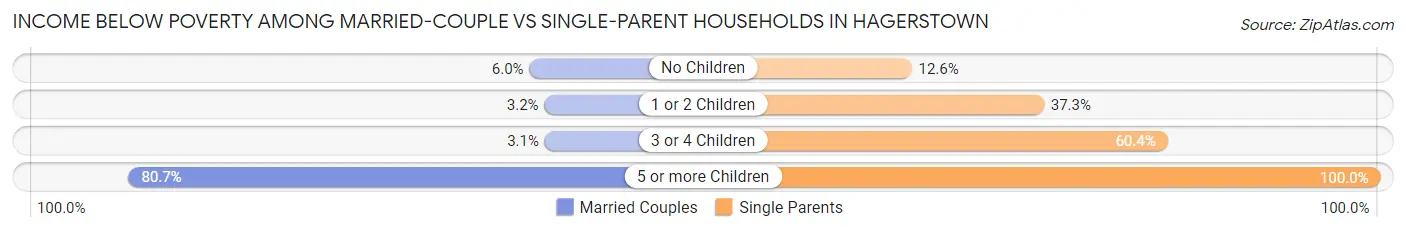
| Children | Married-Couple Families | Single-Parent Households |
| No Children | 182 (6.0%) | 151 (12.6%) |
| 1 or 2 Children | 55 (3.2%) | 755 (37.3%) |
| 3 or 4 Children | 28 (3.1%) | 583 (60.4%) |
| 5 or more Children | 50 (80.6%) | 27 (100.0%) |
| Total | 315 (5.5%) | 1,516 (36.0%) |
Race in Hagerstown
The most populous races in Hagerstown are White / Caucasian (27,801 | 64.1%), Black / African American (9,192 | 21.2%), and Two or more Races (4,742 | 10.9%).
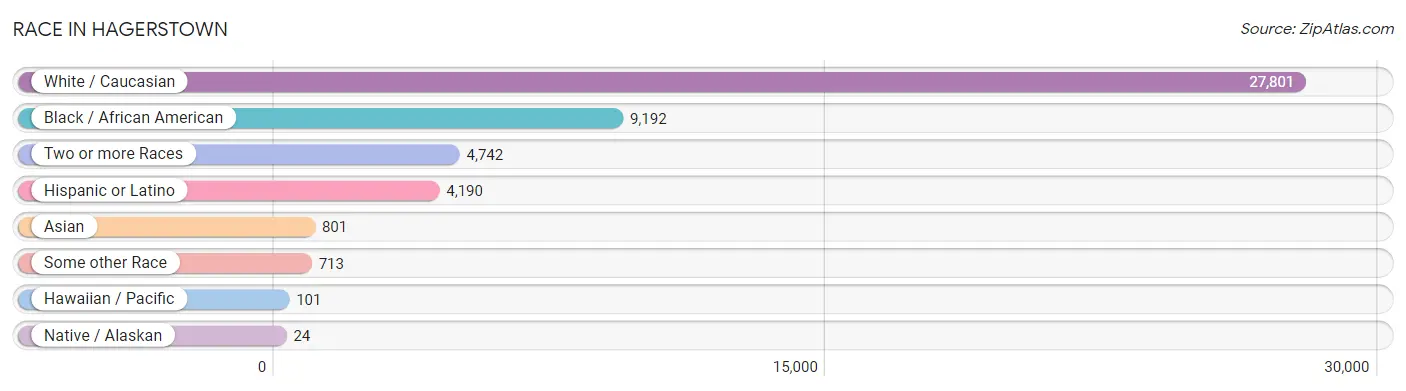
| Race | # Population | % Population |
| Asian | 801 | 1.8% |
| Black / African American | 9,192 | 21.2% |
| Hawaiian / Pacific | 101 | 0.2% |
| Hispanic or Latino | 4,190 | 9.7% |
| Native / Alaskan | 24 | 0.1% |
| White / Caucasian | 27,801 | 64.1% |
| Two or more Races | 4,742 | 10.9% |
| Some other Race | 713 | 1.6% |
| Total | 43,374 | 100.0% |
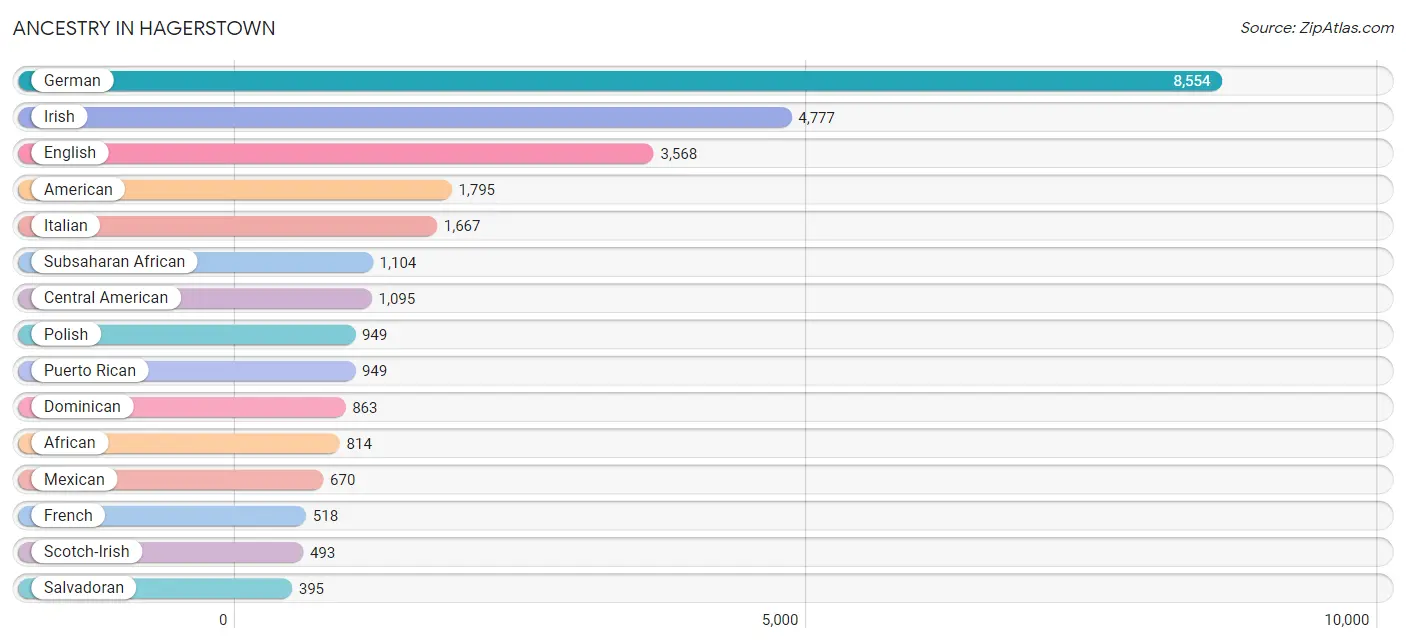
Ancestry in Hagerstown
The most populous ancestries reported in Hagerstown are German (8,554 | 19.7%), Irish (4,777 | 11.0%), English (3,568 | 8.2%), American (1,795 | 4.1%), and Italian (1,667 | 3.8%), together accounting for 46.9% of all Hagerstown residents.
| Ancestry | # Population | % Population |
| African | 814 | 1.9% |
| American | 1,795 | 4.1% |
| Arab | 50 | 0.1% |
| Argentinean | 1 | 0.0% |
| Australian | 5 | 0.0% |
| Austrian | 5 | 0.0% |
| Barbadian | 45 | 0.1% |
| Belgian | 18 | 0.0% |
| Bhutanese | 143 | 0.3% |
| Blackfeet | 132 | 0.3% |
| British | 177 | 0.4% |
| Burmese | 67 | 0.2% |
| Canadian | 8 | 0.0% |
| Cape Verdean | 7 | 0.0% |
| Celtic | 21 | 0.1% |
| Central American | 1,095 | 2.5% |
| Cherokee | 333 | 0.8% |
| Chilean | 4 | 0.0% |
| Chippewa | 4 | 0.0% |
| Colombian | 110 | 0.3% |
| Croatian | 14 | 0.0% |
| Cuban | 64 | 0.2% |
| Czech | 74 | 0.2% |
| Czechoslovakian | 20 | 0.1% |
| Danish | 21 | 0.1% |
| Dominican | 863 | 2.0% |
| Dutch | 175 | 0.4% |
| Dutch West Indian | 7 | 0.0% |
| Eastern European | 144 | 0.3% |
| Ecuadorian | 3 | 0.0% |
| Egyptian | 8 | 0.0% |
| English | 3,568 | 8.2% |
| European | 217 | 0.5% |
| French | 518 | 1.2% |
| French Canadian | 13 | 0.0% |
| German | 8,554 | 19.7% |
| Ghanaian | 18 | 0.0% |
| Greek | 77 | 0.2% |
| Guamanian / Chamorro | 70 | 0.2% |
| Guatemalan | 208 | 0.5% |
| Haitian | 17 | 0.0% |
| Honduran | 336 | 0.8% |
| Hungarian | 118 | 0.3% |
| Indian (Asian) | 149 | 0.3% |
| Indonesian | 45 | 0.1% |
| Inupiat | 5 | 0.0% |
| Iranian | 28 | 0.1% |
| Irish | 4,777 | 11.0% |
| Iroquois | 24 | 0.1% |
| Italian | 1,667 | 3.8% |
| Jamaican | 71 | 0.2% |
| Korean | 202 | 0.5% |
| Lithuanian | 8 | 0.0% |
| Mexican | 670 | 1.5% |
| Moroccan | 42 | 0.1% |
| Native Hawaiian | 44 | 0.1% |
| Nicaraguan | 10 | 0.0% |
| Northern European | 176 | 0.4% |
| Norwegian | 141 | 0.3% |
| Panamanian | 135 | 0.3% |
| Polish | 949 | 2.2% |
| Portuguese | 186 | 0.4% |
| Puerto Rican | 949 | 2.2% |
| Romanian | 39 | 0.1% |
| Russian | 271 | 0.6% |
| Salvadoran | 395 | 0.9% |
| Scandinavian | 23 | 0.1% |
| Scotch-Irish | 493 | 1.1% |
| Scottish | 322 | 0.7% |
| Sierra Leonean | 51 | 0.1% |
| Slavic | 10 | 0.0% |
| Slovak | 51 | 0.1% |
| South American | 207 | 0.5% |
| Spaniard | 43 | 0.1% |
| Sri Lankan | 55 | 0.1% |
| Subsaharan African | 1,104 | 2.5% |
| Swedish | 121 | 0.3% |
| Swiss | 86 | 0.2% |
| Thai | 356 | 0.8% |
| Trinidadian and Tobagonian | 12 | 0.0% |
| Ugandan | 15 | 0.0% |
| Ukrainian | 23 | 0.1% |
| Venezuelan | 70 | 0.2% |
| Welsh | 273 | 0.6% |
| West Indian | 10 | 0.0% |
| Yugoslavian | 5 | 0.0% | View All 86 Rows |
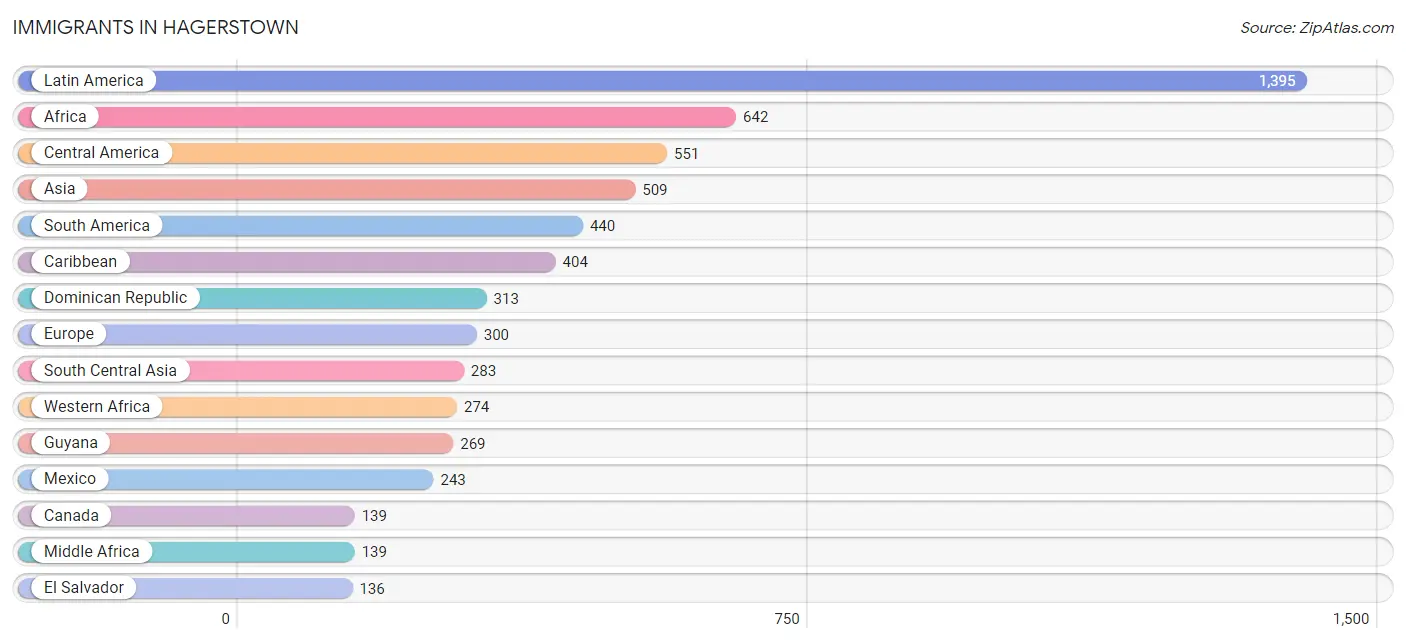
Immigrants in Hagerstown
The most numerous immigrant groups reported in Hagerstown came from Latin America (1,395 | 3.2%), Africa (642 | 1.5%), Central America (551 | 1.3%), Asia (509 | 1.2%), and South America (440 | 1.0%), together accounting for 8.2% of all Hagerstown residents.
| Immigration Origin | # Population | % Population |
| Africa | 642 | 1.5% |
| Asia | 509 | 1.2% |
| Azores | 15 | 0.0% |
| Belarus | 27 | 0.1% |
| Brazil | 41 | 0.1% |
| Cameroon | 121 | 0.3% |
| Canada | 139 | 0.3% |
| Caribbean | 404 | 0.9% |
| Central America | 551 | 1.3% |
| Chile | 4 | 0.0% |
| China | 57 | 0.1% |
| Colombia | 58 | 0.1% |
| Congo | 18 | 0.0% |
| Dominican Republic | 313 | 0.7% |
| Eastern Africa | 37 | 0.1% |
| Eastern Asia | 107 | 0.3% |
| Eastern Europe | 130 | 0.3% |
| Ecuador | 3 | 0.0% |
| Egypt | 8 | 0.0% |
| El Salvador | 136 | 0.3% |
| England | 18 | 0.0% |
| Europe | 300 | 0.7% |
| Germany | 20 | 0.1% |
| Ghana | 99 | 0.2% |
| Guatemala | 62 | 0.1% |
| Guyana | 269 | 0.6% |
| Haiti | 9 | 0.0% |
| Honduras | 110 | 0.3% |
| India | 123 | 0.3% |
| Iran | 17 | 0.0% |
| Ireland | 4 | 0.0% |
| Jamaica | 68 | 0.2% |
| Japan | 28 | 0.1% |
| Korea | 22 | 0.1% |
| Latin America | 1,395 | 3.2% |
| Liberia | 11 | 0.0% |
| Mexico | 243 | 0.6% |
| Middle Africa | 139 | 0.3% |
| Morocco | 16 | 0.0% |
| Netherlands | 8 | 0.0% |
| Northern Africa | 24 | 0.1% |
| Northern Europe | 127 | 0.3% |
| Pakistan | 122 | 0.3% |
| Philippines | 59 | 0.1% |
| Poland | 5 | 0.0% |
| Portugal | 15 | 0.0% |
| Romania | 8 | 0.0% |
| Russia | 34 | 0.1% |
| Sierra Leone | 105 | 0.2% |
| Singapore | 15 | 0.0% |
| South America | 440 | 1.0% |
| South Central Asia | 283 | 0.6% |
| South Eastern Asia | 119 | 0.3% |
| Southern Europe | 15 | 0.0% |
| Sweden | 6 | 0.0% |
| Trinidad and Tobago | 6 | 0.0% |
| Uganda | 15 | 0.0% |
| Ukraine | 56 | 0.1% |
| Uzbekistan | 21 | 0.1% |
| Venezuela | 65 | 0.2% |
| Western Africa | 274 | 0.6% |
| Western Europe | 28 | 0.1% | View All 62 Rows |
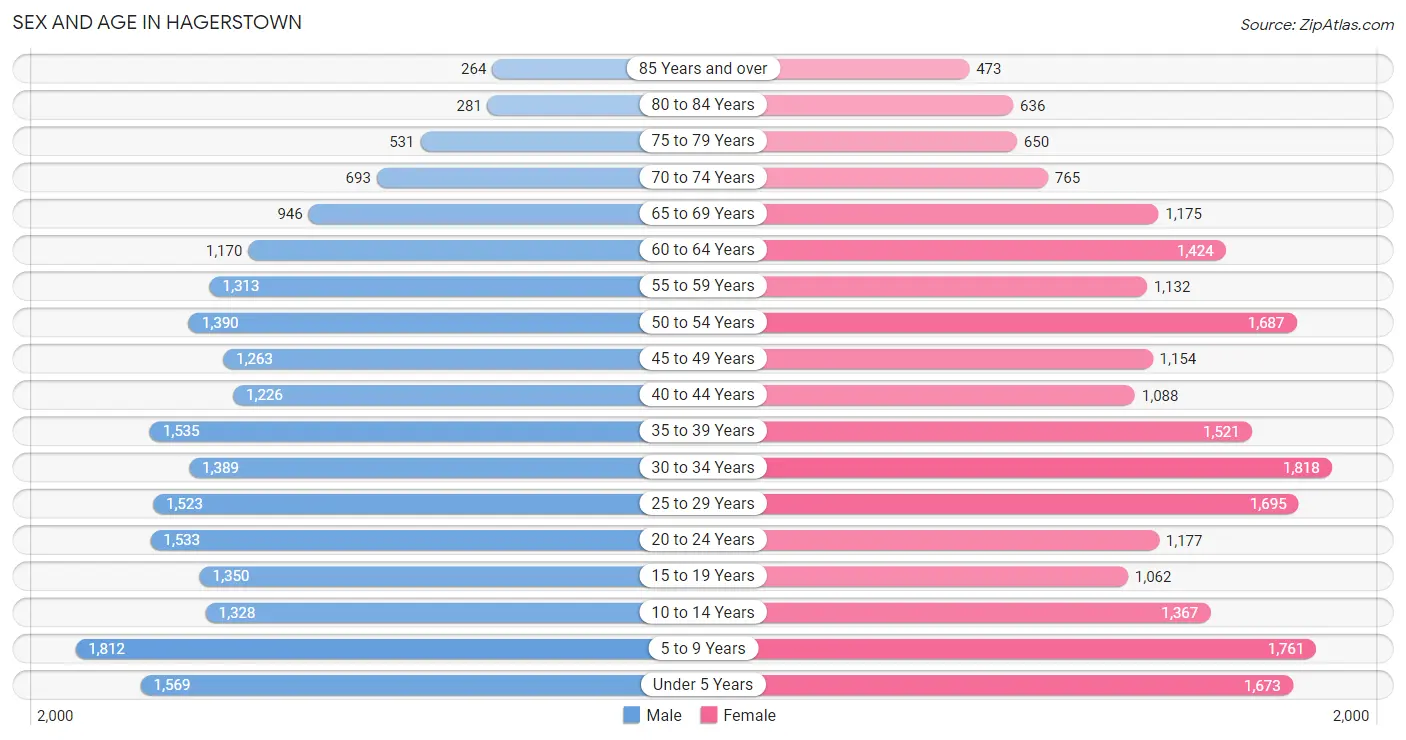
Sex and Age in Hagerstown
Sex and Age in Hagerstown
The most populous age groups in Hagerstown are 5 to 9 Years (1,812 | 8.6%) for men and 30 to 34 Years (1,818 | 8.2%) for women.
| Age Bracket | Male | Female |
| Under 5 Years | 1,569 (7.4%) | 1,673 (7.5%) |
| 5 to 9 Years | 1,812 (8.6%) | 1,761 (7.9%) |
| 10 to 14 Years | 1,328 (6.3%) | 1,367 (6.1%) |
| 15 to 19 Years | 1,350 (6.4%) | 1,062 (4.8%) |
| 20 to 24 Years | 1,533 (7.3%) | 1,177 (5.3%) |
| 25 to 29 Years | 1,523 (7.2%) | 1,695 (7.6%) |
| 30 to 34 Years | 1,389 (6.6%) | 1,818 (8.2%) |
| 35 to 39 Years | 1,535 (7.3%) | 1,521 (6.8%) |
| 40 to 44 Years | 1,226 (5.8%) | 1,088 (4.9%) |
| 45 to 49 Years | 1,263 (6.0%) | 1,154 (5.2%) |
| 50 to 54 Years | 1,390 (6.6%) | 1,687 (7.6%) |
| 55 to 59 Years | 1,313 (6.2%) | 1,132 (5.1%) |
| 60 to 64 Years | 1,170 (5.5%) | 1,424 (6.4%) |
| 65 to 69 Years | 946 (4.5%) | 1,175 (5.3%) |
| 70 to 74 Years | 693 (3.3%) | 765 (3.4%) |
| 75 to 79 Years | 531 (2.5%) | 650 (2.9%) |
| 80 to 84 Years | 281 (1.3%) | 636 (2.9%) |
| 85 Years and over | 264 (1.3%) | 473 (2.1%) |
| Total | 21,116 (100.0%) | 22,258 (100.0%) |
Families and Households in Hagerstown
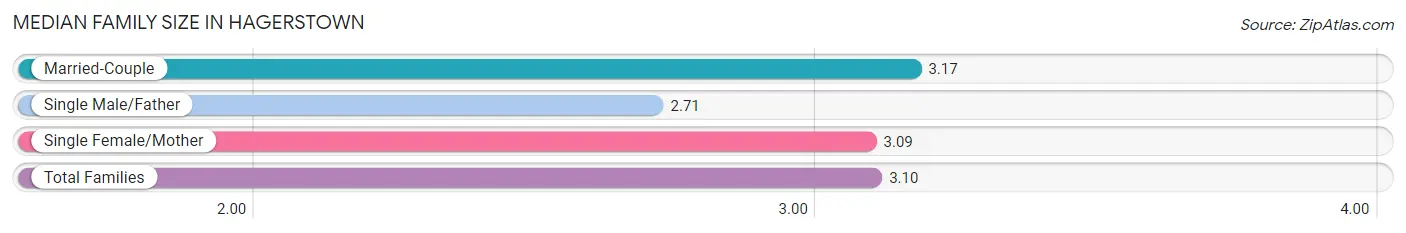
Median Family Size in Hagerstown
The median family size in Hagerstown is 3.10 persons per family, with married-couple families (5,740 | 57.7%) accounting for the largest median family size of 3.17 persons per family. On the other hand, single male/father families (1,001 | 10.1%) represent the smallest median family size with 2.71 persons per family.
| Family Type | # Families | Family Size |
| Married-Couple | 5,740 (57.7%) | 3.17 |
| Single Male/Father | 1,001 (10.1%) | 2.71 |
| Single Female/Mother | 3,213 (32.3%) | 3.09 |
| Total Families | 9,954 (100.0%) | 3.10 |
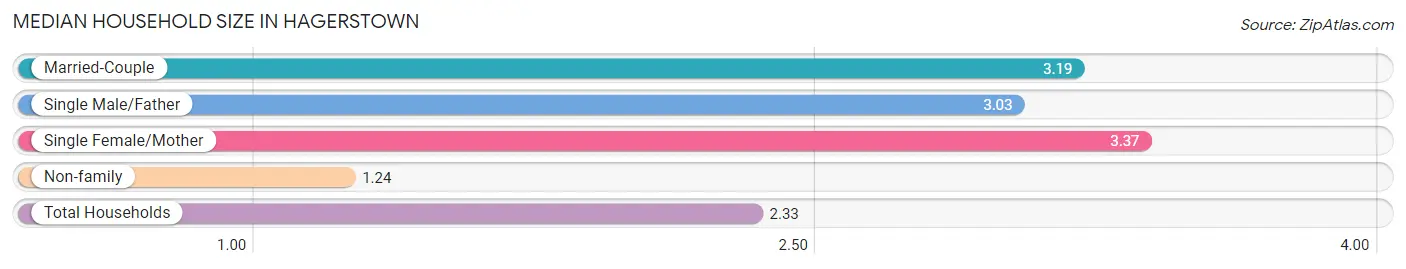
Median Household Size in Hagerstown
The median household size in Hagerstown is 2.33 persons per household, with single female/mother households (3,213 | 17.7%) accounting for the largest median household size of 3.37 persons per household. non-family households (8,205 | 45.2%) represent the smallest median household size with 1.24 persons per household.
| Household Type | # Households | Household Size |
| Married-Couple | 5,740 (31.6%) | 3.19 |
| Single Male/Father | 1,001 (5.5%) | 3.03 |
| Single Female/Mother | 3,213 (17.7%) | 3.37 |
| Non-family | 8,205 (45.2%) | 1.24 |
| Total Households | 18,159 (100.0%) | 2.33 |
Household Size by Marriage Status in Hagerstown
Out of a total of 18,159 households in Hagerstown, 9,954 (54.8%) are family households, while 8,205 (45.2%) are nonfamily households. The most numerous type of family households are 2-person households, comprising 3,577, and the most common type of nonfamily households are 1-person households, comprising 6,772.
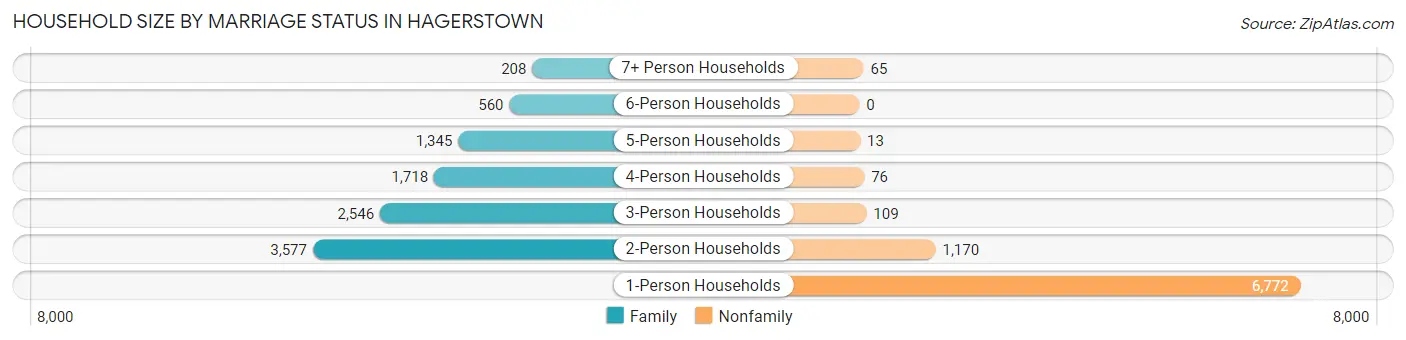
| Household Size | Family Households | Nonfamily Households |
| 1-Person Households | - | 6,772 (37.3%) |
| 2-Person Households | 3,577 (19.7%) | 1,170 (6.4%) |
| 3-Person Households | 2,546 (14.0%) | 109 (0.6%) |
| 4-Person Households | 1,718 (9.5%) | 76 (0.4%) |
| 5-Person Households | 1,345 (7.4%) | 13 (0.1%) |
| 6-Person Households | 560 (3.1%) | 0 (0.0%) |
| 7+ Person Households | 208 (1.1%) | 65 (0.4%) |
| Total | 9,954 (54.8%) | 8,205 (45.2%) |
Female Fertility in Hagerstown
Fertility by Age in Hagerstown
Average fertility rate in Hagerstown is 81.0 births per 1,000 women. Women in the age bracket of 20 to 34 years have the highest fertility rate with 137.0 births per 1,000 women. Women in the age bracket of 20 to 34 years acount for 80.8% of all women with births.
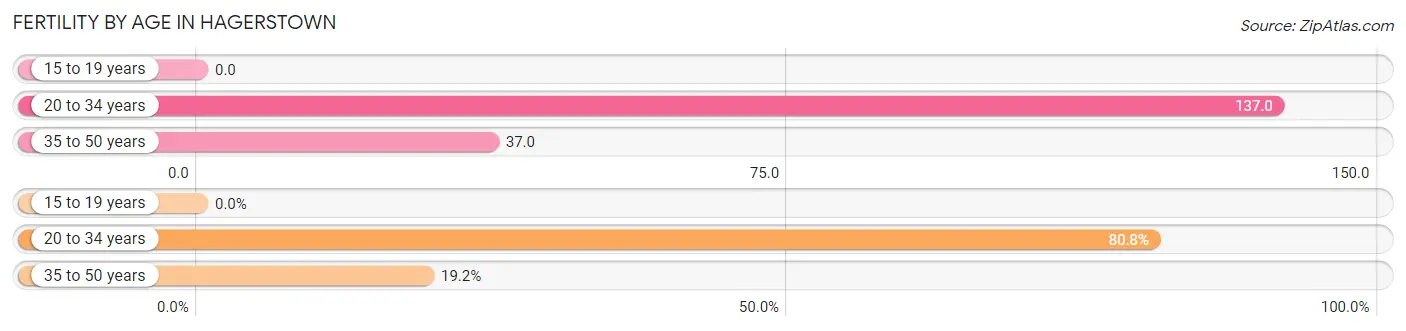
| Age Bracket | Women with Births | Births / 1,000 Women |
| 15 to 19 years | 0 (0.0%) | 0.0 |
| 20 to 34 years | 641 (80.8%) | 137.0 |
| 35 to 50 years | 152 (19.2%) | 37.0 |
| Total | 793 (100.0%) | 81.0 |
Fertility by Age by Marriage Status in Hagerstown
40.5% of women with births (793) in Hagerstown are married. The highest percentage of unmarried women with births falls into 35 to 50 years age bracket with 64.5% of them unmarried at the time of birth, while the lowest percentage of unmarried women with births belong to 20 to 34 years age bracket with 58.4% of them unmarried.
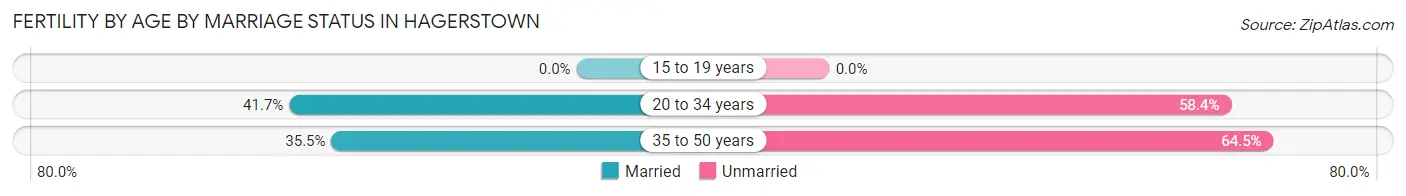
| Age Bracket | Married | Unmarried |
| 15 to 19 years | 0 (0.0%) | 0 (0.0%) |
| 20 to 34 years | 267 (41.6%) | 374 (58.4%) |
| 35 to 50 years | 54 (35.5%) | 98 (64.5%) |
| Total | 321 (40.5%) | 472 (59.5%) |
Fertility by Education in Hagerstown
Average fertility rate in Hagerstown is 81.0 births per 1,000 women. Women with the education attainment of graduate degree have the highest fertility rate of 213.0 births per 1,000 women, while women with the education attainment of college or associate's degree have the lowest fertility at 38.0 births per 1,000 women. Women with the education attainment of high school diploma represent 42.1% of all women with births.
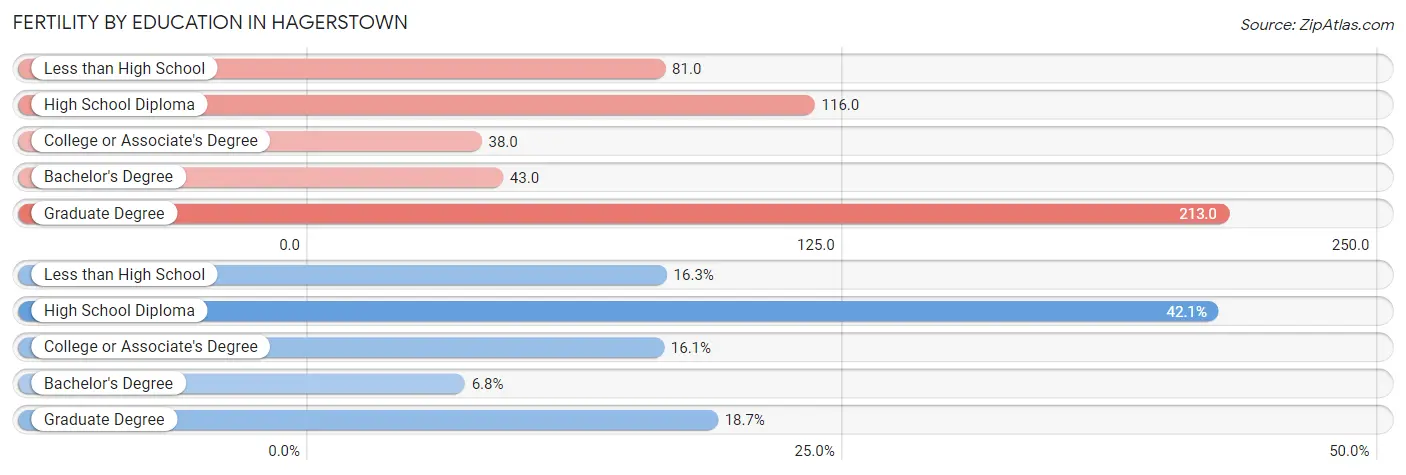
| Educational Attainment | Women with Births | Births / 1,000 Women |
| Less than High School | 129 (16.3%) | 81.0 |
| High School Diploma | 334 (42.1%) | 116.0 |
| College or Associate's Degree | 128 (16.1%) | 38.0 |
| Bachelor's Degree | 54 (6.8%) | 43.0 |
| Graduate Degree | 148 (18.7%) | 213.0 |
| Total | 793 (100.0%) | 81.0 |
Fertility by Education by Marriage Status in Hagerstown
59.5% of women with births in Hagerstown are unmarried. Women with the educational attainment of graduate degree are most likely to be married with 87.8% of them married at childbirth, while women with the educational attainment of less than high school are least likely to be married with 100.0% of them unmarried at childbirth.
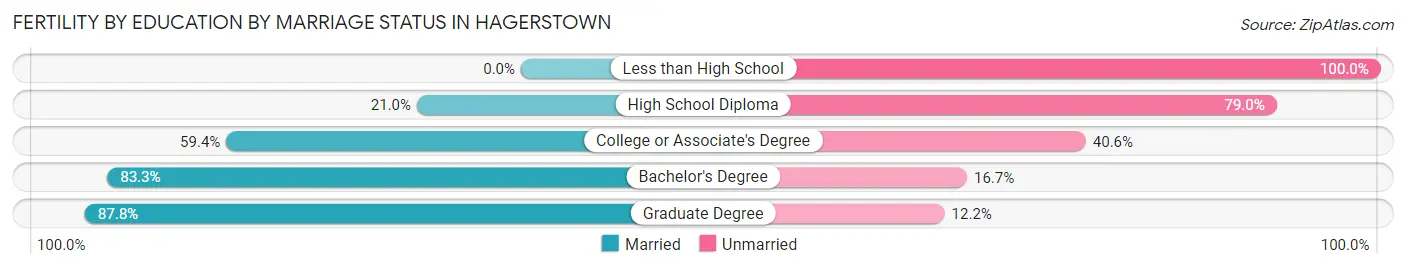
| Educational Attainment | Married | Unmarried |
| Less than High School | 0 (0.0%) | 129 (100.0%) |
| High School Diploma | 70 (21.0%) | 264 (79.0%) |
| College or Associate's Degree | 76 (59.4%) | 52 (40.6%) |
| Bachelor's Degree | 45 (83.3%) | 9 (16.7%) |
| Graduate Degree | 130 (87.8%) | 18 (12.2%) |
| Total | 321 (40.5%) | 472 (59.5%) |
Employment Characteristics in Hagerstown
Employment by Class of Employer in Hagerstown
Among the 18,191 employed individuals in Hagerstown, private company employees (12,637 | 69.5%), not-for-profit organizations (1,853 | 10.2%), and local government employees (1,130 | 6.2%) make up the most common classes of employment.
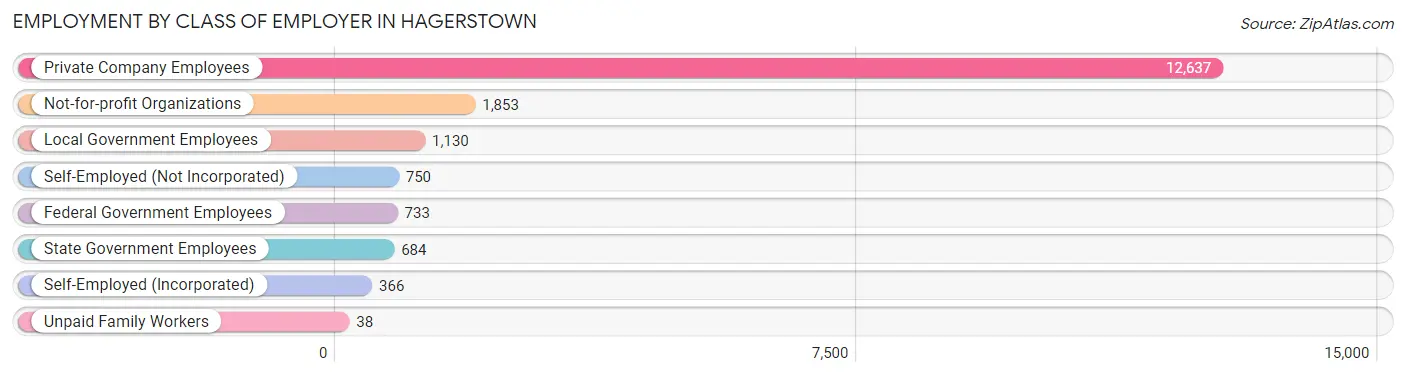
| Employer Class | # Employees | % Employees |
| Private Company Employees | 12,637 | 69.5% |
| Self-Employed (Incorporated) | 366 | 2.0% |
| Self-Employed (Not Incorporated) | 750 | 4.1% |
| Not-for-profit Organizations | 1,853 | 10.2% |
| Local Government Employees | 1,130 | 6.2% |
| State Government Employees | 684 | 3.8% |
| Federal Government Employees | 733 | 4.0% |
| Unpaid Family Workers | 38 | 0.2% |
| Total | 18,191 | 100.0% |
Employment Status by Age in Hagerstown
According to the labor force statistics for Hagerstown, out of the total population over 16 years of age (33,178), 60.6% or 20,106 individuals are in the labor force, with 7.7% or 1,548 of them unemployed. The age group with the highest labor force participation rate is 35 to 44 years, with 84.0% or 4,511 individuals in the labor force. Within the labor force, the 16 to 19 years age range has the highest percentage of unemployed individuals, with 18.6% or 150 of them being unemployed.
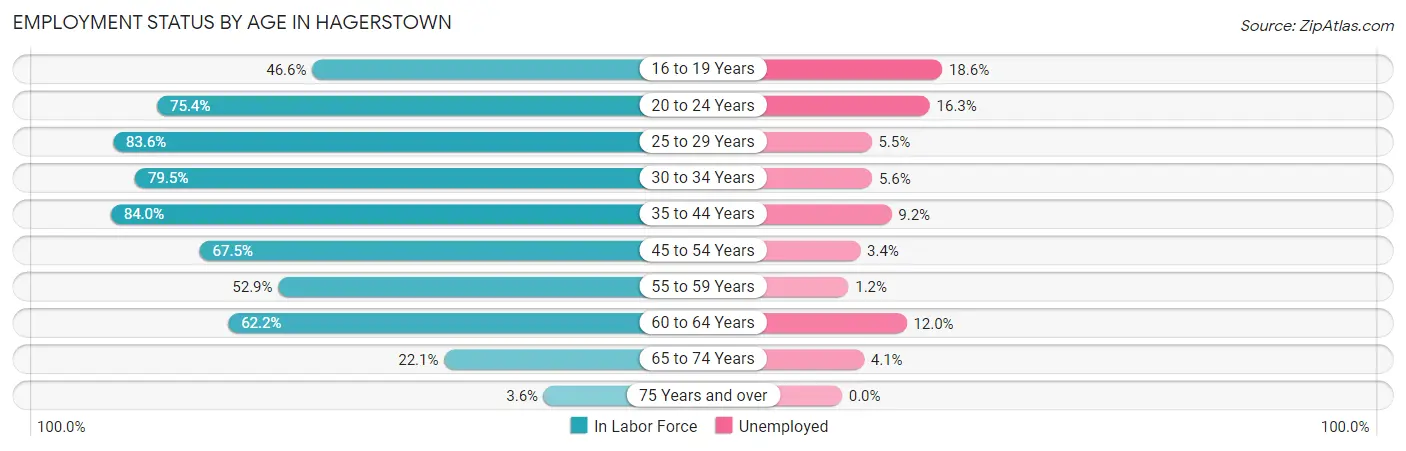
| Age Bracket | In Labor Force | Unemployed |
| 16 to 19 Years | 804 (46.6%) | 150 (18.6%) |
| 20 to 24 Years | 2,043 (75.4%) | 333 (16.3%) |
| 25 to 29 Years | 2,690 (83.6%) | 148 (5.5%) |
| 30 to 34 Years | 2,550 (79.5%) | 143 (5.6%) |
| 35 to 44 Years | 4,511 (84.0%) | 415 (9.2%) |
| 45 to 54 Years | 3,708 (67.5%) | 126 (3.4%) |
| 55 to 59 Years | 1,293 (52.9%) | 16 (1.2%) |
| 60 to 64 Years | 1,613 (62.2%) | 194 (12.0%) |
| 65 to 74 Years | 791 (22.1%) | 32 (4.1%) |
| 75 Years and over | 102 (3.6%) | 0 (0.0%) |
| Total | 20,106 (60.6%) | 1,548 (7.7%) |
Employment Status by Educational Attainment in Hagerstown
According to labor force statistics for Hagerstown, 73.3% of individuals (16,366) out of the total population between 25 and 64 years of age (22,328) are in the labor force, with 6.4% or 1,047 of them being unemployed. The group with the highest labor force participation rate are those with the educational attainment of bachelor's degree or higher, with 83.5% or 3,828 individuals in the labor force. Within the labor force, individuals with high school diploma education have the highest percentage of unemployment, with 8.9% or 506 of them being unemployed.
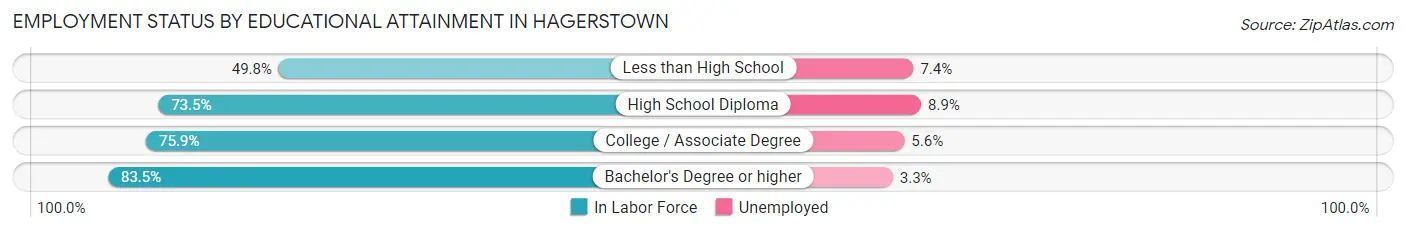
| Educational Attainment | In Labor Force | Unemployed |
| Less than High School | 1,419 (49.8%) | 211 (7.4%) |
| High School Diploma | 5,690 (73.5%) | 689 (8.9%) |
| College / Associate Degree | 5,428 (75.9%) | 401 (5.6%) |
| Bachelor's Degree or higher | 3,828 (83.5%) | 151 (3.3%) |
| Total | 16,366 (73.3%) | 1,429 (6.4%) |
Employment Occupations by Sex in Hagerstown
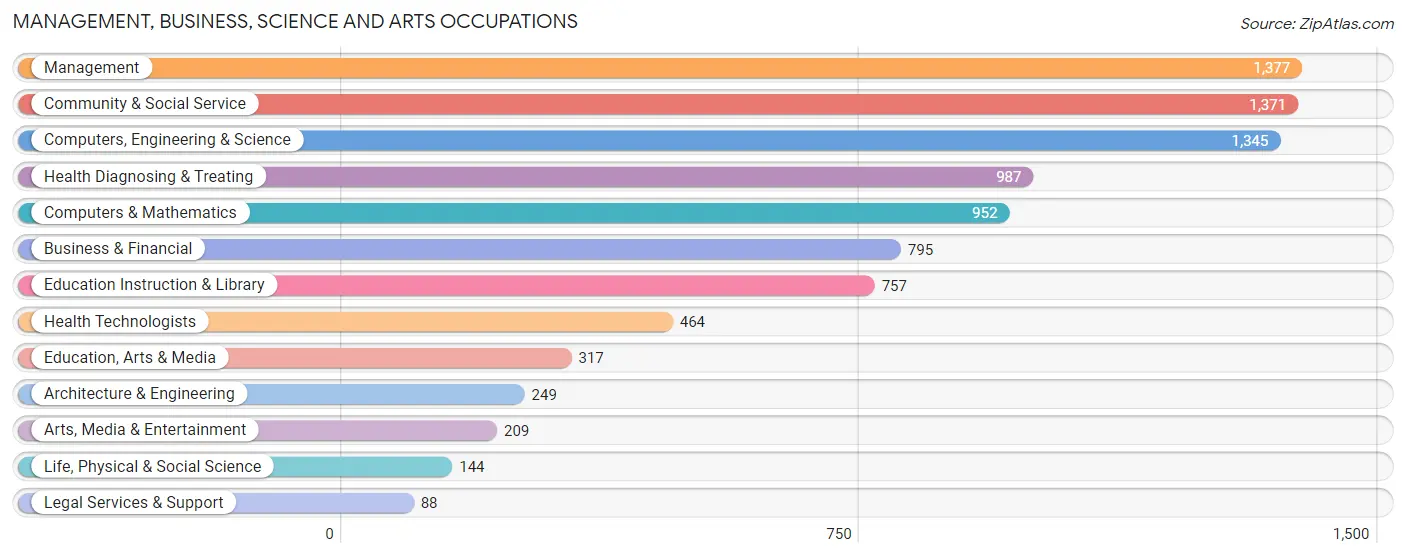
Management, Business, Science and Arts Occupations
The most common Management, Business, Science and Arts occupations in Hagerstown are Management (1,377 | 7.5%), Community & Social Service (1,371 | 7.4%), Computers, Engineering & Science (1,345 | 7.3%), Health Diagnosing & Treating (987 | 5.3%), and Computers & Mathematics (952 | 5.2%).
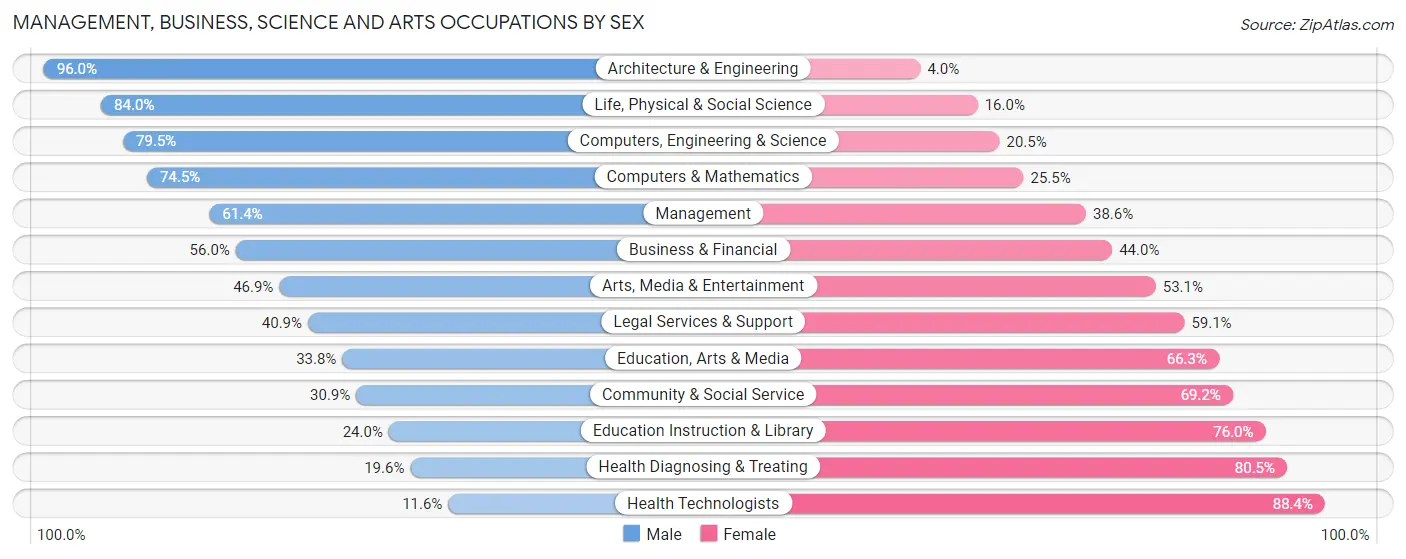
Management, Business, Science and Arts Occupations by Sex
Within the Management, Business, Science and Arts occupations in Hagerstown, the most male-oriented occupations are Architecture & Engineering (96.0%), Life, Physical & Social Science (84.0%), and Computers, Engineering & Science (79.5%), while the most female-oriented occupations are Health Technologists (88.4%), Health Diagnosing & Treating (80.4%), and Education Instruction & Library (76.0%).
| Occupation | Male | Female |
| Management | 846 (61.4%) | 531 (38.6%) |
| Business & Financial | 445 (56.0%) | 350 (44.0%) |
| Computers, Engineering & Science | 1,069 (79.5%) | 276 (20.5%) |
| Computers & Mathematics | 709 (74.5%) | 243 (25.5%) |
| Architecture & Engineering | 239 (96.0%) | 10 (4.0%) |
| Life, Physical & Social Science | 121 (84.0%) | 23 (16.0%) |
| Community & Social Service | 423 (30.8%) | 948 (69.2%) |
| Education, Arts & Media | 107 (33.8%) | 210 (66.2%) |
| Legal Services & Support | 36 (40.9%) | 52 (59.1%) |
| Education Instruction & Library | 182 (24.0%) | 575 (76.0%) |
| Arts, Media & Entertainment | 98 (46.9%) | 111 (53.1%) |
| Health Diagnosing & Treating | 193 (19.6%) | 794 (80.4%) |
| Health Technologists | 54 (11.6%) | 410 (88.4%) |
| Total (Category) | 2,976 (50.7%) | 2,899 (49.3%) |
| Total (Overall) | 9,647 (52.3%) | 8,800 (47.7%) |
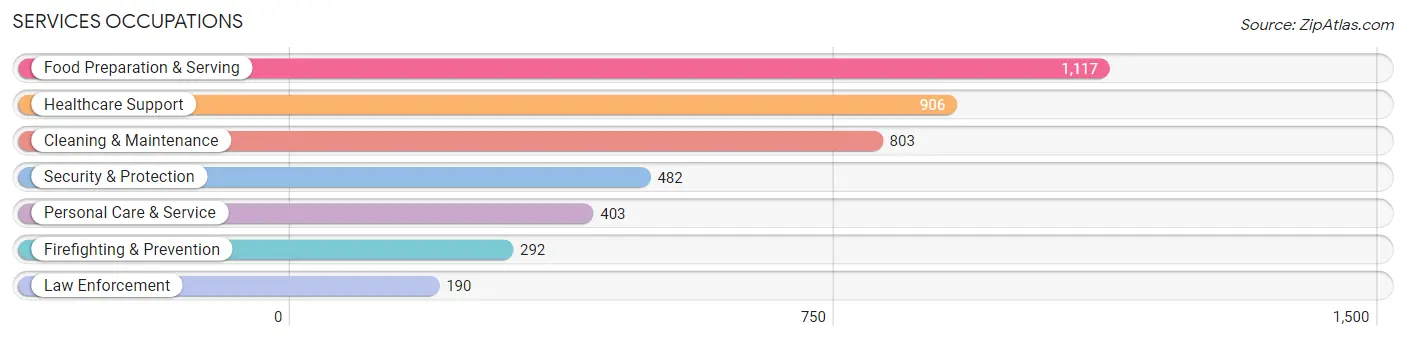
Services Occupations
The most common Services occupations in Hagerstown are Food Preparation & Serving (1,117 | 6.1%), Healthcare Support (906 | 4.9%), Cleaning & Maintenance (803 | 4.3%), Security & Protection (482 | 2.6%), and Personal Care & Service (403 | 2.2%).
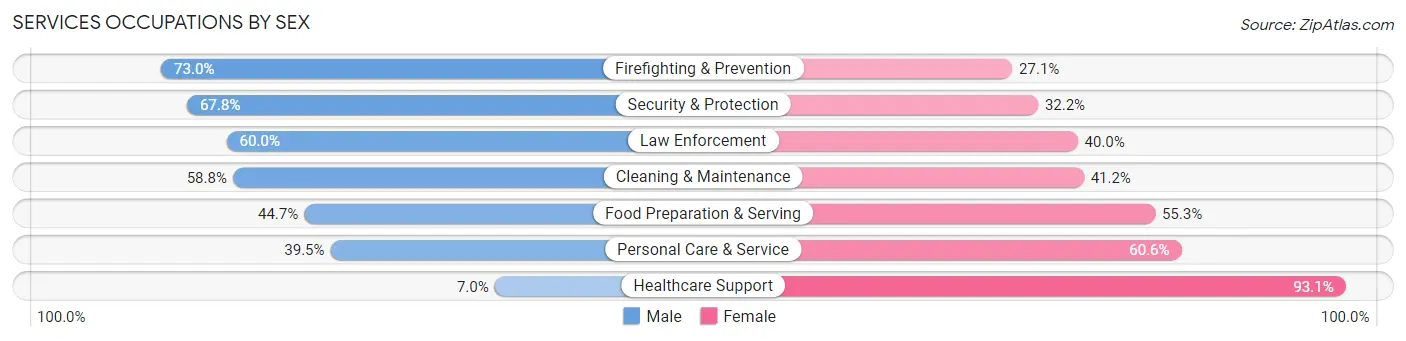
Services Occupations by Sex
Within the Services occupations in Hagerstown, the most male-oriented occupations are Firefighting & Prevention (73.0%), Security & Protection (67.8%), and Law Enforcement (60.0%), while the most female-oriented occupations are Healthcare Support (93.0%), Personal Care & Service (60.6%), and Food Preparation & Serving (55.3%).
| Occupation | Male | Female |
| Healthcare Support | 63 (7.0%) | 843 (93.0%) |
| Security & Protection | 327 (67.8%) | 155 (32.2%) |
| Firefighting & Prevention | 213 (73.0%) | 79 (27.1%) |
| Law Enforcement | 114 (60.0%) | 76 (40.0%) |
| Food Preparation & Serving | 499 (44.7%) | 618 (55.3%) |
| Cleaning & Maintenance | 472 (58.8%) | 331 (41.2%) |
| Personal Care & Service | 159 (39.5%) | 244 (60.6%) |
| Total (Category) | 1,520 (41.0%) | 2,191 (59.0%) |
| Total (Overall) | 9,647 (52.3%) | 8,800 (47.7%) |
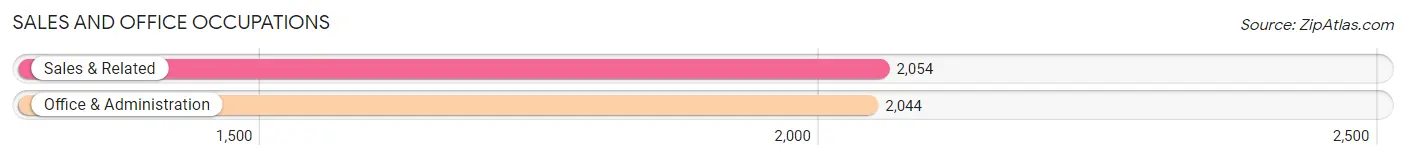
Sales and Office Occupations
The most common Sales and Office occupations in Hagerstown are Sales & Related (2,054 | 11.1%), and Office & Administration (2,044 | 11.1%).
Sales and Office Occupations by Sex
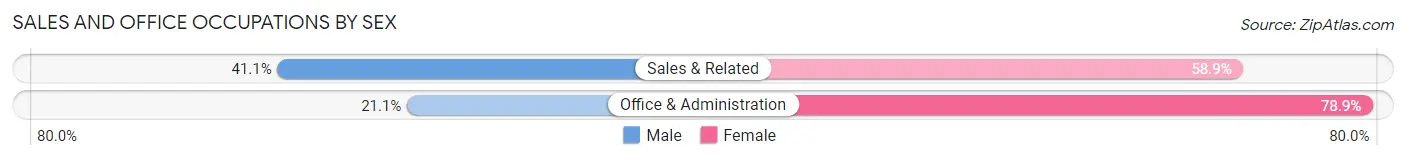
| Occupation | Male | Female |
| Sales & Related | 844 (41.1%) | 1,210 (58.9%) |
| Office & Administration | 432 (21.1%) | 1,612 (78.9%) |
| Total (Category) | 1,276 (31.1%) | 2,822 (68.9%) |
| Total (Overall) | 9,647 (52.3%) | 8,800 (47.7%) |
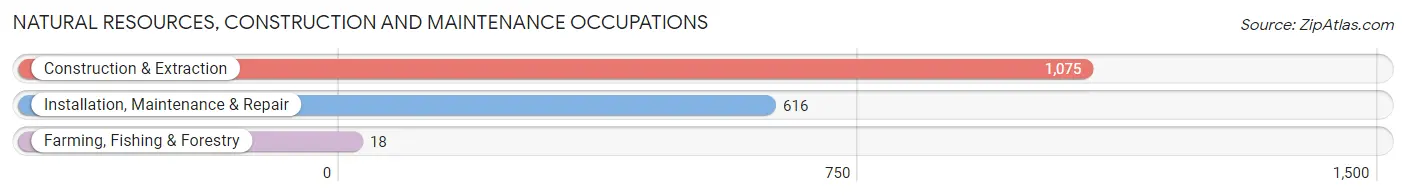
Natural Resources, Construction and Maintenance Occupations
The most common Natural Resources, Construction and Maintenance occupations in Hagerstown are Construction & Extraction (1,075 | 5.8%), Installation, Maintenance & Repair (616 | 3.3%), and Farming, Fishing & Forestry (18 | 0.1%).
Natural Resources, Construction and Maintenance Occupations by Sex
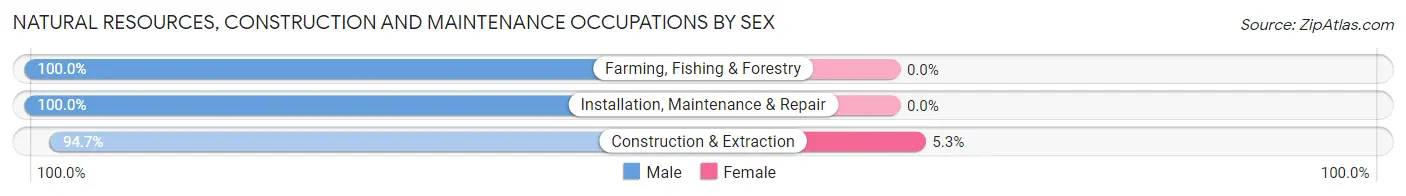
| Occupation | Male | Female |
| Farming, Fishing & Forestry | 18 (100.0%) | 0 (0.0%) |
| Construction & Extraction | 1,018 (94.7%) | 57 (5.3%) |
| Installation, Maintenance & Repair | 616 (100.0%) | 0 (0.0%) |
| Total (Category) | 1,652 (96.7%) | 57 (3.3%) |
| Total (Overall) | 9,647 (52.3%) | 8,800 (47.7%) |
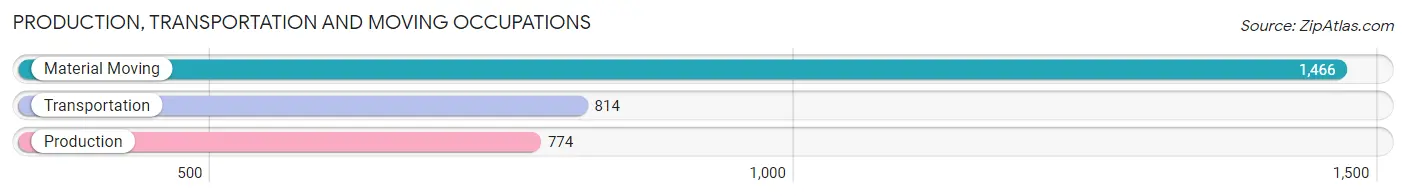
Production, Transportation and Moving Occupations
The most common Production, Transportation and Moving occupations in Hagerstown are Material Moving (1,466 | 8.0%), Transportation (814 | 4.4%), and Production (774 | 4.2%).
Production, Transportation and Moving Occupations by Sex
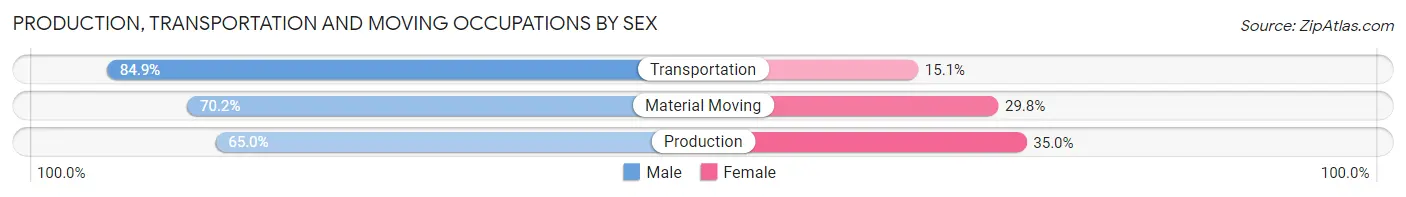
| Occupation | Male | Female |
| Production | 503 (65.0%) | 271 (35.0%) |
| Transportation | 691 (84.9%) | 123 (15.1%) |
| Material Moving | 1,029 (70.2%) | 437 (29.8%) |
| Total (Category) | 2,223 (72.8%) | 831 (27.2%) |
| Total (Overall) | 9,647 (52.3%) | 8,800 (47.7%) |
Employment Industries by Sex in Hagerstown
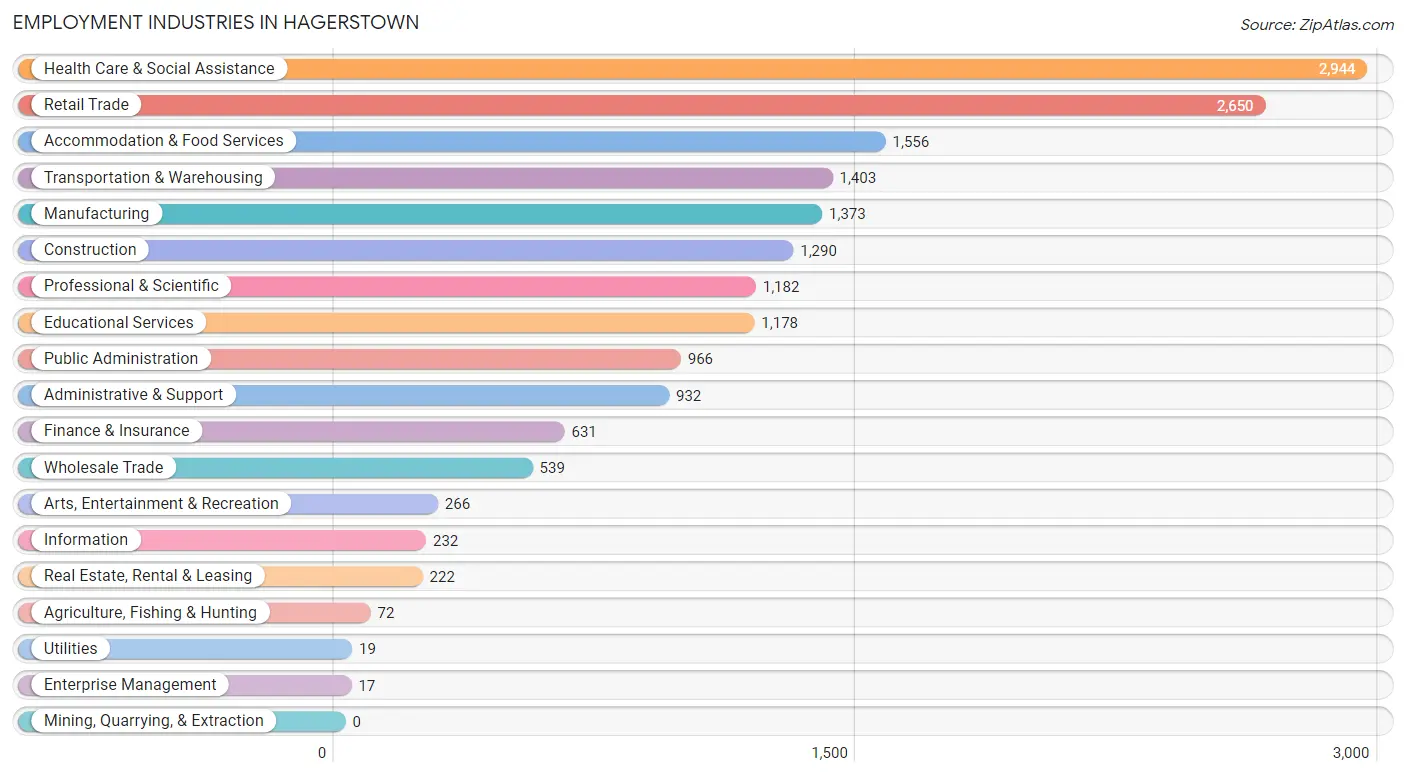
Employment Industries in Hagerstown
The major employment industries in Hagerstown include Health Care & Social Assistance (2,944 | 16.0%), Retail Trade (2,650 | 14.4%), Accommodation & Food Services (1,556 | 8.4%), Transportation & Warehousing (1,403 | 7.6%), and Manufacturing (1,373 | 7.4%).
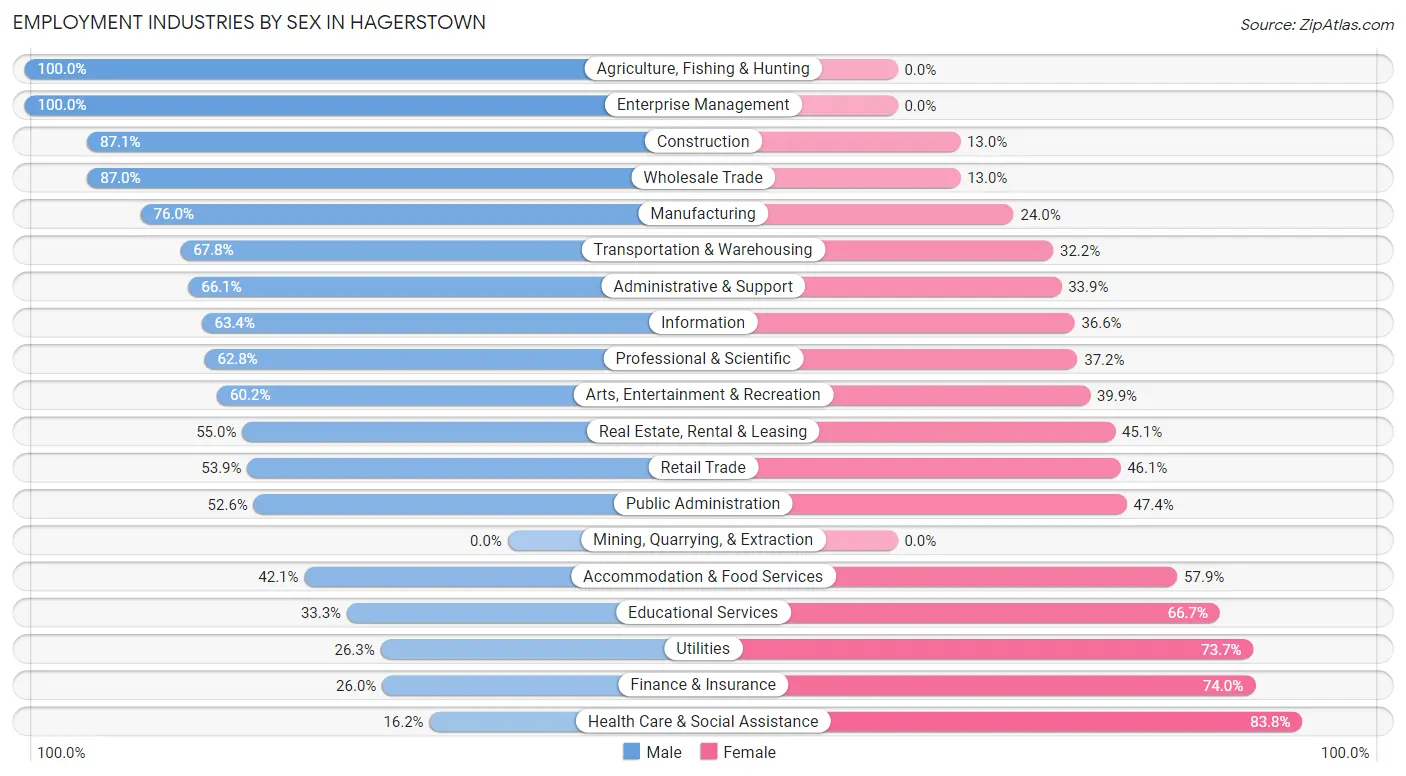
Employment Industries by Sex in Hagerstown
The Hagerstown industries that see more men than women are Agriculture, Fishing & Hunting (100.0%), Enterprise Management (100.0%), and Construction (87.1%), whereas the industries that tend to have a higher number of women are Health Care & Social Assistance (83.8%), Finance & Insurance (74.0%), and Utilities (73.7%).
| Industry | Male | Female |
| Agriculture, Fishing & Hunting | 72 (100.0%) | 0 (0.0%) |
| Mining, Quarrying, & Extraction | 0 (0.0%) | 0 (0.0%) |
| Construction | 1,123 (87.1%) | 167 (13.0%) |
| Manufacturing | 1,043 (76.0%) | 330 (24.0%) |
| Wholesale Trade | 469 (87.0%) | 70 (13.0%) |
| Retail Trade | 1,428 (53.9%) | 1,222 (46.1%) |
| Transportation & Warehousing | 951 (67.8%) | 452 (32.2%) |
| Utilities | 5 (26.3%) | 14 (73.7%) |
| Information | 147 (63.4%) | 85 (36.6%) |
| Finance & Insurance | 164 (26.0%) | 467 (74.0%) |
| Real Estate, Rental & Leasing | 122 (54.9%) | 100 (45.1%) |
| Professional & Scientific | 742 (62.8%) | 440 (37.2%) |
| Enterprise Management | 17 (100.0%) | 0 (0.0%) |
| Administrative & Support | 616 (66.1%) | 316 (33.9%) |
| Educational Services | 392 (33.3%) | 786 (66.7%) |
| Health Care & Social Assistance | 477 (16.2%) | 2,467 (83.8%) |
| Arts, Entertainment & Recreation | 160 (60.2%) | 106 (39.9%) |
| Accommodation & Food Services | 655 (42.1%) | 901 (57.9%) |
| Public Administration | 508 (52.6%) | 458 (47.4%) |
| Total | 9,647 (52.3%) | 8,800 (47.7%) |
Education in Hagerstown
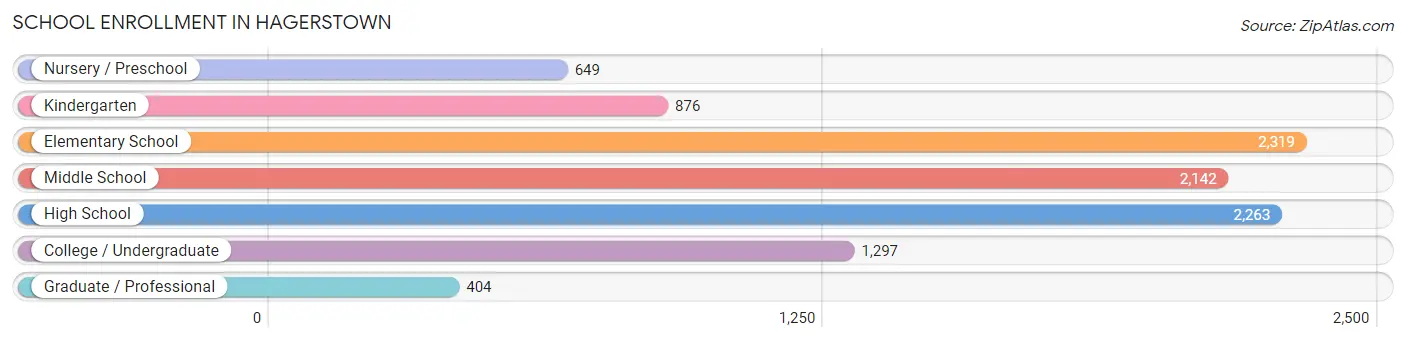
School Enrollment in Hagerstown
The most common levels of schooling among the 9,950 students in Hagerstown are elementary school (2,319 | 23.3%), high school (2,263 | 22.7%), and middle school (2,142 | 21.5%).
| School Level | # Students | % Students |
| Nursery / Preschool | 649 | 6.5% |
| Kindergarten | 876 | 8.8% |
| Elementary School | 2,319 | 23.3% |
| Middle School | 2,142 | 21.5% |
| High School | 2,263 | 22.7% |
| College / Undergraduate | 1,297 | 13.0% |
| Graduate / Professional | 404 | 4.1% |
| Total | 9,950 | 100.0% |
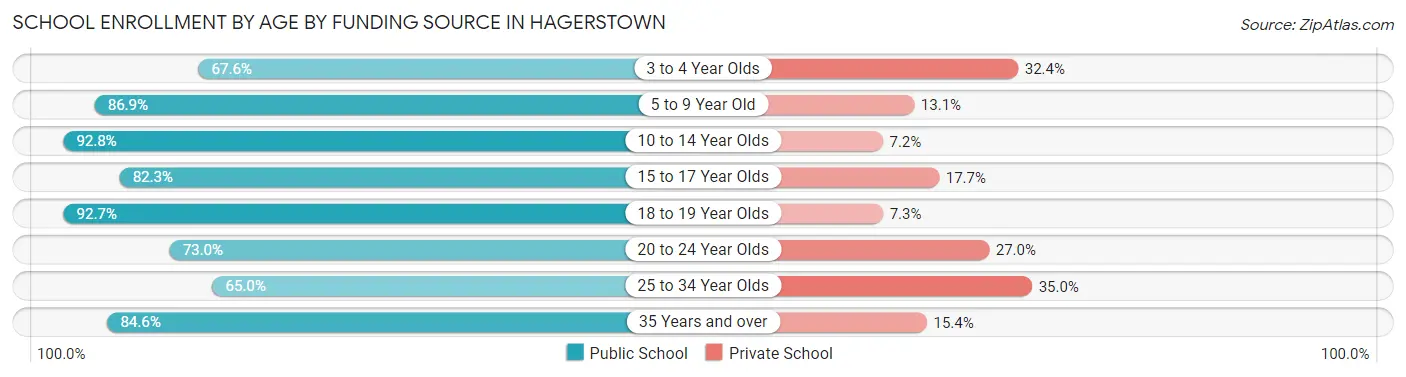
School Enrollment by Age by Funding Source in Hagerstown
Out of a total of 9,950 students who are enrolled in schools in Hagerstown, 1,542 (15.5%) attend a private institution, while the remaining 8,408 (84.5%) are enrolled in public schools. The age group of 25 to 34 year olds has the highest likelihood of being enrolled in private schools, with 221 (35.0% in the age bracket) enrolled. Conversely, the age group of 10 to 14 year olds has the lowest likelihood of being enrolled in a private school, with 2,293 (92.8% in the age bracket) attending a public institution.
| Age Bracket | Public School | Private School |
| 3 to 4 Year Olds | 373 (67.6%) | 179 (32.4%) |
| 5 to 9 Year Old | 2,712 (86.9%) | 408 (13.1%) |
| 10 to 14 Year Olds | 2,293 (92.8%) | 179 (7.2%) |
| 15 to 17 Year Olds | 1,300 (82.3%) | 280 (17.7%) |
| 18 to 19 Year Olds | 370 (92.7%) | 29 (7.3%) |
| 20 to 24 Year Olds | 386 (73.0%) | 143 (27.0%) |
| 25 to 34 Year Olds | 410 (65.0%) | 221 (35.0%) |
| 35 Years and over | 564 (84.6%) | 103 (15.4%) |
| Total | 8,408 (84.5%) | 1,542 (15.5%) |
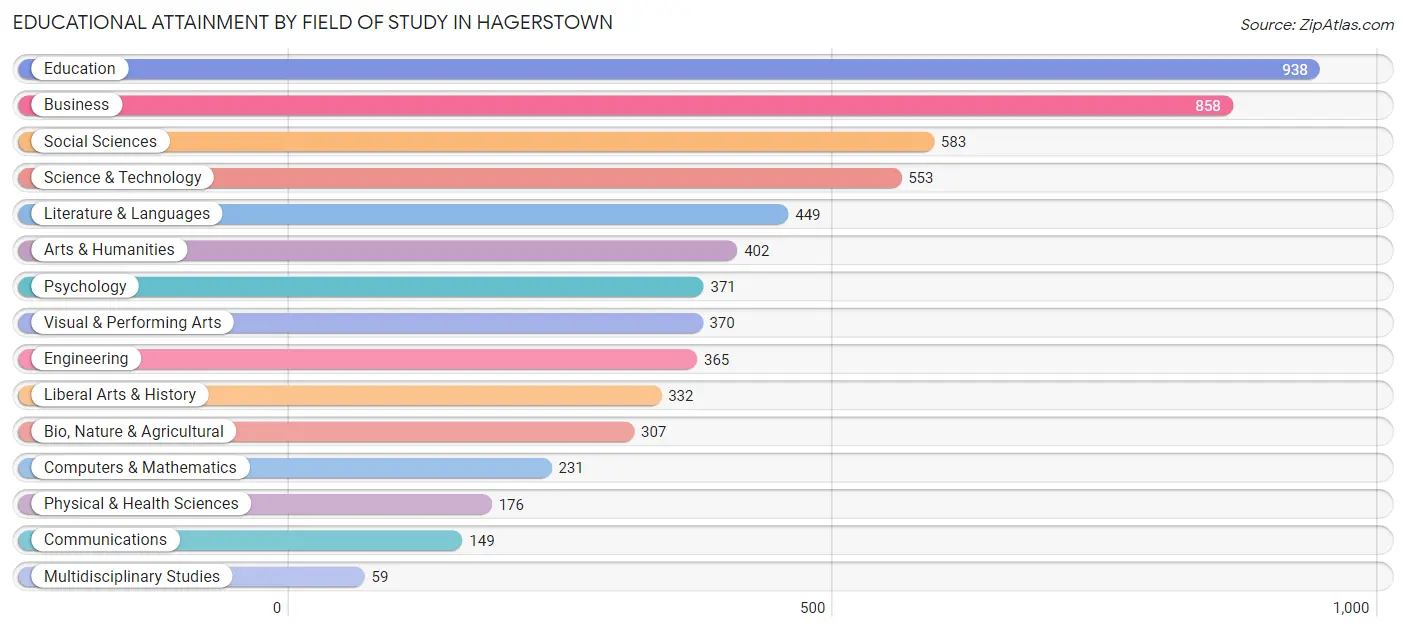
Educational Attainment by Field of Study in Hagerstown
Education (938 | 15.3%), business (858 | 14.0%), social sciences (583 | 9.5%), science & technology (553 | 9.0%), and literature & languages (449 | 7.3%) are the most common fields of study among 6,143 individuals in Hagerstown who have obtained a bachelor's degree or higher.
| Field of Study | # Graduates | % Graduates |
| Computers & Mathematics | 231 | 3.8% |
| Bio, Nature & Agricultural | 307 | 5.0% |
| Physical & Health Sciences | 176 | 2.9% |
| Psychology | 371 | 6.0% |
| Social Sciences | 583 | 9.5% |
| Engineering | 365 | 5.9% |
| Multidisciplinary Studies | 59 | 1.0% |
| Science & Technology | 553 | 9.0% |
| Business | 858 | 14.0% |
| Education | 938 | 15.3% |
| Literature & Languages | 449 | 7.3% |
| Liberal Arts & History | 332 | 5.4% |
| Visual & Performing Arts | 370 | 6.0% |
| Communications | 149 | 2.4% |
| Arts & Humanities | 402 | 6.5% |
| Total | 6,143 | 100.0% |
Transportation & Commute in Hagerstown
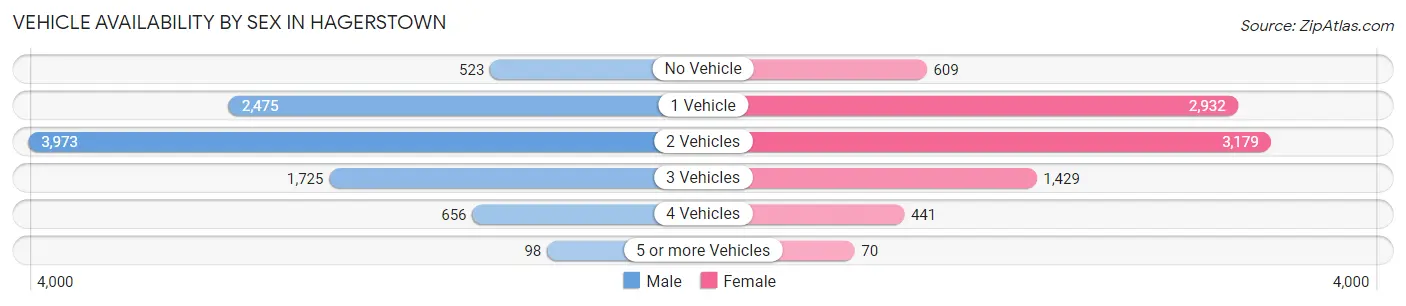
Vehicle Availability by Sex in Hagerstown
The most prevalent vehicle ownership categories in Hagerstown are males with 2 vehicles (3,973, accounting for 42.0%) and females with 2 vehicles (3,179, making up 45.9%).
| Vehicles Available | Male | Female |
| No Vehicle | 523 (5.5%) | 609 (7.0%) |
| 1 Vehicle | 2,475 (26.2%) | 2,932 (33.9%) |
| 2 Vehicles | 3,973 (42.0%) | 3,179 (36.7%) |
| 3 Vehicles | 1,725 (18.2%) | 1,429 (16.5%) |
| 4 Vehicles | 656 (6.9%) | 441 (5.1%) |
| 5 or more Vehicles | 98 (1.0%) | 70 (0.8%) |
| Total | 9,450 (100.0%) | 8,660 (100.0%) |
Commute Time in Hagerstown
The most frequently occuring commute durations in Hagerstown are 15 to 19 minutes (3,596 commuters, 21.5%), 10 to 14 minutes (2,843 commuters, 17.0%), and 20 to 24 minutes (1,904 commuters, 11.4%).
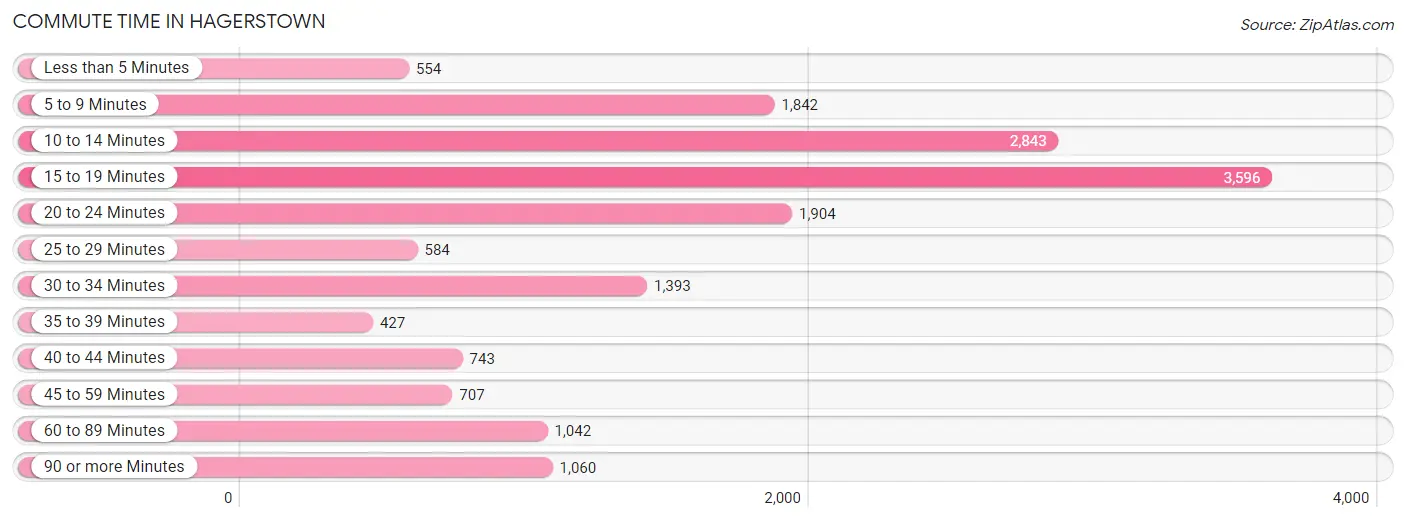
| Commute Time | # Commuters | % Commuters |
| Less than 5 Minutes | 554 | 3.3% |
| 5 to 9 Minutes | 1,842 | 11.0% |
| 10 to 14 Minutes | 2,843 | 17.0% |
| 15 to 19 Minutes | 3,596 | 21.5% |
| 20 to 24 Minutes | 1,904 | 11.4% |
| 25 to 29 Minutes | 584 | 3.5% |
| 30 to 34 Minutes | 1,393 | 8.3% |
| 35 to 39 Minutes | 427 | 2.6% |
| 40 to 44 Minutes | 743 | 4.4% |
| 45 to 59 Minutes | 707 | 4.2% |
| 60 to 89 Minutes | 1,042 | 6.2% |
| 90 or more Minutes | 1,060 | 6.4% |
Commute Time by Sex in Hagerstown
The most common commute times in Hagerstown are 15 to 19 minutes (1,844 commuters, 20.9%) for males and 15 to 19 minutes (1,752 commuters, 22.3%) for females.
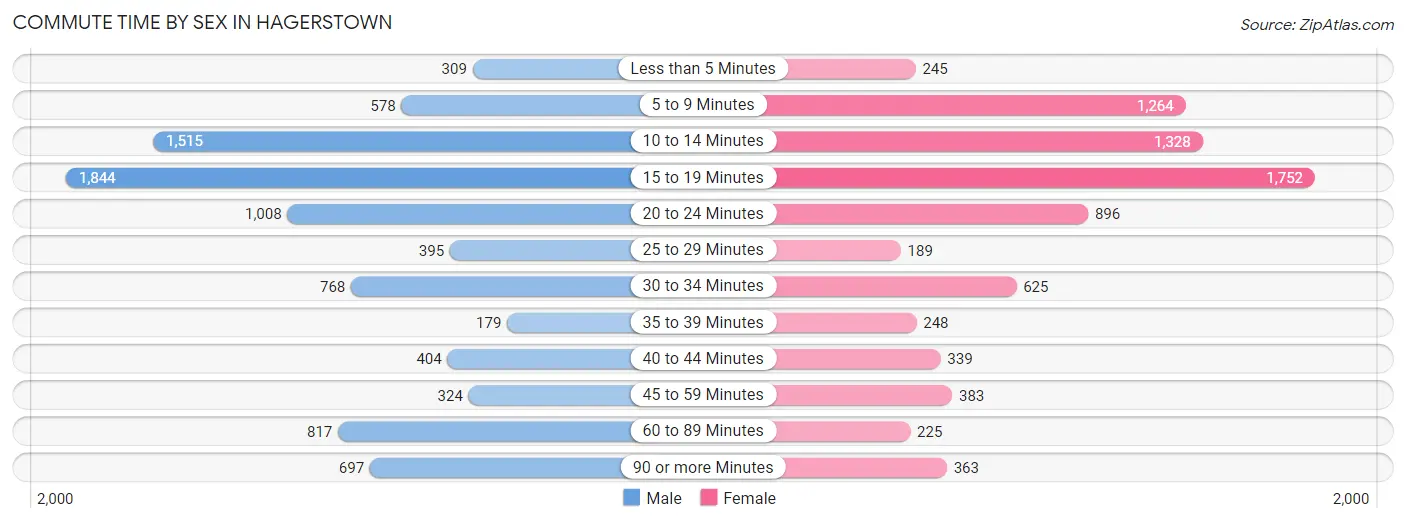
| Commute Time | Male | Female |
| Less than 5 Minutes | 309 (3.5%) | 245 (3.1%) |
| 5 to 9 Minutes | 578 (6.5%) | 1,264 (16.1%) |
| 10 to 14 Minutes | 1,515 (17.1%) | 1,328 (16.9%) |
| 15 to 19 Minutes | 1,844 (20.9%) | 1,752 (22.3%) |
| 20 to 24 Minutes | 1,008 (11.4%) | 896 (11.4%) |
| 25 to 29 Minutes | 395 (4.5%) | 189 (2.4%) |
| 30 to 34 Minutes | 768 (8.7%) | 625 (8.0%) |
| 35 to 39 Minutes | 179 (2.0%) | 248 (3.2%) |
| 40 to 44 Minutes | 404 (4.6%) | 339 (4.3%) |
| 45 to 59 Minutes | 324 (3.7%) | 383 (4.9%) |
| 60 to 89 Minutes | 817 (9.2%) | 225 (2.9%) |
| 90 or more Minutes | 697 (7.9%) | 363 (4.6%) |
Time of Departure to Work by Sex in Hagerstown
The most frequent times of departure to work in Hagerstown are 12:00 PM to 3:59 PM (1,070, 12.1%) for males and 7:30 AM to 7:59 AM (1,102, 14.0%) for females.
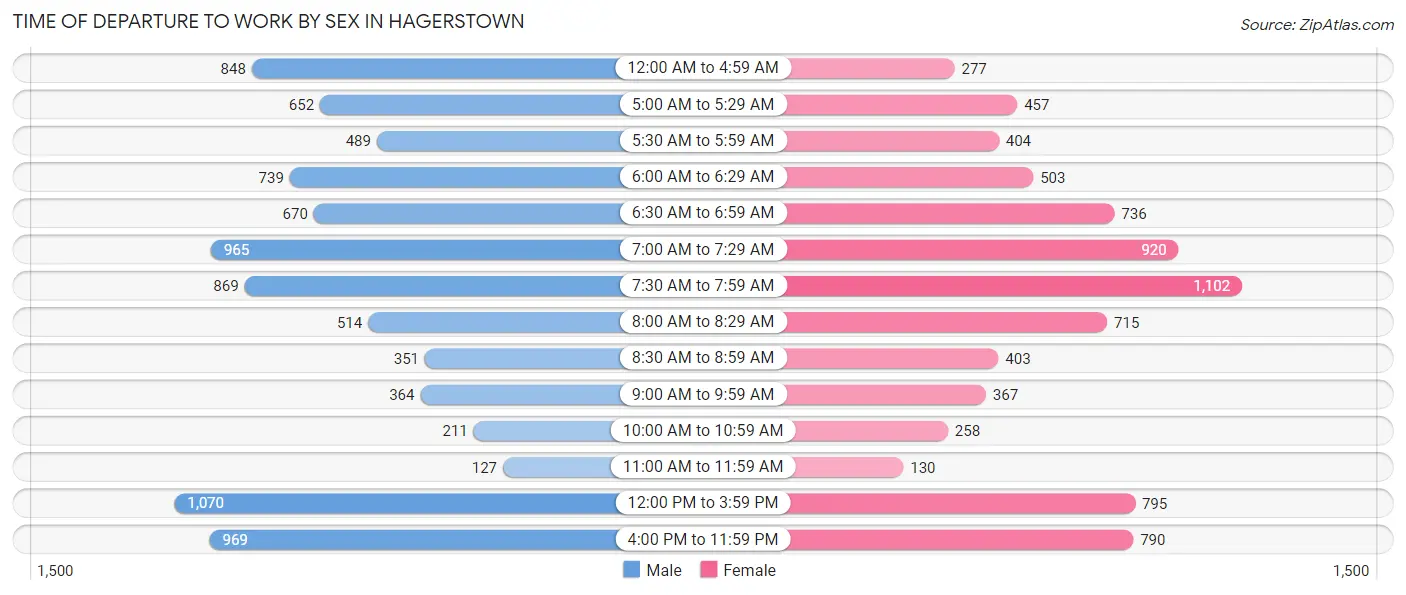
| Time of Departure | Male | Female |
| 12:00 AM to 4:59 AM | 848 (9.6%) | 277 (3.5%) |
| 5:00 AM to 5:29 AM | 652 (7.4%) | 457 (5.8%) |
| 5:30 AM to 5:59 AM | 489 (5.5%) | 404 (5.1%) |
| 6:00 AM to 6:29 AM | 739 (8.4%) | 503 (6.4%) |
| 6:30 AM to 6:59 AM | 670 (7.6%) | 736 (9.4%) |
| 7:00 AM to 7:29 AM | 965 (10.9%) | 920 (11.7%) |
| 7:30 AM to 7:59 AM | 869 (9.8%) | 1,102 (14.0%) |
| 8:00 AM to 8:29 AM | 514 (5.8%) | 715 (9.1%) |
| 8:30 AM to 8:59 AM | 351 (4.0%) | 403 (5.1%) |
| 9:00 AM to 9:59 AM | 364 (4.1%) | 367 (4.7%) |
| 10:00 AM to 10:59 AM | 211 (2.4%) | 258 (3.3%) |
| 11:00 AM to 11:59 AM | 127 (1.4%) | 130 (1.7%) |
| 12:00 PM to 3:59 PM | 1,070 (12.1%) | 795 (10.1%) |
| 4:00 PM to 11:59 PM | 969 (11.0%) | 790 (10.1%) |
| Total | 8,838 (100.0%) | 7,857 (100.0%) |
Housing Occupancy in Hagerstown
Occupancy by Ownership in Hagerstown
Of the total 18,159 dwellings in Hagerstown, owner-occupied units account for 7,294 (40.2%), while renter-occupied units make up 10,865 (59.8%).
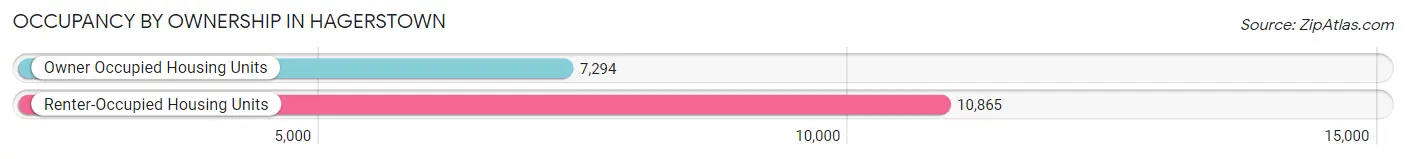
| Occupancy | # Housing Units | % Housing Units |
| Owner Occupied Housing Units | 7,294 | 40.2% |
| Renter-Occupied Housing Units | 10,865 | 59.8% |
| Total Occupied Housing Units | 18,159 | 100.0% |
Occupancy by Household Size in Hagerstown
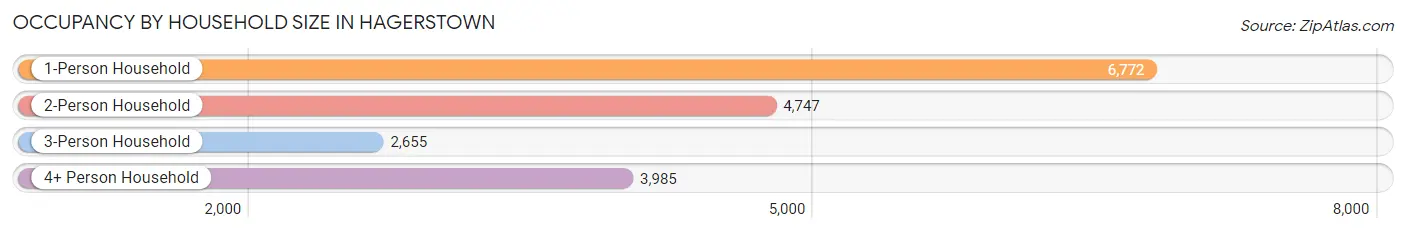
| Household Size | # Housing Units | % Housing Units |
| 1-Person Household | 6,772 | 37.3% |
| 2-Person Household | 4,747 | 26.1% |
| 3-Person Household | 2,655 | 14.6% |
| 4+ Person Household | 3,985 | 22.0% |
| Total Housing Units | 18,159 | 100.0% |
Occupancy by Ownership by Household Size in Hagerstown
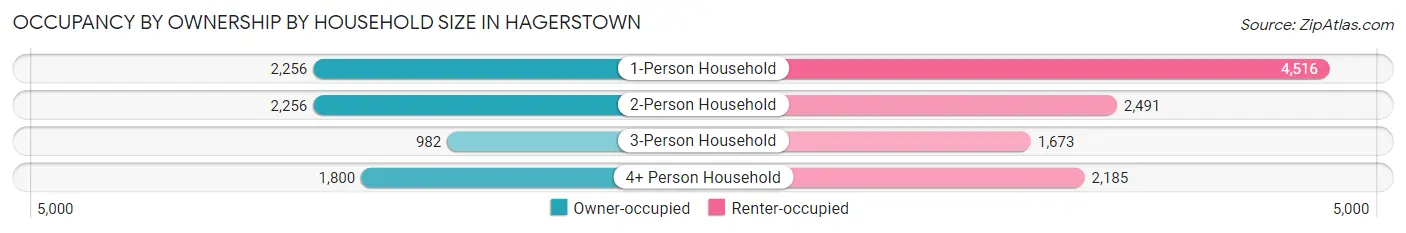
| Household Size | Owner-occupied | Renter-occupied |
| 1-Person Household | 2,256 (33.3%) | 4,516 (66.7%) |
| 2-Person Household | 2,256 (47.5%) | 2,491 (52.5%) |
| 3-Person Household | 982 (37.0%) | 1,673 (63.0%) |
| 4+ Person Household | 1,800 (45.2%) | 2,185 (54.8%) |
| Total Housing Units | 7,294 (40.2%) | 10,865 (59.8%) |
Occupancy by Educational Attainment in Hagerstown
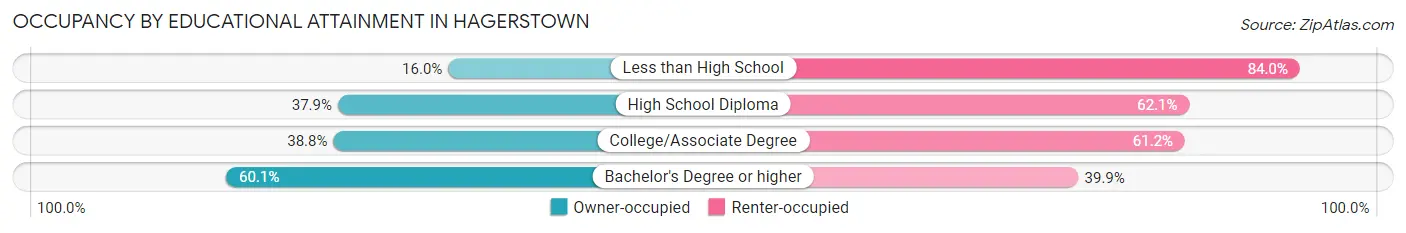
| Household Size | Owner-occupied | Renter-occupied |
| Less than High School | 345 (16.0%) | 1,809 (84.0%) |
| High School Diploma | 2,203 (37.9%) | 3,608 (62.1%) |
| College/Associate Degree | 2,511 (38.8%) | 3,962 (61.2%) |
| Bachelor's Degree or higher | 2,235 (60.1%) | 1,486 (39.9%) |
Occupancy by Age of Householder in Hagerstown
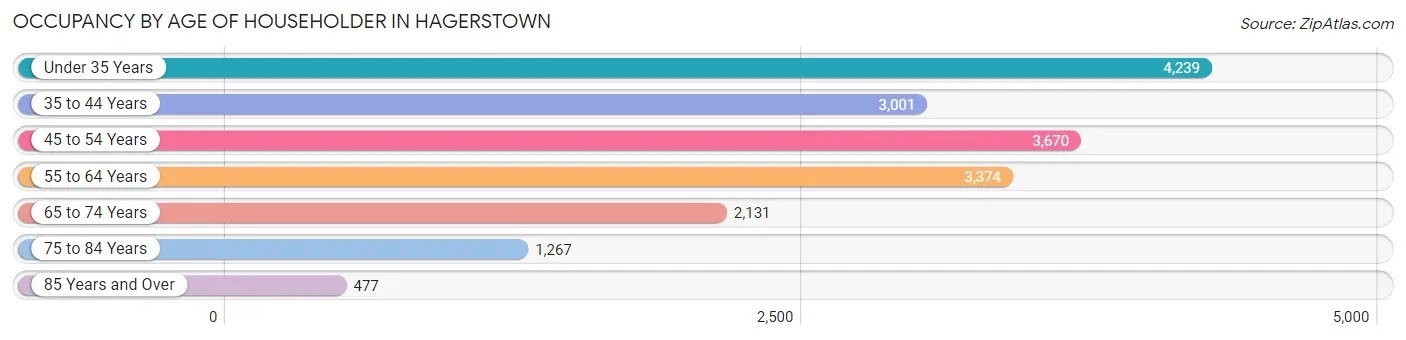
| Age Bracket | # Households | % Households |
| Under 35 Years | 4,239 | 23.3% |
| 35 to 44 Years | 3,001 | 16.5% |
| 45 to 54 Years | 3,670 | 20.2% |
| 55 to 64 Years | 3,374 | 18.6% |
| 65 to 74 Years | 2,131 | 11.7% |
| 75 to 84 Years | 1,267 | 7.0% |
| 85 Years and Over | 477 | 2.6% |
| Total | 18,159 | 100.0% |
Housing Finances in Hagerstown
Median Income by Occupancy in Hagerstown
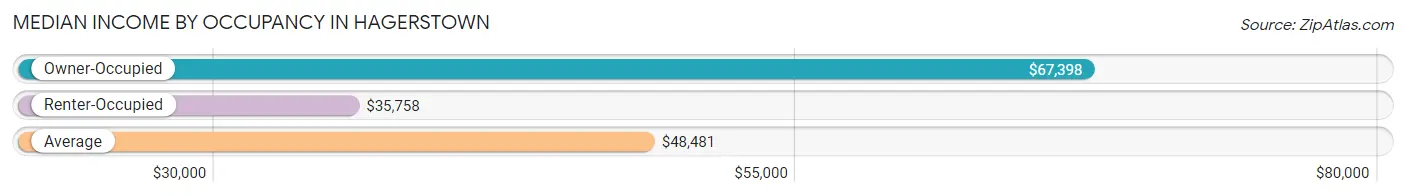
| Occupancy Type | # Households | Median Income |
| Owner-Occupied | 7,294 (40.2%) | $67,398 |
| Renter-Occupied | 10,865 (59.8%) | $35,758 |
| Average | 18,159 (100.0%) | $48,481 |
Occupancy by Householder Income Bracket in Hagerstown
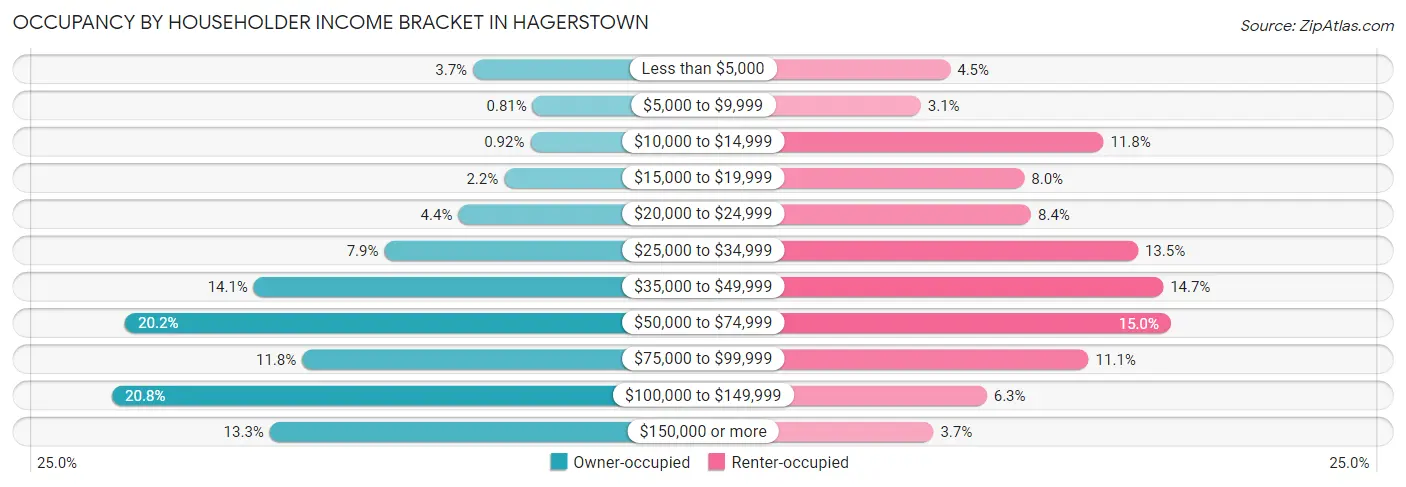
| Income Bracket | Owner-occupied | Renter-occupied |
| Less than $5,000 | 266 (3.6%) | 490 (4.5%) |
| $5,000 to $9,999 | 59 (0.8%) | 338 (3.1%) |
| $10,000 to $14,999 | 67 (0.9%) | 1,283 (11.8%) |
| $15,000 to $19,999 | 158 (2.2%) | 874 (8.0%) |
| $20,000 to $24,999 | 317 (4.3%) | 908 (8.4%) |
| $25,000 to $34,999 | 574 (7.9%) | 1,461 (13.5%) |
| $35,000 to $49,999 | 1,028 (14.1%) | 1,592 (14.6%) |
| $50,000 to $74,999 | 1,474 (20.2%) | 1,631 (15.0%) |
| $75,000 to $99,999 | 860 (11.8%) | 1,206 (11.1%) |
| $100,000 to $149,999 | 1,519 (20.8%) | 679 (6.2%) |
| $150,000 or more | 972 (13.3%) | 403 (3.7%) |
| Total | 7,294 (100.0%) | 10,865 (100.0%) |
Monthly Housing Cost Tiers in Hagerstown
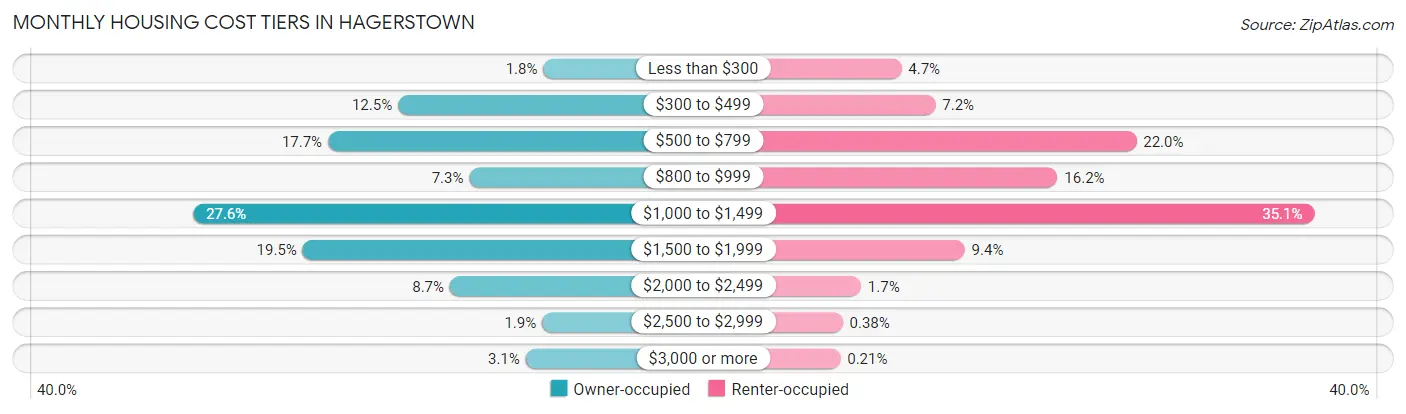
| Monthly Cost | Owner-occupied | Renter-occupied |
| Less than $300 | 131 (1.8%) | 512 (4.7%) |
| $300 to $499 | 912 (12.5%) | 783 (7.2%) |
| $500 to $799 | 1,288 (17.7%) | 2,391 (22.0%) |
| $800 to $999 | 529 (7.2%) | 1,760 (16.2%) |
| $1,000 to $1,499 | 2,013 (27.6%) | 3,816 (35.1%) |
| $1,500 to $1,999 | 1,424 (19.5%) | 1,018 (9.4%) |
| $2,000 to $2,499 | 633 (8.7%) | 188 (1.7%) |
| $2,500 to $2,999 | 138 (1.9%) | 41 (0.4%) |
| $3,000 or more | 226 (3.1%) | 23 (0.2%) |
| Total | 7,294 (100.0%) | 10,865 (100.0%) |
Physical Housing Characteristics in Hagerstown
Housing Structures in Hagerstown
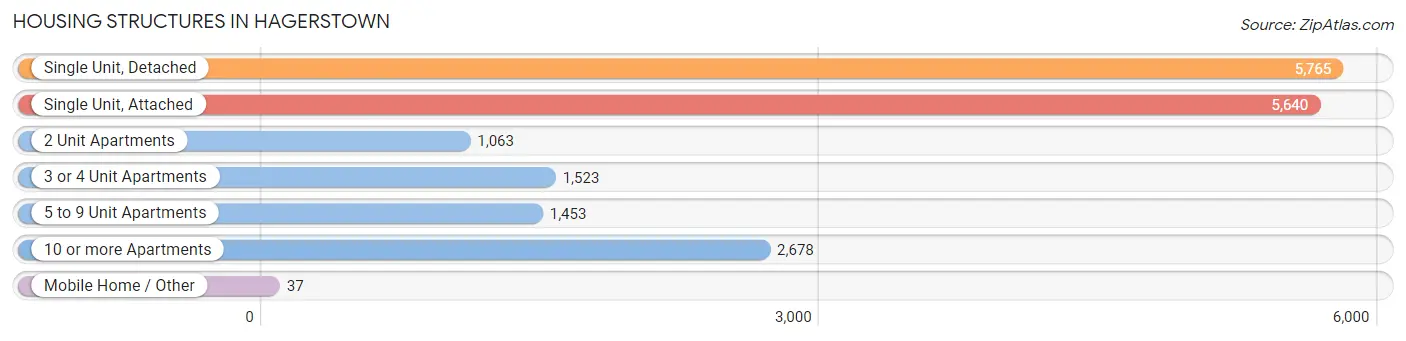
| Structure Type | # Housing Units | % Housing Units |
| Single Unit, Detached | 5,765 | 31.8% |
| Single Unit, Attached | 5,640 | 31.1% |
| 2 Unit Apartments | 1,063 | 5.9% |
| 3 or 4 Unit Apartments | 1,523 | 8.4% |
| 5 to 9 Unit Apartments | 1,453 | 8.0% |
| 10 or more Apartments | 2,678 | 14.7% |
| Mobile Home / Other | 37 | 0.2% |
| Total | 18,159 | 100.0% |
Housing Structures by Occupancy in Hagerstown
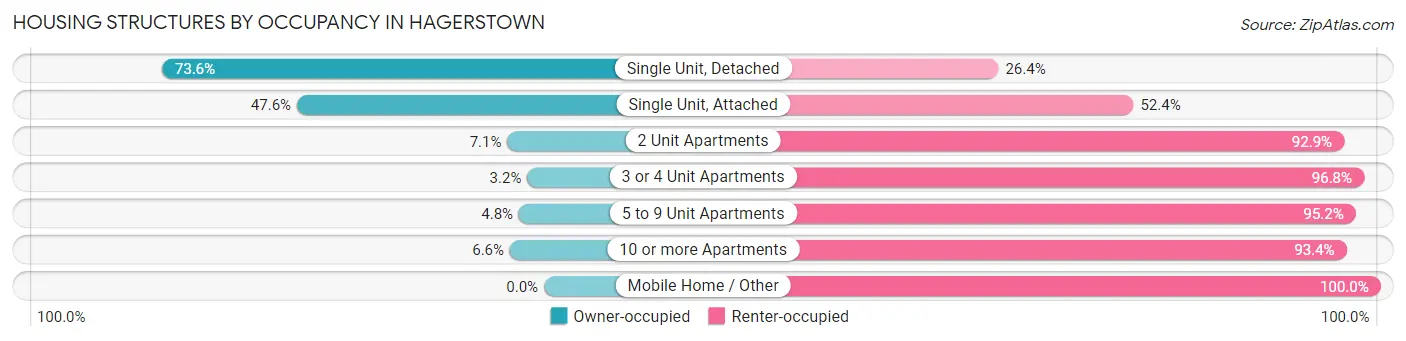
| Structure Type | Owner-occupied | Renter-occupied |
| Single Unit, Detached | 4,241 (73.6%) | 1,524 (26.4%) |
| Single Unit, Attached | 2,683 (47.6%) | 2,957 (52.4%) |
| 2 Unit Apartments | 75 (7.1%) | 988 (92.9%) |
| 3 or 4 Unit Apartments | 49 (3.2%) | 1,474 (96.8%) |
| 5 to 9 Unit Apartments | 70 (4.8%) | 1,383 (95.2%) |
| 10 or more Apartments | 176 (6.6%) | 2,502 (93.4%) |
| Mobile Home / Other | 0 (0.0%) | 37 (100.0%) |
| Total | 7,294 (40.2%) | 10,865 (59.8%) |
Housing Structures by Number of Rooms in Hagerstown
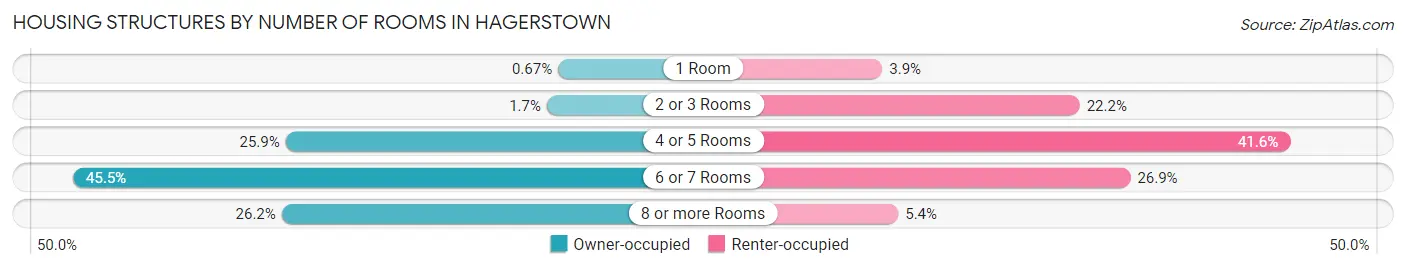
| Number of Rooms | Owner-occupied | Renter-occupied |
| 1 Room | 49 (0.7%) | 426 (3.9%) |
| 2 or 3 Rooms | 124 (1.7%) | 2,410 (22.2%) |
| 4 or 5 Rooms | 1,887 (25.9%) | 4,523 (41.6%) |
| 6 or 7 Rooms | 3,321 (45.5%) | 2,919 (26.9%) |
| 8 or more Rooms | 1,913 (26.2%) | 587 (5.4%) |
| Total | 7,294 (100.0%) | 10,865 (100.0%) |
Housing Structure by Heating Type in Hagerstown
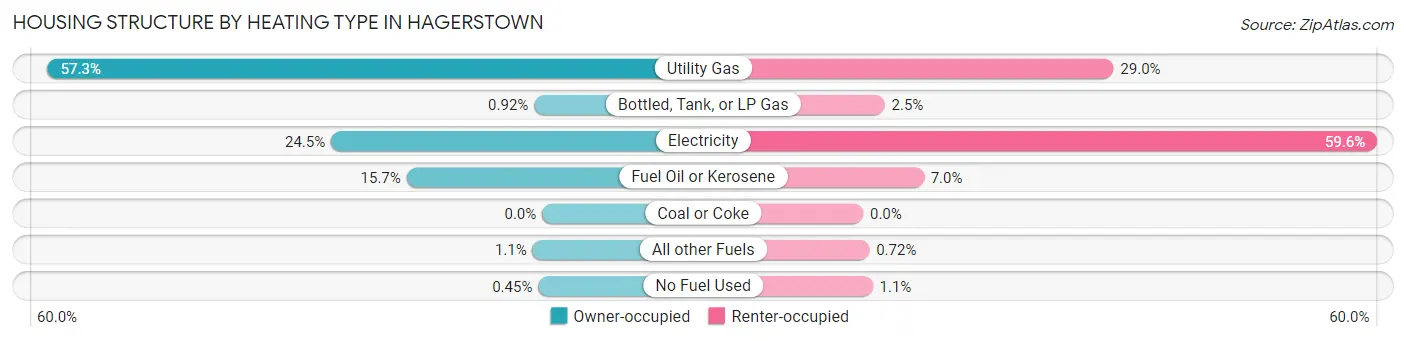
| Heating Type | Owner-occupied | Renter-occupied |
| Utility Gas | 4,182 (57.3%) | 3,154 (29.0%) |
| Bottled, Tank, or LP Gas | 67 (0.9%) | 272 (2.5%) |
| Electricity | 1,785 (24.5%) | 6,476 (59.6%) |
| Fuel Oil or Kerosene | 1,146 (15.7%) | 764 (7.0%) |
| Coal or Coke | 0 (0.0%) | 0 (0.0%) |
| All other Fuels | 81 (1.1%) | 78 (0.7%) |
| No Fuel Used | 33 (0.4%) | 121 (1.1%) |
| Total | 7,294 (100.0%) | 10,865 (100.0%) |
Household Vehicle Usage in Hagerstown
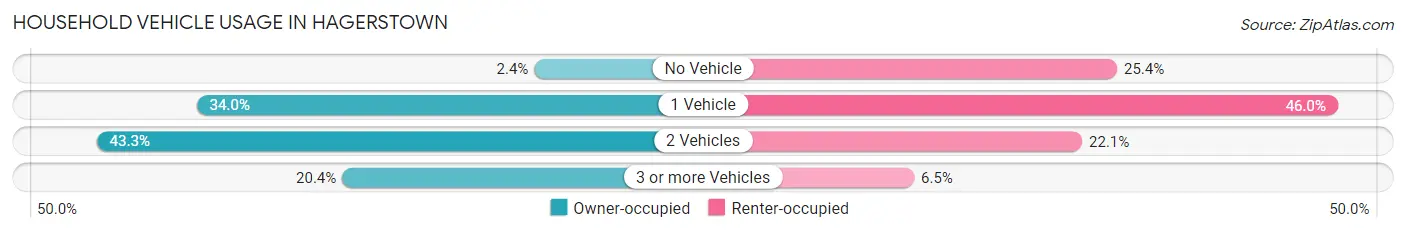
| Vehicles per Household | Owner-occupied | Renter-occupied |
| No Vehicle | 177 (2.4%) | 2,760 (25.4%) |
| 1 Vehicle | 2,476 (34.0%) | 4,998 (46.0%) |
| 2 Vehicles | 3,156 (43.3%) | 2,405 (22.1%) |
| 3 or more Vehicles | 1,485 (20.4%) | 702 (6.5%) |
| Total | 7,294 (100.0%) | 10,865 (100.0%) |
Real Estate & Mortgages in Hagerstown
Real Estate and Mortgage Overview in Hagerstown
| Characteristic | Without Mortgage | With Mortgage |
| Housing Units | 2,238 | 5,056 |
| Median Property Value | $169,400 | $201,000 |
| Median Household Income | $49,726 | $846 |
| Monthly Housing Costs | $525 | $226 |
| Real Estate Taxes | $2,578 | $134 |
Property Value by Mortgage Status in Hagerstown
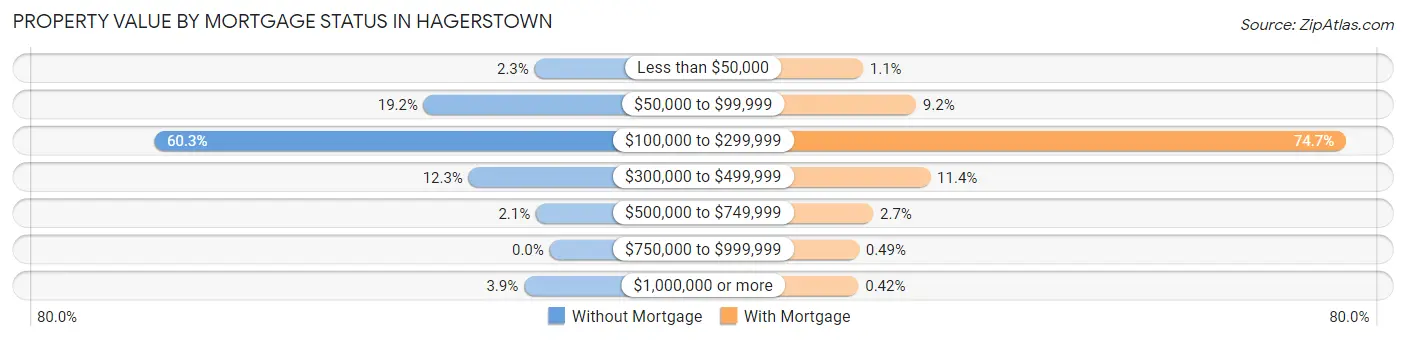
| Property Value | Without Mortgage | With Mortgage |
| Less than $50,000 | 51 (2.3%) | 56 (1.1%) |
| $50,000 to $99,999 | 429 (19.2%) | 465 (9.2%) |
| $100,000 to $299,999 | 1,349 (60.3%) | 3,779 (74.7%) |
| $300,000 to $499,999 | 276 (12.3%) | 575 (11.4%) |
| $500,000 to $749,999 | 46 (2.1%) | 135 (2.7%) |
| $750,000 to $999,999 | 0 (0.0%) | 25 (0.5%) |
| $1,000,000 or more | 87 (3.9%) | 21 (0.4%) |
| Total | 2,238 (100.0%) | 5,056 (100.0%) |
Household Income by Mortgage Status in Hagerstown
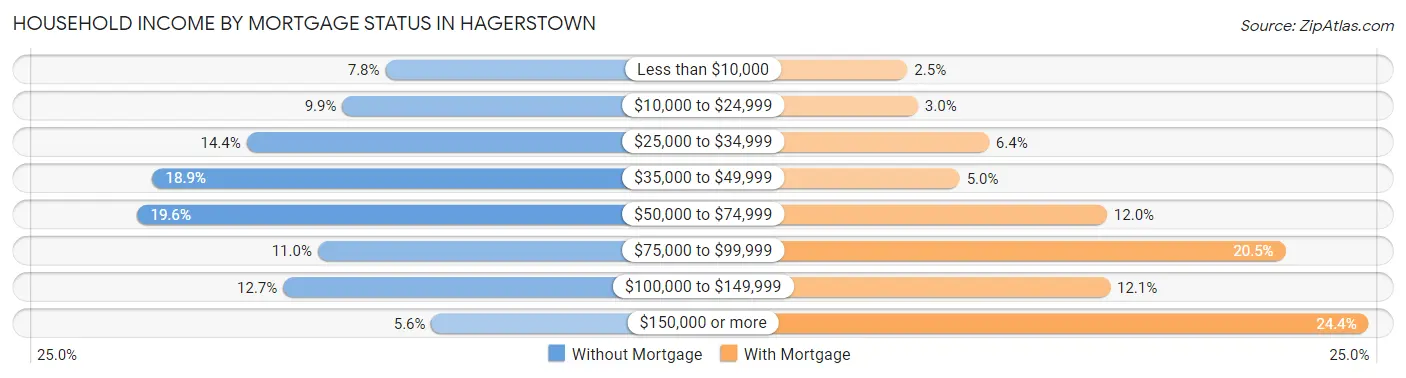
| Household Income | Without Mortgage | With Mortgage |
| Less than $10,000 | 175 (7.8%) | 125 (2.5%) |
| $10,000 to $24,999 | 221 (9.9%) | 150 (3.0%) |
| $25,000 to $34,999 | 323 (14.4%) | 321 (6.4%) |
| $35,000 to $49,999 | 423 (18.9%) | 251 (5.0%) |
| $50,000 to $74,999 | 439 (19.6%) | 605 (12.0%) |
| $75,000 to $99,999 | 247 (11.0%) | 1,035 (20.5%) |
| $100,000 to $149,999 | 284 (12.7%) | 613 (12.1%) |
| $150,000 or more | 126 (5.6%) | 1,235 (24.4%) |
| Total | 2,238 (100.0%) | 5,056 (100.0%) |
Property Value to Household Income Ratio in Hagerstown
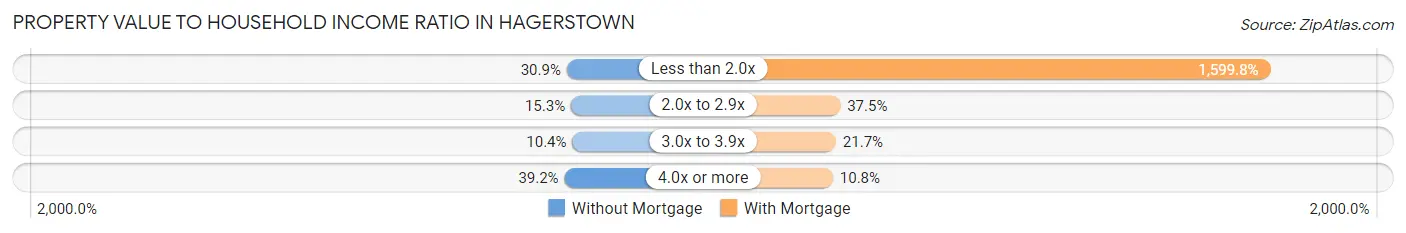
| Value-to-Income Ratio | Without Mortgage | With Mortgage |
| Less than 2.0x | 691 (30.9%) | 80,887 (1,599.8%) |
| 2.0x to 2.9x | 343 (15.3%) | 1,896 (37.5%) |
| 3.0x to 3.9x | 233 (10.4%) | 1,099 (21.7%) |
| 4.0x or more | 877 (39.2%) | 545 (10.8%) |
| Total | 2,238 (100.0%) | 5,056 (100.0%) |
Real Estate Taxes by Mortgage Status in Hagerstown
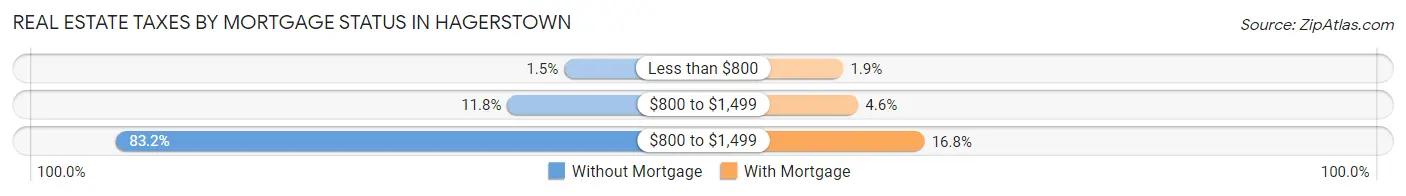
| Property Taxes | Without Mortgage | With Mortgage |
| Less than $800 | 33 (1.5%) | 96 (1.9%) |
| $800 to $1,499 | 265 (11.8%) | 234 (4.6%) |
| $800 to $1,499 | 1,863 (83.2%) | 847 (16.8%) |
| Total | 2,238 (100.0%) | 5,056 (100.0%) |
Health & Disability in Hagerstown
Health Insurance Coverage by Age in Hagerstown
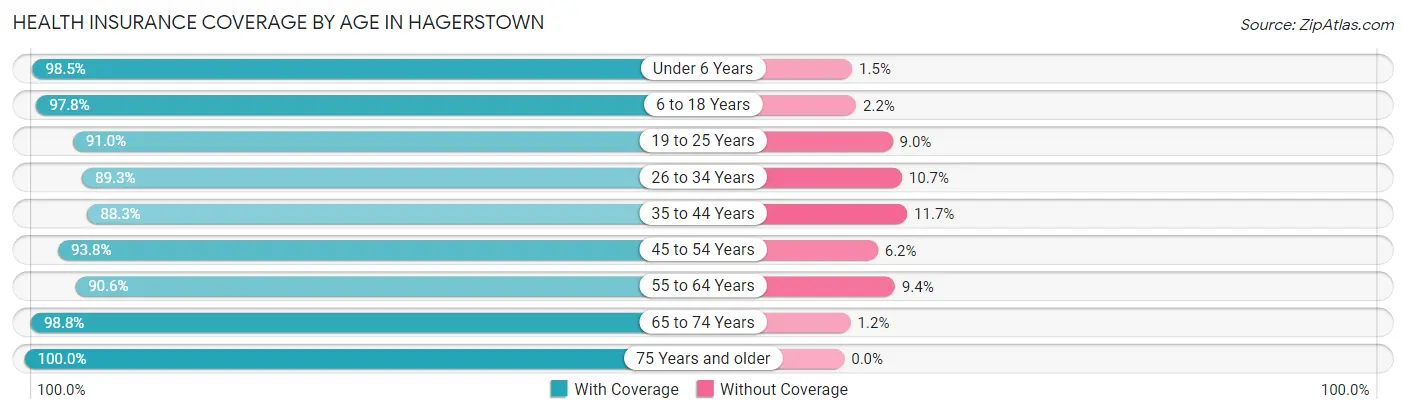
| Age Bracket | With Coverage | Without Coverage |
| Under 6 Years | 4,146 (98.5%) | 62 (1.5%) |
| 6 to 18 Years | 7,249 (97.8%) | 163 (2.2%) |
| 19 to 25 Years | 3,052 (91.0%) | 302 (9.0%) |
| 26 to 34 Years | 5,333 (89.3%) | 642 (10.7%) |
| 35 to 44 Years | 4,716 (88.3%) | 626 (11.7%) |
| 45 to 54 Years | 5,107 (93.8%) | 340 (6.2%) |
| 55 to 64 Years | 4,499 (90.6%) | 469 (9.4%) |
| 65 to 74 Years | 3,414 (98.8%) | 41 (1.2%) |
| 75 Years and older | 2,474 (100.0%) | 0 (0.0%) |
| Total | 39,990 (93.8%) | 2,645 (6.2%) |
Health Insurance Coverage by Citizenship Status in Hagerstown
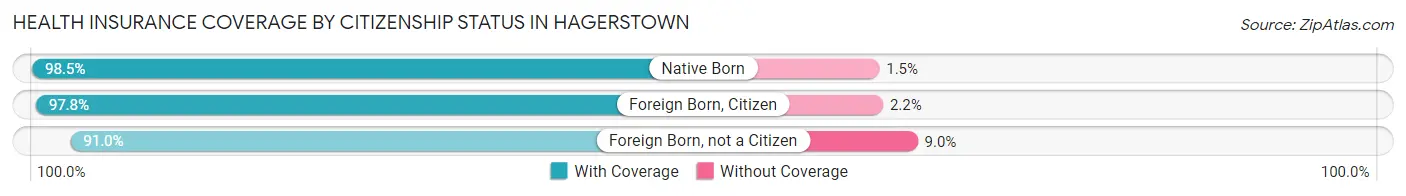
| Citizenship Status | With Coverage | Without Coverage |
| Native Born | 4,146 (98.5%) | 62 (1.5%) |
| Foreign Born, Citizen | 7,249 (97.8%) | 163 (2.2%) |
| Foreign Born, not a Citizen | 3,052 (91.0%) | 302 (9.0%) |
Health Insurance Coverage by Household Income in Hagerstown
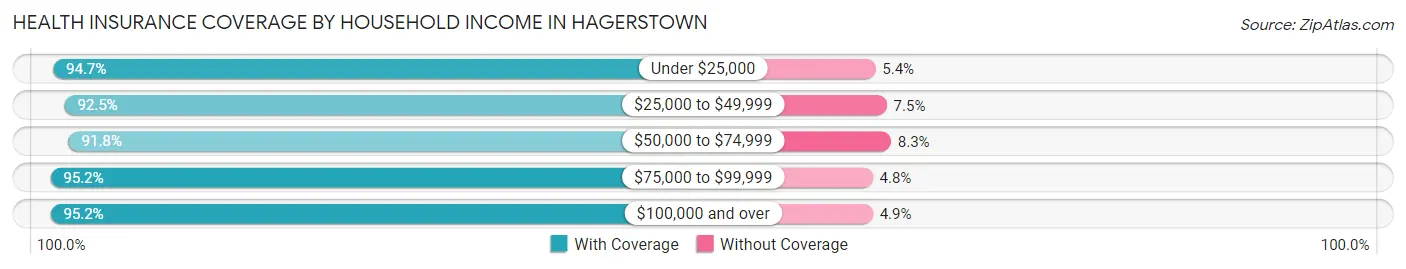
| Household Income | With Coverage | Without Coverage |
| Under $25,000 | 6,923 (94.7%) | 391 (5.3%) |
| $25,000 to $49,999 | 10,260 (92.5%) | 828 (7.5%) |
| $50,000 to $74,999 | 6,948 (91.7%) | 625 (8.3%) |
| $75,000 to $99,999 | 5,238 (95.2%) | 266 (4.8%) |
| $100,000 and over | 10,247 (95.2%) | 522 (4.9%) |
Public vs Private Health Insurance Coverage by Age in Hagerstown
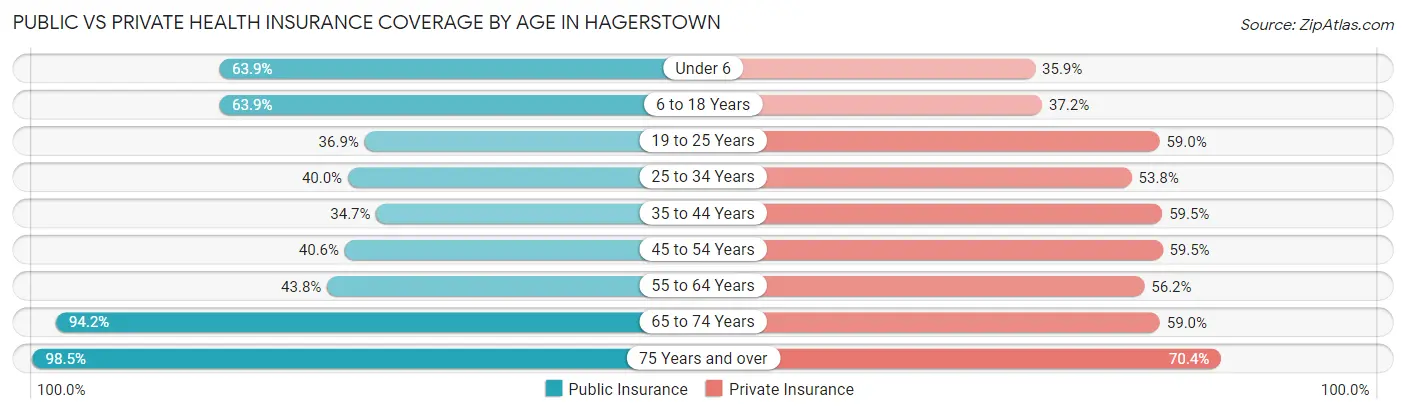
| Age Bracket | Public Insurance | Private Insurance |
| Under 6 | 2,688 (63.9%) | 1,510 (35.9%) |
| 6 to 18 Years | 4,735 (63.9%) | 2,755 (37.2%) |
| 19 to 25 Years | 1,237 (36.9%) | 1,978 (59.0%) |
| 25 to 34 Years | 2,389 (40.0%) | 3,214 (53.8%) |
| 35 to 44 Years | 1,854 (34.7%) | 3,177 (59.5%) |
| 45 to 54 Years | 2,209 (40.6%) | 3,242 (59.5%) |
| 55 to 64 Years | 2,178 (43.8%) | 2,790 (56.2%) |
| 65 to 74 Years | 3,254 (94.2%) | 2,040 (59.0%) |
| 75 Years and over | 2,437 (98.5%) | 1,742 (70.4%) |
| Total | 22,981 (53.9%) | 22,448 (52.6%) |
Disability Status by Sex by Age in Hagerstown
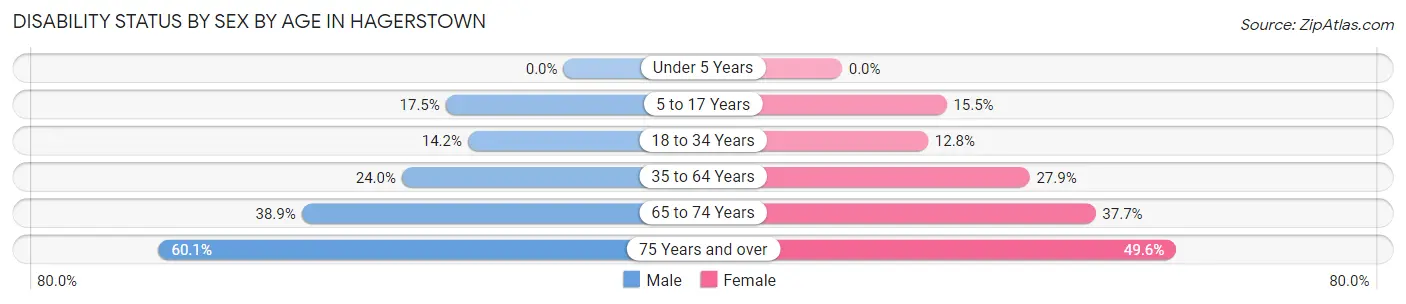
| Age Bracket | Male | Female |
| Under 5 Years | 0 (0.0%) | 0 (0.0%) |
| 5 to 17 Years | 702 (17.5%) | 613 (15.5%) |
| 18 to 34 Years | 683 (14.2%) | 631 (12.8%) |
| 35 to 64 Years | 1,878 (24.0%) | 2,210 (27.9%) |
| 65 to 74 Years | 631 (38.9%) | 690 (37.7%) |
| 75 Years and over | 580 (60.1%) | 749 (49.6%) |
Disability Class by Sex by Age in Hagerstown
Disability Class: Hearing Difficulty
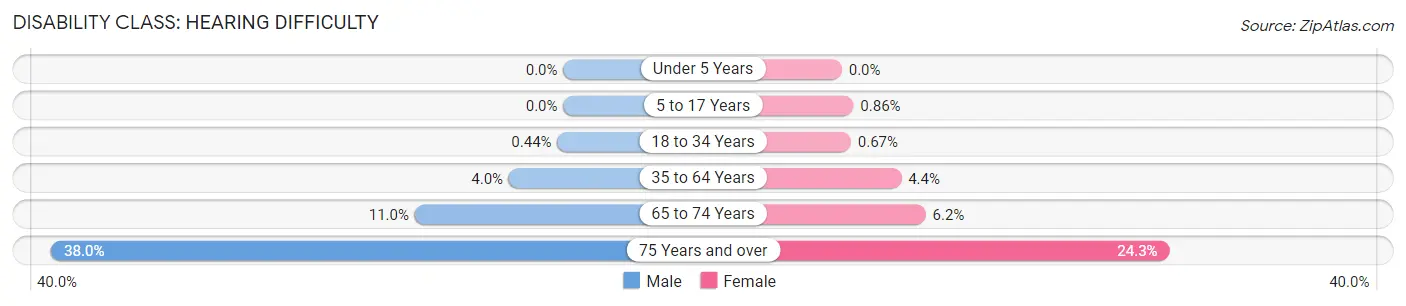
| Age Bracket | Male | Female |
| Under 5 Years | 0 (0.0%) | 0 (0.0%) |
| 5 to 17 Years | 0 (0.0%) | 34 (0.9%) |
| 18 to 34 Years | 21 (0.4%) | 33 (0.7%) |
| 35 to 64 Years | 316 (4.0%) | 350 (4.4%) |
| 65 to 74 Years | 179 (11.0%) | 114 (6.2%) |
| 75 Years and over | 367 (38.0%) | 367 (24.3%) |
Disability Class: Vision Difficulty
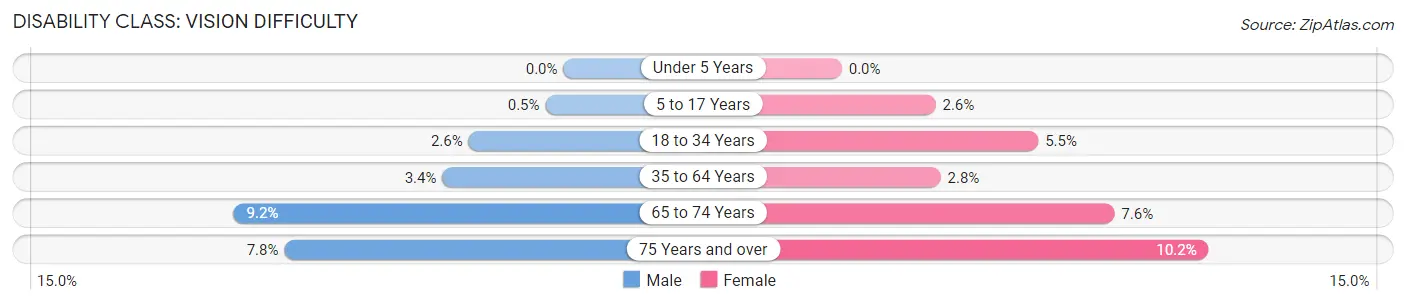
| Age Bracket | Male | Female |
| Under 5 Years | 0 (0.0%) | 0 (0.0%) |
| 5 to 17 Years | 20 (0.5%) | 103 (2.6%) |
| 18 to 34 Years | 127 (2.6%) | 270 (5.5%) |
| 35 to 64 Years | 264 (3.4%) | 218 (2.8%) |
| 65 to 74 Years | 149 (9.2%) | 139 (7.6%) |
| 75 Years and over | 75 (7.8%) | 154 (10.2%) |
Disability Class: Cognitive Difficulty
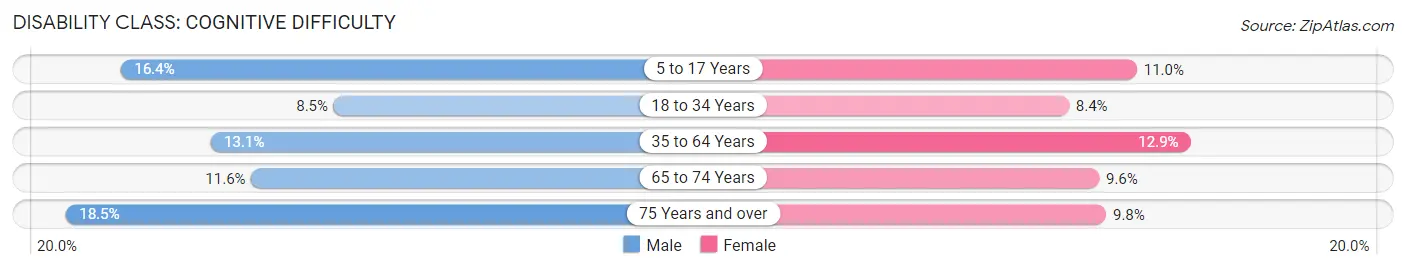
| Age Bracket | Male | Female |
| 5 to 17 Years | 659 (16.4%) | 432 (11.0%) |
| 18 to 34 Years | 410 (8.5%) | 416 (8.4%) |
| 35 to 64 Years | 1,024 (13.1%) | 1,026 (12.9%) |
| 65 to 74 Years | 188 (11.6%) | 175 (9.6%) |
| 75 Years and over | 178 (18.4%) | 148 (9.8%) |
Disability Class: Ambulatory Difficulty
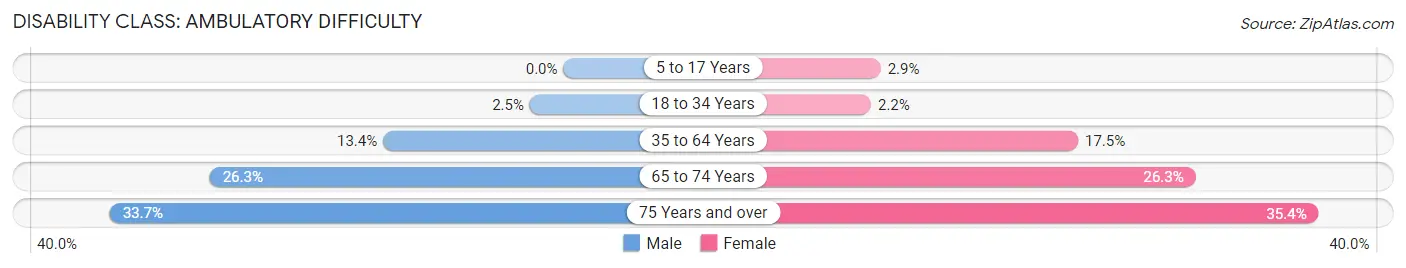
| Age Bracket | Male | Female |
| 5 to 17 Years | 0 (0.0%) | 114 (2.9%) |
| 18 to 34 Years | 120 (2.5%) | 107 (2.2%) |
| 35 to 64 Years | 1,048 (13.4%) | 1,391 (17.5%) |
| 65 to 74 Years | 426 (26.3%) | 481 (26.3%) |
| 75 Years and over | 325 (33.7%) | 534 (35.4%) |
Disability Class: Self-Care Difficulty
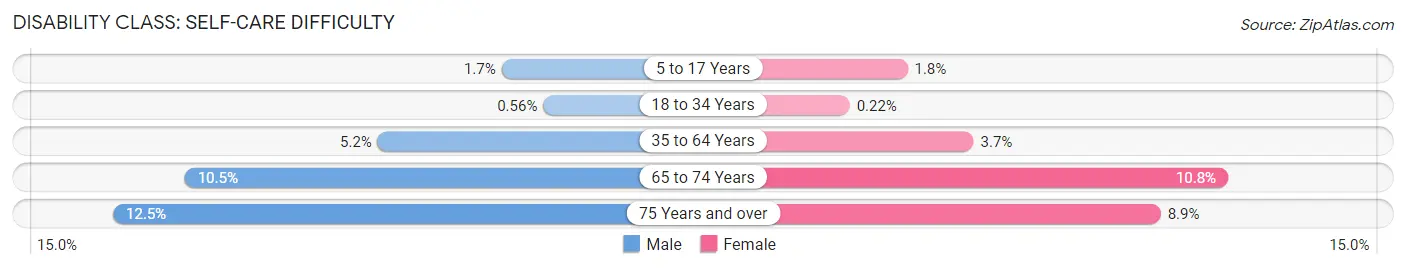
| Age Bracket | Male | Female |
| 5 to 17 Years | 69 (1.7%) | 72 (1.8%) |
| 18 to 34 Years | 27 (0.6%) | 11 (0.2%) |
| 35 to 64 Years | 405 (5.2%) | 291 (3.7%) |
| 65 to 74 Years | 171 (10.5%) | 197 (10.7%) |
| 75 Years and over | 121 (12.5%) | 134 (8.9%) |
Technology Access in Hagerstown
Computing Device Access in Hagerstown
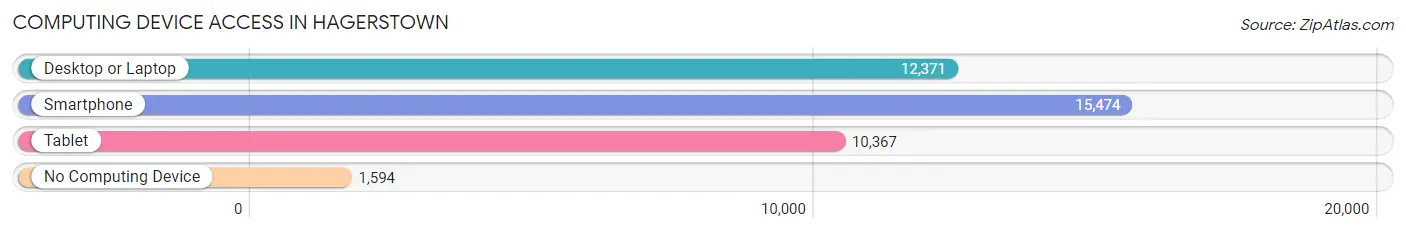
| Device Type | # Households | % Households |
| Desktop or Laptop | 12,371 | 68.1% |
| Smartphone | 15,474 | 85.2% |
| Tablet | 10,367 | 57.1% |
| No Computing Device | 1,594 | 8.8% |
| Total | 18,159 | 100.0% |
Internet Access in Hagerstown
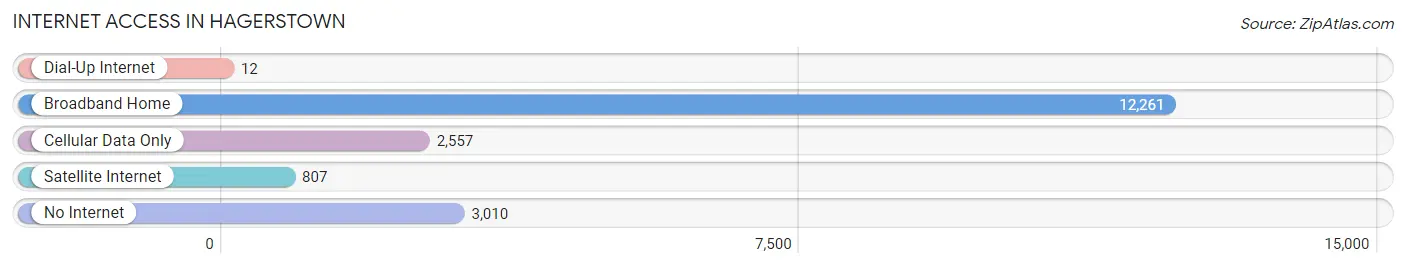
| Internet Type | # Households | % Households |
| Dial-Up Internet | 12 | 0.1% |
| Broadband Home | 12,261 | 67.5% |
| Cellular Data Only | 2,557 | 14.1% |
| Satellite Internet | 807 | 4.4% |
| No Internet | 3,010 | 16.6% |
| Total | 18,159 | 100.0% |
Hagerstown Summary
Hagerstown is a city located in Washington County, Maryland, United States. It is the county seat of Washington County and is located along the Potomac River, approximately 70 miles (110 km) west of Baltimore and 50 miles (80 km) northwest of Washington, D.C. The population was 39,662 at the 2010 census.
History
Hagerstown was founded in 1762 by Jonathan Hager, a German immigrant who had purchased land from the Penn family. The town was named after him and was incorporated in 1813. During the American Civil War, Hagerstown was a major supply center for the Union Army. The Battle of Antietam, the bloodiest battle of the war, was fought just outside the city limits in 1862.
Geography
Hagerstown is located at 39°39′N 77°42′W (39.65, -77.70). According to the United States Census Bureau, the city has a total area of 10.2 square miles (26.4 km2), of which 10.1 square miles (26.2 km2) is land and 0.1 square miles (0.2 km2) is water.
Economy
Hagerstown is a major economic center for the region. The city is home to several large employers, including Meritus Health, Volvo Powertrain, and the Hagerstown Premium Outlets. The city is also home to several smaller businesses, including restaurants, retail stores, and professional services.
Demographics
As of the 2010 census, there were 39,662 people, 16,717 households, and 10,039 families residing in the city. The population density was 3,919.2 people per square mile (1,514.2/km2). There were 18,068 housing units at an average density of 1,785.2 per square mile (690.2/km2). The racial makeup of the city was 79.2% White, 14.3% African American, 0.3% Native American, 1.7% Asian, 0.1% Pacific Islander, 2.2% from other races, and 2.4% from two or more races. Hispanic or Latino of any race were 4.7% of the population.
There were 16,717 households, out of which 28.2% had children under the age of 18 living with them, 41.2% were married couples living together, 14.7% had a female householder with no husband present, and 39.3% were non-families. 32.2% of all households were made up of individuals, and 13.3% had someone living alone who was 65 years of age or older. The average household size was 2.33 and the average family size was 2.94.
In the city, the population was spread out, with 23.2% under the age of 18, 8.7% from 18 to 24, 29.2% from 25 to 44, 22.2% from 45 to 64, and 16.7% who were 65 years of age or older. The median age was 37 years. For every 100 females, there were 91.2 males. For every 100 females age 18 and over, there were 87.2 males.
The median income for a household in the city was $35,945, and the median income for a family was $44,837. Males had a median income of $31,890 versus $25,841 for females. The per capita income for the city was $19,945. About 10.2% of families and 13.3% of the population were below the poverty line, including 19.2% of those under age 18 and 8.7% of those age 65 or over.
Common Questions
What is Per Capita Income in Hagerstown?
Per Capita income in Hagerstown is $27,990.
What is the Median Family Income in Hagerstown?
Median Family Income in Hagerstown is $58,913.
What is the Median Household income in Hagerstown?
Median Household Income in Hagerstown is $48,481.
What is Income or Wage Gap in Hagerstown?
Income or Wage Gap in Hagerstown is 27.0%.
Women in Hagerstown earn 73.0 cents for every dollar earned by a man.
What is Family Income Deficit in Hagerstown?
Family Income Deficit in Hagerstown is $10,347.
Families that are below poverty line in Hagerstown earn $10,347 less on average than the poverty threshold level.
What is Inequality or Gini Index in Hagerstown?
Inequality or Gini Index in Hagerstown is 0.46.
What is the Total Population of Hagerstown?
Total Population of Hagerstown is 43,374.
What is the Total Male Population of Hagerstown?
Total Male Population of Hagerstown is 21,116.
What is the Total Female Population of Hagerstown?
Total Female Population of Hagerstown is 22,258.
What is the Ratio of Males per 100 Females in Hagerstown?
There are 94.87 Males per 100 Females in Hagerstown.
What is the Ratio of Females per 100 Males in Hagerstown?
There are 105.41 Females per 100 Males in Hagerstown.
What is the Median Population Age in Hagerstown?
Median Population Age in Hagerstown is 35.9 Years.
What is the Average Family Size in Hagerstown
Average Family Size in Hagerstown is 3.1 People.
What is the Average Household Size in Hagerstown
Average Household Size in Hagerstown is 2.3 People.
How Large is the Labor Force in Hagerstown?
There are 20,106 People in the Labor Forcein in Hagerstown.
What is the Percentage of People in the Labor Force in Hagerstown?
60.6% of People are in the Labor Force in Hagerstown.
What is the Unemployment Rate in Hagerstown?
Unemployment Rate in Hagerstown is 7.7%.