Hampstead, MD Map & Demographics
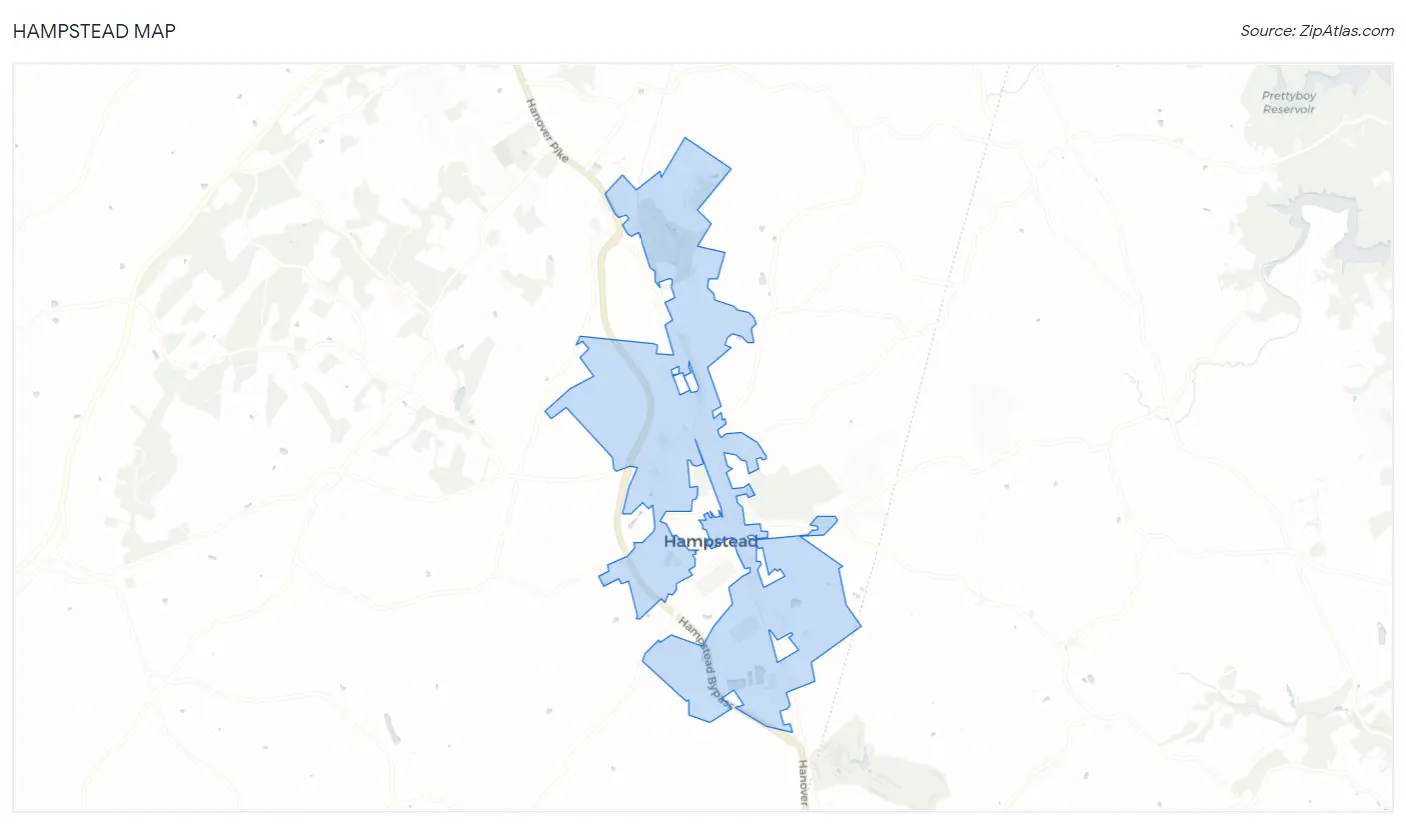
Hampstead Map
Hampstead Overview
$45,936
PER CAPITA INCOME
$116,667
AVG FAMILY INCOME
$87,454
AVG HOUSEHOLD INCOME
16.2%
WAGE / INCOME GAP [ % ]
83.8¢/ $1
WAGE / INCOME GAP [ $ ]
0.41
INEQUALITY / GINI INDEX
6,278
TOTAL POPULATION
2,742
MALE POPULATION
3,536
FEMALE POPULATION
77.55
MALES / 100 FEMALES
128.96
FEMALES / 100 MALES
41.4
MEDIAN AGE
2.9
AVG FAMILY SIZE
2.3
AVG HOUSEHOLD SIZE
3,957
LABOR FORCE [ PEOPLE ]
74.5%
PERCENT IN LABOR FORCE
6.9%
UNEMPLOYMENT RATE
Hampstead Zip Codes
Income in Hampstead
Income Overview in Hampstead
Per Capita Income in Hampstead is $45,936, while median incomes of families and households are $116,667 and $87,454 respectively.
| Characteristic | Number | Measure |
| Per Capita Income | 6,278 | $45,936 |
| Median Family Income | 1,658 | $116,667 |
| Mean Family Income | 1,658 | $135,703 |
| Median Household Income | 2,735 | $87,454 |
| Mean Household Income | 2,735 | $106,104 |
| Income Deficit | 1,658 | $0 |
| Wage / Income Gap (%) | 6,278 | 16.18% |
| Wage / Income Gap ($) | 6,278 | 83.82¢ per $1 |
| Gini / Inequality Index | 6,278 | 0.41 |
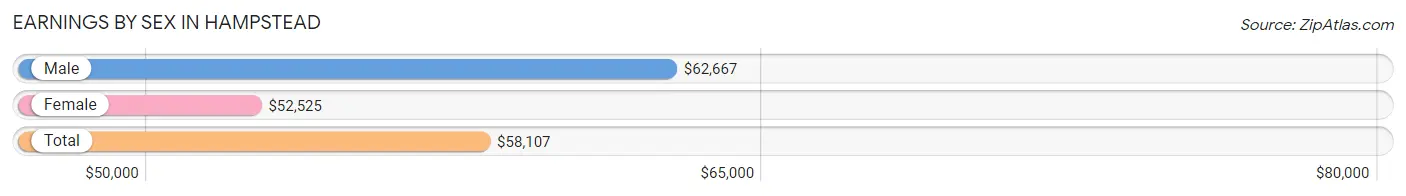
Earnings by Sex in Hampstead
Average Earnings in Hampstead are $58,107, $62,667 for men and $52,525 for women, a difference of 16.2%.
| Sex | Number | Average Earnings |
| Male | 1,916 (49.1%) | $62,667 |
| Female | 1,989 (50.9%) | $52,525 |
| Total | 3,905 (100.0%) | $58,107 |
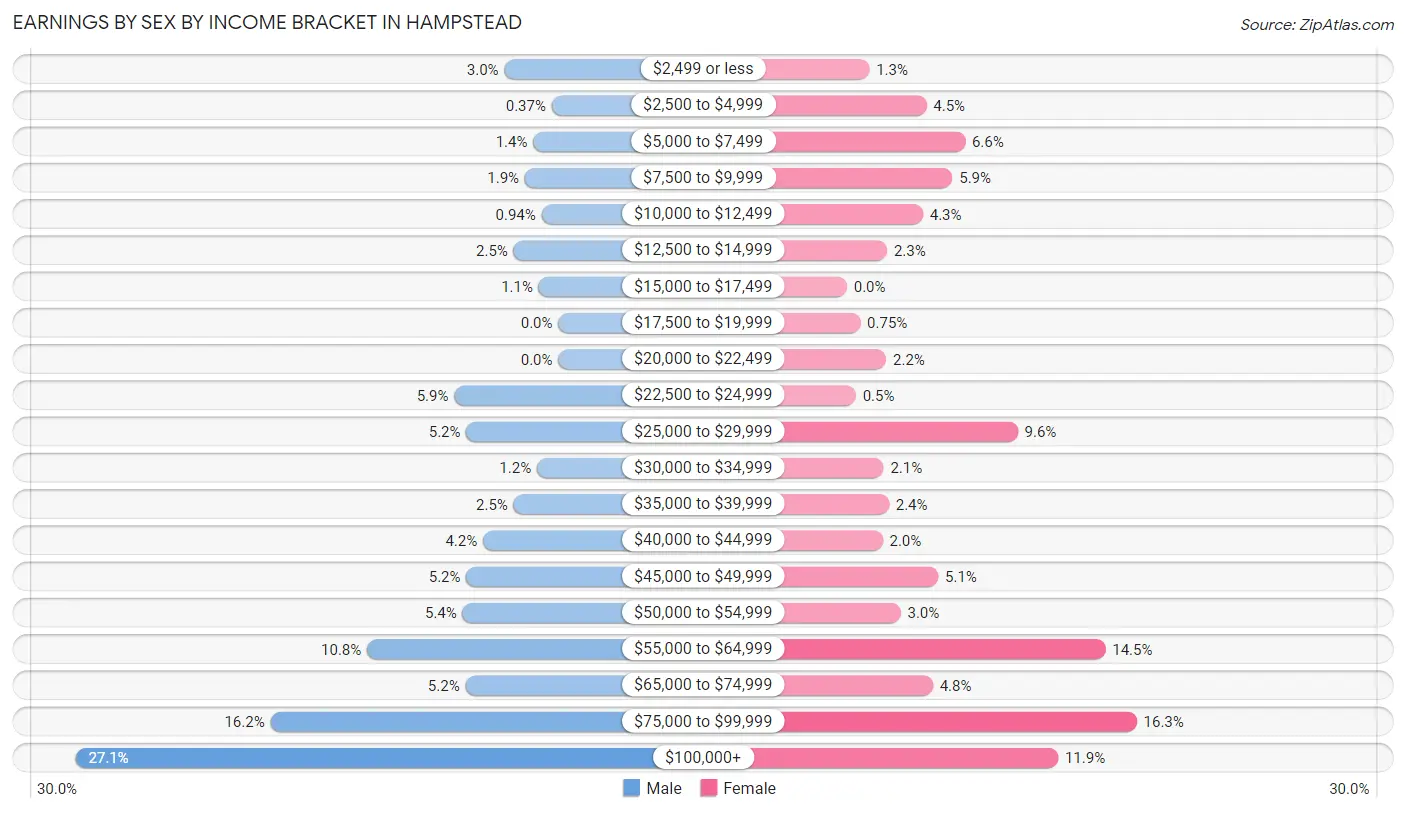
Earnings by Sex by Income Bracket in Hampstead
The most common earnings brackets in Hampstead are $100,000+ for men (520 | 27.1%) and $75,000 to $99,999 for women (324 | 16.3%).
| Income | Male | Female |
| $2,499 or less | 58 (3.0%) | 25 (1.3%) |
| $2,500 to $4,999 | 7 (0.4%) | 89 (4.5%) |
| $5,000 to $7,499 | 27 (1.4%) | 132 (6.6%) |
| $7,500 to $9,999 | 36 (1.9%) | 118 (5.9%) |
| $10,000 to $12,499 | 18 (0.9%) | 85 (4.3%) |
| $12,500 to $14,999 | 48 (2.5%) | 45 (2.3%) |
| $15,000 to $17,499 | 21 (1.1%) | 0 (0.0%) |
| $17,500 to $19,999 | 0 (0.0%) | 15 (0.7%) |
| $20,000 to $22,499 | 0 (0.0%) | 44 (2.2%) |
| $22,500 to $24,999 | 112 (5.9%) | 10 (0.5%) |
| $25,000 to $29,999 | 99 (5.2%) | 191 (9.6%) |
| $30,000 to $34,999 | 23 (1.2%) | 41 (2.1%) |
| $35,000 to $39,999 | 48 (2.5%) | 47 (2.4%) |
| $40,000 to $44,999 | 81 (4.2%) | 40 (2.0%) |
| $45,000 to $49,999 | 99 (5.2%) | 102 (5.1%) |
| $50,000 to $54,999 | 103 (5.4%) | 60 (3.0%) |
| $55,000 to $64,999 | 206 (10.7%) | 289 (14.5%) |
| $65,000 to $74,999 | 100 (5.2%) | 96 (4.8%) |
| $75,000 to $99,999 | 310 (16.2%) | 324 (16.3%) |
| $100,000+ | 520 (27.1%) | 236 (11.9%) |
| Total | 1,916 (100.0%) | 1,989 (100.0%) |
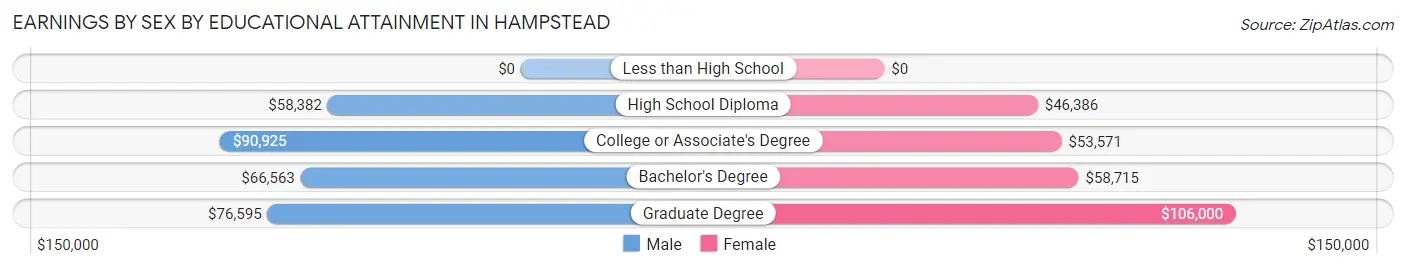
Earnings by Sex by Educational Attainment in Hampstead
Average earnings in Hampstead are $75,625 for men and $58,448 for women, a difference of 22.7%. Men with an educational attainment of college or associate's degree enjoy the highest average annual earnings of $90,925, while those with high school diploma education earn the least with $58,382. Women with an educational attainment of graduate degree earn the most with the average annual earnings of $106,000, while those with high school diploma education have the smallest earnings of $46,386.
| Educational Attainment | Male Income | Female Income |
| Less than High School | - | - |
| High School Diploma | $58,382 | $46,386 |
| College or Associate's Degree | $90,925 | $53,571 |
| Bachelor's Degree | $66,563 | $58,715 |
| Graduate Degree | $76,595 | $106,000 |
| Total | $75,625 | $58,448 |
Family Income in Hampstead
Family Income Brackets in Hampstead
According to the Hampstead family income data, there are 401 families falling into the $100,000 to $149,999 income range, which is the most common income bracket and makes up 24.2% of all families.
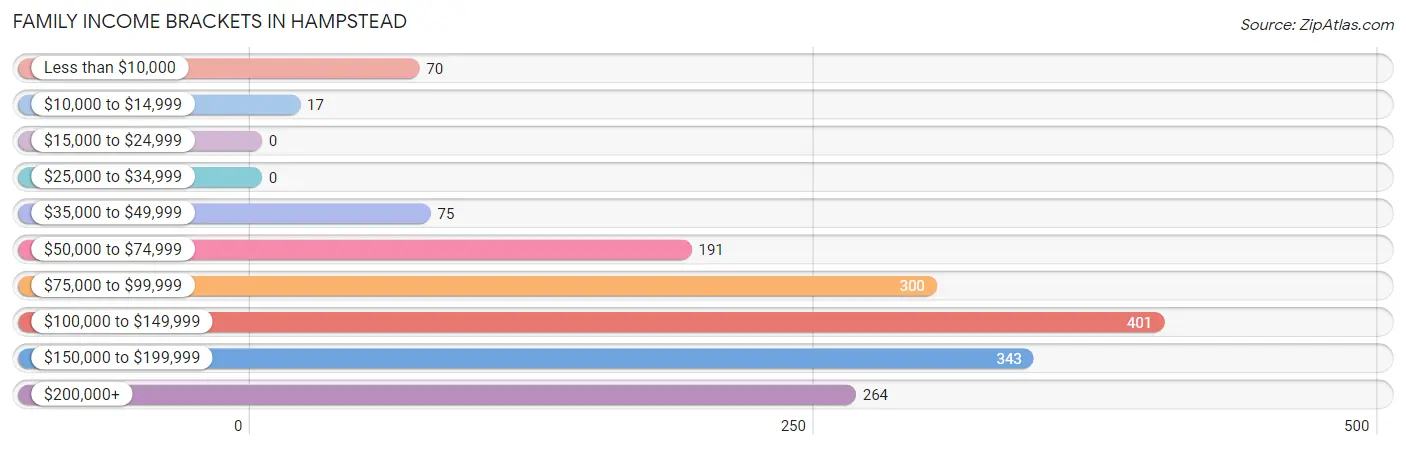
| Income Bracket | # Families | % Families |
| Less than $10,000 | 70 | 4.2% |
| $10,000 to $14,999 | 17 | 1.0% |
| $15,000 to $24,999 | 0 | 0.0% |
| $25,000 to $34,999 | 0 | 0.0% |
| $35,000 to $49,999 | 75 | 4.5% |
| $50,000 to $74,999 | 191 | 11.5% |
| $75,000 to $99,999 | 300 | 18.1% |
| $100,000 to $149,999 | 401 | 24.2% |
| $150,000 to $199,999 | 343 | 20.7% |
| $200,000+ | 264 | 15.9% |
Family Income by Famaliy Size in Hampstead
5-person families (74 | 4.5%) account for the highest median family income in Hampstead with $165,800 per family, while 2-person families (615 | 37.1%) have the highest median income of $54,427 per family member.
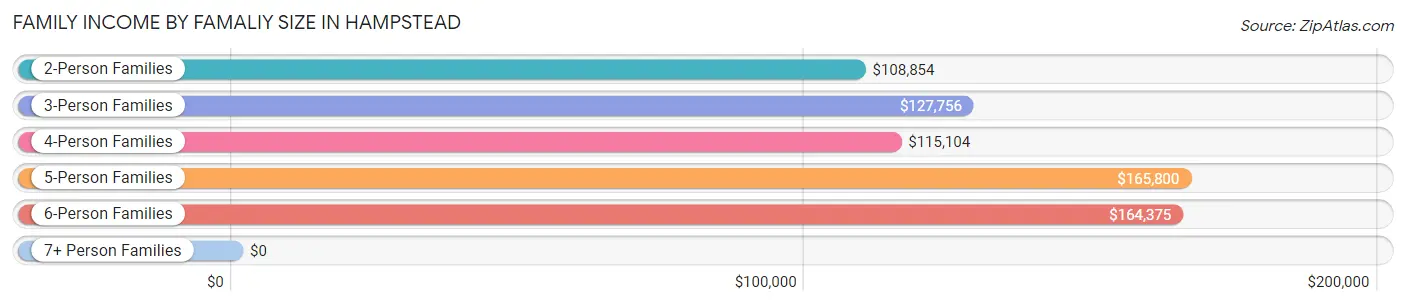
| Income Bracket | # Families | Median Income |
| 2-Person Families | 615 (37.1%) | $108,854 |
| 3-Person Families | 658 (39.7%) | $127,756 |
| 4-Person Families | 289 (17.4%) | $115,104 |
| 5-Person Families | 74 (4.5%) | $165,800 |
| 6-Person Families | 17 (1.0%) | $164,375 |
| 7+ Person Families | 5 (0.3%) | $0 |
| Total | 1,658 (100.0%) | $116,667 |
Family Income by Number of Earners in Hampstead
The median family income in Hampstead is $116,667, with families comprising 3+ earners (326) having the highest median family income of $223,947, while families with 1 earner (406) have the lowest median family income of $88,182, accounting for 19.7% and 24.5% of families, respectively.
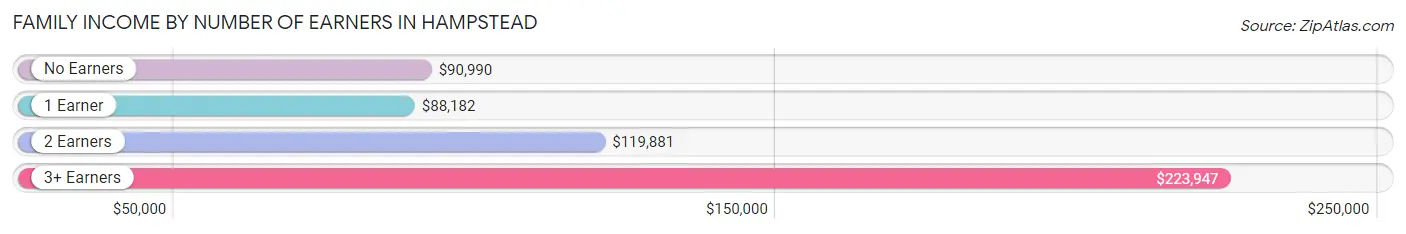
| Number of Earners | # Families | Median Income |
| No Earners | 108 (6.5%) | $90,990 |
| 1 Earner | 406 (24.5%) | $88,182 |
| 2 Earners | 818 (49.3%) | $119,881 |
| 3+ Earners | 326 (19.7%) | $223,947 |
| Total | 1,658 (100.0%) | $116,667 |
Household Income in Hampstead
Household Income Brackets in Hampstead
With 468 households falling in the category, the $100,000 to $149,999 income range is the most frequent in Hampstead, accounting for 17.1% of all households. In contrast, only 16 households (0.6%) fall into the $10,000 to $14,999 income bracket, making it the least populous group.
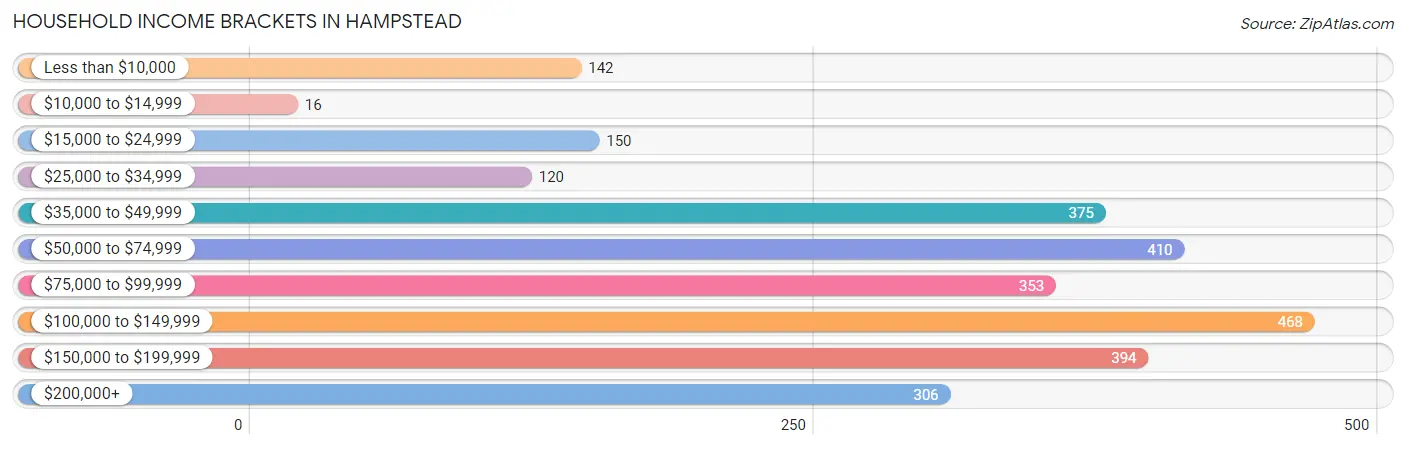
| Income Bracket | # Households | % Households |
| Less than $10,000 | 142 | 5.2% |
| $10,000 to $14,999 | 16 | 0.6% |
| $15,000 to $24,999 | 150 | 5.5% |
| $25,000 to $34,999 | 120 | 4.4% |
| $35,000 to $49,999 | 375 | 13.7% |
| $50,000 to $74,999 | 410 | 15.0% |
| $75,000 to $99,999 | 353 | 12.9% |
| $100,000 to $149,999 | 468 | 17.1% |
| $150,000 to $199,999 | 394 | 14.4% |
| $200,000+ | 306 | 11.2% |
Household Income by Householder Age in Hampstead
The median household income in Hampstead is $87,454, with the highest median household income of $115,679 found in the 25 to 44 years age bracket for the primary householder. A total of 657 households (24.0%) fall into this category. Meanwhile, the 15 to 24 years age bracket for the primary householder has the lowest median household income of $0, with 59 households (2.2%) in this group.
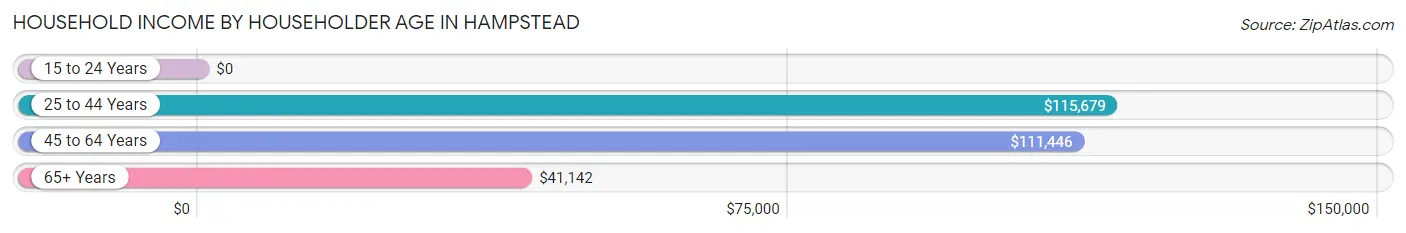
| Income Bracket | # Households | Median Income |
| 15 to 24 Years | 59 (2.2%) | $0 |
| 25 to 44 Years | 657 (24.0%) | $115,679 |
| 45 to 64 Years | 1,359 (49.7%) | $111,446 |
| 65+ Years | 660 (24.1%) | $41,142 |
| Total | 2,735 (100.0%) | $87,454 |
Poverty in Hampstead
Income Below Poverty by Sex and Age in Hampstead
With 4.7% poverty level for males and 8.1% for females among the residents of Hampstead, 16 and 17 year old males and 18 to 24 year old females are the most vulnerable to poverty, with 23 males (59.0%) and 75 females (30.9%) in their respective age groups living below the poverty level.
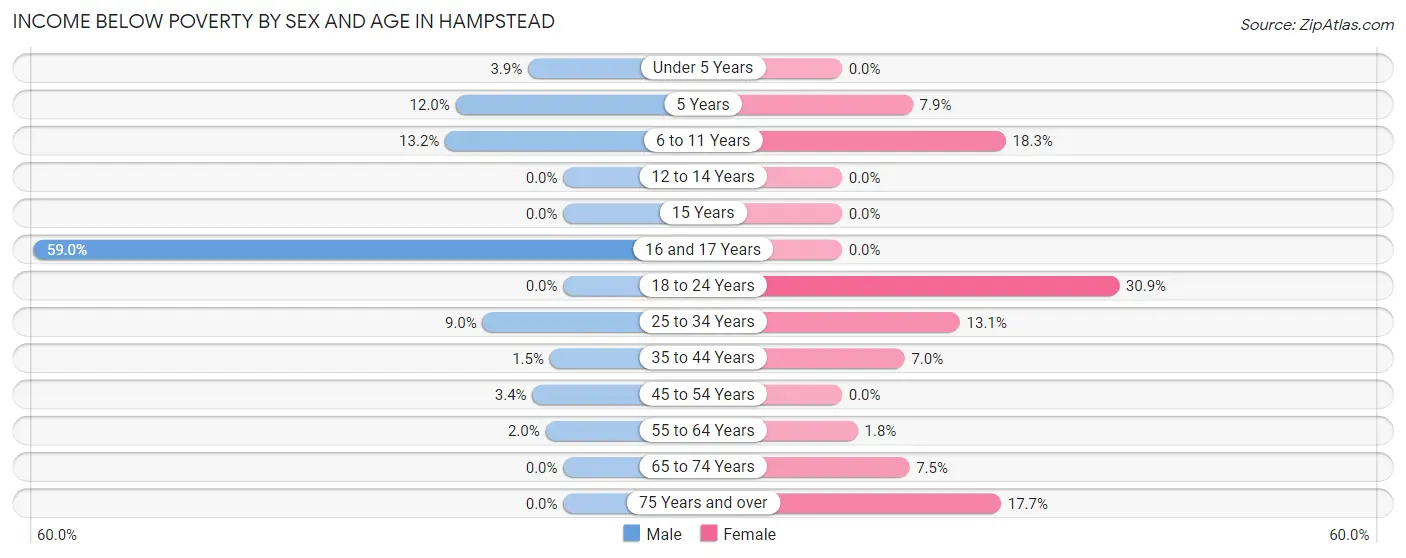
| Age Bracket | Male | Female |
| Under 5 Years | 7 (3.9%) | 0 (0.0%) |
| 5 Years | 3 (12.0%) | 3 (7.9%) |
| 6 to 11 Years | 25 (13.2%) | 25 (18.2%) |
| 12 to 14 Years | 0 (0.0%) | 0 (0.0%) |
| 15 Years | 0 (0.0%) | 0 (0.0%) |
| 16 and 17 Years | 23 (59.0%) | 0 (0.0%) |
| 18 to 24 Years | 0 (0.0%) | 75 (30.9%) |
| 25 to 34 Years | 40 (9.0%) | 71 (13.1%) |
| 35 to 44 Years | 4 (1.5%) | 24 (7.0%) |
| 45 to 54 Years | 16 (3.4%) | 0 (0.0%) |
| 55 to 64 Years | 11 (2.0%) | 13 (1.8%) |
| 65 to 74 Years | 0 (0.0%) | 29 (7.5%) |
| 75 Years and over | 0 (0.0%) | 48 (17.7%) |
| Total | 129 (4.7%) | 288 (8.1%) |
Income Above Poverty by Sex and Age in Hampstead
According to the poverty statistics in Hampstead, males aged 12 to 14 years and females aged under 5 years are the age groups that are most secure financially, with 100.0% of males and 100.0% of females in these age groups living above the poverty line.
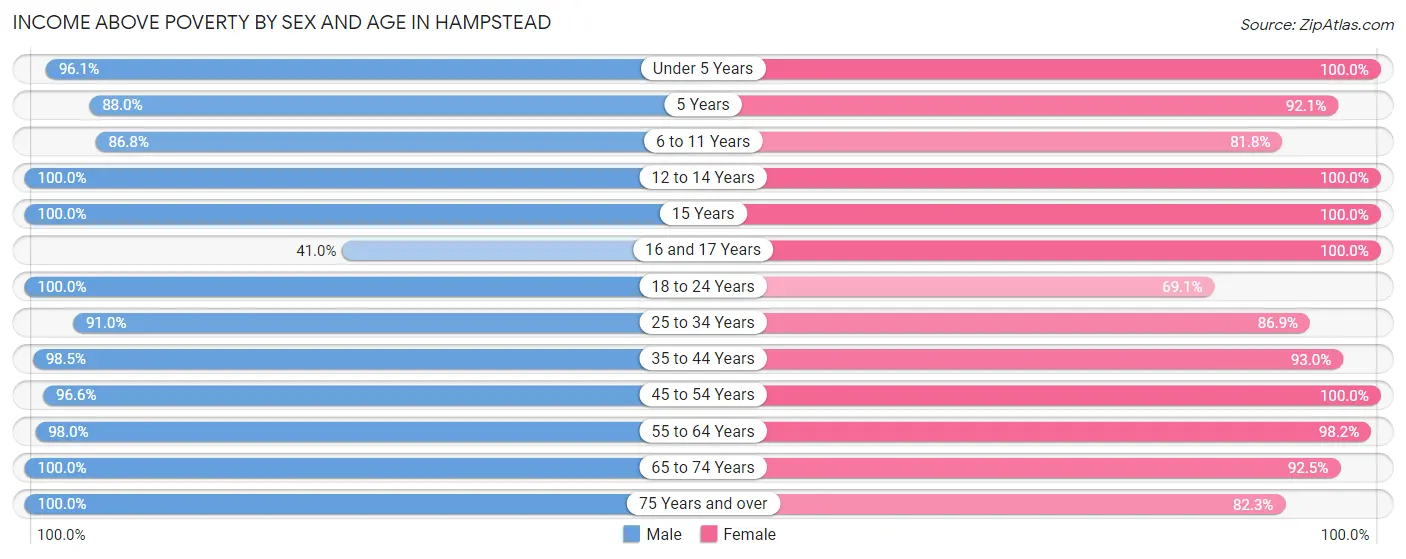
| Age Bracket | Male | Female |
| Under 5 Years | 171 (96.1%) | 190 (100.0%) |
| 5 Years | 22 (88.0%) | 35 (92.1%) |
| 6 to 11 Years | 165 (86.8%) | 112 (81.8%) |
| 12 to 14 Years | 67 (100.0%) | 82 (100.0%) |
| 15 Years | 32 (100.0%) | 28 (100.0%) |
| 16 and 17 Years | 16 (41.0%) | 129 (100.0%) |
| 18 to 24 Years | 275 (100.0%) | 168 (69.1%) |
| 25 to 34 Years | 405 (91.0%) | 470 (86.9%) |
| 35 to 44 Years | 261 (98.5%) | 320 (93.0%) |
| 45 to 54 Years | 449 (96.6%) | 410 (100.0%) |
| 55 to 64 Years | 544 (98.0%) | 724 (98.2%) |
| 65 to 74 Years | 112 (100.0%) | 357 (92.5%) |
| 75 Years and over | 94 (100.0%) | 223 (82.3%) |
| Total | 2,613 (95.3%) | 3,248 (91.9%) |
Income Below Poverty Among Married-Couple Families in Hampstead
The poverty statistics for married-couple families in Hampstead show that 3.5% or 45 of the total 1,272 families live below the poverty line. Families with 3 or 4 children have the highest poverty rate of 7.7%, comprising of 4 families. On the other hand, families with 1 or 2 children have the lowest poverty rate of 0.0%, which includes 0 families.
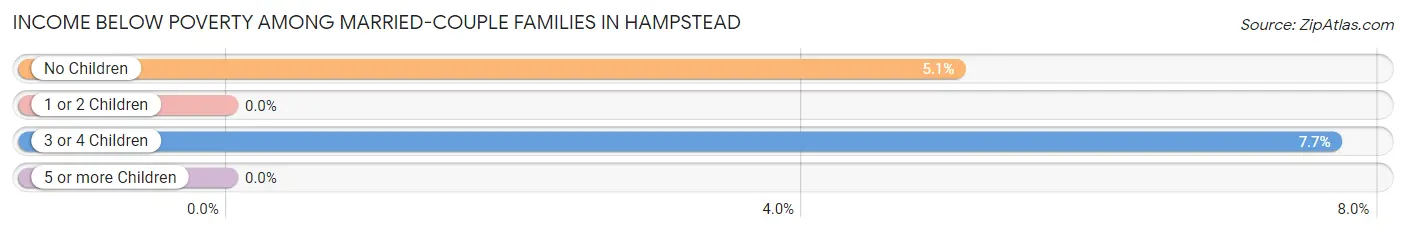
| Children | Above Poverty | Below Poverty |
| No Children | 768 (94.9%) | 41 (5.1%) |
| 1 or 2 Children | 406 (100.0%) | 0 (0.0%) |
| 3 or 4 Children | 48 (92.3%) | 4 (7.7%) |
| 5 or more Children | 5 (100.0%) | 0 (0.0%) |
| Total | 1,227 (96.5%) | 45 (3.5%) |
Income Below Poverty Among Single-Parent Households in Hampstead
According to the poverty data in Hampstead, 13.2% or 16 single-father households and 9.1% or 24 single-mother households are living below the poverty line. Among single-father households, those with no children have the highest poverty rate, with 16 households (100.0%) experiencing poverty. Likewise, among single-mother households, those with 3 or 4 children have the highest poverty rate, with 24 households (42.9%) falling below the poverty line.
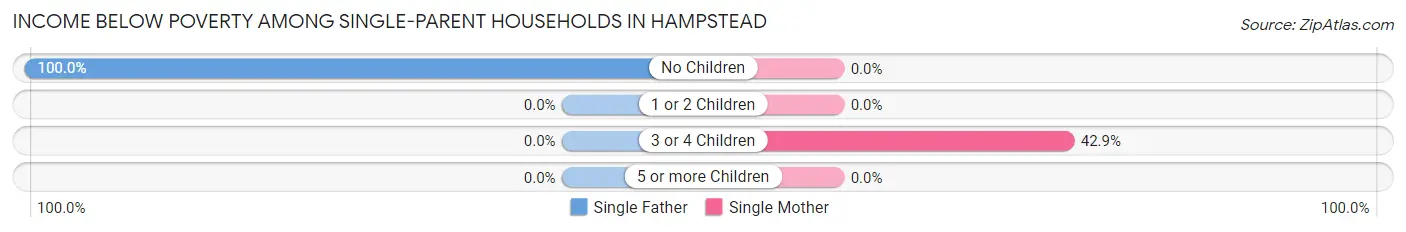
| Children | Single Father | Single Mother |
| No Children | 16 (100.0%) | 0 (0.0%) |
| 1 or 2 Children | 0 (0.0%) | 0 (0.0%) |
| 3 or 4 Children | 0 (0.0%) | 24 (42.9%) |
| 5 or more Children | 0 (0.0%) | 0 (0.0%) |
| Total | 16 (13.2%) | 24 (9.1%) |
Income Below Poverty Among Married-Couple vs Single-Parent Households in Hampstead
The poverty data for Hampstead shows that 45 of the married-couple family households (3.5%) and 40 of the single-parent households (10.4%) are living below the poverty level. Within the married-couple family households, those with 3 or 4 children have the highest poverty rate, with 4 households (7.7%) falling below the poverty line. Among the single-parent households, those with 3 or 4 children have the highest poverty rate, with 24 household (42.9%) living below poverty.
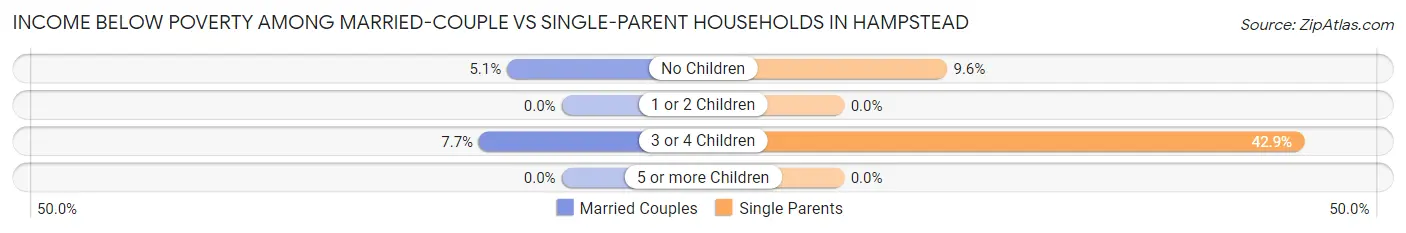
| Children | Married-Couple Families | Single-Parent Households |
| No Children | 41 (5.1%) | 16 (9.6%) |
| 1 or 2 Children | 0 (0.0%) | 0 (0.0%) |
| 3 or 4 Children | 4 (7.7%) | 24 (42.9%) |
| 5 or more Children | 0 (0.0%) | 0 (0.0%) |
| Total | 45 (3.5%) | 40 (10.4%) |
Race in Hampstead
The most populous races in Hampstead are White / Caucasian (5,568 | 88.7%), Asian (268 | 4.3%), and Black / African American (185 | 2.9%).
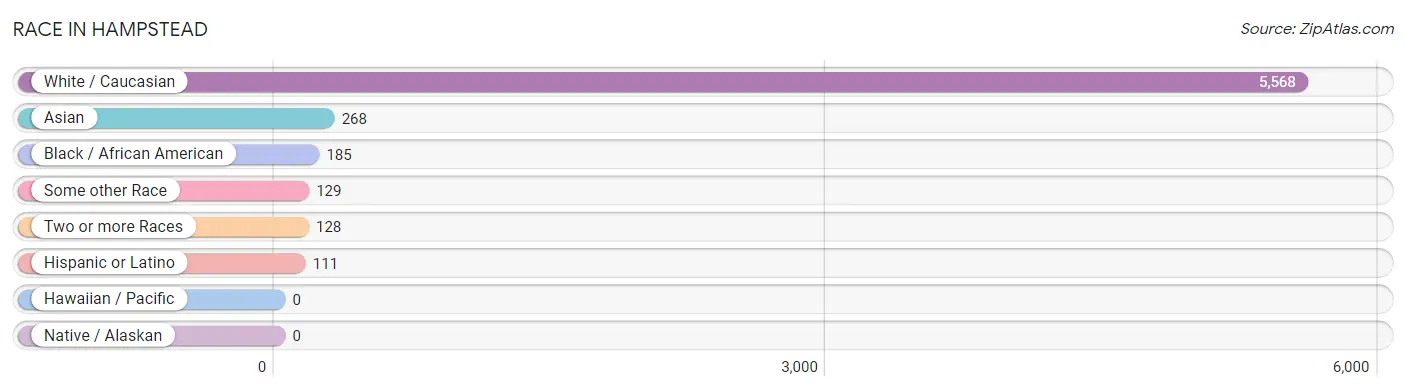
| Race | # Population | % Population |
| Asian | 268 | 4.3% |
| Black / African American | 185 | 2.9% |
| Hawaiian / Pacific | 0 | 0.0% |
| Hispanic or Latino | 111 | 1.8% |
| Native / Alaskan | 0 | 0.0% |
| White / Caucasian | 5,568 | 88.7% |
| Two or more Races | 128 | 2.0% |
| Some other Race | 129 | 2.1% |
| Total | 6,278 | 100.0% |
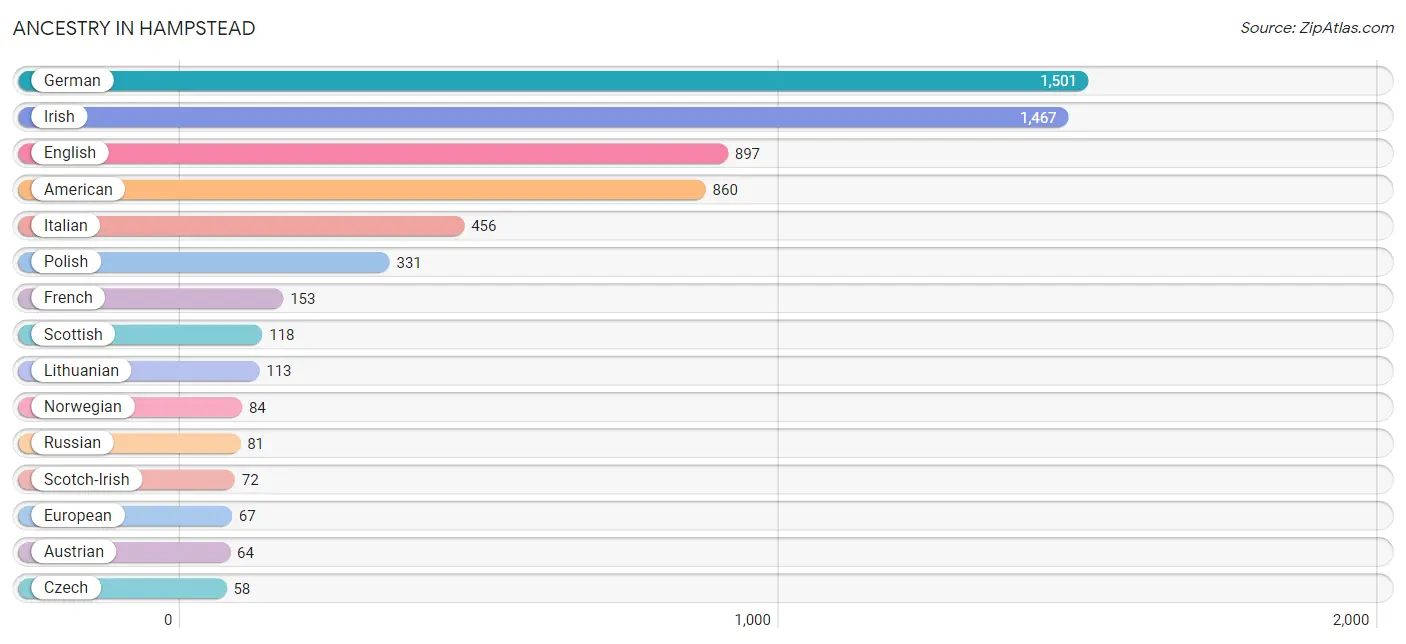
Ancestry in Hampstead
The most populous ancestries reported in Hampstead are German (1,501 | 23.9%), Irish (1,467 | 23.4%), English (897 | 14.3%), American (860 | 13.7%), and Italian (456 | 7.3%), together accounting for 82.5% of all Hampstead residents.
| Ancestry | # Population | % Population |
| African | 16 | 0.3% |
| American | 860 | 13.7% |
| Arab | 7 | 0.1% |
| Austrian | 64 | 1.0% |
| British | 20 | 0.3% |
| Burmese | 48 | 0.8% |
| Canadian | 20 | 0.3% |
| Chilean | 40 | 0.6% |
| Croatian | 17 | 0.3% |
| Czech | 58 | 0.9% |
| Czechoslovakian | 12 | 0.2% |
| Dominican | 20 | 0.3% |
| Dutch | 38 | 0.6% |
| Eastern European | 42 | 0.7% |
| English | 897 | 14.3% |
| European | 67 | 1.1% |
| French | 153 | 2.4% |
| French Canadian | 10 | 0.2% |
| German | 1,501 | 23.9% |
| Greek | 50 | 0.8% |
| Hungarian | 39 | 0.6% |
| Indian (Asian) | 25 | 0.4% |
| Irish | 1,467 | 23.4% |
| Italian | 456 | 7.3% |
| Korean | 52 | 0.8% |
| Lithuanian | 113 | 1.8% |
| Mexican | 10 | 0.2% |
| Norwegian | 84 | 1.3% |
| Polish | 331 | 5.3% |
| Puerto Rican | 34 | 0.5% |
| Russian | 81 | 1.3% |
| Scotch-Irish | 72 | 1.1% |
| Scottish | 118 | 1.9% |
| Slovak | 10 | 0.2% |
| South American | 40 | 0.6% |
| Spanish | 7 | 0.1% |
| Subsaharan African | 16 | 0.3% |
| Swedish | 7 | 0.1% |
| Ukrainian | 30 | 0.5% |
| Welsh | 49 | 0.8% | View All 40 Rows |
Immigrants in Hampstead
The most numerous immigrant groups reported in Hampstead came from Asia (124 | 2.0%), Philippines (52 | 0.8%), South Eastern Asia (52 | 0.8%), Eastern Asia (37 | 0.6%), and Korea (37 | 0.6%), together accounting for 4.8% of all Hampstead residents.
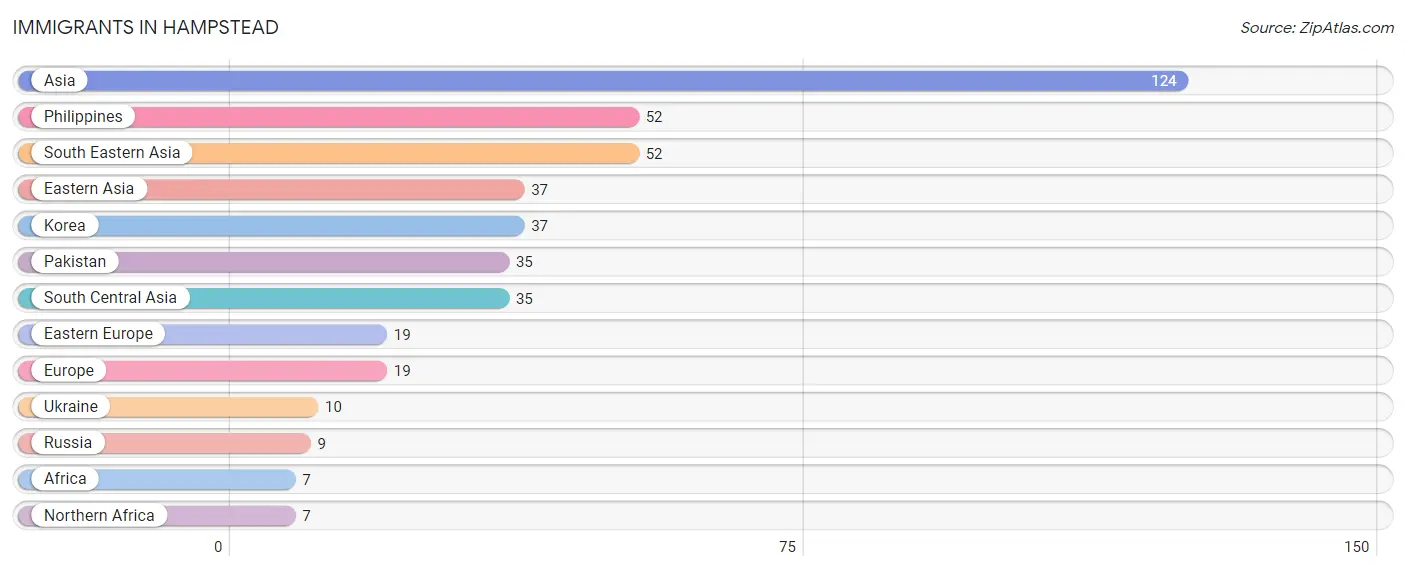
| Immigration Origin | # Population | % Population |
| Africa | 7 | 0.1% |
| Asia | 124 | 2.0% |
| Eastern Asia | 37 | 0.6% |
| Eastern Europe | 19 | 0.3% |
| Europe | 19 | 0.3% |
| Korea | 37 | 0.6% |
| Northern Africa | 7 | 0.1% |
| Pakistan | 35 | 0.6% |
| Philippines | 52 | 0.8% |
| Russia | 9 | 0.1% |
| South Central Asia | 35 | 0.6% |
| South Eastern Asia | 52 | 0.8% |
| Ukraine | 10 | 0.2% | View All 13 Rows |
Sex and Age in Hampstead
Sex and Age in Hampstead
The most populous age groups in Hampstead are 55 to 59 Years (284 | 10.4%) for men and 55 to 59 Years (518 | 14.6%) for women.
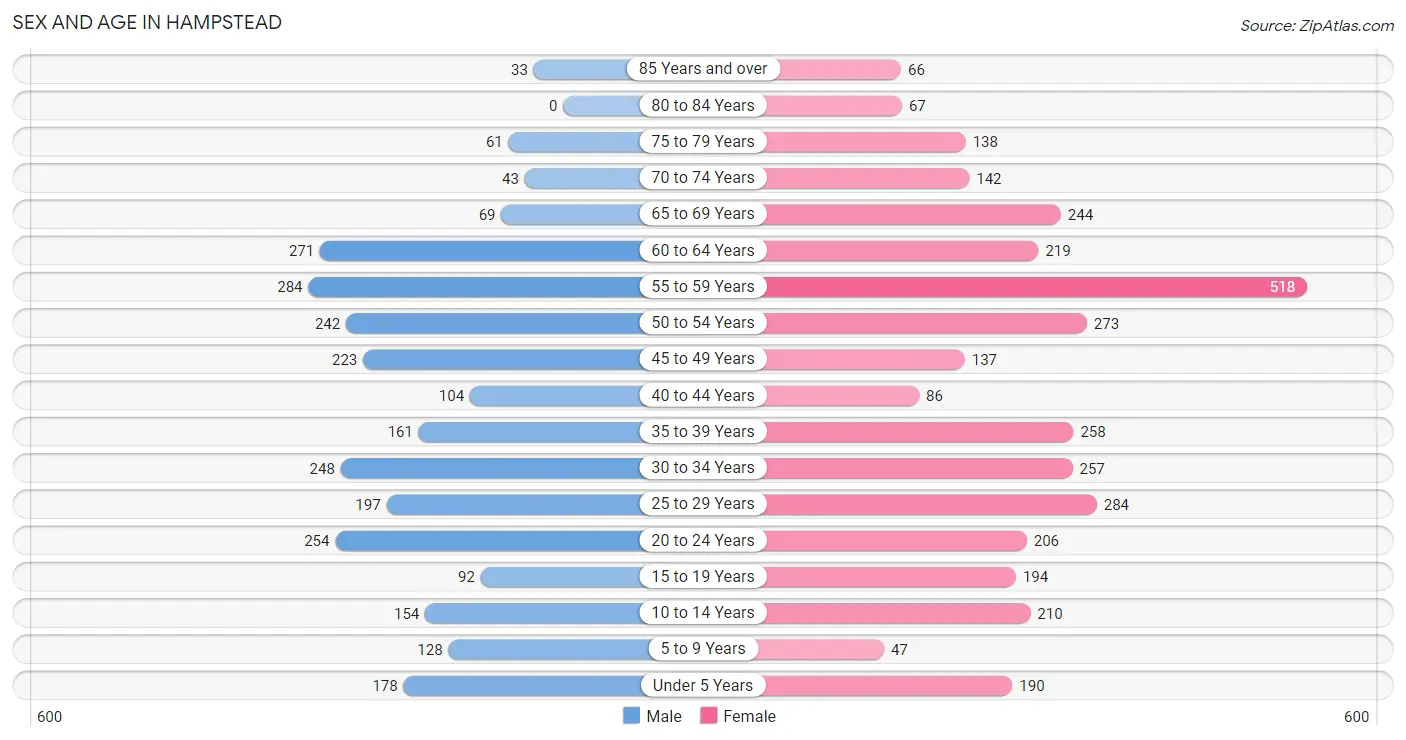
| Age Bracket | Male | Female |
| Under 5 Years | 178 (6.5%) | 190 (5.4%) |
| 5 to 9 Years | 128 (4.7%) | 47 (1.3%) |
| 10 to 14 Years | 154 (5.6%) | 210 (5.9%) |
| 15 to 19 Years | 92 (3.4%) | 194 (5.5%) |
| 20 to 24 Years | 254 (9.3%) | 206 (5.8%) |
| 25 to 29 Years | 197 (7.2%) | 284 (8.0%) |
| 30 to 34 Years | 248 (9.0%) | 257 (7.3%) |
| 35 to 39 Years | 161 (5.9%) | 258 (7.3%) |
| 40 to 44 Years | 104 (3.8%) | 86 (2.4%) |
| 45 to 49 Years | 223 (8.1%) | 137 (3.9%) |
| 50 to 54 Years | 242 (8.8%) | 273 (7.7%) |
| 55 to 59 Years | 284 (10.4%) | 518 (14.6%) |
| 60 to 64 Years | 271 (9.9%) | 219 (6.2%) |
| 65 to 69 Years | 69 (2.5%) | 244 (6.9%) |
| 70 to 74 Years | 43 (1.6%) | 142 (4.0%) |
| 75 to 79 Years | 61 (2.2%) | 138 (3.9%) |
| 80 to 84 Years | 0 (0.0%) | 67 (1.9%) |
| 85 Years and over | 33 (1.2%) | 66 (1.9%) |
| Total | 2,742 (100.0%) | 3,536 (100.0%) |
Families and Households in Hampstead
Median Family Size in Hampstead
The median family size in Hampstead is 2.93 persons per family, with single female/mother families (265 | 16.0%) accounting for the largest median family size of 3.03 persons per family. On the other hand, single male/father families (121 | 7.3%) represent the smallest median family size with 2.27 persons per family.
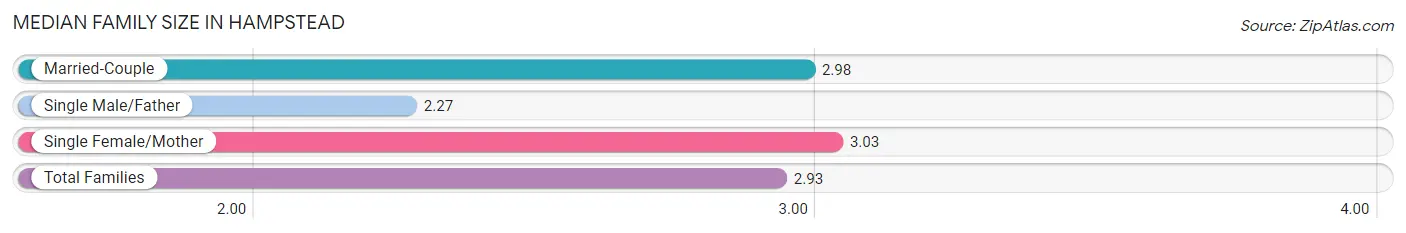
| Family Type | # Families | Family Size |
| Married-Couple | 1,272 (76.7%) | 2.98 |
| Single Male/Father | 121 (7.3%) | 2.27 |
| Single Female/Mother | 265 (16.0%) | 3.03 |
| Total Families | 1,658 (100.0%) | 2.93 |
Median Household Size in Hampstead
The median household size in Hampstead is 2.30 persons per household, with single female/mother households (265 | 9.7%) accounting for the largest median household size of 3.46 persons per household. non-family households (1,077 | 39.4%) represent the smallest median household size with 1.16 persons per household.
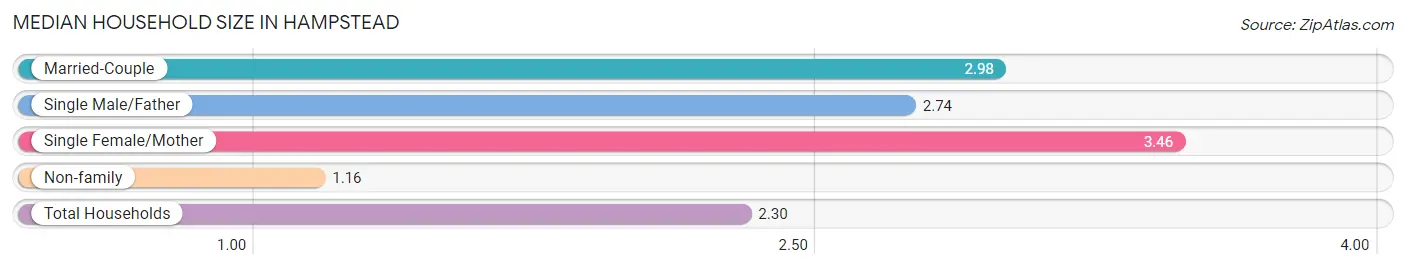
| Household Type | # Households | Household Size |
| Married-Couple | 1,272 (46.5%) | 2.98 |
| Single Male/Father | 121 (4.4%) | 2.74 |
| Single Female/Mother | 265 (9.7%) | 3.46 |
| Non-family | 1,077 (39.4%) | 1.16 |
| Total Households | 2,735 (100.0%) | 2.30 |
Household Size by Marriage Status in Hampstead
Out of a total of 2,735 households in Hampstead, 1,658 (60.6%) are family households, while 1,077 (39.4%) are nonfamily households. The most numerous type of family households are 3-person households, comprising 794, and the most common type of nonfamily households are 1-person households, comprising 931.
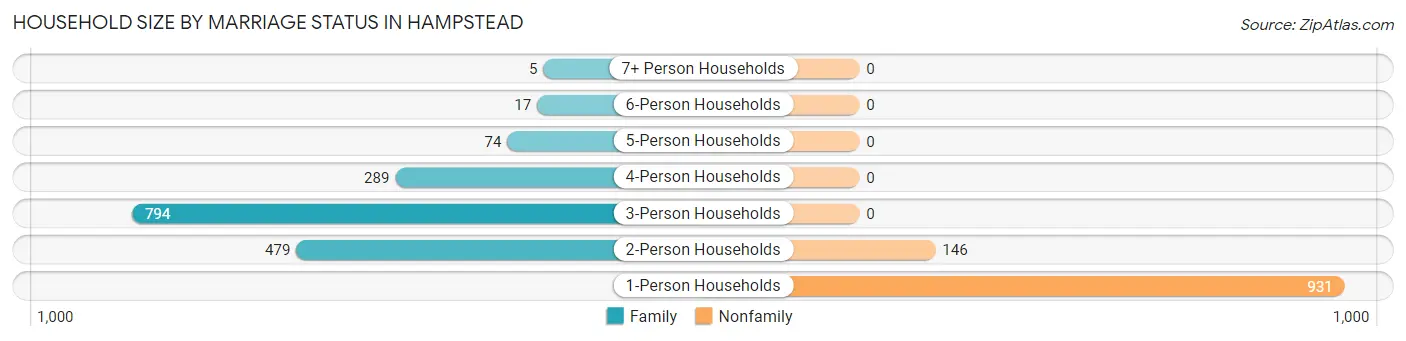
| Household Size | Family Households | Nonfamily Households |
| 1-Person Households | - | 931 (34.0%) |
| 2-Person Households | 479 (17.5%) | 146 (5.3%) |
| 3-Person Households | 794 (29.0%) | 0 (0.0%) |
| 4-Person Households | 289 (10.6%) | 0 (0.0%) |
| 5-Person Households | 74 (2.7%) | 0 (0.0%) |
| 6-Person Households | 17 (0.6%) | 0 (0.0%) |
| 7+ Person Households | 5 (0.2%) | 0 (0.0%) |
| Total | 1,658 (60.6%) | 1,077 (39.4%) |
Female Fertility in Hampstead
Fertility by Age in Hampstead
Average fertility rate in Hampstead is 68.0 births per 1,000 women. Women in the age bracket of 20 to 34 years have the highest fertility rate with 122.0 births per 1,000 women. Women in the age bracket of 20 to 34 years acount for 91.0% of all women with births.
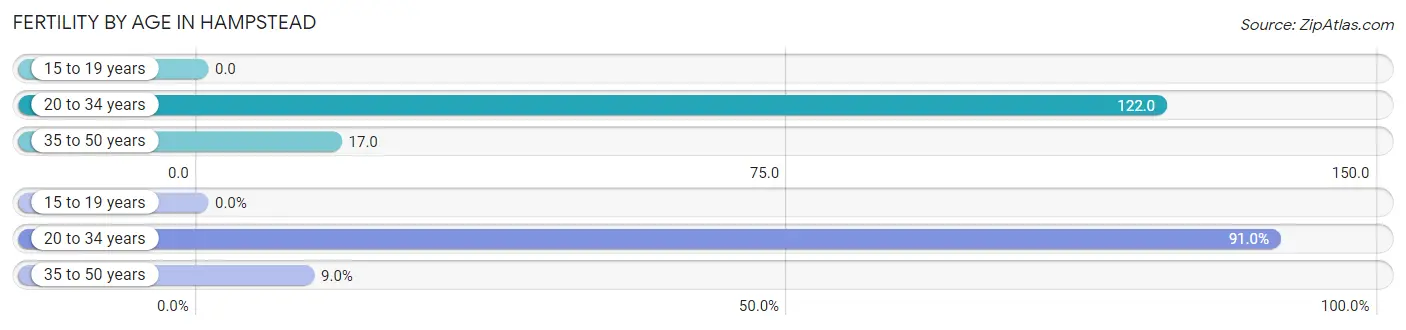
| Age Bracket | Women with Births | Births / 1,000 Women |
| 15 to 19 years | 0 (0.0%) | 0.0 |
| 20 to 34 years | 91 (91.0%) | 122.0 |
| 35 to 50 years | 9 (9.0%) | 17.0 |
| Total | 100 (100.0%) | 68.0 |
Fertility by Age by Marriage Status in Hampstead
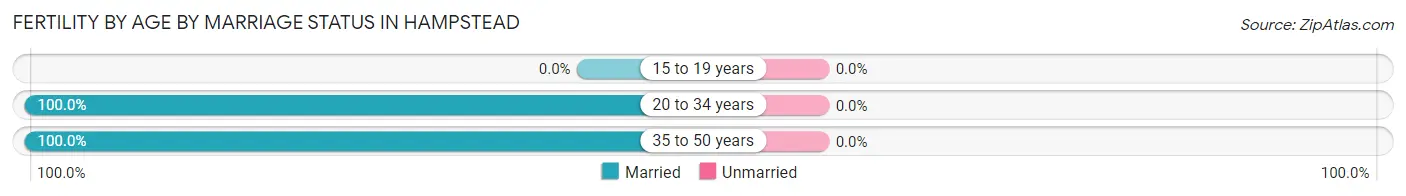
| Age Bracket | Married | Unmarried |
| 15 to 19 years | 0 (0.0%) | 0 (0.0%) |
| 20 to 34 years | 91 (100.0%) | 0 (0.0%) |
| 35 to 50 years | 9 (100.0%) | 0 (0.0%) |
| Total | 100 (100.0%) | 0 (0.0%) |
Fertility by Education in Hampstead
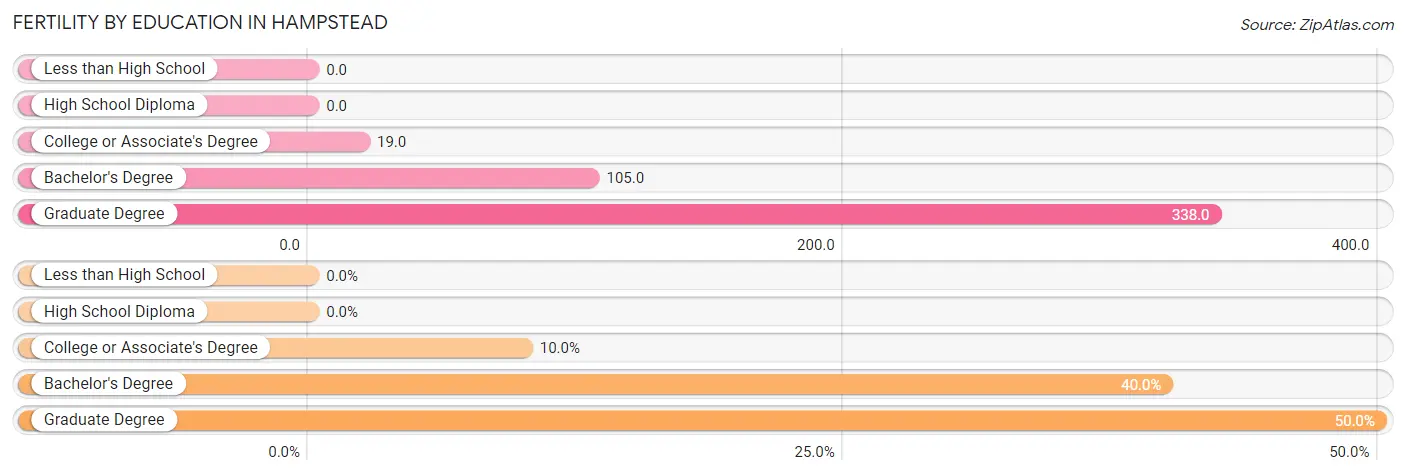
| Educational Attainment | Women with Births | Births / 1,000 Women |
| Less than High School | 0 (0.0%) | 0.0 |
| High School Diploma | 0 (0.0%) | 0.0 |
| College or Associate's Degree | 10 (10.0%) | 19.0 |
| Bachelor's Degree | 40 (40.0%) | 105.0 |
| Graduate Degree | 50 (50.0%) | 338.0 |
| Total | 100 (100.0%) | 68.0 |
Fertility by Education by Marriage Status in Hampstead
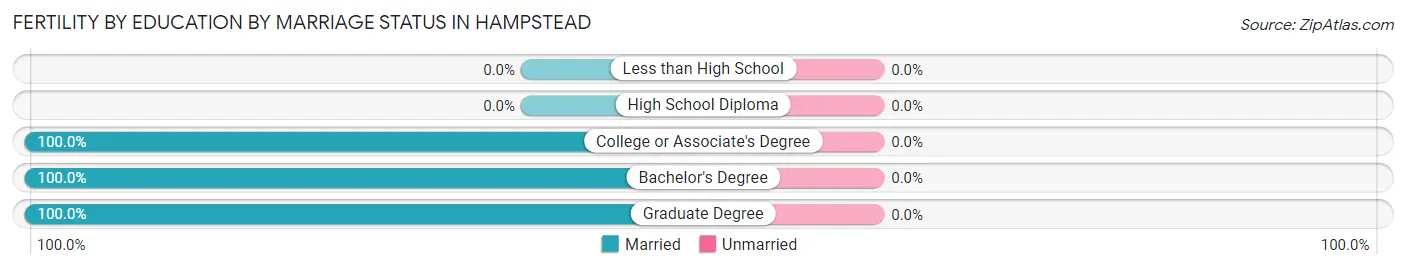
| Educational Attainment | Married | Unmarried |
| Less than High School | 0 (0.0%) | 0 (0.0%) |
| High School Diploma | 0 (0.0%) | 0 (0.0%) |
| College or Associate's Degree | 10 (100.0%) | 0 (0.0%) |
| Bachelor's Degree | 40 (100.0%) | 0 (0.0%) |
| Graduate Degree | 50 (100.0%) | 0 (0.0%) |
| Total | 100 (100.0%) | 0 (0.0%) |
Employment Characteristics in Hampstead
Employment by Class of Employer in Hampstead
Among the 3,651 employed individuals in Hampstead, private company employees (2,414 | 66.1%), not-for-profit organizations (508 | 13.9%), and local government employees (319 | 8.7%) make up the most common classes of employment.
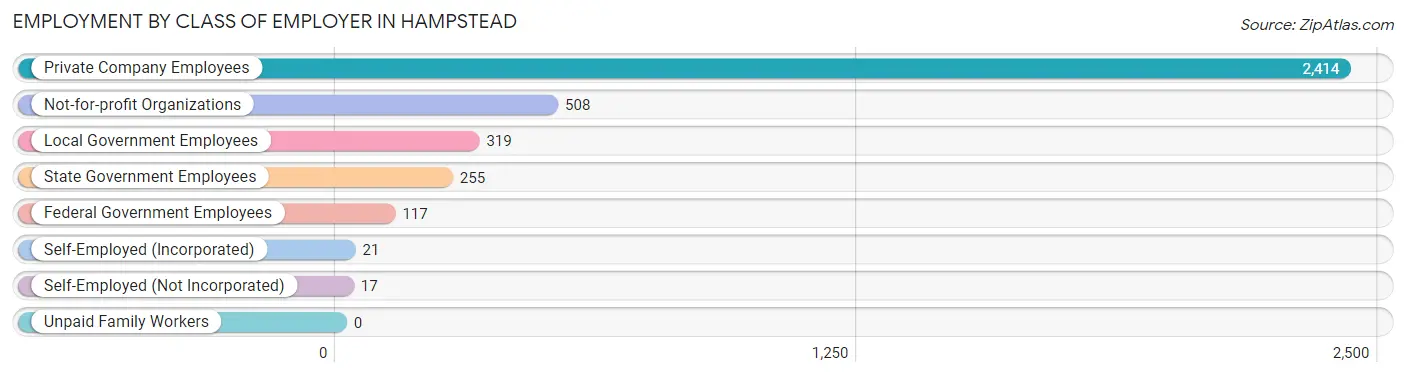
| Employer Class | # Employees | % Employees |
| Private Company Employees | 2,414 | 66.1% |
| Self-Employed (Incorporated) | 21 | 0.6% |
| Self-Employed (Not Incorporated) | 17 | 0.5% |
| Not-for-profit Organizations | 508 | 13.9% |
| Local Government Employees | 319 | 8.7% |
| State Government Employees | 255 | 7.0% |
| Federal Government Employees | 117 | 3.2% |
| Unpaid Family Workers | 0 | 0.0% |
| Total | 3,651 | 100.0% |
Employment Status by Age in Hampstead
According to the labor force statistics for Hampstead, out of the total population over 16 years of age (5,311), 74.5% or 3,957 individuals are in the labor force, with 6.9% or 273 of them unemployed. The age group with the highest labor force participation rate is 30 to 34 years, with 96.6% or 488 individuals in the labor force. Within the labor force, the 16 to 19 years age range has the highest percentage of unemployed individuals, with 16.2% or 18 of them being unemployed.
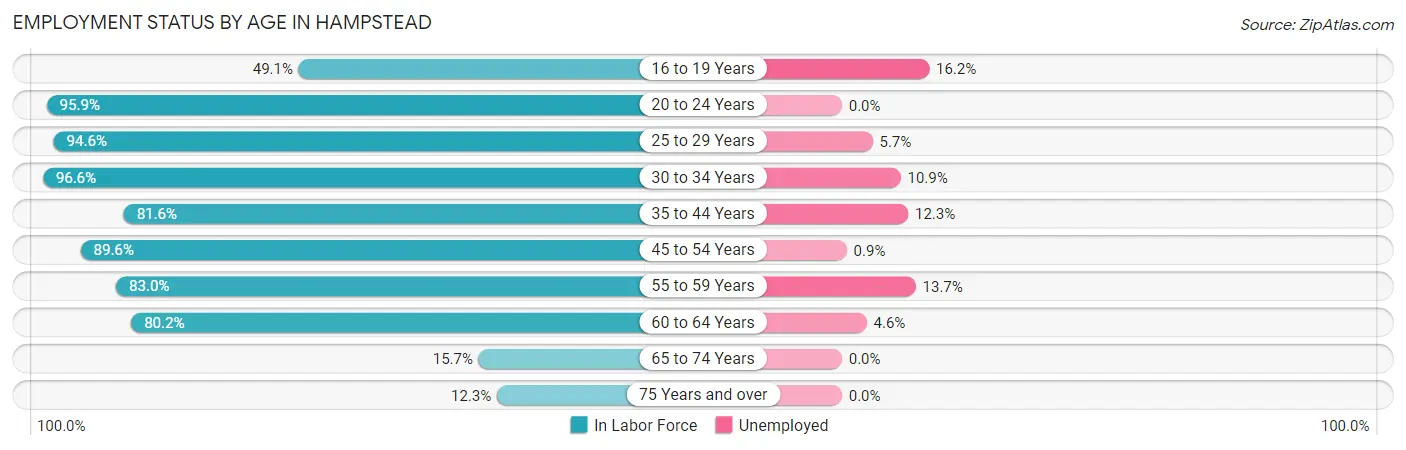
| Age Bracket | In Labor Force | Unemployed |
| 16 to 19 Years | 111 (49.1%) | 18 (16.2%) |
| 20 to 24 Years | 441 (95.9%) | 0 (0.0%) |
| 25 to 29 Years | 455 (94.6%) | 26 (5.7%) |
| 30 to 34 Years | 488 (96.6%) | 53 (10.9%) |
| 35 to 44 Years | 497 (81.6%) | 61 (12.3%) |
| 45 to 54 Years | 784 (89.6%) | 7 (0.9%) |
| 55 to 59 Years | 666 (83.0%) | 91 (13.7%) |
| 60 to 64 Years | 393 (80.2%) | 18 (4.6%) |
| 65 to 74 Years | 78 (15.7%) | 0 (0.0%) |
| 75 Years and over | 45 (12.3%) | 0 (0.0%) |
| Total | 3,957 (74.5%) | 273 (6.9%) |
Employment Status by Educational Attainment in Hampstead
According to labor force statistics for Hampstead, 87.3% of individuals (3,284) out of the total population between 25 and 64 years of age (3,762) are in the labor force, with 7.8% or 256 of them being unemployed. The group with the highest labor force participation rate are those with the educational attainment of bachelor's degree or higher, with 93.8% or 1,609 individuals in the labor force. Within the labor force, individuals with high school diploma education have the highest percentage of unemployment, with 13.7% or 97 of them being unemployed.
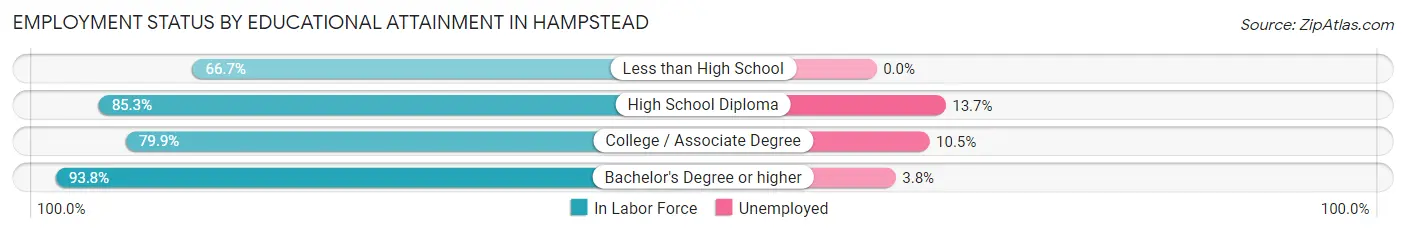
| Educational Attainment | In Labor Force | Unemployed |
| Less than High School | 32 (66.7%) | 0 (0.0%) |
| High School Diploma | 710 (85.3%) | 114 (13.7%) |
| College / Associate Degree | 932 (79.9%) | 123 (10.5%) |
| Bachelor's Degree or higher | 1,609 (93.8%) | 65 (3.8%) |
| Total | 3,284 (87.3%) | 293 (7.8%) |
Employment Occupations by Sex in Hampstead
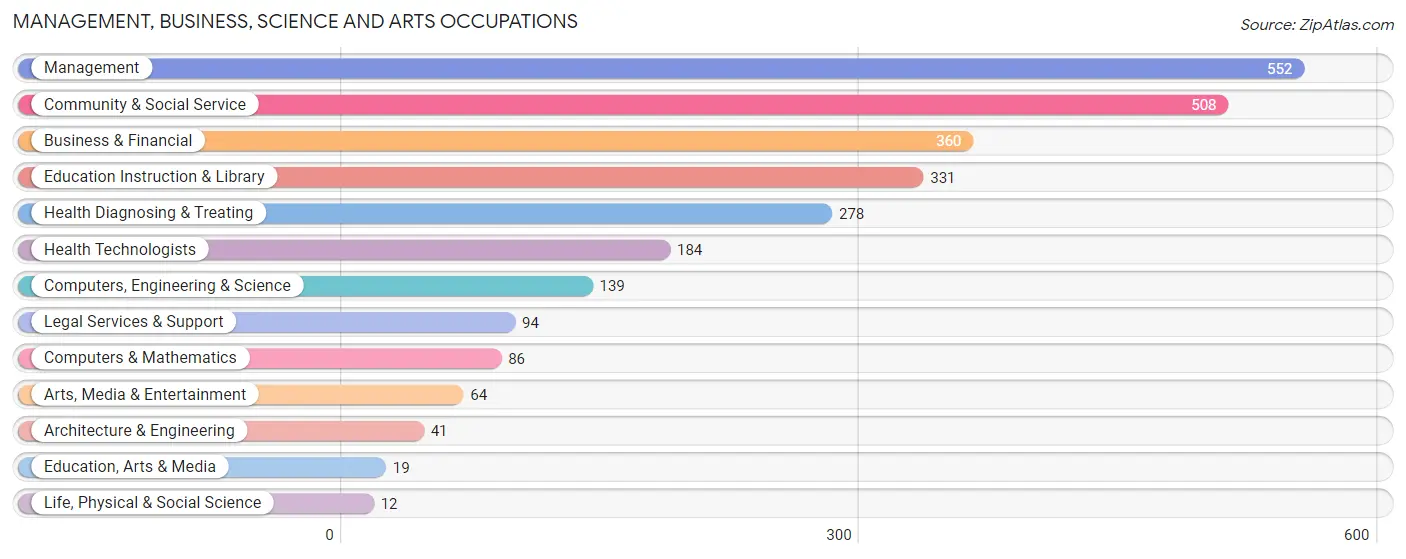
Management, Business, Science and Arts Occupations
The most common Management, Business, Science and Arts occupations in Hampstead are Management (552 | 15.0%), Community & Social Service (508 | 13.8%), Business & Financial (360 | 9.8%), Education Instruction & Library (331 | 9.0%), and Health Diagnosing & Treating (278 | 7.5%).
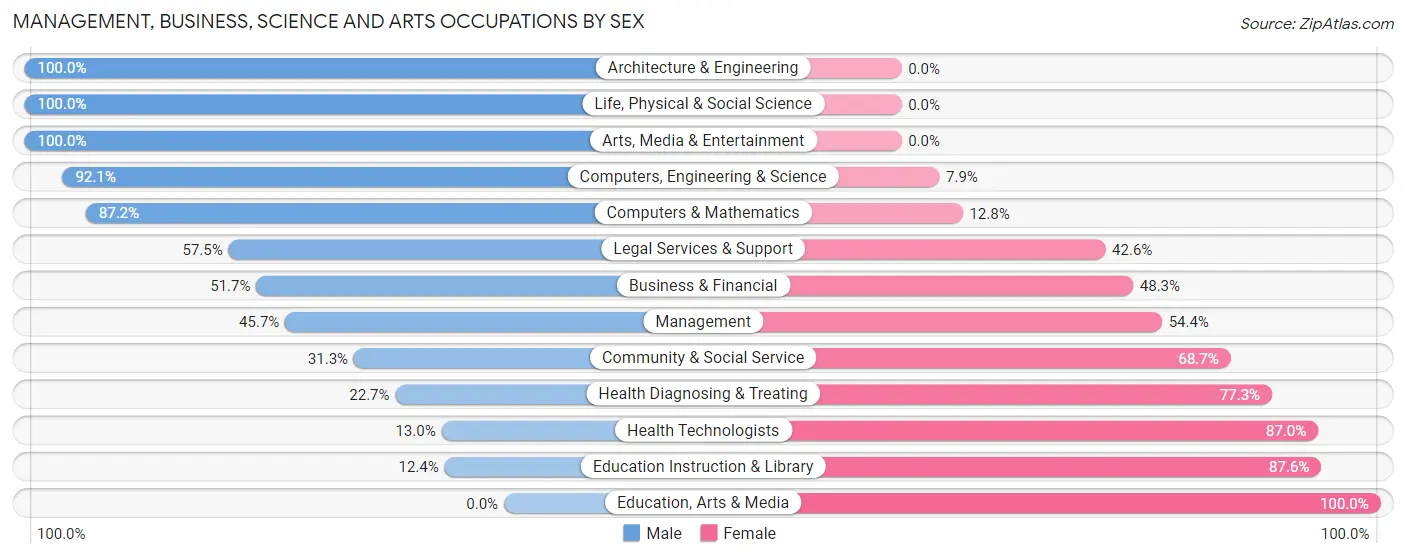
Management, Business, Science and Arts Occupations by Sex
Within the Management, Business, Science and Arts occupations in Hampstead, the most male-oriented occupations are Architecture & Engineering (100.0%), Life, Physical & Social Science (100.0%), and Arts, Media & Entertainment (100.0%), while the most female-oriented occupations are Education, Arts & Media (100.0%), Education Instruction & Library (87.6%), and Health Technologists (87.0%).
| Occupation | Male | Female |
| Management | 252 (45.7%) | 300 (54.3%) |
| Business & Financial | 186 (51.7%) | 174 (48.3%) |
| Computers, Engineering & Science | 128 (92.1%) | 11 (7.9%) |
| Computers & Mathematics | 75 (87.2%) | 11 (12.8%) |
| Architecture & Engineering | 41 (100.0%) | 0 (0.0%) |
| Life, Physical & Social Science | 12 (100.0%) | 0 (0.0%) |
| Community & Social Service | 159 (31.3%) | 349 (68.7%) |
| Education, Arts & Media | 0 (0.0%) | 19 (100.0%) |
| Legal Services & Support | 54 (57.5%) | 40 (42.5%) |
| Education Instruction & Library | 41 (12.4%) | 290 (87.6%) |
| Arts, Media & Entertainment | 64 (100.0%) | 0 (0.0%) |
| Health Diagnosing & Treating | 63 (22.7%) | 215 (77.3%) |
| Health Technologists | 24 (13.0%) | 160 (87.0%) |
| Total (Category) | 788 (42.9%) | 1,049 (57.1%) |
| Total (Overall) | 1,757 (47.7%) | 1,927 (52.3%) |
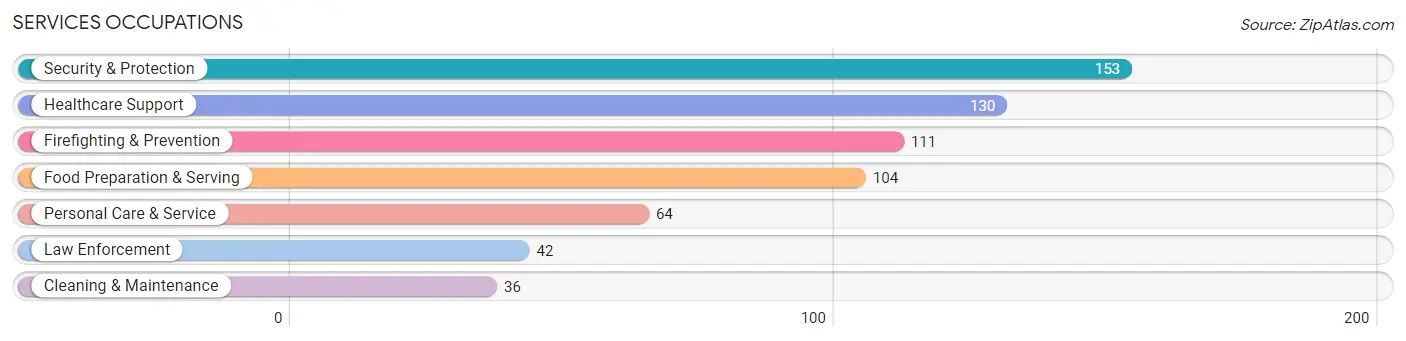
Services Occupations
The most common Services occupations in Hampstead are Security & Protection (153 | 4.2%), Healthcare Support (130 | 3.5%), Firefighting & Prevention (111 | 3.0%), Food Preparation & Serving (104 | 2.8%), and Personal Care & Service (64 | 1.7%).
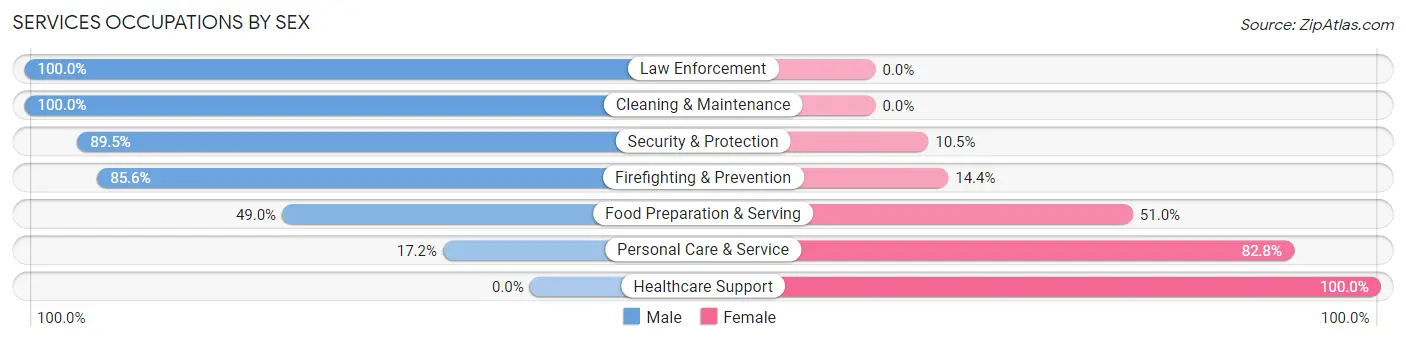
Services Occupations by Sex
Within the Services occupations in Hampstead, the most male-oriented occupations are Law Enforcement (100.0%), Cleaning & Maintenance (100.0%), and Security & Protection (89.5%), while the most female-oriented occupations are Healthcare Support (100.0%), Personal Care & Service (82.8%), and Food Preparation & Serving (51.0%).
| Occupation | Male | Female |
| Healthcare Support | 0 (0.0%) | 130 (100.0%) |
| Security & Protection | 137 (89.5%) | 16 (10.5%) |
| Firefighting & Prevention | 95 (85.6%) | 16 (14.4%) |
| Law Enforcement | 42 (100.0%) | 0 (0.0%) |
| Food Preparation & Serving | 51 (49.0%) | 53 (51.0%) |
| Cleaning & Maintenance | 36 (100.0%) | 0 (0.0%) |
| Personal Care & Service | 11 (17.2%) | 53 (82.8%) |
| Total (Category) | 235 (48.2%) | 252 (51.7%) |
| Total (Overall) | 1,757 (47.7%) | 1,927 (52.3%) |
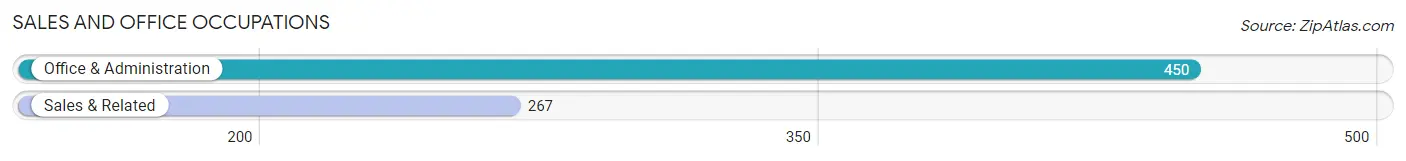
Sales and Office Occupations
The most common Sales and Office occupations in Hampstead are Office & Administration (450 | 12.2%), and Sales & Related (267 | 7.2%).
Sales and Office Occupations by Sex
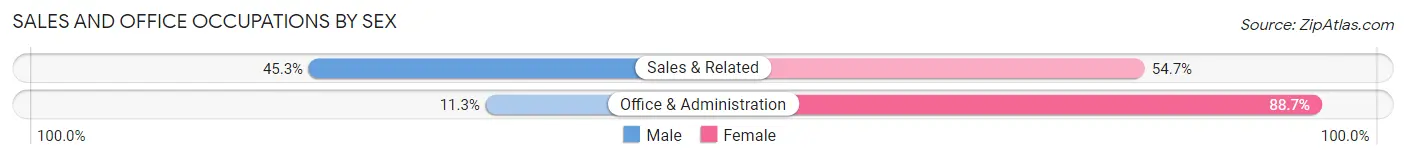
| Occupation | Male | Female |
| Sales & Related | 121 (45.3%) | 146 (54.7%) |
| Office & Administration | 51 (11.3%) | 399 (88.7%) |
| Total (Category) | 172 (24.0%) | 545 (76.0%) |
| Total (Overall) | 1,757 (47.7%) | 1,927 (52.3%) |
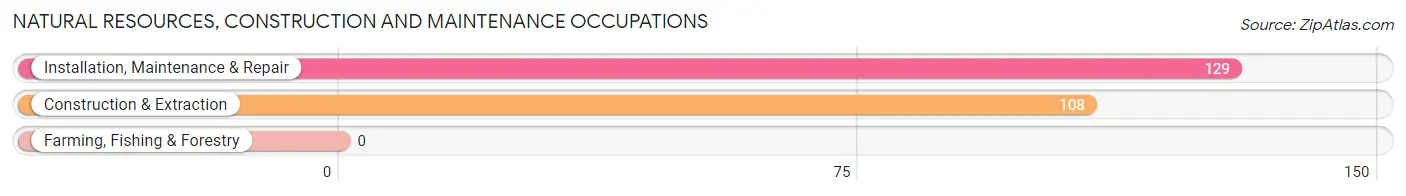
Natural Resources, Construction and Maintenance Occupations
The most common Natural Resources, Construction and Maintenance occupations in Hampstead are Installation, Maintenance & Repair (129 | 3.5%), and Construction & Extraction (108 | 2.9%).
Natural Resources, Construction and Maintenance Occupations by Sex
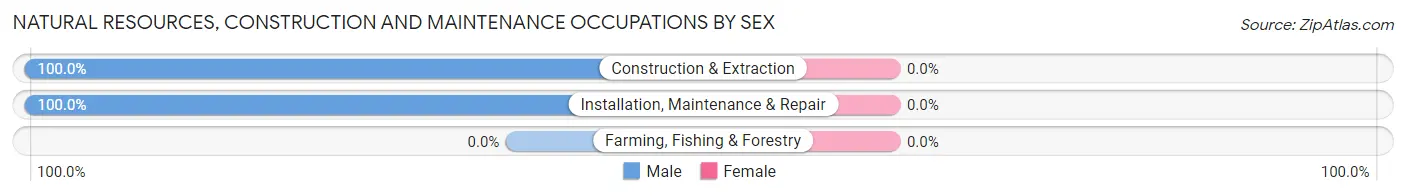
| Occupation | Male | Female |
| Farming, Fishing & Forestry | 0 (0.0%) | 0 (0.0%) |
| Construction & Extraction | 108 (100.0%) | 0 (0.0%) |
| Installation, Maintenance & Repair | 129 (100.0%) | 0 (0.0%) |
| Total (Category) | 237 (100.0%) | 0 (0.0%) |
| Total (Overall) | 1,757 (47.7%) | 1,927 (52.3%) |
Production, Transportation and Moving Occupations
The most common Production, Transportation and Moving occupations in Hampstead are Transportation (261 | 7.1%), Material Moving (95 | 2.6%), and Production (50 | 1.4%).
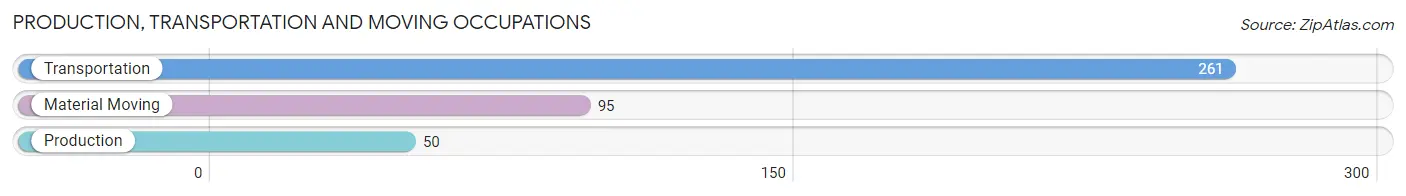
Production, Transportation and Moving Occupations by Sex
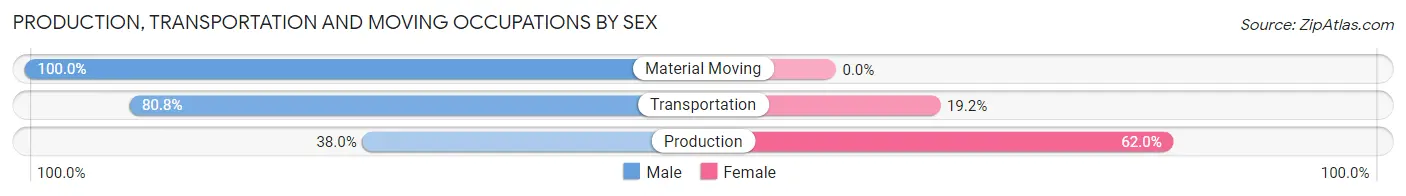
| Occupation | Male | Female |
| Production | 19 (38.0%) | 31 (62.0%) |
| Transportation | 211 (80.8%) | 50 (19.2%) |
| Material Moving | 95 (100.0%) | 0 (0.0%) |
| Total (Category) | 325 (80.0%) | 81 (20.0%) |
| Total (Overall) | 1,757 (47.7%) | 1,927 (52.3%) |
Employment Industries by Sex in Hampstead
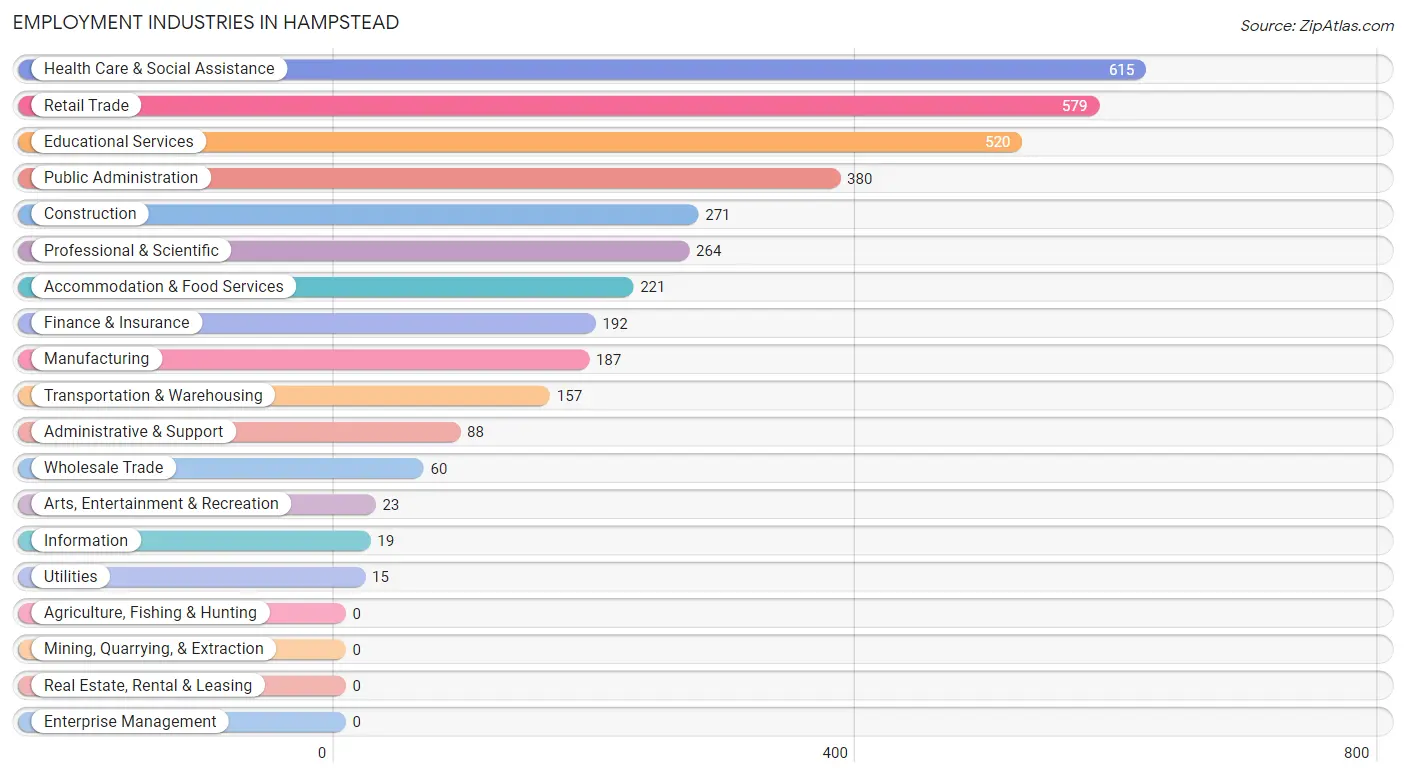
Employment Industries in Hampstead
The major employment industries in Hampstead include Health Care & Social Assistance (615 | 16.7%), Retail Trade (579 | 15.7%), Educational Services (520 | 14.1%), Public Administration (380 | 10.3%), and Construction (271 | 7.4%).
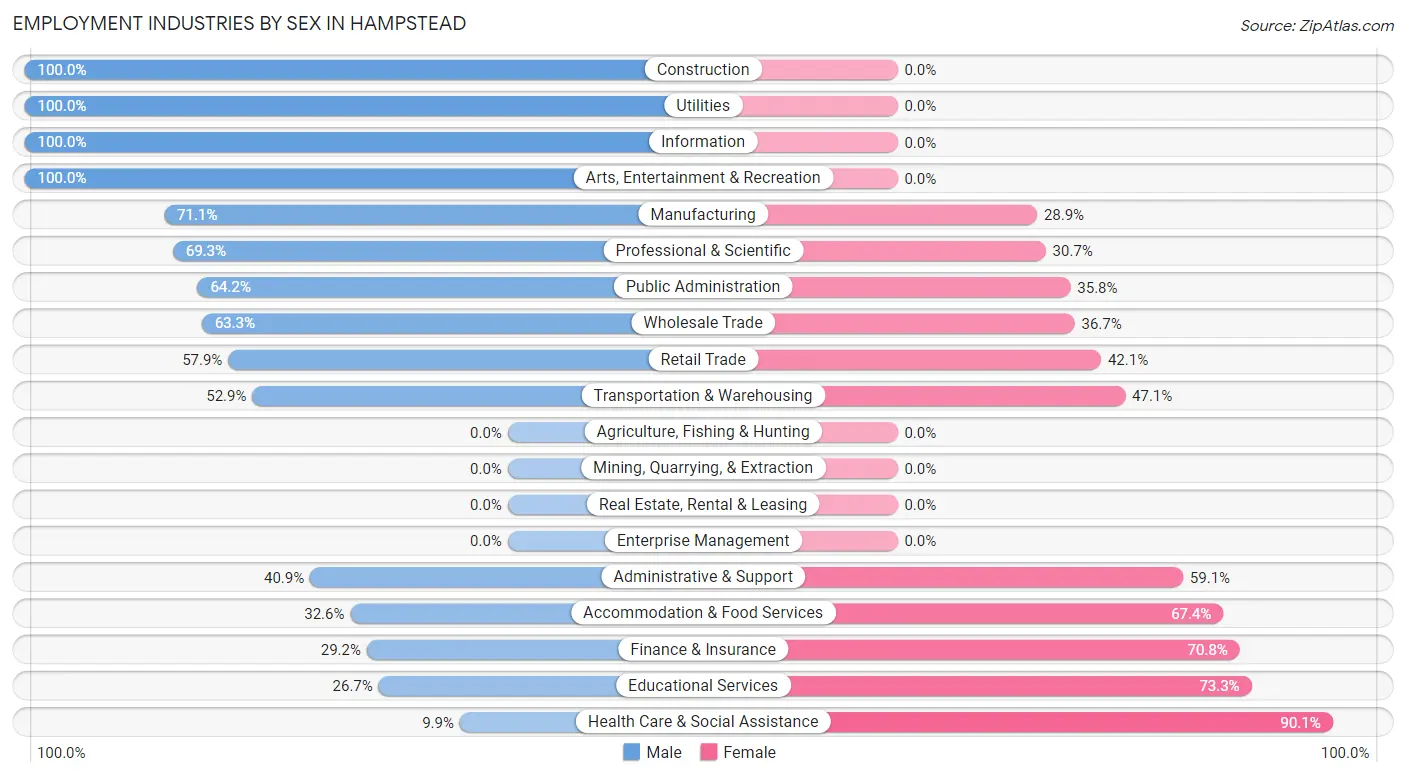
Employment Industries by Sex in Hampstead
The Hampstead industries that see more men than women are Construction (100.0%), Utilities (100.0%), and Information (100.0%), whereas the industries that tend to have a higher number of women are Health Care & Social Assistance (90.1%), Educational Services (73.3%), and Finance & Insurance (70.8%).
| Industry | Male | Female |
| Agriculture, Fishing & Hunting | 0 (0.0%) | 0 (0.0%) |
| Mining, Quarrying, & Extraction | 0 (0.0%) | 0 (0.0%) |
| Construction | 271 (100.0%) | 0 (0.0%) |
| Manufacturing | 133 (71.1%) | 54 (28.9%) |
| Wholesale Trade | 38 (63.3%) | 22 (36.7%) |
| Retail Trade | 335 (57.9%) | 244 (42.1%) |
| Transportation & Warehousing | 83 (52.9%) | 74 (47.1%) |
| Utilities | 15 (100.0%) | 0 (0.0%) |
| Information | 19 (100.0%) | 0 (0.0%) |
| Finance & Insurance | 56 (29.2%) | 136 (70.8%) |
| Real Estate, Rental & Leasing | 0 (0.0%) | 0 (0.0%) |
| Professional & Scientific | 183 (69.3%) | 81 (30.7%) |
| Enterprise Management | 0 (0.0%) | 0 (0.0%) |
| Administrative & Support | 36 (40.9%) | 52 (59.1%) |
| Educational Services | 139 (26.7%) | 381 (73.3%) |
| Health Care & Social Assistance | 61 (9.9%) | 554 (90.1%) |
| Arts, Entertainment & Recreation | 23 (100.0%) | 0 (0.0%) |
| Accommodation & Food Services | 72 (32.6%) | 149 (67.4%) |
| Public Administration | 244 (64.2%) | 136 (35.8%) |
| Total | 1,757 (47.7%) | 1,927 (52.3%) |
Education in Hampstead
School Enrollment in Hampstead
The most common levels of schooling among the 1,122 students in Hampstead are middle school (290 | 25.9%), college / undergraduate (282 | 25.1%), and high school (245 | 21.8%).
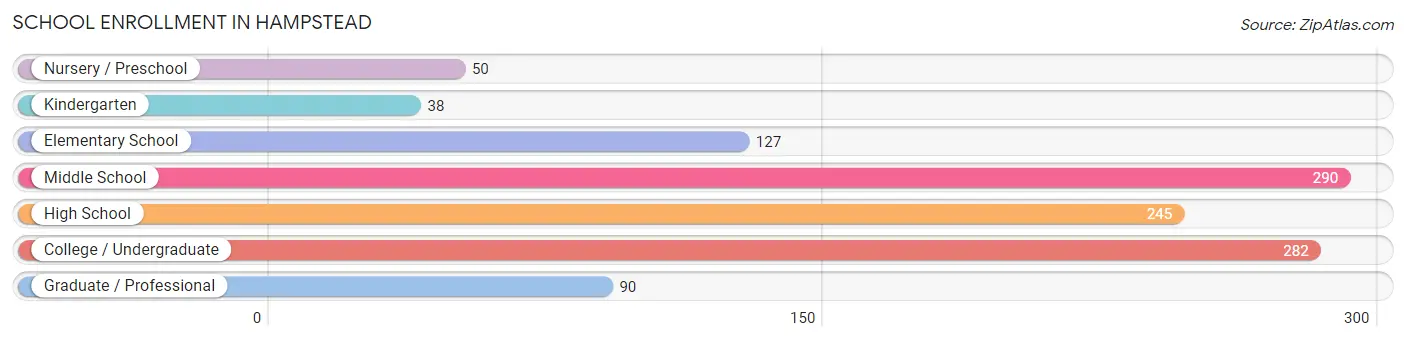
| School Level | # Students | % Students |
| Nursery / Preschool | 50 | 4.5% |
| Kindergarten | 38 | 3.4% |
| Elementary School | 127 | 11.3% |
| Middle School | 290 | 25.9% |
| High School | 245 | 21.8% |
| College / Undergraduate | 282 | 25.1% |
| Graduate / Professional | 90 | 8.0% |
| Total | 1,122 | 100.0% |
School Enrollment by Age by Funding Source in Hampstead
Out of a total of 1,122 students who are enrolled in schools in Hampstead, 173 (15.4%) attend a private institution, while the remaining 949 (84.6%) are enrolled in public schools. The age group of 3 to 4 year olds has the highest likelihood of being enrolled in private schools, with 24 (100.0% in the age bracket) enrolled. Conversely, the age group of 18 to 19 year olds has the lowest likelihood of being enrolled in a private school, with 44 (100.0% in the age bracket) attending a public institution.
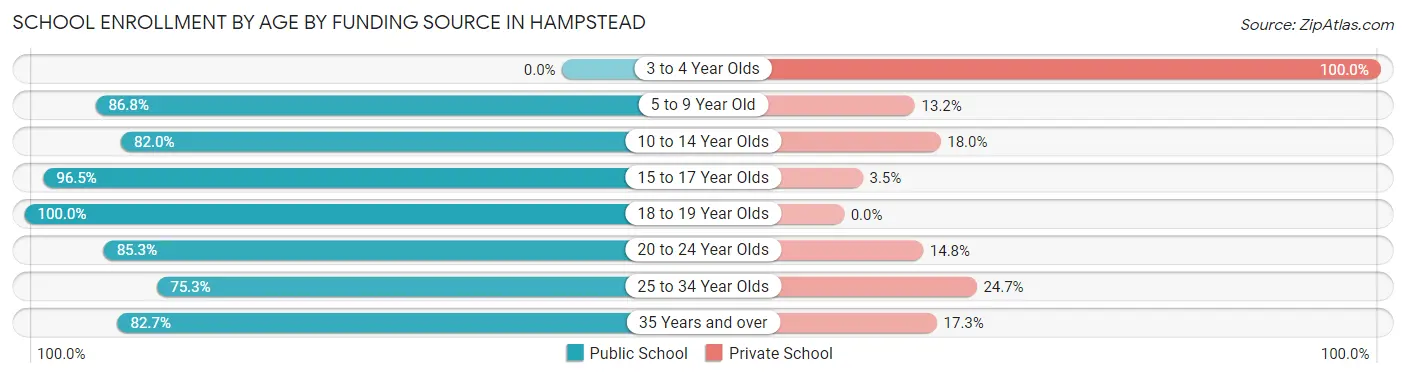
| Age Bracket | Public School | Private School |
| 3 to 4 Year Olds | 0 (0.0%) | 24 (100.0%) |
| 5 to 9 Year Old | 138 (86.8%) | 21 (13.2%) |
| 10 to 14 Year Olds | 278 (82.0%) | 61 (18.0%) |
| 15 to 17 Year Olds | 220 (96.5%) | 8 (3.5%) |
| 18 to 19 Year Olds | 44 (100.0%) | 0 (0.0%) |
| 20 to 24 Year Olds | 156 (85.3%) | 27 (14.7%) |
| 25 to 34 Year Olds | 70 (75.3%) | 23 (24.7%) |
| 35 Years and over | 43 (82.7%) | 9 (17.3%) |
| Total | 949 (84.6%) | 173 (15.4%) |
Educational Attainment by Field of Study in Hampstead
Education (357 | 17.5%), business (288 | 14.1%), social sciences (202 | 9.9%), arts & humanities (186 | 9.1%), and science & technology (175 | 8.6%) are the most common fields of study among 2,036 individuals in Hampstead who have obtained a bachelor's degree or higher.
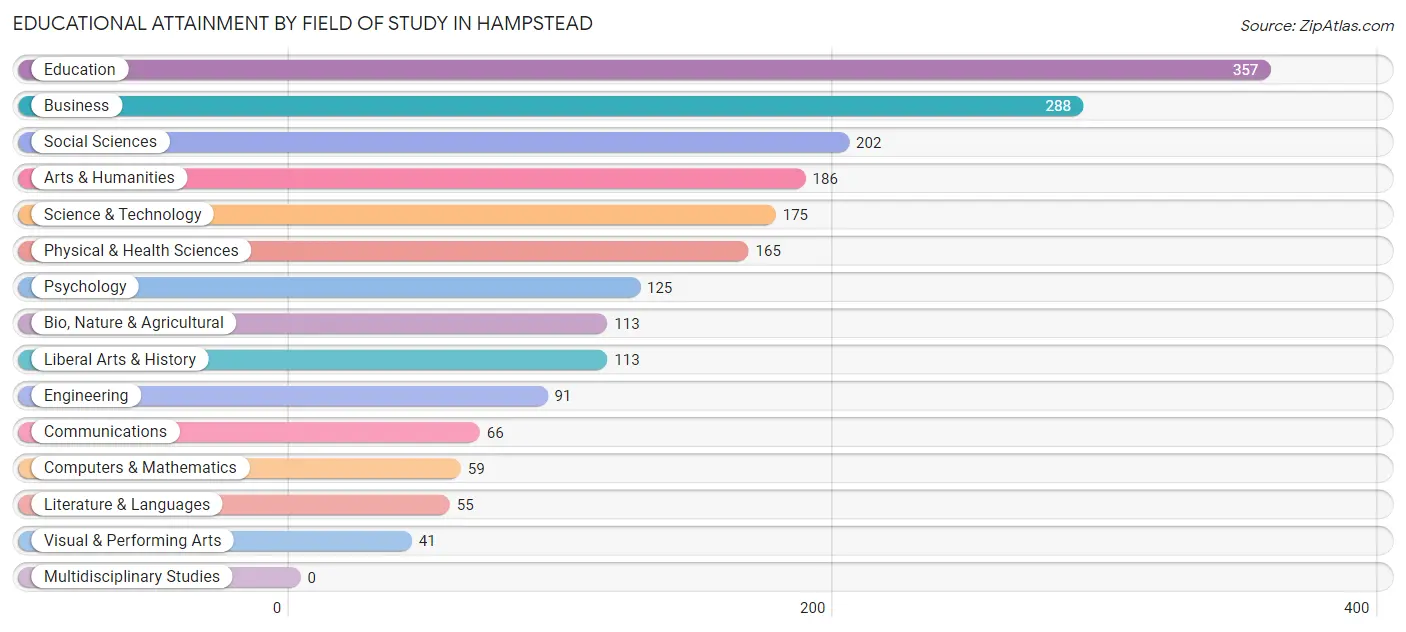
| Field of Study | # Graduates | % Graduates |
| Computers & Mathematics | 59 | 2.9% |
| Bio, Nature & Agricultural | 113 | 5.6% |
| Physical & Health Sciences | 165 | 8.1% |
| Psychology | 125 | 6.1% |
| Social Sciences | 202 | 9.9% |
| Engineering | 91 | 4.5% |
| Multidisciplinary Studies | 0 | 0.0% |
| Science & Technology | 175 | 8.6% |
| Business | 288 | 14.1% |
| Education | 357 | 17.5% |
| Literature & Languages | 55 | 2.7% |
| Liberal Arts & History | 113 | 5.6% |
| Visual & Performing Arts | 41 | 2.0% |
| Communications | 66 | 3.2% |
| Arts & Humanities | 186 | 9.1% |
| Total | 2,036 | 100.0% |
Transportation & Commute in Hampstead
Vehicle Availability by Sex in Hampstead
The most prevalent vehicle ownership categories in Hampstead are males with 3 vehicles (749, accounting for 42.9%) and females with 3 vehicles (500, making up 39.3%).
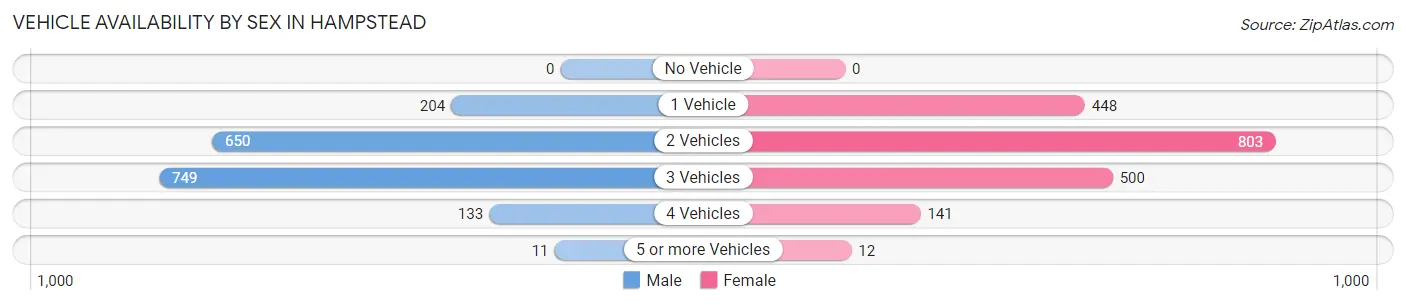
| Vehicles Available | Male | Female |
| No Vehicle | 0 (0.0%) | 0 (0.0%) |
| 1 Vehicle | 204 (11.7%) | 448 (23.5%) |
| 2 Vehicles | 650 (37.2%) | 803 (42.2%) |
| 3 Vehicles | 749 (42.9%) | 500 (26.3%) |
| 4 Vehicles | 133 (7.6%) | 141 (7.4%) |
| 5 or more Vehicles | 11 (0.6%) | 12 (0.6%) |
| Total | 1,747 (100.0%) | 1,904 (100.0%) |
Commute Time in Hampstead
The most frequently occuring commute durations in Hampstead are 45 to 59 minutes (474 commuters, 14.5%), 20 to 24 minutes (457 commuters, 14.0%), and 15 to 19 minutes (431 commuters, 13.2%).
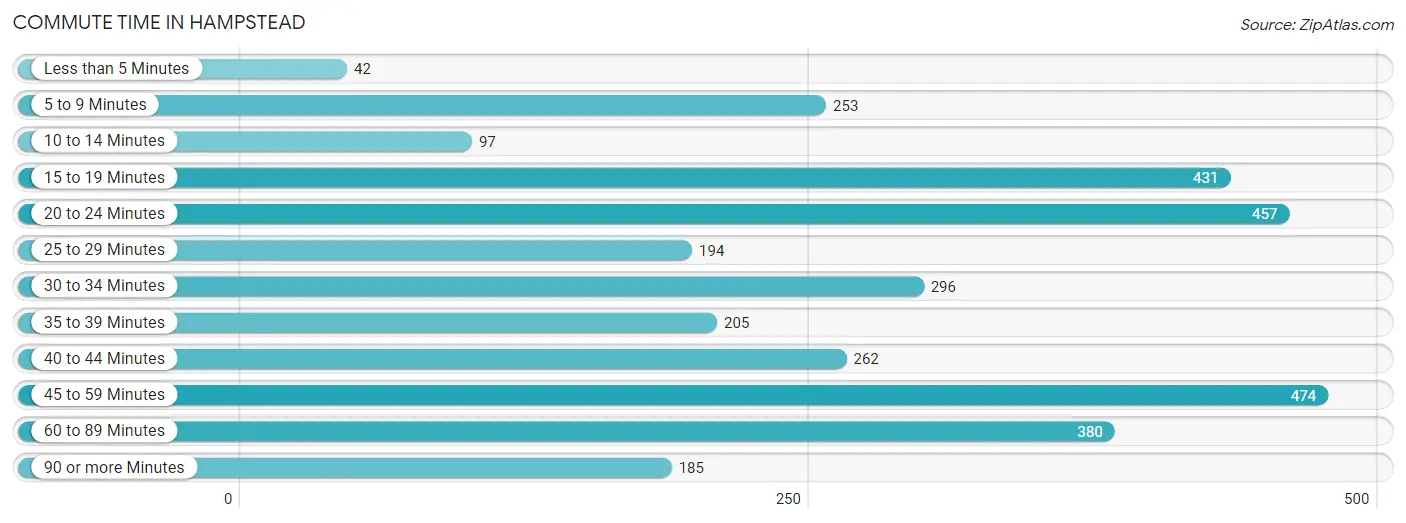
| Commute Time | # Commuters | % Commuters |
| Less than 5 Minutes | 42 | 1.3% |
| 5 to 9 Minutes | 253 | 7.7% |
| 10 to 14 Minutes | 97 | 3.0% |
| 15 to 19 Minutes | 431 | 13.2% |
| 20 to 24 Minutes | 457 | 14.0% |
| 25 to 29 Minutes | 194 | 5.9% |
| 30 to 34 Minutes | 296 | 9.0% |
| 35 to 39 Minutes | 205 | 6.3% |
| 40 to 44 Minutes | 262 | 8.0% |
| 45 to 59 Minutes | 474 | 14.5% |
| 60 to 89 Minutes | 380 | 11.6% |
| 90 or more Minutes | 185 | 5.7% |
Commute Time by Sex in Hampstead
The most common commute times in Hampstead are 45 to 59 minutes (254 commuters, 16.4%) for males and 20 to 24 minutes (315 commuters, 18.2%) for females.
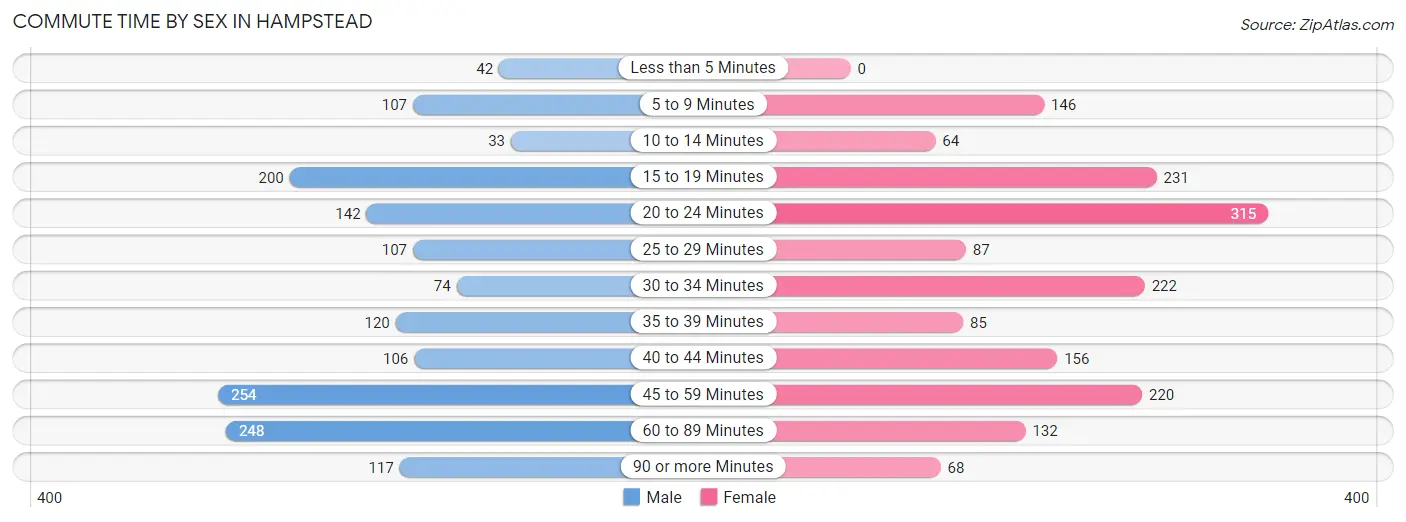
| Commute Time | Male | Female |
| Less than 5 Minutes | 42 (2.7%) | 0 (0.0%) |
| 5 to 9 Minutes | 107 (6.9%) | 146 (8.5%) |
| 10 to 14 Minutes | 33 (2.1%) | 64 (3.7%) |
| 15 to 19 Minutes | 200 (12.9%) | 231 (13.4%) |
| 20 to 24 Minutes | 142 (9.2%) | 315 (18.2%) |
| 25 to 29 Minutes | 107 (6.9%) | 87 (5.0%) |
| 30 to 34 Minutes | 74 (4.8%) | 222 (12.9%) |
| 35 to 39 Minutes | 120 (7.7%) | 85 (4.9%) |
| 40 to 44 Minutes | 106 (6.8%) | 156 (9.0%) |
| 45 to 59 Minutes | 254 (16.4%) | 220 (12.8%) |
| 60 to 89 Minutes | 248 (16.0%) | 132 (7.6%) |
| 90 or more Minutes | 117 (7.5%) | 68 (3.9%) |
Time of Departure to Work by Sex in Hampstead
The most frequent times of departure to work in Hampstead are 6:30 AM to 6:59 AM (243, 15.7%) for males and 7:00 AM to 7:29 AM (436, 25.3%) for females.
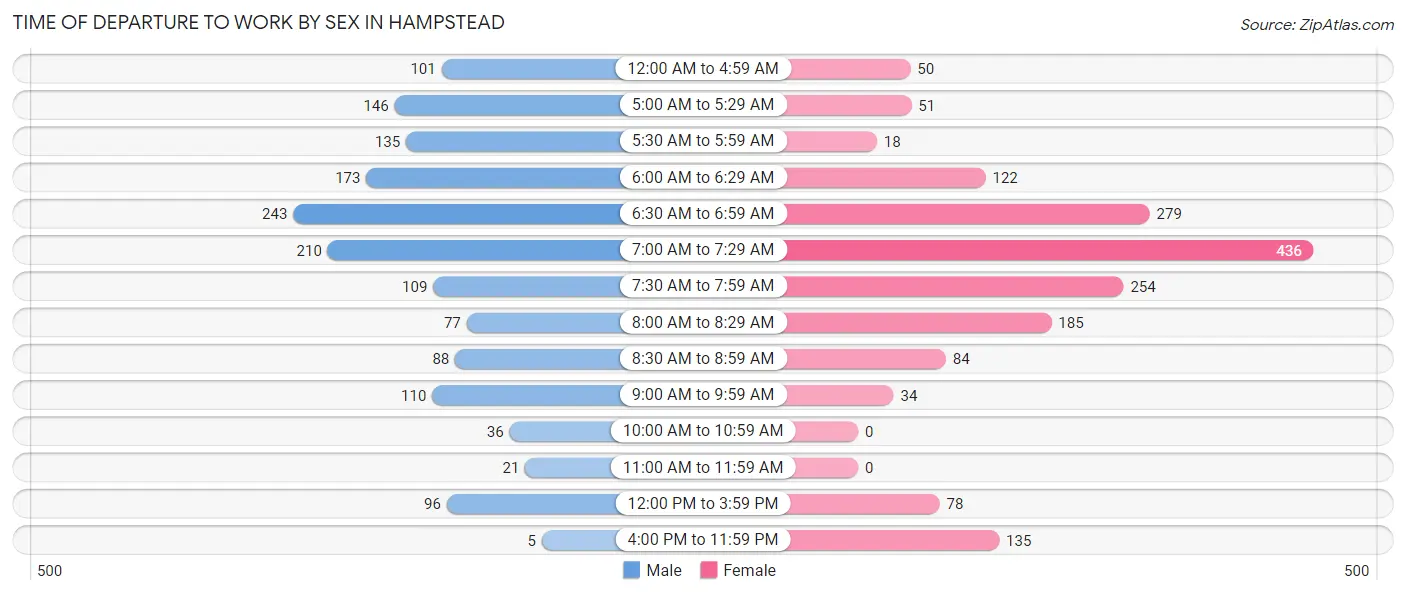
| Time of Departure | Male | Female |
| 12:00 AM to 4:59 AM | 101 (6.5%) | 50 (2.9%) |
| 5:00 AM to 5:29 AM | 146 (9.4%) | 51 (2.9%) |
| 5:30 AM to 5:59 AM | 135 (8.7%) | 18 (1.0%) |
| 6:00 AM to 6:29 AM | 173 (11.2%) | 122 (7.1%) |
| 6:30 AM to 6:59 AM | 243 (15.7%) | 279 (16.2%) |
| 7:00 AM to 7:29 AM | 210 (13.6%) | 436 (25.3%) |
| 7:30 AM to 7:59 AM | 109 (7.0%) | 254 (14.7%) |
| 8:00 AM to 8:29 AM | 77 (5.0%) | 185 (10.7%) |
| 8:30 AM to 8:59 AM | 88 (5.7%) | 84 (4.9%) |
| 9:00 AM to 9:59 AM | 110 (7.1%) | 34 (2.0%) |
| 10:00 AM to 10:59 AM | 36 (2.3%) | 0 (0.0%) |
| 11:00 AM to 11:59 AM | 21 (1.3%) | 0 (0.0%) |
| 12:00 PM to 3:59 PM | 96 (6.2%) | 78 (4.5%) |
| 4:00 PM to 11:59 PM | 5 (0.3%) | 135 (7.8%) |
| Total | 1,550 (100.0%) | 1,726 (100.0%) |
Housing Occupancy in Hampstead
Occupancy by Ownership in Hampstead
Of the total 2,735 dwellings in Hampstead, owner-occupied units account for 2,166 (79.2%), while renter-occupied units make up 569 (20.8%).
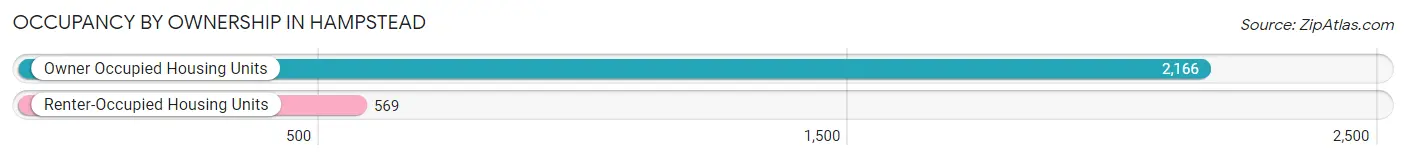
| Occupancy | # Housing Units | % Housing Units |
| Owner Occupied Housing Units | 2,166 | 79.2% |
| Renter-Occupied Housing Units | 569 | 20.8% |
| Total Occupied Housing Units | 2,735 | 100.0% |
Occupancy by Household Size in Hampstead
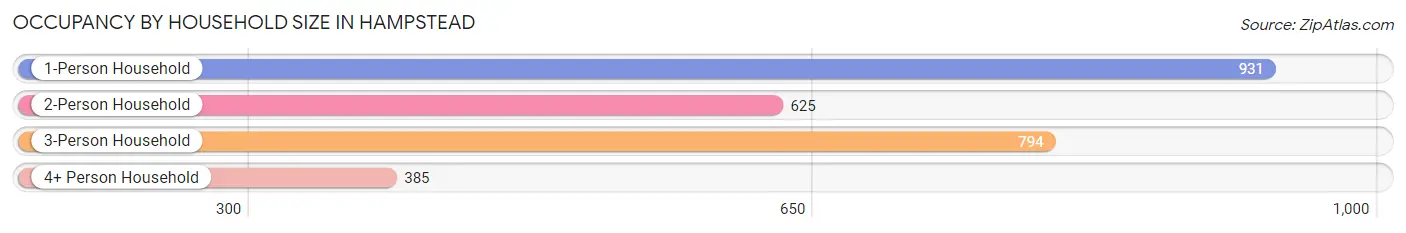
| Household Size | # Housing Units | % Housing Units |
| 1-Person Household | 931 | 34.0% |
| 2-Person Household | 625 | 22.9% |
| 3-Person Household | 794 | 29.0% |
| 4+ Person Household | 385 | 14.1% |
| Total Housing Units | 2,735 | 100.0% |
Occupancy by Ownership by Household Size in Hampstead
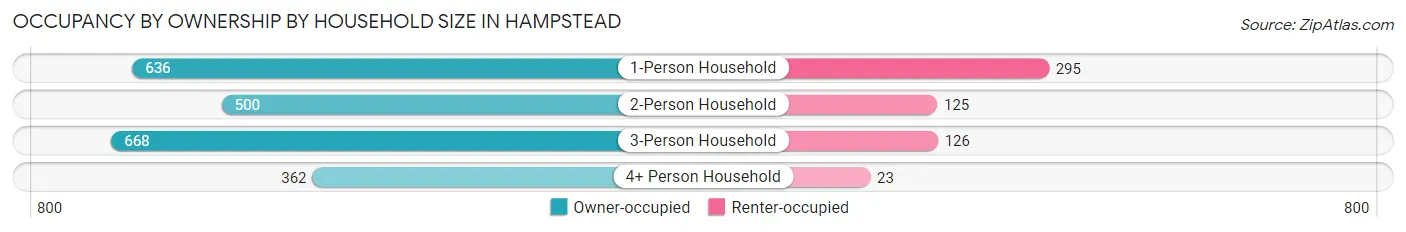
| Household Size | Owner-occupied | Renter-occupied |
| 1-Person Household | 636 (68.3%) | 295 (31.7%) |
| 2-Person Household | 500 (80.0%) | 125 (20.0%) |
| 3-Person Household | 668 (84.1%) | 126 (15.9%) |
| 4+ Person Household | 362 (94.0%) | 23 (6.0%) |
| Total Housing Units | 2,166 (79.2%) | 569 (20.8%) |
Occupancy by Educational Attainment in Hampstead
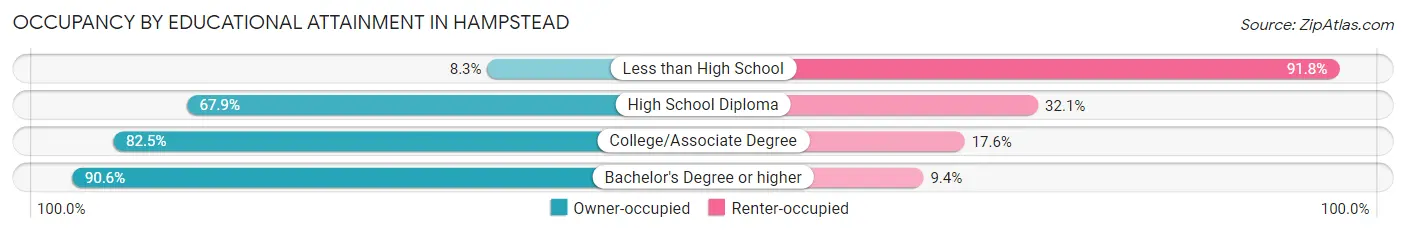
| Household Size | Owner-occupied | Renter-occupied |
| Less than High School | 8 (8.3%) | 89 (91.7%) |
| High School Diploma | 465 (67.9%) | 220 (32.1%) |
| College/Associate Degree | 775 (82.5%) | 165 (17.5%) |
| Bachelor's Degree or higher | 918 (90.6%) | 95 (9.4%) |
Occupancy by Age of Householder in Hampstead
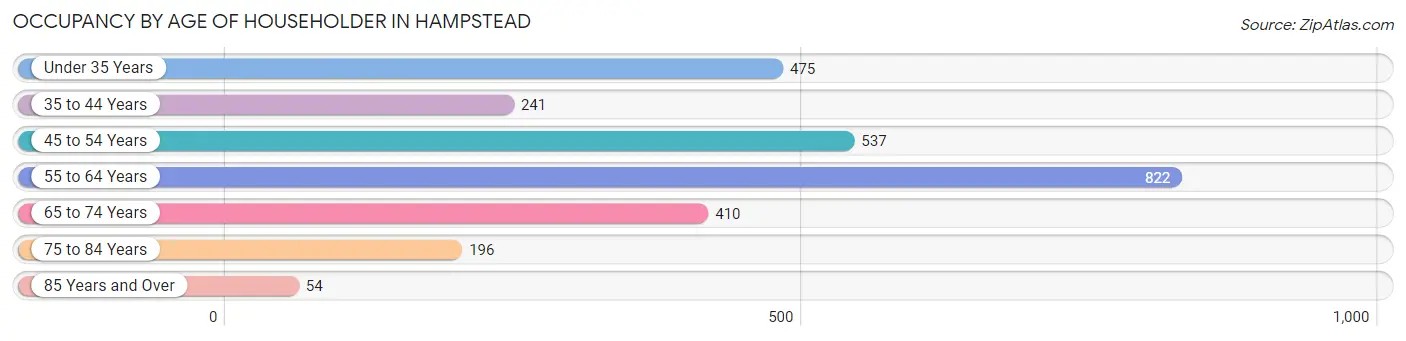
| Age Bracket | # Households | % Households |
| Under 35 Years | 475 | 17.4% |
| 35 to 44 Years | 241 | 8.8% |
| 45 to 54 Years | 537 | 19.6% |
| 55 to 64 Years | 822 | 30.0% |
| 65 to 74 Years | 410 | 15.0% |
| 75 to 84 Years | 196 | 7.2% |
| 85 Years and Over | 54 | 2.0% |
| Total | 2,735 | 100.0% |
Housing Finances in Hampstead
Median Income by Occupancy in Hampstead
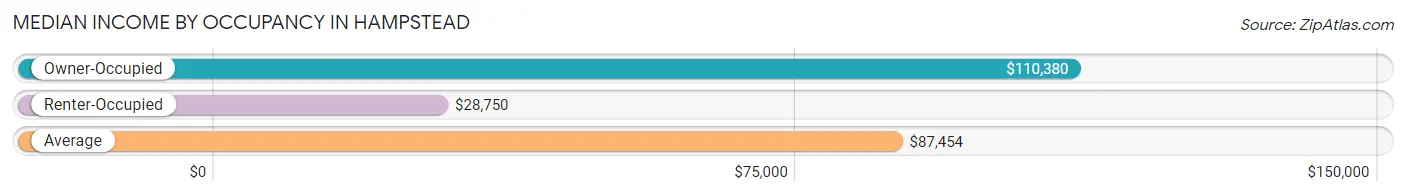
| Occupancy Type | # Households | Median Income |
| Owner-Occupied | 2,166 (79.2%) | $110,380 |
| Renter-Occupied | 569 (20.8%) | $28,750 |
| Average | 2,735 (100.0%) | $87,454 |
Occupancy by Householder Income Bracket in Hampstead
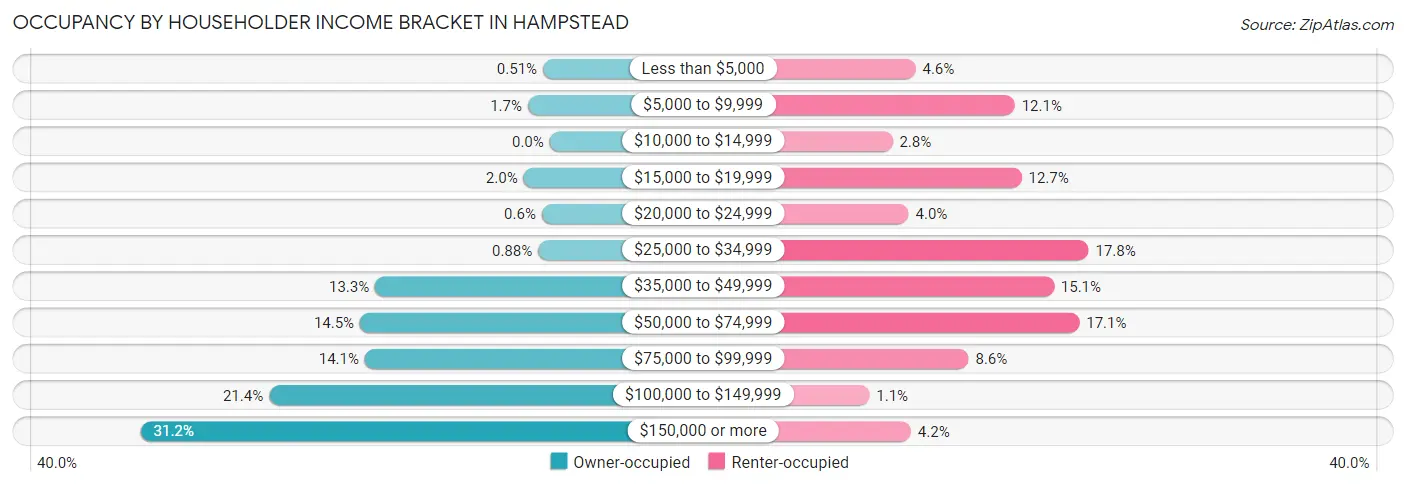
| Income Bracket | Owner-occupied | Renter-occupied |
| Less than $5,000 | 11 (0.5%) | 26 (4.6%) |
| $5,000 to $9,999 | 36 (1.7%) | 69 (12.1%) |
| $10,000 to $14,999 | 0 (0.0%) | 16 (2.8%) |
| $15,000 to $19,999 | 43 (2.0%) | 72 (12.7%) |
| $20,000 to $24,999 | 13 (0.6%) | 23 (4.0%) |
| $25,000 to $34,999 | 19 (0.9%) | 101 (17.7%) |
| $35,000 to $49,999 | 288 (13.3%) | 86 (15.1%) |
| $50,000 to $74,999 | 313 (14.4%) | 97 (17.1%) |
| $75,000 to $99,999 | 305 (14.1%) | 49 (8.6%) |
| $100,000 to $149,999 | 463 (21.4%) | 6 (1.1%) |
| $150,000 or more | 675 (31.2%) | 24 (4.2%) |
| Total | 2,166 (100.0%) | 569 (100.0%) |
Monthly Housing Cost Tiers in Hampstead
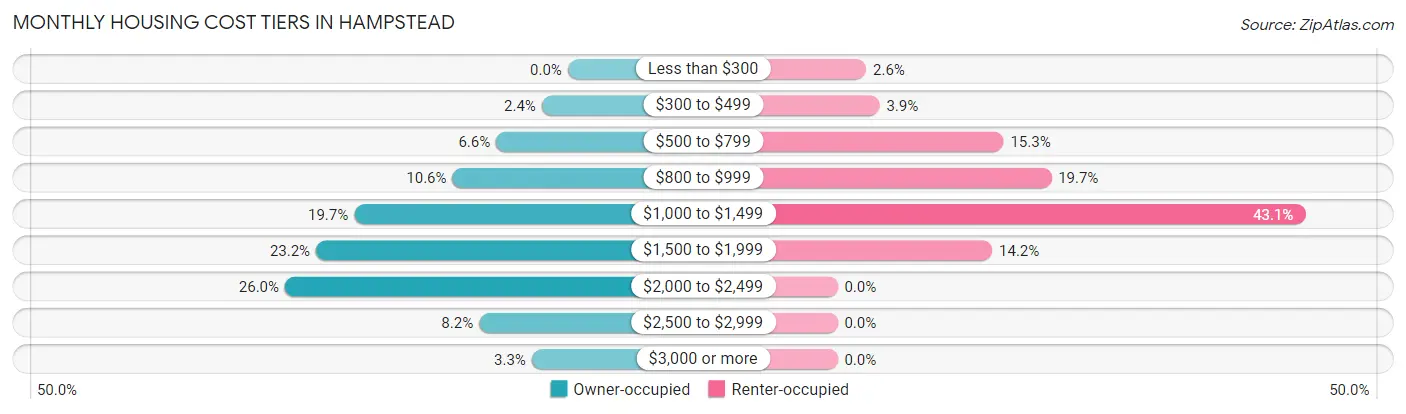
| Monthly Cost | Owner-occupied | Renter-occupied |
| Less than $300 | 0 (0.0%) | 15 (2.6%) |
| $300 to $499 | 52 (2.4%) | 22 (3.9%) |
| $500 to $799 | 143 (6.6%) | 87 (15.3%) |
| $800 to $999 | 230 (10.6%) | 112 (19.7%) |
| $1,000 to $1,499 | 426 (19.7%) | 245 (43.1%) |
| $1,500 to $1,999 | 502 (23.2%) | 81 (14.2%) |
| $2,000 to $2,499 | 564 (26.0%) | 0 (0.0%) |
| $2,500 to $2,999 | 177 (8.2%) | 0 (0.0%) |
| $3,000 or more | 72 (3.3%) | 0 (0.0%) |
| Total | 2,166 (100.0%) | 569 (100.0%) |
Physical Housing Characteristics in Hampstead
Housing Structures in Hampstead
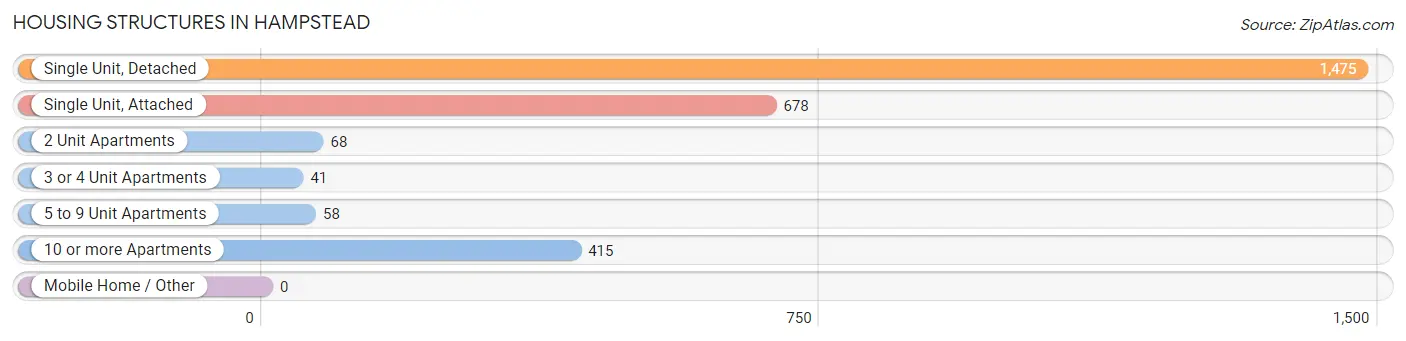
| Structure Type | # Housing Units | % Housing Units |
| Single Unit, Detached | 1,475 | 53.9% |
| Single Unit, Attached | 678 | 24.8% |
| 2 Unit Apartments | 68 | 2.5% |
| 3 or 4 Unit Apartments | 41 | 1.5% |
| 5 to 9 Unit Apartments | 58 | 2.1% |
| 10 or more Apartments | 415 | 15.2% |
| Mobile Home / Other | 0 | 0.0% |
| Total | 2,735 | 100.0% |
Housing Structures by Occupancy in Hampstead
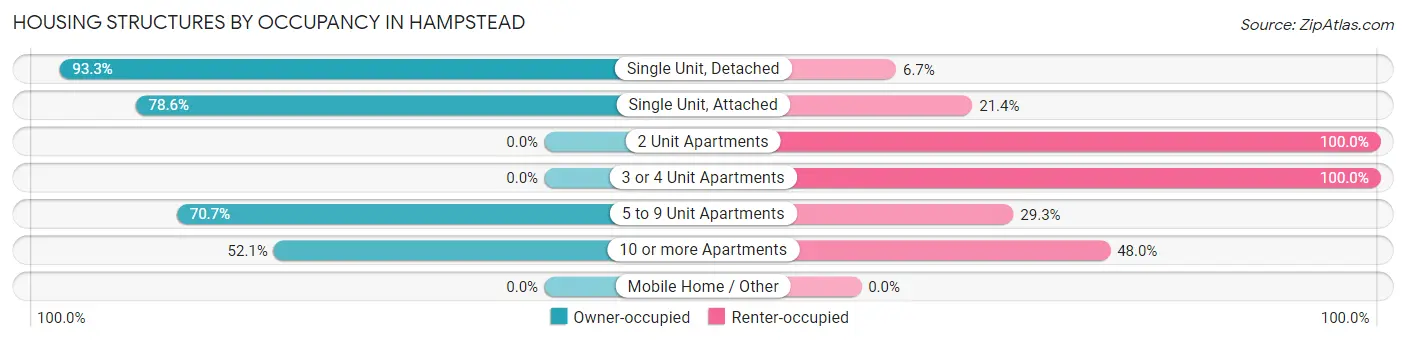
| Structure Type | Owner-occupied | Renter-occupied |
| Single Unit, Detached | 1,376 (93.3%) | 99 (6.7%) |
| Single Unit, Attached | 533 (78.6%) | 145 (21.4%) |
| 2 Unit Apartments | 0 (0.0%) | 68 (100.0%) |
| 3 or 4 Unit Apartments | 0 (0.0%) | 41 (100.0%) |
| 5 to 9 Unit Apartments | 41 (70.7%) | 17 (29.3%) |
| 10 or more Apartments | 216 (52.0%) | 199 (47.9%) |
| Mobile Home / Other | 0 (0.0%) | 0 (0.0%) |
| Total | 2,166 (79.2%) | 569 (20.8%) |
Housing Structures by Number of Rooms in Hampstead
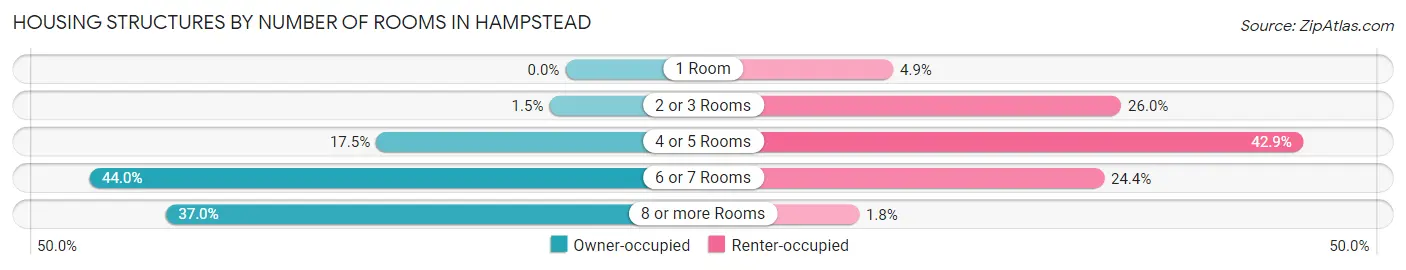
| Number of Rooms | Owner-occupied | Renter-occupied |
| 1 Room | 0 (0.0%) | 28 (4.9%) |
| 2 or 3 Rooms | 32 (1.5%) | 148 (26.0%) |
| 4 or 5 Rooms | 379 (17.5%) | 244 (42.9%) |
| 6 or 7 Rooms | 954 (44.0%) | 139 (24.4%) |
| 8 or more Rooms | 801 (37.0%) | 10 (1.8%) |
| Total | 2,166 (100.0%) | 569 (100.0%) |
Housing Structure by Heating Type in Hampstead
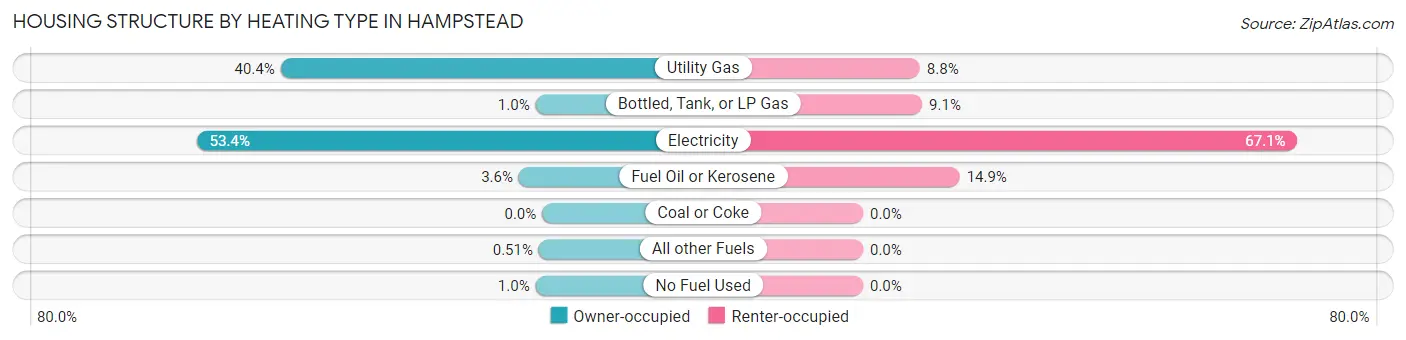
| Heating Type | Owner-occupied | Renter-occupied |
| Utility Gas | 876 (40.4%) | 50 (8.8%) |
| Bottled, Tank, or LP Gas | 22 (1.0%) | 52 (9.1%) |
| Electricity | 1,157 (53.4%) | 382 (67.1%) |
| Fuel Oil or Kerosene | 78 (3.6%) | 85 (14.9%) |
| Coal or Coke | 0 (0.0%) | 0 (0.0%) |
| All other Fuels | 11 (0.5%) | 0 (0.0%) |
| No Fuel Used | 22 (1.0%) | 0 (0.0%) |
| Total | 2,166 (100.0%) | 569 (100.0%) |
Household Vehicle Usage in Hampstead
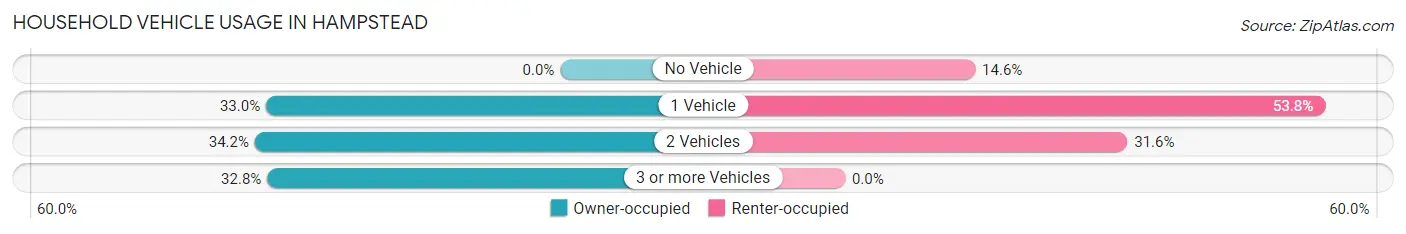
| Vehicles per Household | Owner-occupied | Renter-occupied |
| No Vehicle | 0 (0.0%) | 83 (14.6%) |
| 1 Vehicle | 714 (33.0%) | 306 (53.8%) |
| 2 Vehicles | 741 (34.2%) | 180 (31.6%) |
| 3 or more Vehicles | 711 (32.8%) | 0 (0.0%) |
| Total | 2,166 (100.0%) | 569 (100.0%) |
Real Estate & Mortgages in Hampstead
Real Estate and Mortgage Overview in Hampstead
| Characteristic | Without Mortgage | With Mortgage |
| Housing Units | 251 | 1,915 |
| Median Property Value | $300,800 | $300,100 |
| Median Household Income | $85,880 | $622 |
| Monthly Housing Costs | $668 | $72 |
| Real Estate Taxes | $4,243 | $15 |
Property Value by Mortgage Status in Hampstead
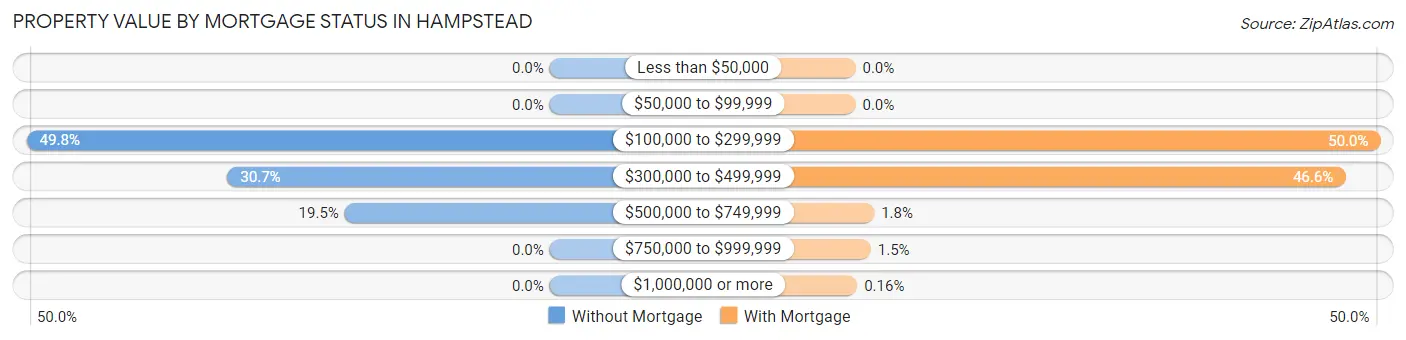
| Property Value | Without Mortgage | With Mortgage |
| Less than $50,000 | 0 (0.0%) | 0 (0.0%) |
| $50,000 to $99,999 | 0 (0.0%) | 0 (0.0%) |
| $100,000 to $299,999 | 125 (49.8%) | 957 (50.0%) |
| $300,000 to $499,999 | 77 (30.7%) | 893 (46.6%) |
| $500,000 to $749,999 | 49 (19.5%) | 34 (1.8%) |
| $750,000 to $999,999 | 0 (0.0%) | 28 (1.5%) |
| $1,000,000 or more | 0 (0.0%) | 3 (0.2%) |
| Total | 251 (100.0%) | 1,915 (100.0%) |
Household Income by Mortgage Status in Hampstead
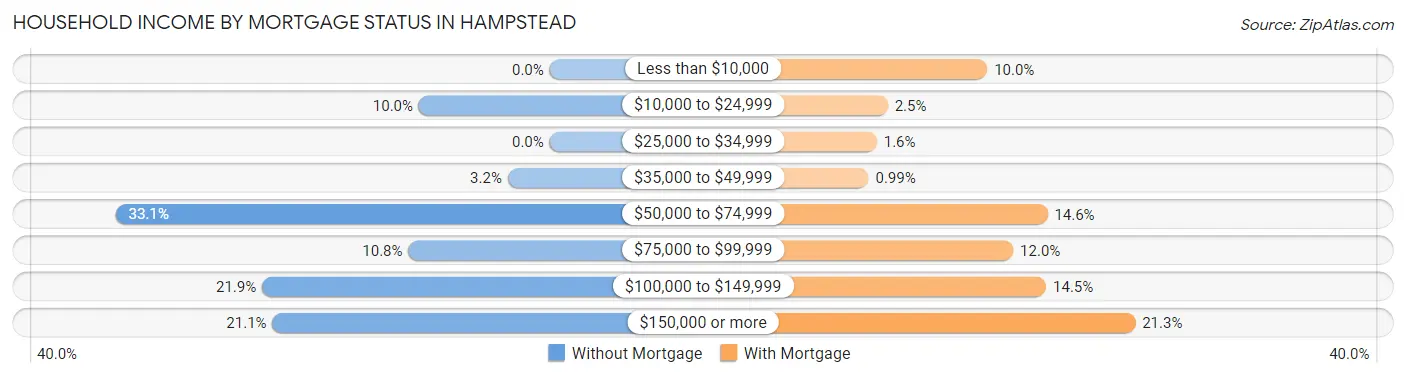
| Household Income | Without Mortgage | With Mortgage |
| Less than $10,000 | 0 (0.0%) | 192 (10.0%) |
| $10,000 to $24,999 | 25 (10.0%) | 47 (2.5%) |
| $25,000 to $34,999 | 0 (0.0%) | 31 (1.6%) |
| $35,000 to $49,999 | 8 (3.2%) | 19 (1.0%) |
| $50,000 to $74,999 | 83 (33.1%) | 280 (14.6%) |
| $75,000 to $99,999 | 27 (10.8%) | 230 (12.0%) |
| $100,000 to $149,999 | 55 (21.9%) | 278 (14.5%) |
| $150,000 or more | 53 (21.1%) | 408 (21.3%) |
| Total | 251 (100.0%) | 1,915 (100.0%) |
Property Value to Household Income Ratio in Hampstead
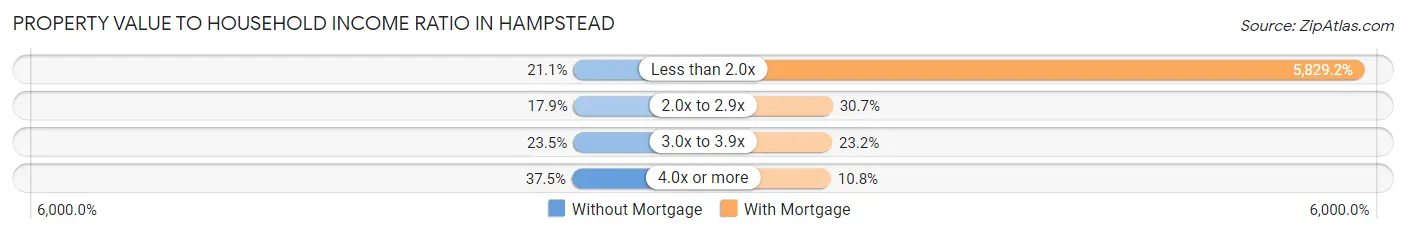
| Value-to-Income Ratio | Without Mortgage | With Mortgage |
| Less than 2.0x | 53 (21.1%) | 111,630 (5,829.2%) |
| 2.0x to 2.9x | 45 (17.9%) | 588 (30.7%) |
| 3.0x to 3.9x | 59 (23.5%) | 445 (23.2%) |
| 4.0x or more | 94 (37.4%) | 206 (10.8%) |
| Total | 251 (100.0%) | 1,915 (100.0%) |
Real Estate Taxes by Mortgage Status in Hampstead
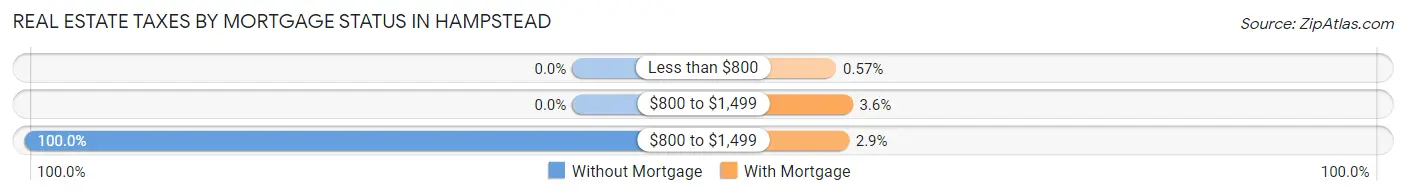
| Property Taxes | Without Mortgage | With Mortgage |
| Less than $800 | 0 (0.0%) | 11 (0.6%) |
| $800 to $1,499 | 0 (0.0%) | 68 (3.5%) |
| $800 to $1,499 | 251 (100.0%) | 55 (2.9%) |
| Total | 251 (100.0%) | 1,915 (100.0%) |
Health & Disability in Hampstead
Health Insurance Coverage by Age in Hampstead
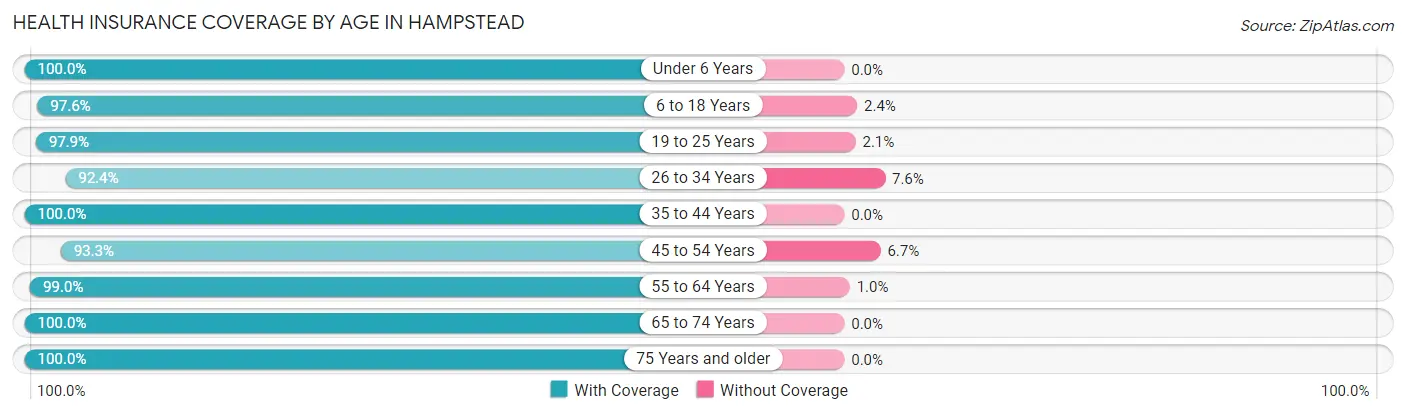
| Age Bracket | With Coverage | Without Coverage |
| Under 6 Years | 431 (100.0%) | 0 (0.0%) |
| 6 to 18 Years | 693 (97.6%) | 17 (2.4%) |
| 19 to 25 Years | 513 (97.9%) | 11 (2.1%) |
| 26 to 34 Years | 900 (92.4%) | 74 (7.6%) |
| 35 to 44 Years | 609 (100.0%) | 0 (0.0%) |
| 45 to 54 Years | 816 (93.3%) | 59 (6.7%) |
| 55 to 64 Years | 1,279 (99.0%) | 13 (1.0%) |
| 65 to 74 Years | 498 (100.0%) | 0 (0.0%) |
| 75 Years and older | 365 (100.0%) | 0 (0.0%) |
| Total | 6,104 (97.2%) | 174 (2.8%) |
Health Insurance Coverage by Citizenship Status in Hampstead
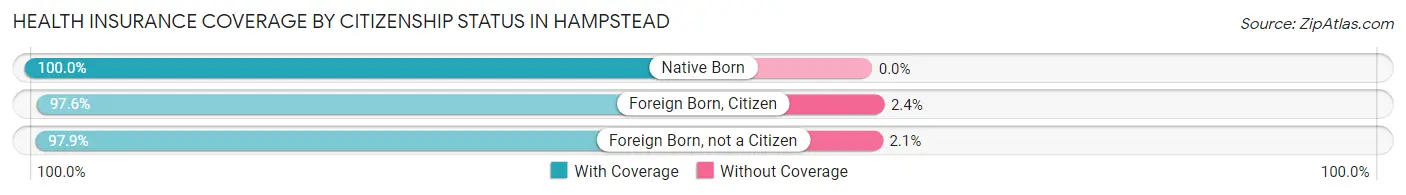
| Citizenship Status | With Coverage | Without Coverage |
| Native Born | 431 (100.0%) | 0 (0.0%) |
| Foreign Born, Citizen | 693 (97.6%) | 17 (2.4%) |
| Foreign Born, not a Citizen | 513 (97.9%) | 11 (2.1%) |
Health Insurance Coverage by Household Income in Hampstead
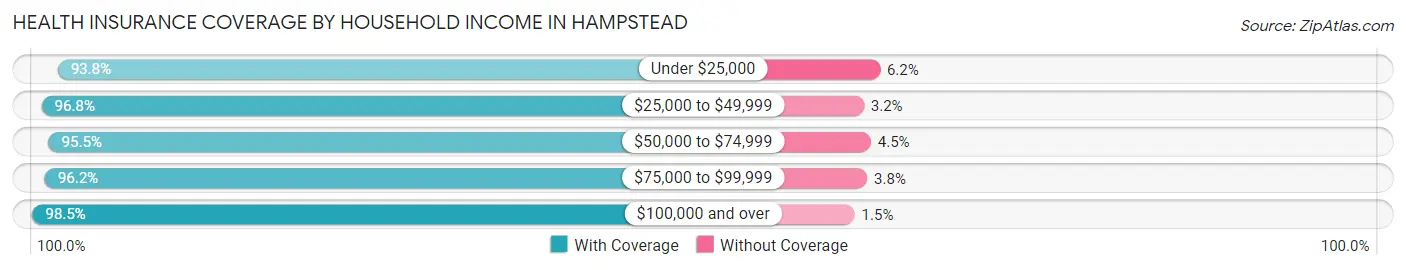
| Household Income | With Coverage | Without Coverage |
| Under $25,000 | 438 (93.8%) | 29 (6.2%) |
| $25,000 to $49,999 | 668 (96.8%) | 22 (3.2%) |
| $50,000 to $74,999 | 783 (95.5%) | 37 (4.5%) |
| $75,000 to $99,999 | 933 (96.2%) | 37 (3.8%) |
| $100,000 and over | 3,282 (98.5%) | 49 (1.5%) |
Public vs Private Health Insurance Coverage by Age in Hampstead
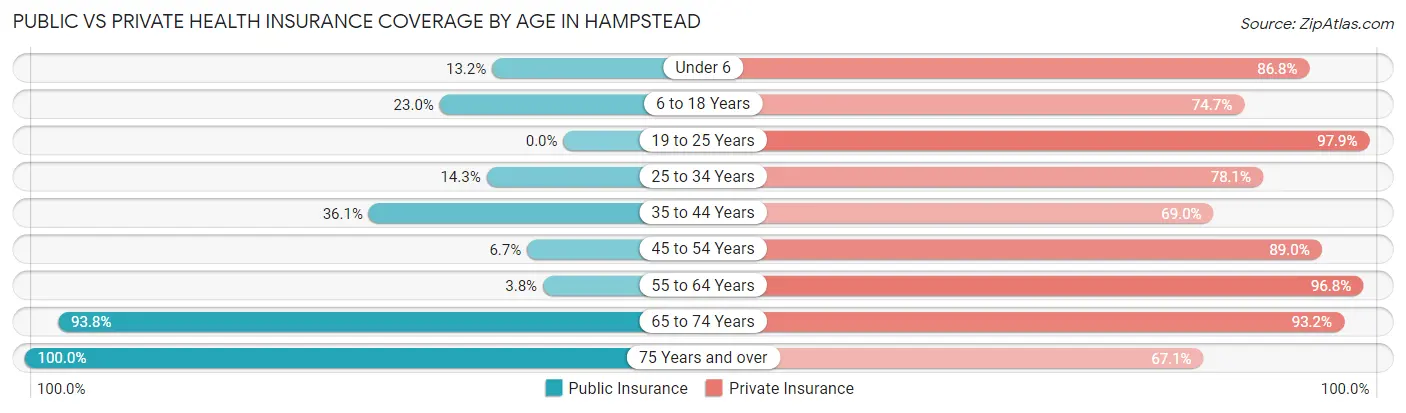
| Age Bracket | Public Insurance | Private Insurance |
| Under 6 | 57 (13.2%) | 374 (86.8%) |
| 6 to 18 Years | 163 (23.0%) | 530 (74.7%) |
| 19 to 25 Years | 0 (0.0%) | 513 (97.9%) |
| 25 to 34 Years | 139 (14.3%) | 761 (78.1%) |
| 35 to 44 Years | 220 (36.1%) | 420 (69.0%) |
| 45 to 54 Years | 59 (6.7%) | 779 (89.0%) |
| 55 to 64 Years | 49 (3.8%) | 1,250 (96.8%) |
| 65 to 74 Years | 467 (93.8%) | 464 (93.2%) |
| 75 Years and over | 365 (100.0%) | 245 (67.1%) |
| Total | 1,519 (24.2%) | 5,336 (85.0%) |
Disability Status by Sex by Age in Hampstead
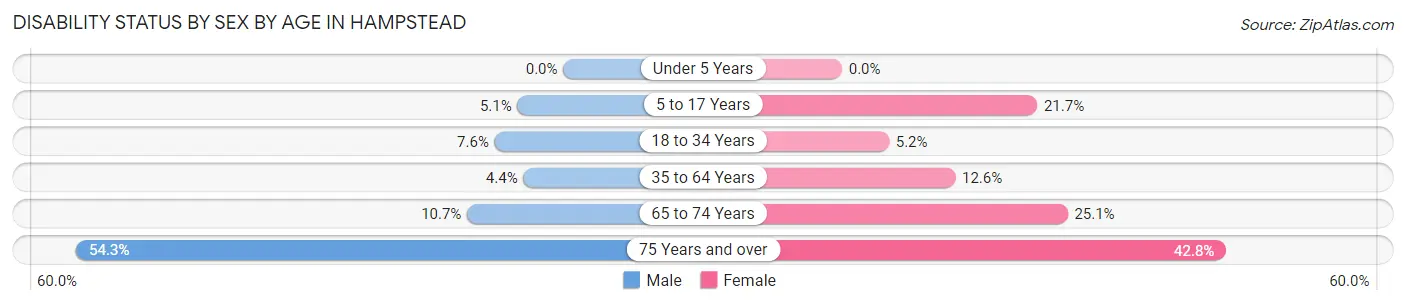
| Age Bracket | Male | Female |
| Under 5 Years | 0 (0.0%) | 0 (0.0%) |
| 5 to 17 Years | 18 (5.1%) | 90 (21.7%) |
| 18 to 34 Years | 55 (7.6%) | 41 (5.2%) |
| 35 to 64 Years | 57 (4.4%) | 188 (12.6%) |
| 65 to 74 Years | 12 (10.7%) | 97 (25.1%) |
| 75 Years and over | 51 (54.3%) | 116 (42.8%) |
Disability Class by Sex by Age in Hampstead
Disability Class: Hearing Difficulty
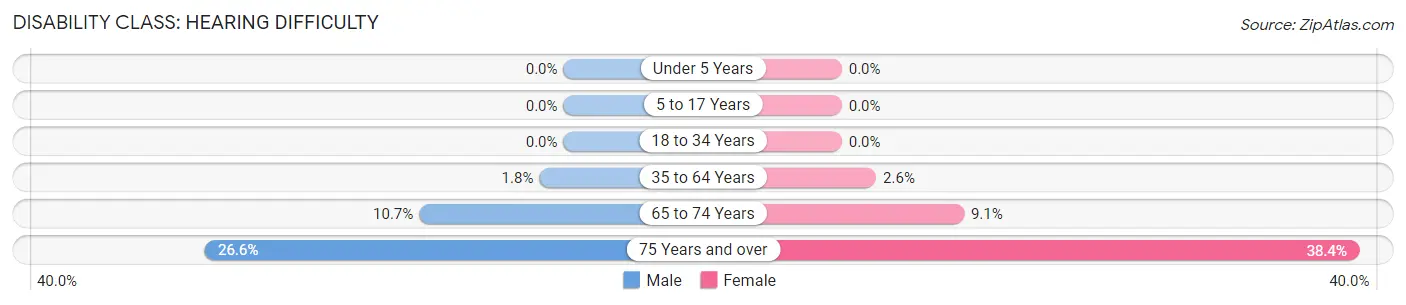
| Age Bracket | Male | Female |
| Under 5 Years | 0 (0.0%) | 0 (0.0%) |
| 5 to 17 Years | 0 (0.0%) | 0 (0.0%) |
| 18 to 34 Years | 0 (0.0%) | 0 (0.0%) |
| 35 to 64 Years | 23 (1.8%) | 38 (2.5%) |
| 65 to 74 Years | 12 (10.7%) | 35 (9.1%) |
| 75 Years and over | 25 (26.6%) | 104 (38.4%) |
Disability Class: Vision Difficulty
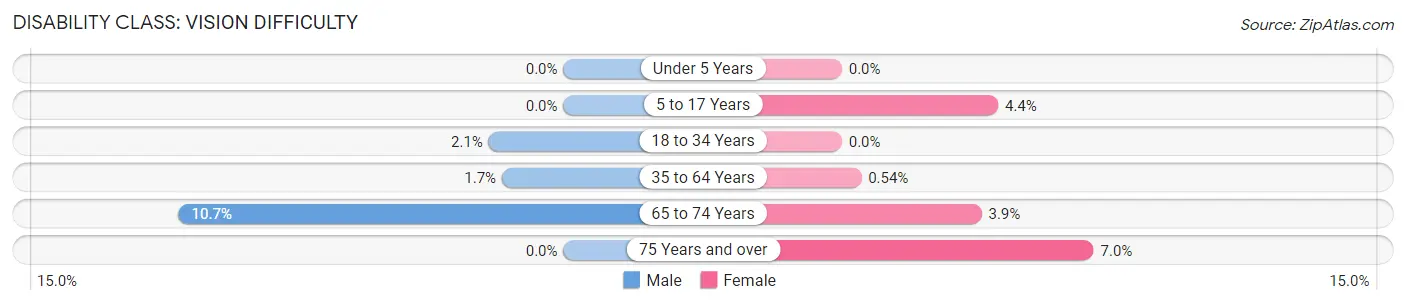
| Age Bracket | Male | Female |
| Under 5 Years | 0 (0.0%) | 0 (0.0%) |
| 5 to 17 Years | 0 (0.0%) | 18 (4.3%) |
| 18 to 34 Years | 15 (2.1%) | 0 (0.0%) |
| 35 to 64 Years | 22 (1.7%) | 8 (0.5%) |
| 65 to 74 Years | 12 (10.7%) | 15 (3.9%) |
| 75 Years and over | 0 (0.0%) | 19 (7.0%) |
Disability Class: Cognitive Difficulty
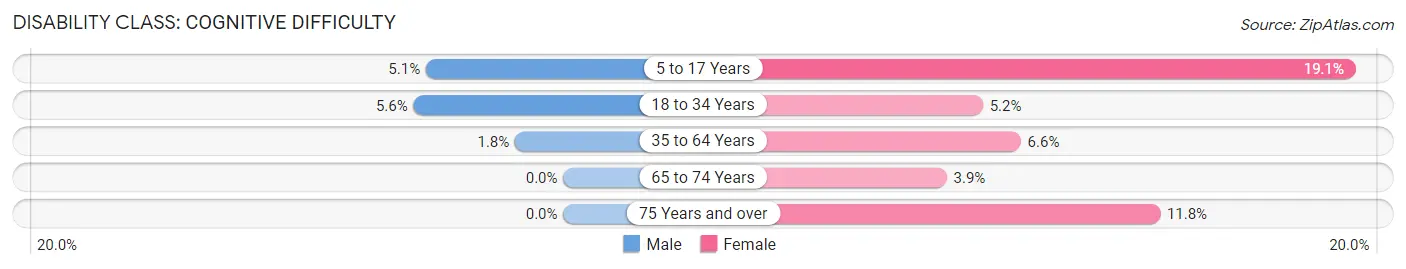
| Age Bracket | Male | Female |
| 5 to 17 Years | 18 (5.1%) | 79 (19.1%) |
| 18 to 34 Years | 40 (5.6%) | 41 (5.2%) |
| 35 to 64 Years | 23 (1.8%) | 99 (6.6%) |
| 65 to 74 Years | 0 (0.0%) | 15 (3.9%) |
| 75 Years and over | 0 (0.0%) | 32 (11.8%) |
Disability Class: Ambulatory Difficulty
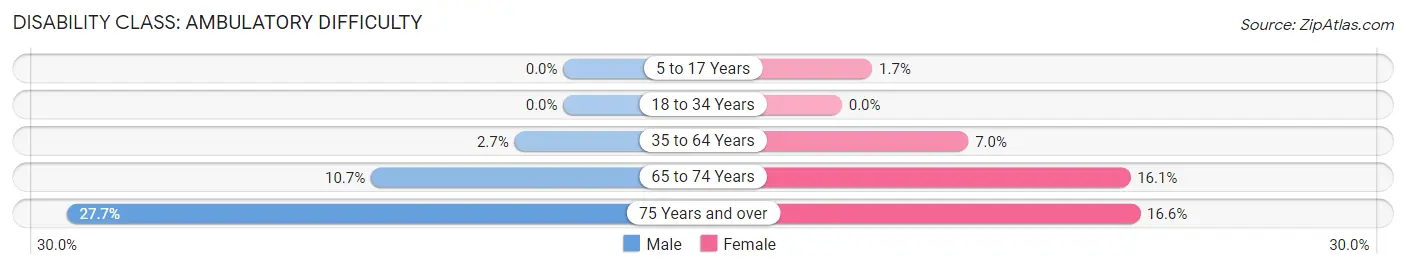
| Age Bracket | Male | Female |
| 5 to 17 Years | 0 (0.0%) | 7 (1.7%) |
| 18 to 34 Years | 0 (0.0%) | 0 (0.0%) |
| 35 to 64 Years | 35 (2.7%) | 105 (7.0%) |
| 65 to 74 Years | 12 (10.7%) | 62 (16.1%) |
| 75 Years and over | 26 (27.7%) | 45 (16.6%) |
Disability Class: Self-Care Difficulty
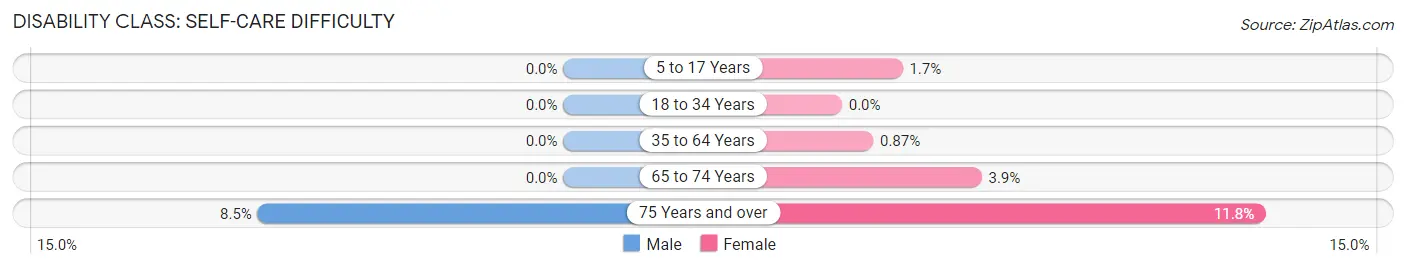
| Age Bracket | Male | Female |
| 5 to 17 Years | 0 (0.0%) | 7 (1.7%) |
| 18 to 34 Years | 0 (0.0%) | 0 (0.0%) |
| 35 to 64 Years | 0 (0.0%) | 13 (0.9%) |
| 65 to 74 Years | 0 (0.0%) | 15 (3.9%) |
| 75 Years and over | 8 (8.5%) | 32 (11.8%) |
Technology Access in Hampstead
Computing Device Access in Hampstead
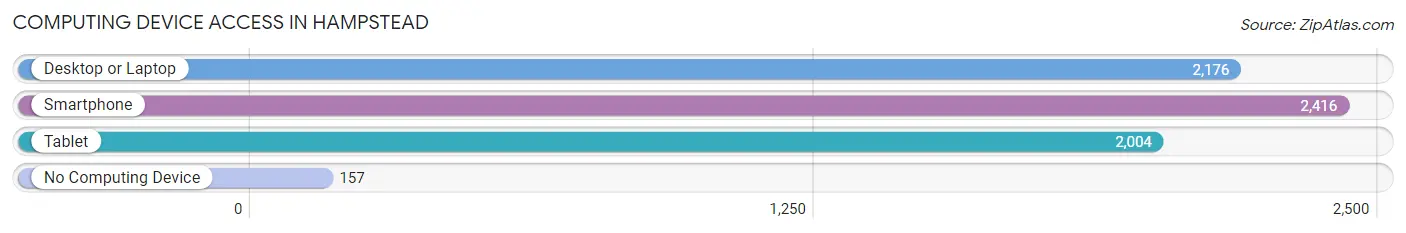
| Device Type | # Households | % Households |
| Desktop or Laptop | 2,176 | 79.6% |
| Smartphone | 2,416 | 88.3% |
| Tablet | 2,004 | 73.3% |
| No Computing Device | 157 | 5.7% |
| Total | 2,735 | 100.0% |
Internet Access in Hampstead
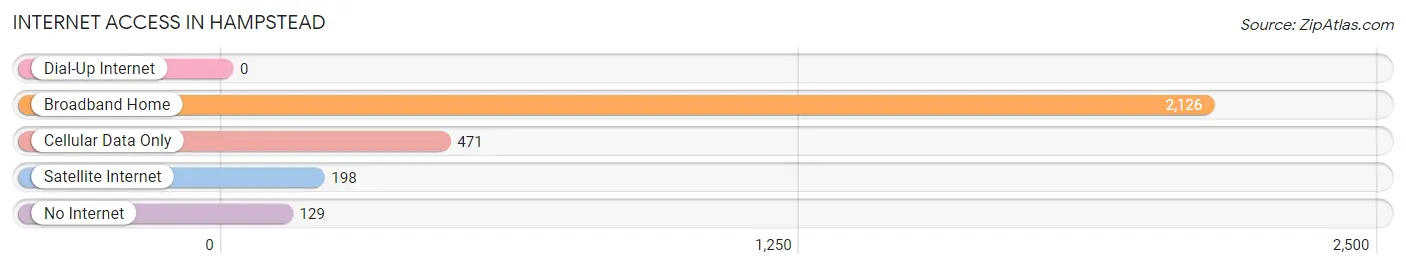
| Internet Type | # Households | % Households |
| Dial-Up Internet | 0 | 0.0% |
| Broadband Home | 2,126 | 77.7% |
| Cellular Data Only | 471 | 17.2% |
| Satellite Internet | 198 | 7.2% |
| No Internet | 129 | 4.7% |
| Total | 2,735 | 100.0% |
Hampstead Summary
Hampstead, Maryland is a small town located in Carroll County, Maryland. It is situated in the northern part of the state, approximately 30 miles northwest of Baltimore. The town has a population of approximately 3,000 people and covers an area of 1.2 square miles.
History
Hampstead was founded in 1790 by a group of German immigrants who had settled in the area. The town was originally known as “Hampstead Town” and was named after the English town of Hampstead. The town was incorporated in 1876 and has remained relatively unchanged since then.
Geography
Hampstead is located in the northern part of Carroll County, Maryland. It is situated in the Piedmont region of the state, which is characterized by rolling hills and valleys. The town is located on the banks of the North Branch of the Patapsco River. The town is bordered by Manchester to the north, Westminster to the east, and Finksburg to the south.
Economy
Hampstead’s economy is largely based on agriculture and light industry. The town is home to several small businesses, including a few restaurants, a grocery store, and a few retail stores. The town is also home to a few small manufacturing companies. The town is also home to a few small farms, which produce a variety of crops, including corn, soybeans, and wheat.
Demographics
As of the 2010 census, the population of Hampstead was 3,017. The racial makeup of the town was 94.3% White, 1.7% African American, 0.3% Native American, 0.7% Asian, 0.1% Pacific Islander, 1.2% from other races, and 1.9% from two or more races. Hispanic or Latino of any race were 3.2% of the population.
The median income for a household in the town was $60,938, and the median income for a family was $68,750. Males had a median income of $45,938 versus $31,250 for females. The per capita income for the town was $25,938. About 4.2% of families and 5.3% of the population were below the poverty line, including 6.3% of those under age 18 and 4.2% of those age 65 or over.
Hampstead is a small town with a rich history and a diverse population. The town is home to a variety of businesses and industries, and its economy is largely based on agriculture and light industry. The town is also home to a few small farms, which produce a variety of crops. The town has a population of approximately 3,000 people and covers an area of 1.2 square miles.
Common Questions
What is Per Capita Income in Hampstead?
Per Capita income in Hampstead is $45,936.
What is the Median Family Income in Hampstead?
Median Family Income in Hampstead is $116,667.
What is the Median Household income in Hampstead?
Median Household Income in Hampstead is $87,454.
What is Income or Wage Gap in Hampstead?
Income or Wage Gap in Hampstead is 16.2%.
Women in Hampstead earn 83.8 cents for every dollar earned by a man.
What is Inequality or Gini Index in Hampstead?
Inequality or Gini Index in Hampstead is 0.41.
What is the Total Population of Hampstead?
Total Population of Hampstead is 6,278.
What is the Total Male Population of Hampstead?
Total Male Population of Hampstead is 2,742.
What is the Total Female Population of Hampstead?
Total Female Population of Hampstead is 3,536.
What is the Ratio of Males per 100 Females in Hampstead?
There are 77.55 Males per 100 Females in Hampstead.
What is the Ratio of Females per 100 Males in Hampstead?
There are 128.96 Females per 100 Males in Hampstead.
What is the Median Population Age in Hampstead?
Median Population Age in Hampstead is 41.4 Years.
What is the Average Family Size in Hampstead
Average Family Size in Hampstead is 2.9 People.
What is the Average Household Size in Hampstead
Average Household Size in Hampstead is 2.3 People.
How Large is the Labor Force in Hampstead?
There are 3,957 People in the Labor Forcein in Hampstead.
What is the Percentage of People in the Labor Force in Hampstead?
74.5% of People are in the Labor Force in Hampstead.
What is the Unemployment Rate in Hampstead?
Unemployment Rate in Hampstead is 6.9%.