Jefferson, MD Map & Demographics
Jefferson Map
Jefferson Overview
$50,885
PER CAPITA INCOME
$140,476
AVG FAMILY INCOME
$137,667
AVG HOUSEHOLD INCOME
35.1%
WAGE / INCOME GAP [ % ]
64.9¢/ $1
WAGE / INCOME GAP [ $ ]
0.33
INEQUALITY / GINI INDEX
2,742
TOTAL POPULATION
1,312
MALE POPULATION
1,430
FEMALE POPULATION
91.75
MALES / 100 FEMALES
108.99
FEMALES / 100 MALES
41.4
MEDIAN AGE
3.2
AVG FAMILY SIZE
2.9
AVG HOUSEHOLD SIZE
1,499
LABOR FORCE [ PEOPLE ]
68.3%
PERCENT IN LABOR FORCE
3.5%
UNEMPLOYMENT RATE
Jefferson Zip Codes
Jefferson Area Codes
Income in Jefferson
Income Overview in Jefferson
Per Capita Income in Jefferson is $50,885, while median incomes of families and households are $140,476 and $137,667 respectively.
| Characteristic | Number | Measure |
| Per Capita Income | 2,742 | $50,885 |
| Median Family Income | 754 | $140,476 |
| Mean Family Income | 754 | $154,366 |
| Median Household Income | 956 | $137,667 |
| Mean Household Income | 956 | $146,487 |
| Income Deficit | 754 | $0 |
| Wage / Income Gap (%) | 2,742 | 35.12% |
| Wage / Income Gap ($) | 2,742 | 64.88¢ per $1 |
| Gini / Inequality Index | 2,742 | 0.33 |
Earnings by Sex in Jefferson
Average Earnings in Jefferson are $65,536, $75,417 for men and $48,929 for women, a difference of 35.1%.
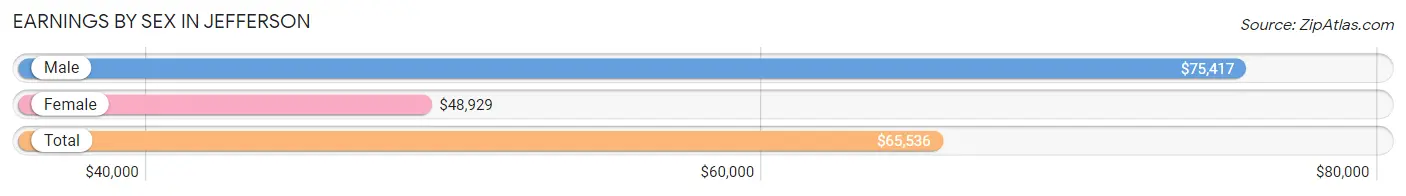
| Sex | Number | Average Earnings |
| Male | 748 (49.7%) | $75,417 |
| Female | 758 (50.3%) | $48,929 |
| Total | 1,506 (100.0%) | $65,536 |
Earnings by Sex by Income Bracket in Jefferson
The most common earnings brackets in Jefferson are $100,000+ for men (244 | 32.6%) and $100,000+ for women (136 | 17.9%).
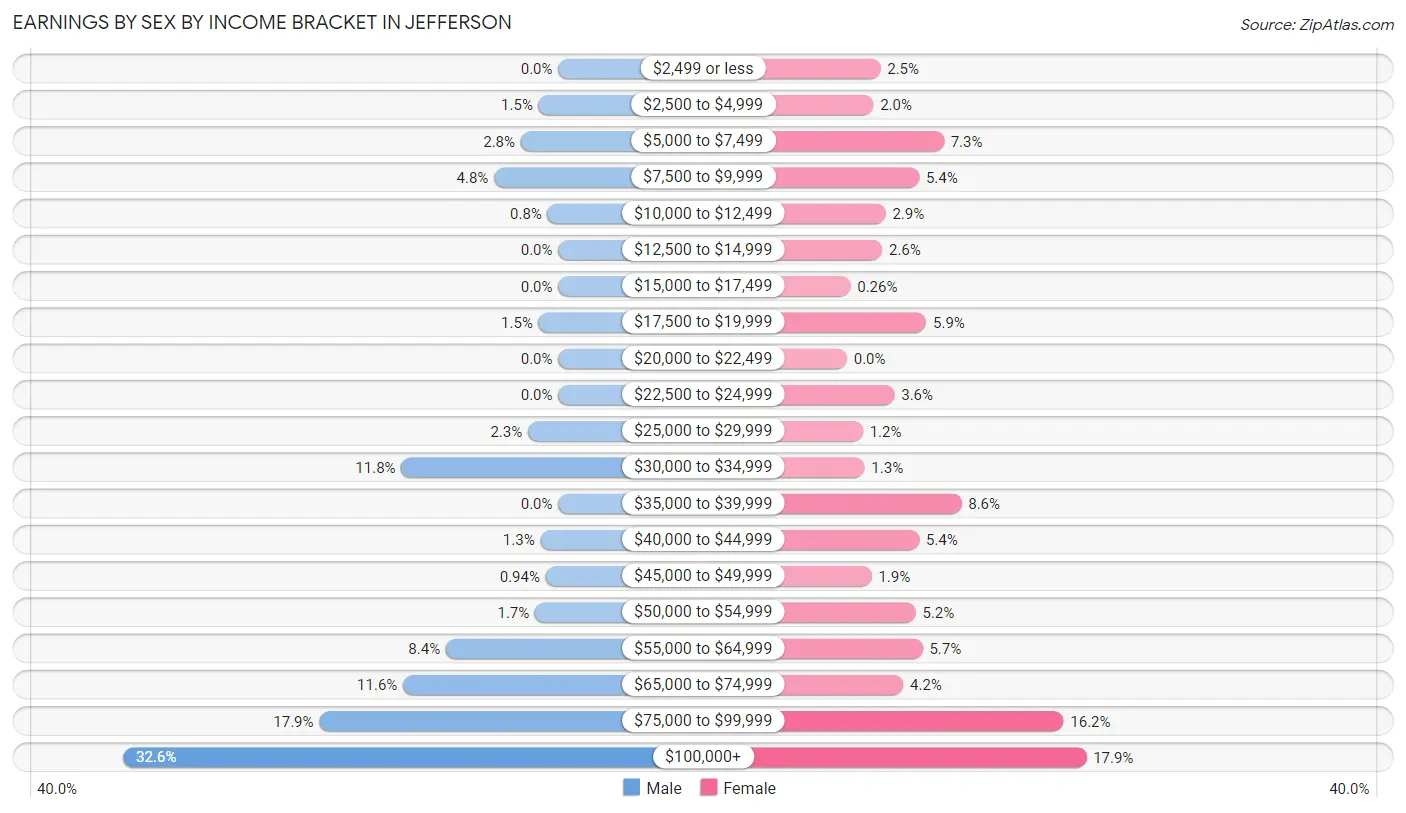
| Income | Male | Female |
| $2,499 or less | 0 (0.0%) | 19 (2.5%) |
| $2,500 to $4,999 | 11 (1.5%) | 15 (2.0%) |
| $5,000 to $7,499 | 21 (2.8%) | 55 (7.3%) |
| $7,500 to $9,999 | 36 (4.8%) | 41 (5.4%) |
| $10,000 to $12,499 | 6 (0.8%) | 22 (2.9%) |
| $12,500 to $14,999 | 0 (0.0%) | 20 (2.6%) |
| $15,000 to $17,499 | 0 (0.0%) | 2 (0.3%) |
| $17,500 to $19,999 | 11 (1.5%) | 45 (5.9%) |
| $20,000 to $22,499 | 0 (0.0%) | 0 (0.0%) |
| $22,500 to $24,999 | 0 (0.0%) | 27 (3.6%) |
| $25,000 to $29,999 | 17 (2.3%) | 9 (1.2%) |
| $30,000 to $34,999 | 88 (11.8%) | 10 (1.3%) |
| $35,000 to $39,999 | 0 (0.0%) | 65 (8.6%) |
| $40,000 to $44,999 | 10 (1.3%) | 41 (5.4%) |
| $45,000 to $49,999 | 7 (0.9%) | 14 (1.8%) |
| $50,000 to $54,999 | 13 (1.7%) | 39 (5.1%) |
| $55,000 to $64,999 | 63 (8.4%) | 43 (5.7%) |
| $65,000 to $74,999 | 87 (11.6%) | 32 (4.2%) |
| $75,000 to $99,999 | 134 (17.9%) | 123 (16.2%) |
| $100,000+ | 244 (32.6%) | 136 (17.9%) |
| Total | 748 (100.0%) | 758 (100.0%) |
Earnings by Sex by Educational Attainment in Jefferson
Average earnings in Jefferson are $80,146 for men and $57,813 for women, a difference of 27.9%. Men with an educational attainment of bachelor's degree enjoy the highest average annual earnings of $136,063, while those with less than high school education earn the least with $58,750. Women with an educational attainment of graduate degree earn the most with the average annual earnings of $101,250, while those with high school diploma education have the smallest earnings of $38,750.
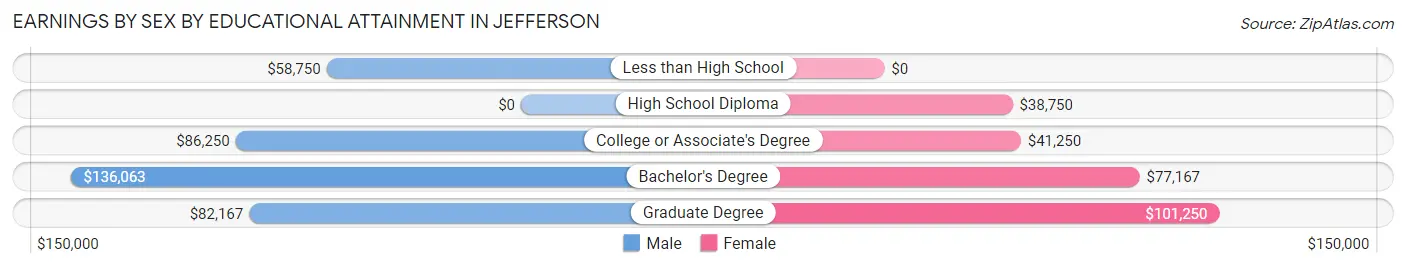
| Educational Attainment | Male Income | Female Income |
| Less than High School | $58,750 | $0 |
| High School Diploma | - | - |
| College or Associate's Degree | $86,250 | $41,250 |
| Bachelor's Degree | $136,063 | $77,167 |
| Graduate Degree | $82,167 | $101,250 |
| Total | $80,146 | $57,813 |
Family Income in Jefferson
Family Income Brackets in Jefferson
According to the Jefferson family income data, there are 185 families falling into the $200,000+ income range, which is the most common income bracket and makes up 24.5% of all families.
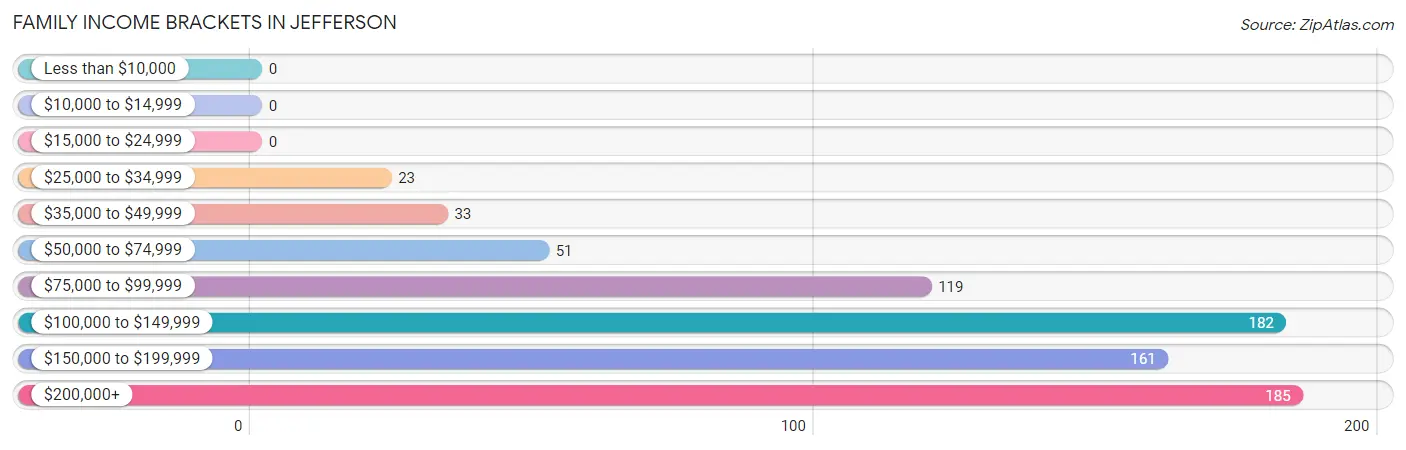
| Income Bracket | # Families | % Families |
| Less than $10,000 | 0 | 0.0% |
| $10,000 to $14,999 | 0 | 0.0% |
| $15,000 to $24,999 | 0 | 0.0% |
| $25,000 to $34,999 | 23 | 3.1% |
| $35,000 to $49,999 | 33 | 4.4% |
| $50,000 to $74,999 | 51 | 6.8% |
| $75,000 to $99,999 | 119 | 15.8% |
| $100,000 to $149,999 | 182 | 24.1% |
| $150,000 to $199,999 | 161 | 21.4% |
| $200,000+ | 185 | 24.5% |
Family Income by Famaliy Size in Jefferson
4-person families (84 | 11.1%) account for the highest median family income in Jefferson with $163,250 per family, while 2-person families (339 | 45.0%) have the highest median income of $68,775 per family member.
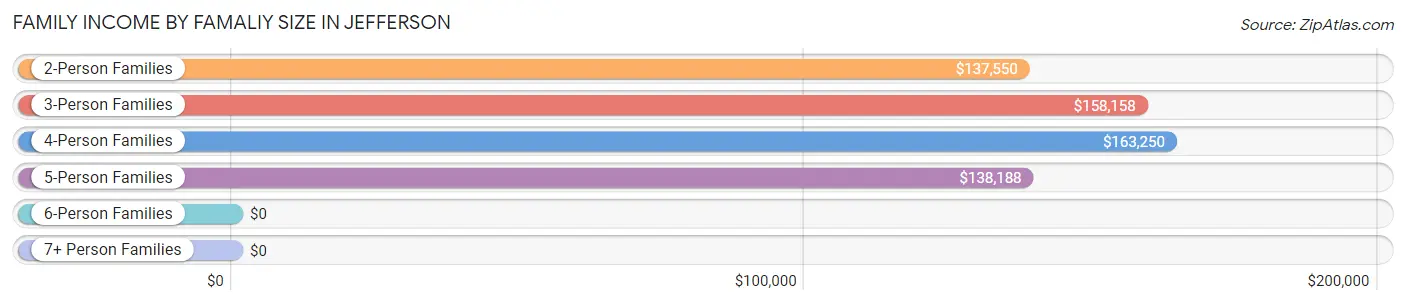
| Income Bracket | # Families | Median Income |
| 2-Person Families | 339 (45.0%) | $137,550 |
| 3-Person Families | 168 (22.3%) | $158,158 |
| 4-Person Families | 84 (11.1%) | $163,250 |
| 5-Person Families | 115 (15.2%) | $138,188 |
| 6-Person Families | 42 (5.6%) | $0 |
| 7+ Person Families | 6 (0.8%) | $0 |
| Total | 754 (100.0%) | $140,476 |
Family Income by Number of Earners in Jefferson
The median family income in Jefferson is $140,476, with families comprising 3+ earners (125) having the highest median family income of $201,625, while families with no earners (95) have the lowest median family income of $100,114, accounting for 16.6% and 12.6% of families, respectively.
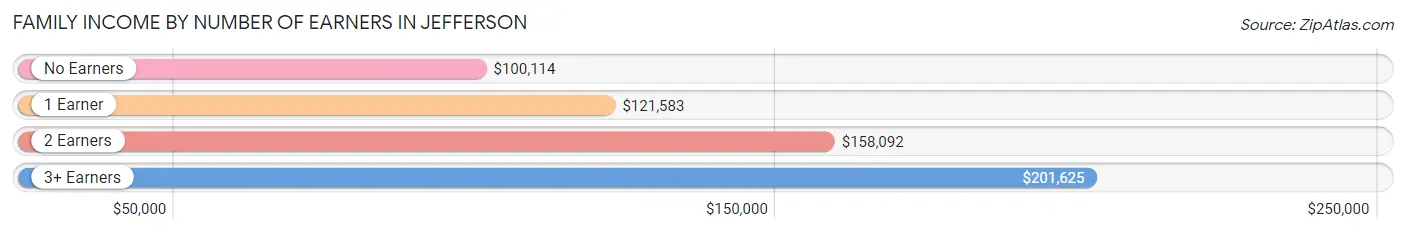
| Number of Earners | # Families | Median Income |
| No Earners | 95 (12.6%) | $100,114 |
| 1 Earner | 241 (32.0%) | $121,583 |
| 2 Earners | 293 (38.9%) | $158,092 |
| 3+ Earners | 125 (16.6%) | $201,625 |
| Total | 754 (100.0%) | $140,476 |
Household Income in Jefferson
Household Income Brackets in Jefferson
With 209 households falling in the category, the $200,000+ income range is the most frequent in Jefferson, accounting for 21.9% of all households.
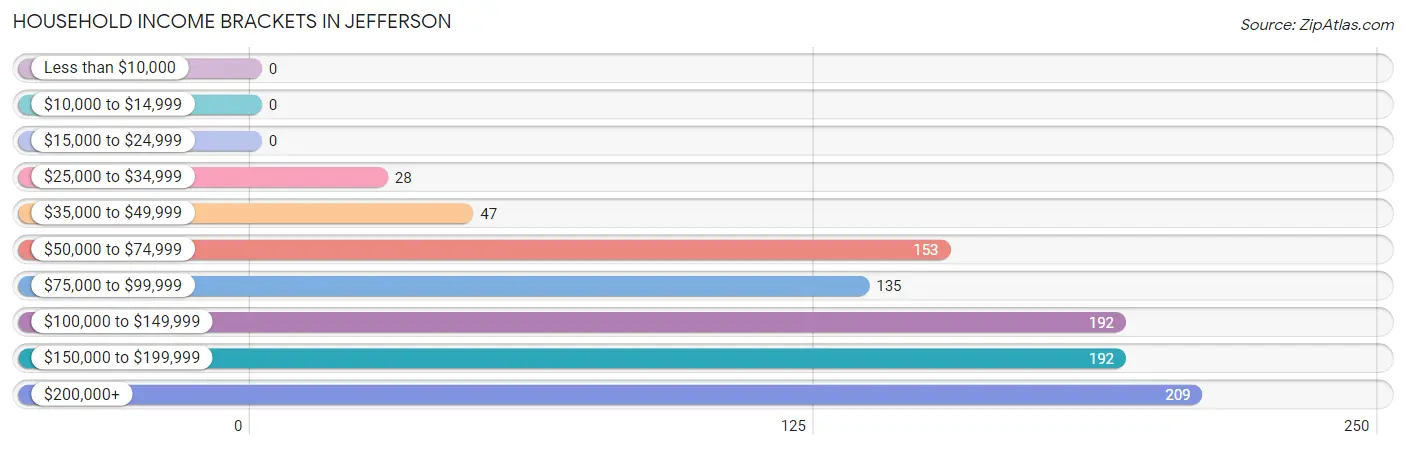
| Income Bracket | # Households | % Households |
| Less than $10,000 | 0 | 0.0% |
| $10,000 to $14,999 | 0 | 0.0% |
| $15,000 to $24,999 | 0 | 0.0% |
| $25,000 to $34,999 | 28 | 2.9% |
| $35,000 to $49,999 | 47 | 4.9% |
| $50,000 to $74,999 | 153 | 16.0% |
| $75,000 to $99,999 | 135 | 14.1% |
| $100,000 to $149,999 | 192 | 20.1% |
| $150,000 to $199,999 | 192 | 20.1% |
| $200,000+ | 209 | 21.9% |
Household Income by Householder Age in Jefferson
The median household income in Jefferson is $137,667, with the highest median household income of $156,048 found in the 45 to 64 years age bracket for the primary householder. A total of 502 households (52.5%) fall into this category.
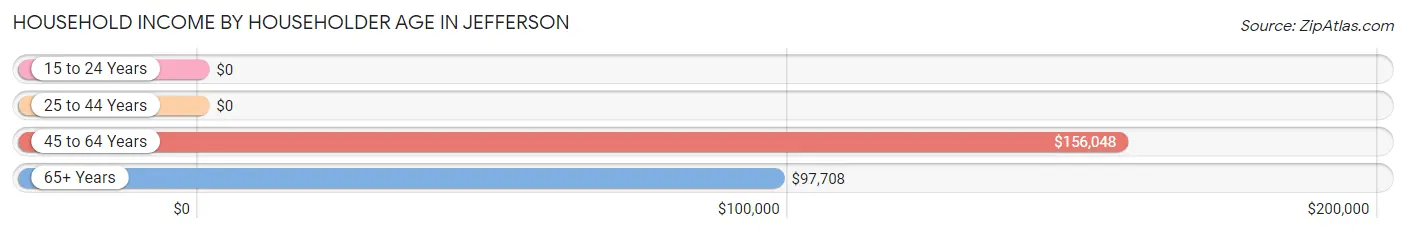
| Income Bracket | # Households | Median Income |
| 15 to 24 Years | 0 (0.0%) | $0 |
| 25 to 44 Years | 229 (23.9%) | $0 |
| 45 to 64 Years | 502 (52.5%) | $156,048 |
| 65+ Years | 225 (23.5%) | $97,708 |
| Total | 956 (100.0%) | $137,667 |
Poverty in Jefferson
Income Below Poverty by Sex and Age in Jefferson
With 5.8% poverty level for males and 5.9% for females among the residents of Jefferson, under 5 year old males and 45 to 54 year old females are the most vulnerable to poverty, with 26 males (30.9%) and 37 females (17.5%) in their respective age groups living below the poverty level.
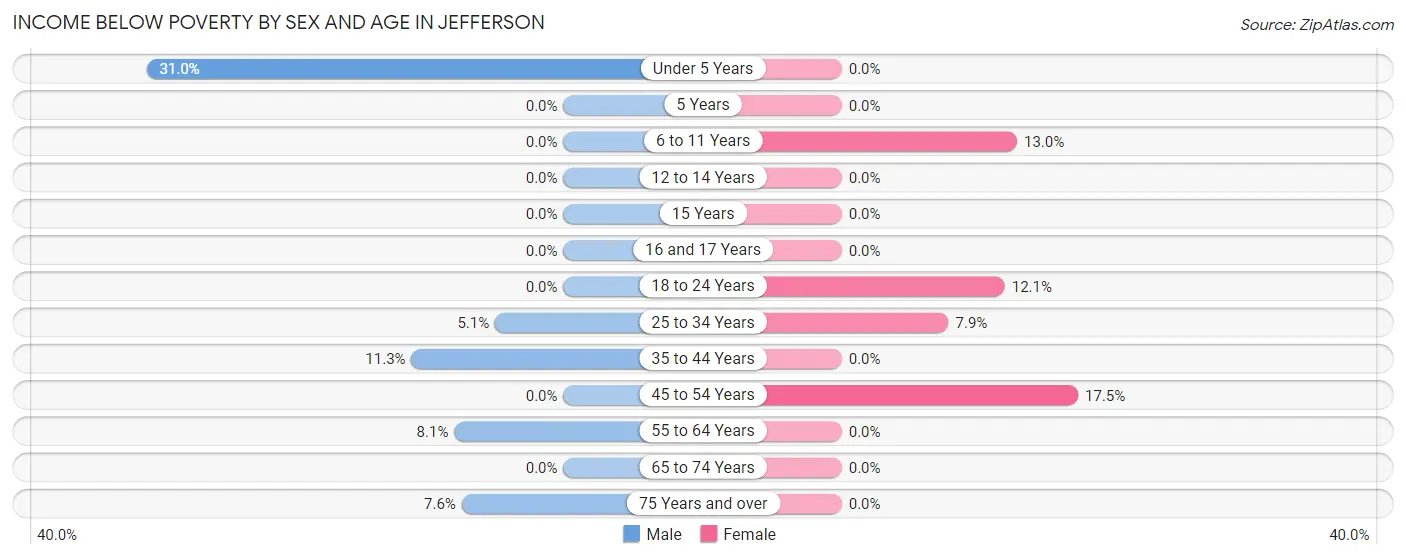
| Age Bracket | Male | Female |
| Under 5 Years | 26 (30.9%) | 0 (0.0%) |
| 5 Years | 0 (0.0%) | 0 (0.0%) |
| 6 to 11 Years | 0 (0.0%) | 16 (13.0%) |
| 12 to 14 Years | 0 (0.0%) | 0 (0.0%) |
| 15 Years | 0 (0.0%) | 0 (0.0%) |
| 16 and 17 Years | 0 (0.0%) | 0 (0.0%) |
| 18 to 24 Years | 0 (0.0%) | 19 (12.1%) |
| 25 to 34 Years | 7 (5.1%) | 13 (7.9%) |
| 35 to 44 Years | 15 (11.3%) | 0 (0.0%) |
| 45 to 54 Years | 0 (0.0%) | 37 (17.5%) |
| 55 to 64 Years | 20 (8.1%) | 0 (0.0%) |
| 65 to 74 Years | 0 (0.0%) | 0 (0.0%) |
| 75 Years and over | 8 (7.5%) | 0 (0.0%) |
| Total | 76 (5.8%) | 85 (5.9%) |
Income Above Poverty by Sex and Age in Jefferson
According to the poverty statistics in Jefferson, males aged 5 years and females aged under 5 years are the age groups that are most secure financially, with 100.0% of males and 100.0% of females in these age groups living above the poverty line.
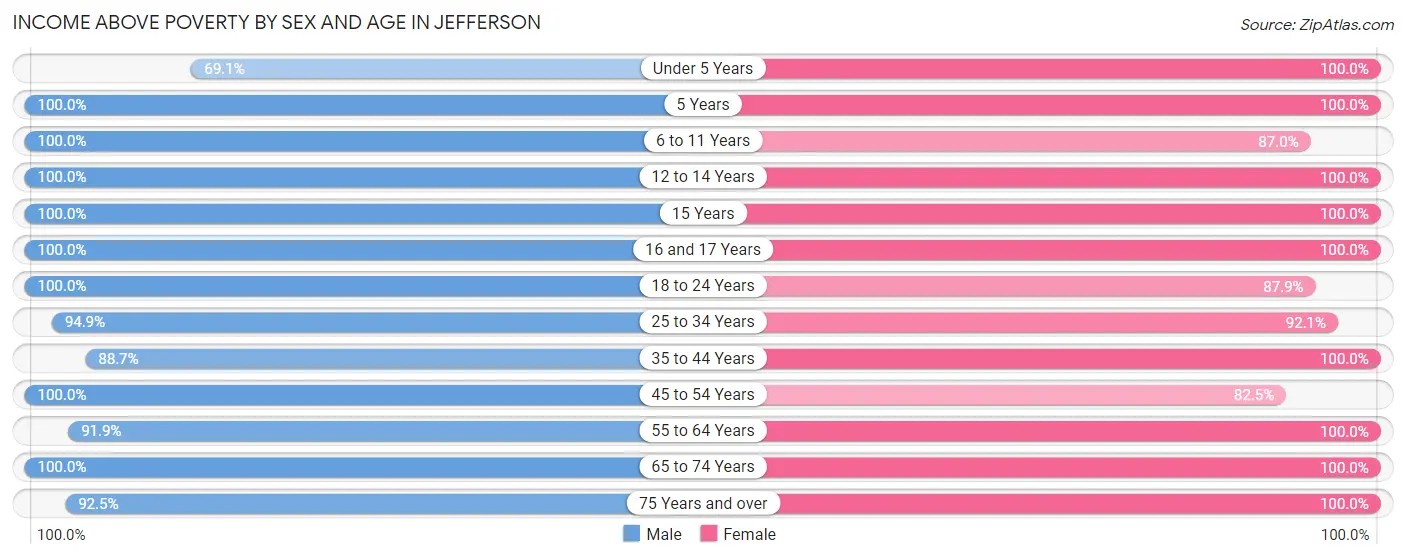
| Age Bracket | Male | Female |
| Under 5 Years | 58 (69.1%) | 69 (100.0%) |
| 5 Years | 29 (100.0%) | 30 (100.0%) |
| 6 to 11 Years | 56 (100.0%) | 107 (87.0%) |
| 12 to 14 Years | 82 (100.0%) | 48 (100.0%) |
| 15 Years | 12 (100.0%) | 9 (100.0%) |
| 16 and 17 Years | 33 (100.0%) | 30 (100.0%) |
| 18 to 24 Years | 103 (100.0%) | 138 (87.9%) |
| 25 to 34 Years | 131 (94.9%) | 151 (92.1%) |
| 35 to 44 Years | 118 (88.7%) | 131 (100.0%) |
| 45 to 54 Years | 164 (100.0%) | 174 (82.5%) |
| 55 to 64 Years | 227 (91.9%) | 283 (100.0%) |
| 65 to 74 Years | 121 (100.0%) | 73 (100.0%) |
| 75 Years and over | 98 (92.4%) | 100 (100.0%) |
| Total | 1,232 (94.2%) | 1,343 (94.1%) |
Income Below Poverty Among Married-Couple Families in Jefferson
The poverty statistics for married-couple families in Jefferson show that 3.5% or 23 of the total 653 families live below the poverty line. Families with 3 or 4 children have the highest poverty rate of 11.7%, comprising of 13 families. On the other hand, families with 1 or 2 children have the lowest poverty rate of 0.0%, which includes 0 families.
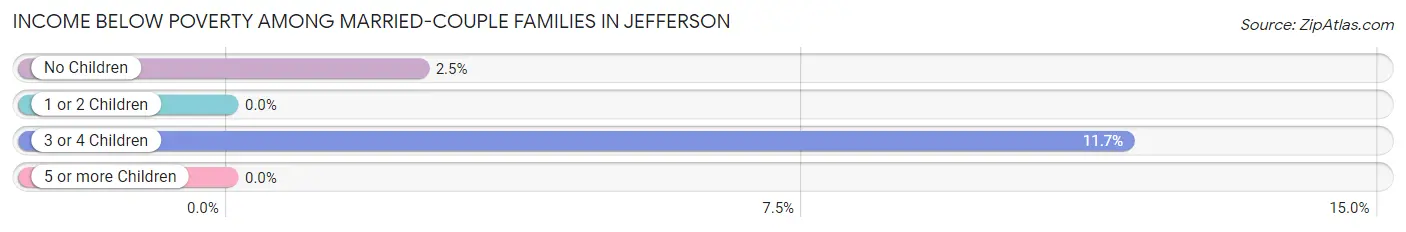
| Children | Above Poverty | Below Poverty |
| No Children | 392 (97.5%) | 10 (2.5%) |
| 1 or 2 Children | 140 (100.0%) | 0 (0.0%) |
| 3 or 4 Children | 98 (88.3%) | 13 (11.7%) |
| 5 or more Children | 0 (0.0%) | 0 (0.0%) |
| Total | 630 (96.5%) | 23 (3.5%) |
Income Below Poverty Among Single-Parent Households in Jefferson
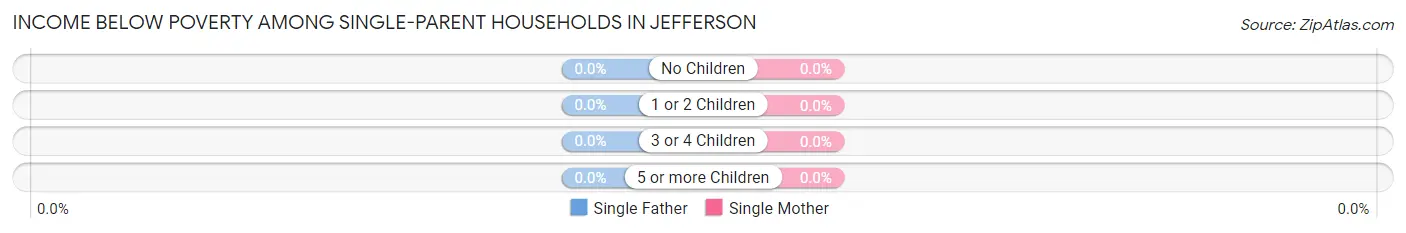
| Children | Single Father | Single Mother |
| No Children | 0 (0.0%) | 0 (0.0%) |
| 1 or 2 Children | 0 (0.0%) | 0 (0.0%) |
| 3 or 4 Children | 0 (0.0%) | 0 (0.0%) |
| 5 or more Children | 0 (0.0%) | 0 (0.0%) |
| Total | 0 (0.0%) | 0 (0.0%) |
Income Below Poverty Among Married-Couple vs Single-Parent Households in Jefferson
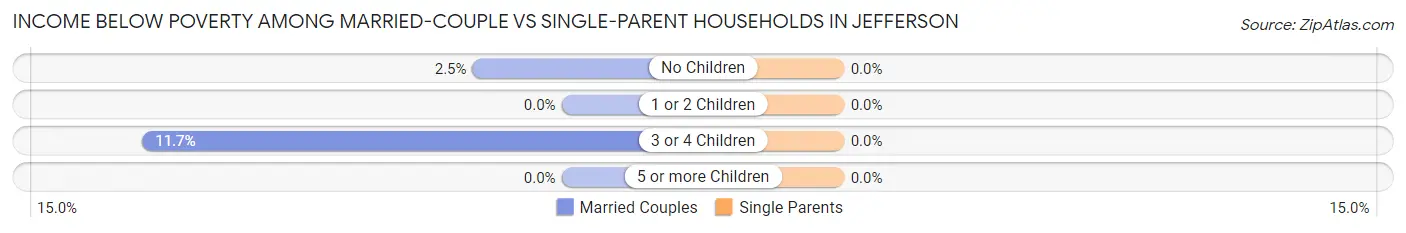
| Children | Married-Couple Families | Single-Parent Households |
| No Children | 10 (2.5%) | 0 (0.0%) |
| 1 or 2 Children | 0 (0.0%) | 0 (0.0%) |
| 3 or 4 Children | 13 (11.7%) | 0 (0.0%) |
| 5 or more Children | 0 (0.0%) | 0 (0.0%) |
| Total | 23 (3.5%) | 0 (0.0%) |
Race in Jefferson
The most populous races in Jefferson are White / Caucasian (2,332 | 85.1%), Black / African American (163 | 5.9%), and Hispanic or Latino (142 | 5.2%).
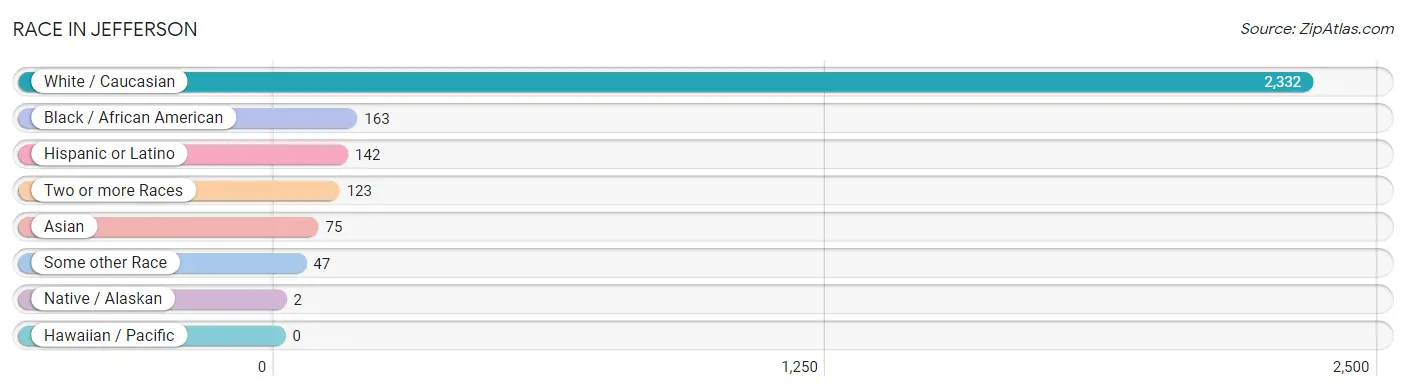
| Race | # Population | % Population |
| Asian | 75 | 2.7% |
| Black / African American | 163 | 5.9% |
| Hawaiian / Pacific | 0 | 0.0% |
| Hispanic or Latino | 142 | 5.2% |
| Native / Alaskan | 2 | 0.1% |
| White / Caucasian | 2,332 | 85.1% |
| Two or more Races | 123 | 4.5% |
| Some other Race | 47 | 1.7% |
| Total | 2,742 | 100.0% |
Ancestry in Jefferson
The most populous ancestries reported in Jefferson are German (1,003 | 36.6%), Irish (408 | 14.9%), English (275 | 10.0%), Italian (214 | 7.8%), and American (203 | 7.4%), together accounting for 76.7% of all Jefferson residents.
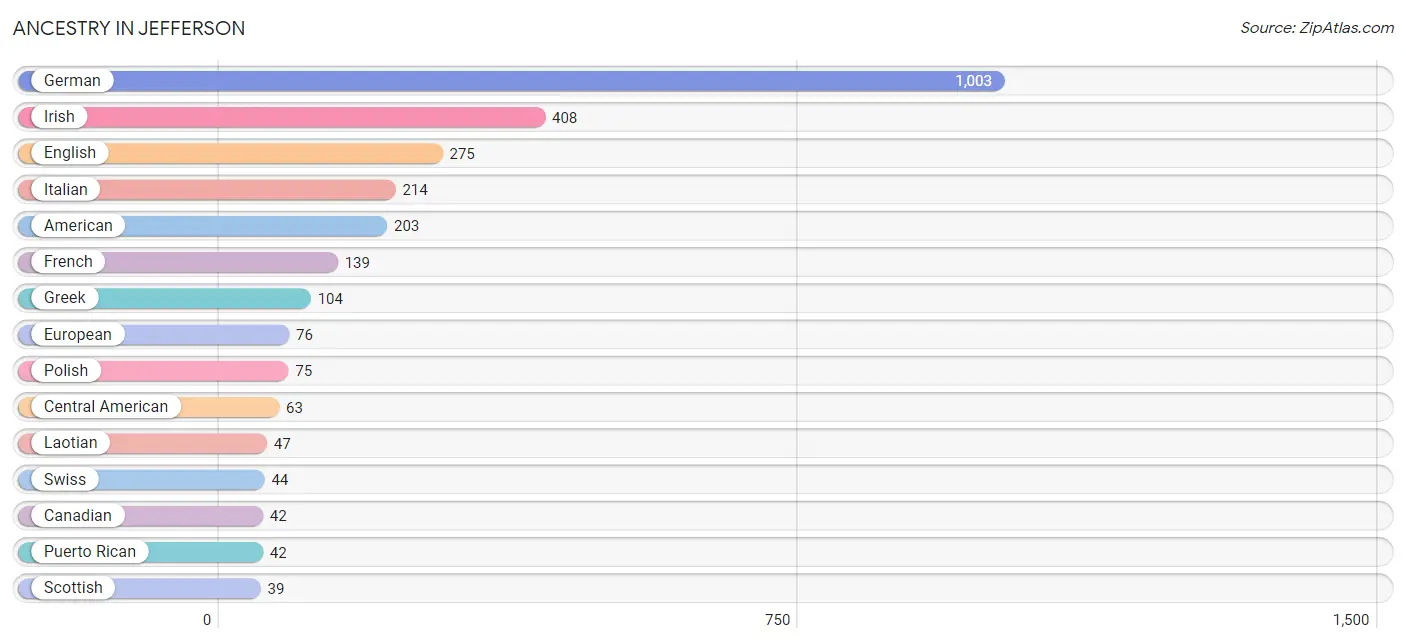
| Ancestry | # Population | % Population |
| American | 203 | 7.4% |
| Arab | 23 | 0.8% |
| Belgian | 7 | 0.3% |
| Bhutanese | 22 | 0.8% |
| Brazilian | 6 | 0.2% |
| British | 31 | 1.1% |
| Canadian | 42 | 1.5% |
| Central American | 63 | 2.3% |
| Cherokee | 2 | 0.1% |
| Costa Rican | 20 | 0.7% |
| Danish | 38 | 1.4% |
| Dutch | 13 | 0.5% |
| English | 275 | 10.0% |
| European | 76 | 2.8% |
| French | 139 | 5.1% |
| German | 1,003 | 36.6% |
| Greek | 104 | 3.8% |
| Honduran | 18 | 0.7% |
| Hungarian | 14 | 0.5% |
| Indian (Asian) | 22 | 0.8% |
| Irish | 408 | 14.9% |
| Italian | 214 | 7.8% |
| Jamaican | 20 | 0.7% |
| Laotian | 47 | 1.7% |
| Lebanese | 10 | 0.4% |
| Lithuanian | 6 | 0.2% |
| Mexican | 27 | 1.0% |
| Moroccan | 13 | 0.5% |
| Norwegian | 7 | 0.3% |
| Peruvian | 9 | 0.3% |
| Polish | 75 | 2.7% |
| Portuguese | 9 | 0.3% |
| Puerto Rican | 42 | 1.5% |
| Russian | 25 | 0.9% |
| Salvadoran | 25 | 0.9% |
| Scandinavian | 7 | 0.3% |
| Scottish | 39 | 1.4% |
| Slovak | 26 | 0.9% |
| South American | 9 | 0.3% |
| Swedish | 14 | 0.5% |
| Swiss | 44 | 1.6% |
| Thai | 21 | 0.8% |
| Ukrainian | 30 | 1.1% |
| Welsh | 14 | 0.5% |
| West Indian | 16 | 0.6% | View All 45 Rows |
Immigrants in Jefferson
The most numerous immigrant groups reported in Jefferson came from Asia (88 | 3.2%), Latin America (45 | 1.6%), Eastern Asia (41 | 1.5%), Indonesia (34 | 1.2%), and South Eastern Asia (34 | 1.2%), together accounting for 8.8% of all Jefferson residents.
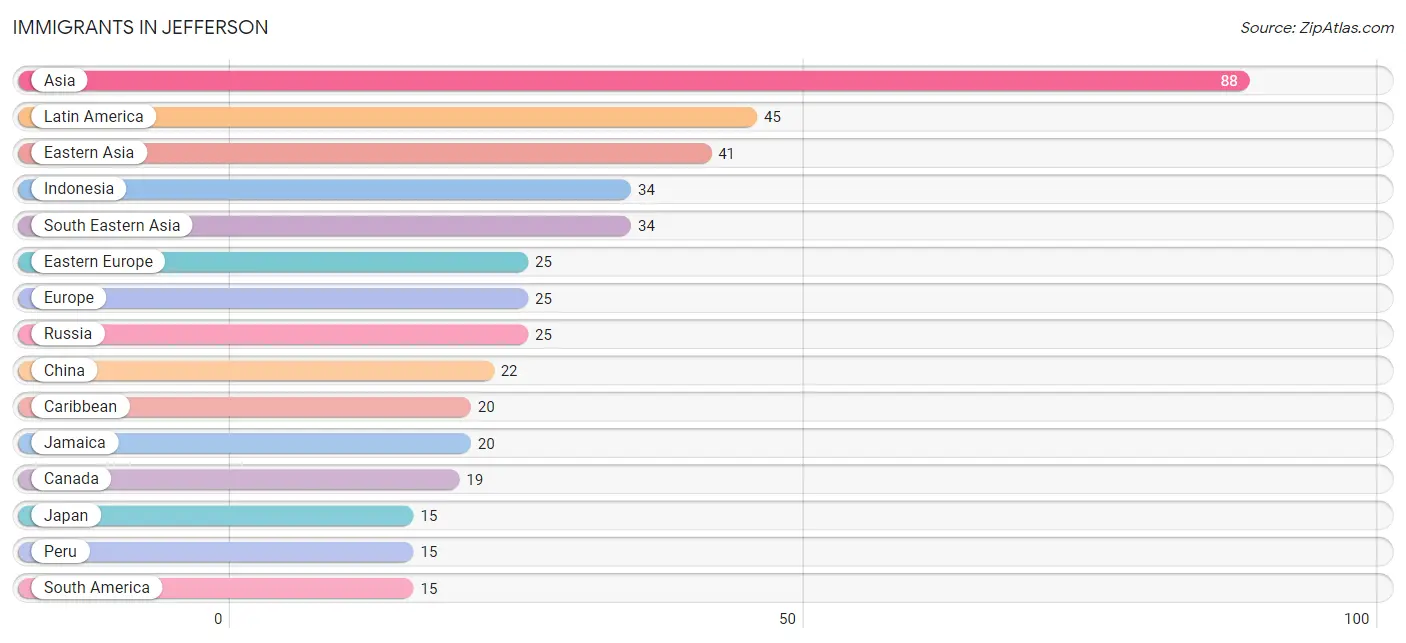
| Immigration Origin | # Population | % Population |
| Asia | 88 | 3.2% |
| Canada | 19 | 0.7% |
| Caribbean | 20 | 0.7% |
| Central America | 10 | 0.4% |
| China | 22 | 0.8% |
| Eastern Asia | 41 | 1.5% |
| Eastern Europe | 25 | 0.9% |
| El Salvador | 4 | 0.2% |
| Europe | 25 | 0.9% |
| Honduras | 6 | 0.2% |
| India | 13 | 0.5% |
| Indonesia | 34 | 1.2% |
| Jamaica | 20 | 0.7% |
| Japan | 15 | 0.5% |
| Korea | 4 | 0.2% |
| Latin America | 45 | 1.6% |
| Peru | 15 | 0.5% |
| Russia | 25 | 0.9% |
| South America | 15 | 0.5% |
| South Central Asia | 13 | 0.5% |
| South Eastern Asia | 34 | 1.2% | View All 21 Rows |
Sex and Age in Jefferson
Sex and Age in Jefferson
The most populous age groups in Jefferson are 60 to 64 Years (157 | 12.0%) for men and 50 to 54 Years (166 | 11.6%) for women.
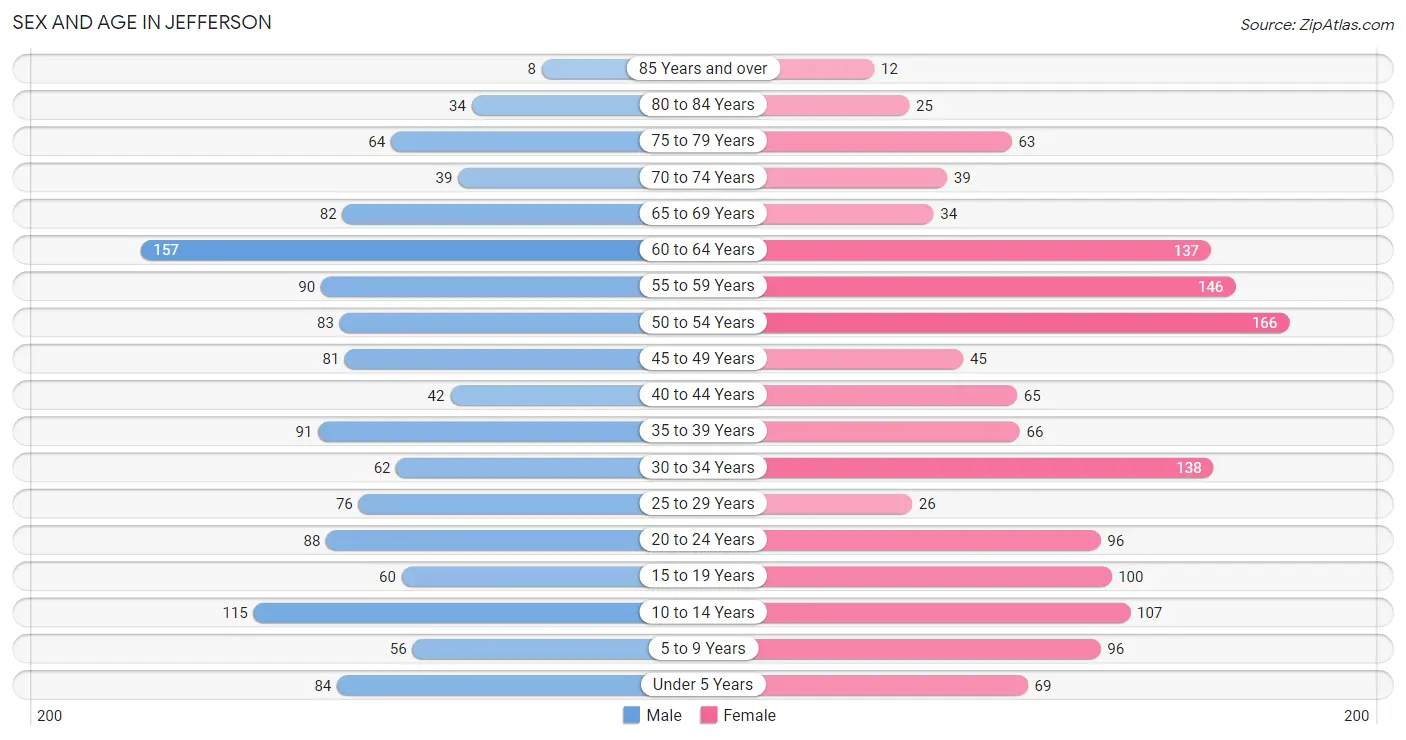
| Age Bracket | Male | Female |
| Under 5 Years | 84 (6.4%) | 69 (4.8%) |
| 5 to 9 Years | 56 (4.3%) | 96 (6.7%) |
| 10 to 14 Years | 115 (8.8%) | 107 (7.5%) |
| 15 to 19 Years | 60 (4.6%) | 100 (7.0%) |
| 20 to 24 Years | 88 (6.7%) | 96 (6.7%) |
| 25 to 29 Years | 76 (5.8%) | 26 (1.8%) |
| 30 to 34 Years | 62 (4.7%) | 138 (9.7%) |
| 35 to 39 Years | 91 (6.9%) | 66 (4.6%) |
| 40 to 44 Years | 42 (3.2%) | 65 (4.5%) |
| 45 to 49 Years | 81 (6.2%) | 45 (3.2%) |
| 50 to 54 Years | 83 (6.3%) | 166 (11.6%) |
| 55 to 59 Years | 90 (6.9%) | 146 (10.2%) |
| 60 to 64 Years | 157 (12.0%) | 137 (9.6%) |
| 65 to 69 Years | 82 (6.2%) | 34 (2.4%) |
| 70 to 74 Years | 39 (3.0%) | 39 (2.7%) |
| 75 to 79 Years | 64 (4.9%) | 63 (4.4%) |
| 80 to 84 Years | 34 (2.6%) | 25 (1.8%) |
| 85 Years and over | 8 (0.6%) | 12 (0.8%) |
| Total | 1,312 (100.0%) | 1,430 (100.0%) |
Families and Households in Jefferson
Median Family Size in Jefferson
The median family size in Jefferson is 3.25 persons per family, with married-couple families (653 | 86.6%) accounting for the largest median family size of 3.34 persons per family. On the other hand, single male/father families (7 | 0.9%) represent the smallest median family size with 1.71 persons per family.
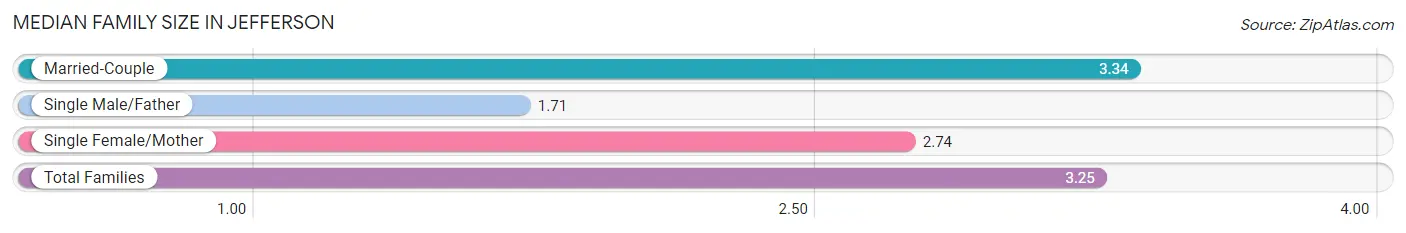
| Family Type | # Families | Family Size |
| Married-Couple | 653 (86.6%) | 3.34 |
| Single Male/Father | 7 (0.9%) | 1.71 |
| Single Female/Mother | 94 (12.5%) | 2.74 |
| Total Families | 754 (100.0%) | 3.25 |
Median Household Size in Jefferson
The median household size in Jefferson is 2.87 persons per household, with married-couple households (653 | 68.3%) accounting for the largest median household size of 3.36 persons per household. non-family households (202 | 21.1%) represent the smallest median household size with 1.30 persons per household.
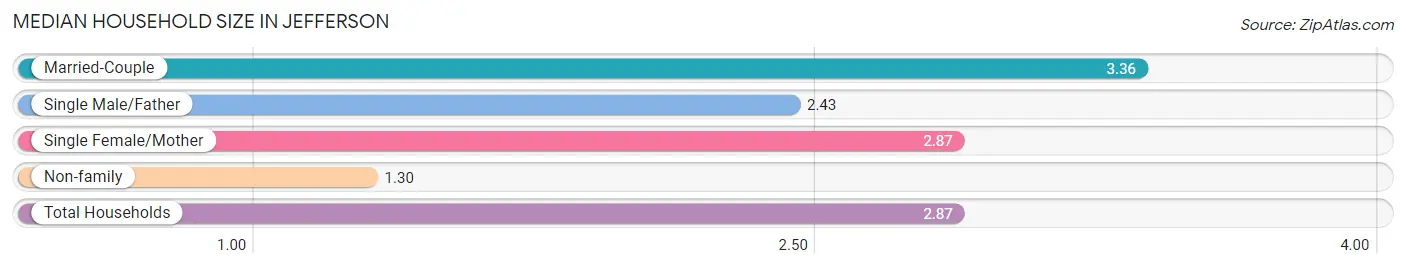
| Household Type | # Households | Household Size |
| Married-Couple | 653 (68.3%) | 3.36 |
| Single Male/Father | 7 (0.7%) | 2.43 |
| Single Female/Mother | 94 (9.8%) | 2.87 |
| Non-family | 202 (21.1%) | 1.30 |
| Total Households | 956 (100.0%) | 2.87 |
Household Size by Marriage Status in Jefferson
Out of a total of 956 households in Jefferson, 754 (78.9%) are family households, while 202 (21.1%) are nonfamily households. The most numerous type of family households are 2-person households, comprising 332, and the most common type of nonfamily households are 1-person households, comprising 145.
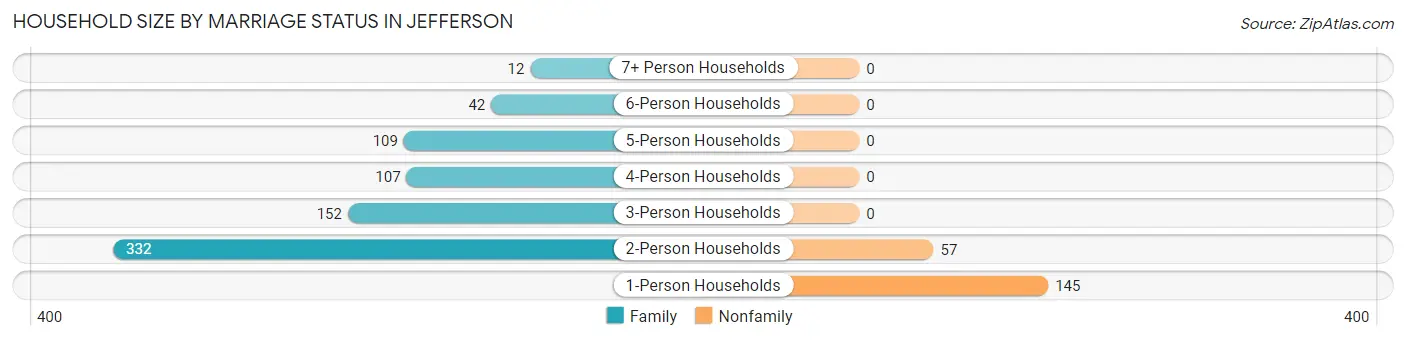
| Household Size | Family Households | Nonfamily Households |
| 1-Person Households | - | 145 (15.2%) |
| 2-Person Households | 332 (34.7%) | 57 (6.0%) |
| 3-Person Households | 152 (15.9%) | 0 (0.0%) |
| 4-Person Households | 107 (11.2%) | 0 (0.0%) |
| 5-Person Households | 109 (11.4%) | 0 (0.0%) |
| 6-Person Households | 42 (4.4%) | 0 (0.0%) |
| 7+ Person Households | 12 (1.3%) | 0 (0.0%) |
| Total | 754 (78.9%) | 202 (21.1%) |
Female Fertility in Jefferson
Fertility by Age in Jefferson
Average fertility rate in Jefferson is 23.0 births per 1,000 women. Women in the age bracket of 20 to 34 years have the highest fertility rate with 50.0 births per 1,000 women. Women in the age bracket of 20 to 34 years acount for 100.0% of all women with births.
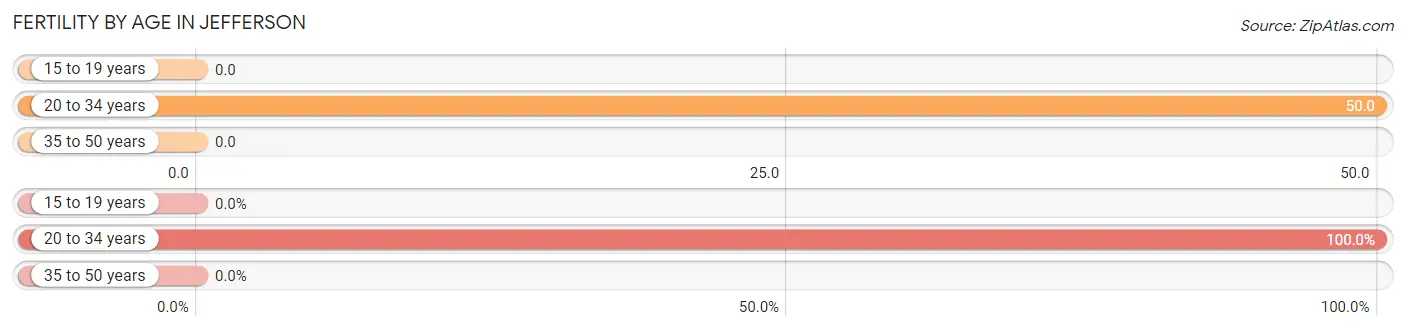
| Age Bracket | Women with Births | Births / 1,000 Women |
| 15 to 19 years | 0 (0.0%) | 0.0 |
| 20 to 34 years | 13 (100.0%) | 50.0 |
| 35 to 50 years | 0 (0.0%) | 0.0 |
| Total | 13 (100.0%) | 23.0 |
Fertility by Age by Marriage Status in Jefferson
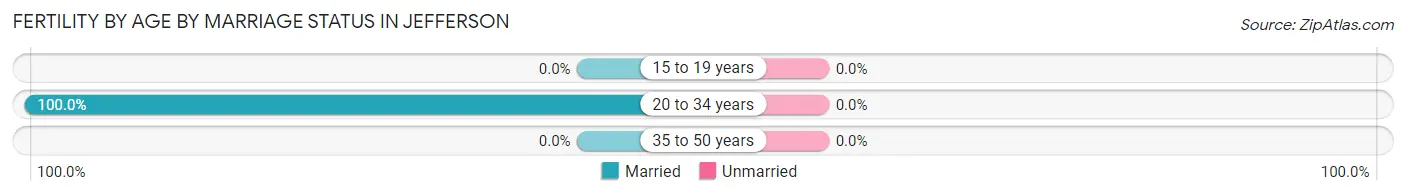
| Age Bracket | Married | Unmarried |
| 15 to 19 years | 0 (0.0%) | 0 (0.0%) |
| 20 to 34 years | 13 (100.0%) | 0 (0.0%) |
| 35 to 50 years | 0 (0.0%) | 0 (0.0%) |
| Total | 13 (100.0%) | 0 (0.0%) |
Fertility by Education in Jefferson
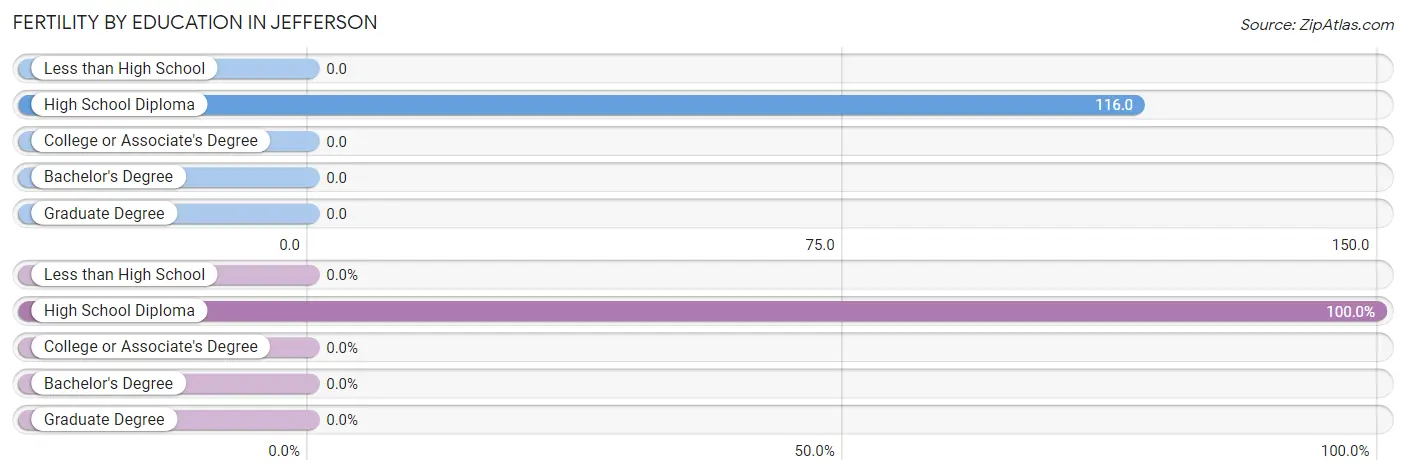
| Educational Attainment | Women with Births | Births / 1,000 Women |
| Less than High School | 0 (0.0%) | 0.0 |
| High School Diploma | 13 (100.0%) | 116.0 |
| College or Associate's Degree | 0 (0.0%) | 0.0 |
| Bachelor's Degree | 0 (0.0%) | 0.0 |
| Graduate Degree | 0 (0.0%) | 0.0 |
| Total | 13 (100.0%) | 23.0 |
Fertility by Education by Marriage Status in Jefferson
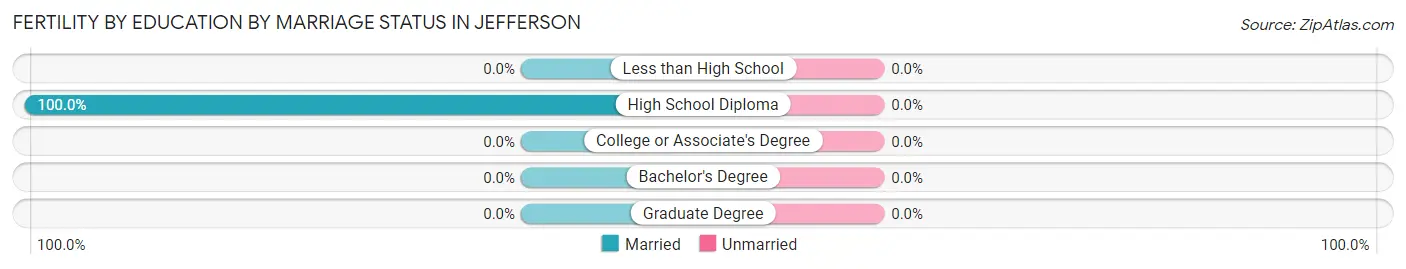
| Educational Attainment | Married | Unmarried |
| Less than High School | 0 (0.0%) | 0 (0.0%) |
| High School Diploma | 13 (100.0%) | 0 (0.0%) |
| College or Associate's Degree | 0 (0.0%) | 0 (0.0%) |
| Bachelor's Degree | 0 (0.0%) | 0 (0.0%) |
| Graduate Degree | 0 (0.0%) | 0 (0.0%) |
| Total | 13 (100.0%) | 0 (0.0%) |
Employment Characteristics in Jefferson
Employment by Class of Employer in Jefferson
Among the 1,396 employed individuals in Jefferson, private company employees (717 | 51.4%), local government employees (225 | 16.1%), and not-for-profit organizations (206 | 14.8%) make up the most common classes of employment.
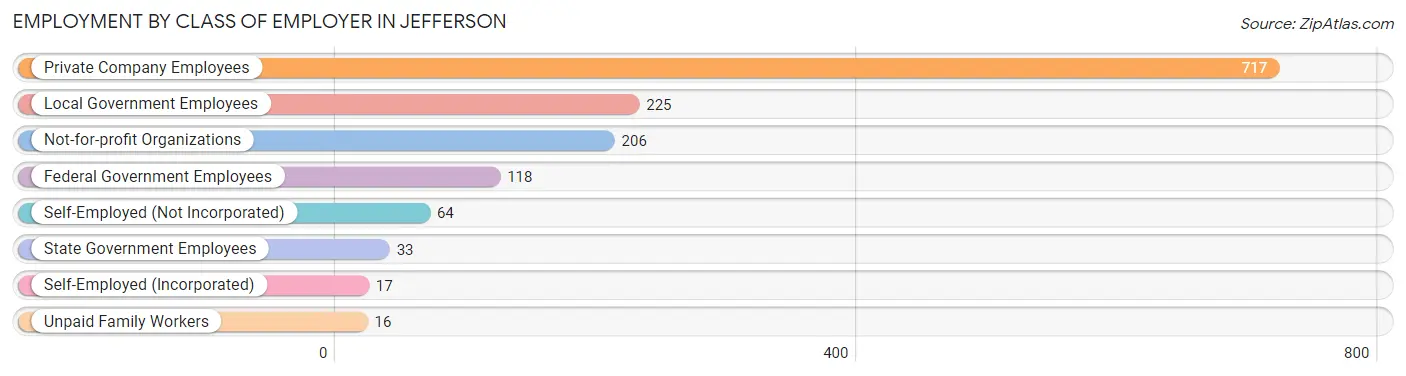
| Employer Class | # Employees | % Employees |
| Private Company Employees | 717 | 51.4% |
| Self-Employed (Incorporated) | 17 | 1.2% |
| Self-Employed (Not Incorporated) | 64 | 4.6% |
| Not-for-profit Organizations | 206 | 14.8% |
| Local Government Employees | 225 | 16.1% |
| State Government Employees | 33 | 2.4% |
| Federal Government Employees | 118 | 8.5% |
| Unpaid Family Workers | 16 | 1.1% |
| Total | 1,396 | 100.0% |
Employment Status by Age in Jefferson
According to the labor force statistics for Jefferson, out of the total population over 16 years of age (2,194), 68.3% or 1,499 individuals are in the labor force, with 3.5% or 52 of them unemployed. The age group with the highest labor force participation rate is 25 to 29 years, with 100.0% or 102 individuals in the labor force. Within the labor force, the 16 to 19 years age range has the highest percentage of unemployed individuals, with 38.5% or 25 of them being unemployed.
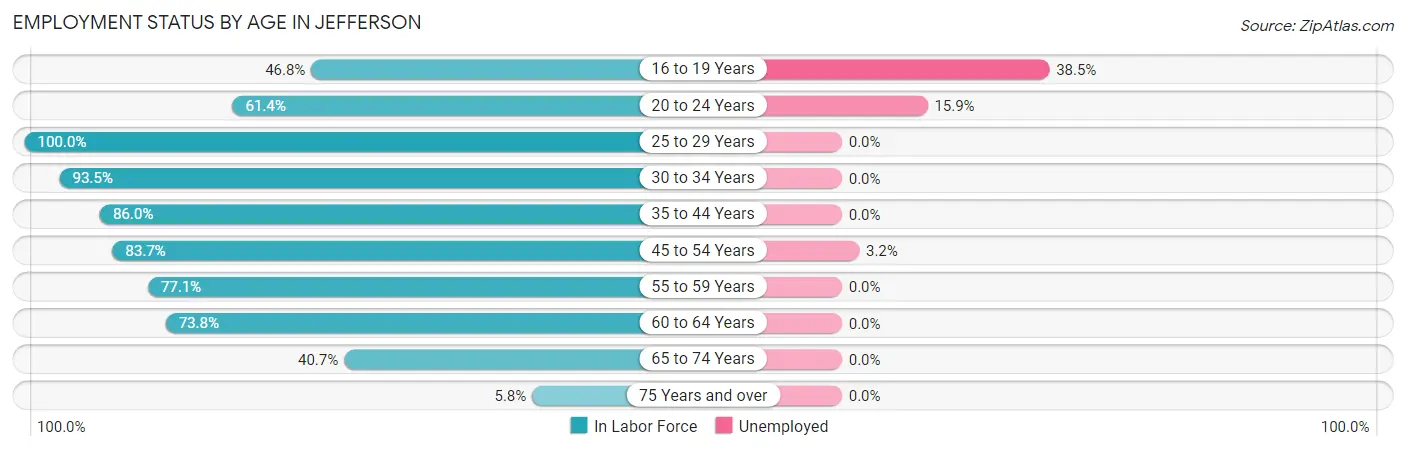
| Age Bracket | In Labor Force | Unemployed |
| 16 to 19 Years | 65 (46.8%) | 25 (38.5%) |
| 20 to 24 Years | 113 (61.4%) | 18 (15.9%) |
| 25 to 29 Years | 102 (100.0%) | 0 (0.0%) |
| 30 to 34 Years | 187 (93.5%) | 0 (0.0%) |
| 35 to 44 Years | 227 (86.0%) | 0 (0.0%) |
| 45 to 54 Years | 314 (83.7%) | 10 (3.2%) |
| 55 to 59 Years | 182 (77.1%) | 0 (0.0%) |
| 60 to 64 Years | 217 (73.8%) | 0 (0.0%) |
| 65 to 74 Years | 79 (40.7%) | 0 (0.0%) |
| 75 Years and over | 12 (5.8%) | 0 (0.0%) |
| Total | 1,499 (68.3%) | 52 (3.5%) |
Employment Status by Educational Attainment in Jefferson
According to labor force statistics for Jefferson, 83.5% of individuals (1,228) out of the total population between 25 and 64 years of age (1,471) are in the labor force, with 0.8% or 10 of them being unemployed. The group with the highest labor force participation rate are those with the educational attainment of less than high school, with 100.0% or 16 individuals in the labor force. Within the labor force, individuals with high school diploma education have the highest percentage of unemployment, with 3.7% or 10 of them being unemployed.
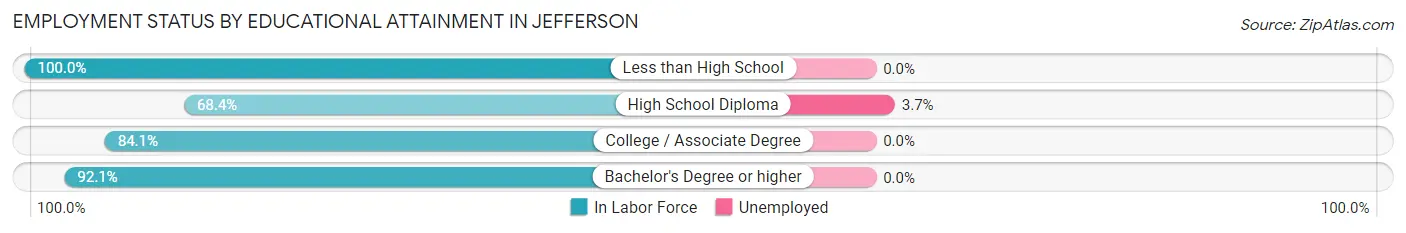
| Educational Attainment | In Labor Force | Unemployed |
| Less than High School | 16 (100.0%) | 0 (0.0%) |
| High School Diploma | 273 (68.4%) | 15 (3.7%) |
| College / Associate Degree | 345 (84.1%) | 0 (0.0%) |
| Bachelor's Degree or higher | 595 (92.1%) | 0 (0.0%) |
| Total | 1,228 (83.5%) | 12 (0.8%) |
Employment Occupations by Sex in Jefferson
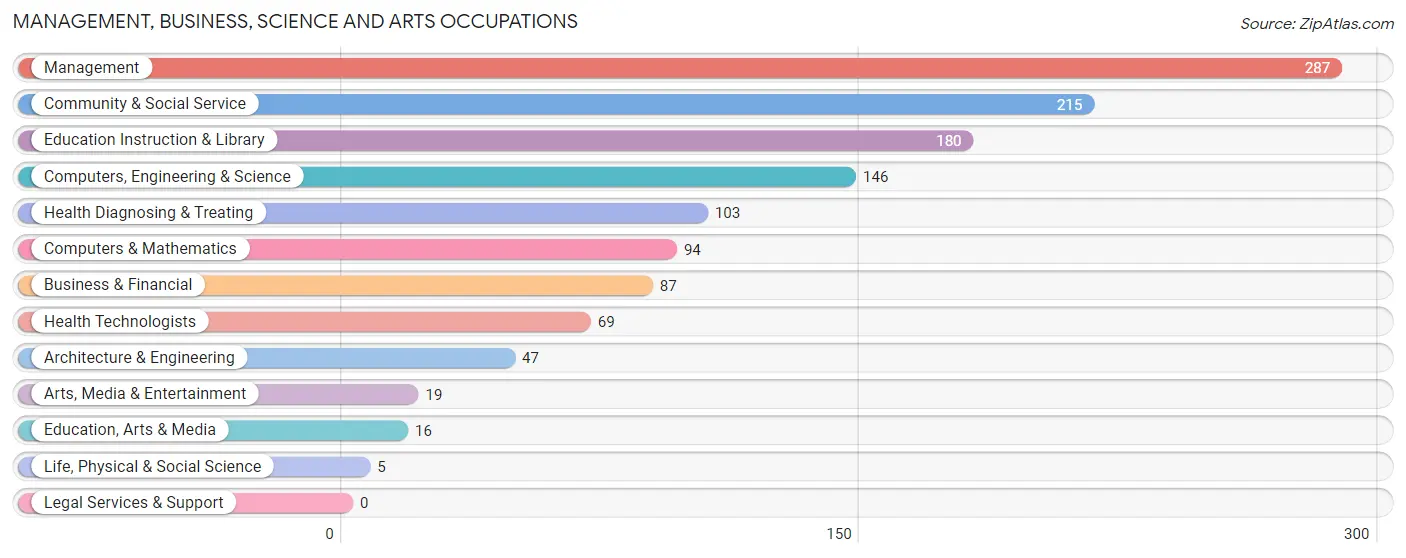
Management, Business, Science and Arts Occupations
The most common Management, Business, Science and Arts occupations in Jefferson are Management (287 | 19.9%), Community & Social Service (215 | 14.9%), Education Instruction & Library (180 | 12.5%), Computers, Engineering & Science (146 | 10.1%), and Health Diagnosing & Treating (103 | 7.1%).
Management, Business, Science and Arts Occupations by Sex
Within the Management, Business, Science and Arts occupations in Jefferson, the most male-oriented occupations are Education, Arts & Media (100.0%), Arts, Media & Entertainment (100.0%), and Computers & Mathematics (91.5%), while the most female-oriented occupations are Life, Physical & Social Science (100.0%), Health Diagnosing & Treating (100.0%), and Health Technologists (100.0%).
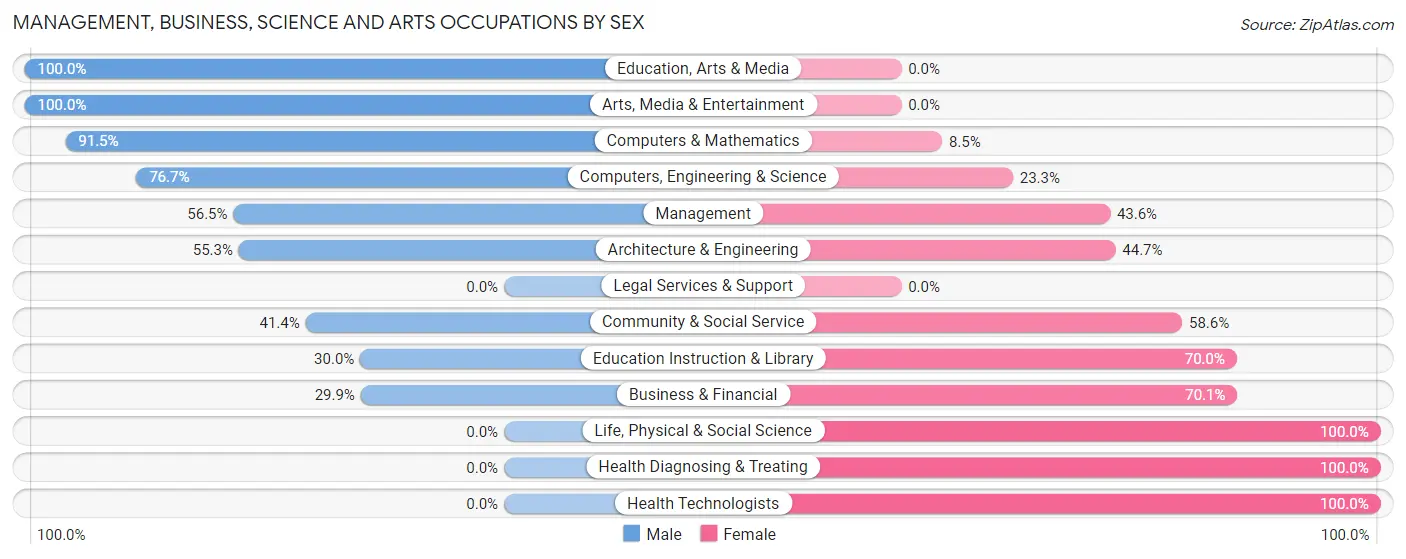
| Occupation | Male | Female |
| Management | 162 (56.5%) | 125 (43.5%) |
| Business & Financial | 26 (29.9%) | 61 (70.1%) |
| Computers, Engineering & Science | 112 (76.7%) | 34 (23.3%) |
| Computers & Mathematics | 86 (91.5%) | 8 (8.5%) |
| Architecture & Engineering | 26 (55.3%) | 21 (44.7%) |
| Life, Physical & Social Science | 0 (0.0%) | 5 (100.0%) |
| Community & Social Service | 89 (41.4%) | 126 (58.6%) |
| Education, Arts & Media | 16 (100.0%) | 0 (0.0%) |
| Legal Services & Support | 0 (0.0%) | 0 (0.0%) |
| Education Instruction & Library | 54 (30.0%) | 126 (70.0%) |
| Arts, Media & Entertainment | 19 (100.0%) | 0 (0.0%) |
| Health Diagnosing & Treating | 0 (0.0%) | 103 (100.0%) |
| Health Technologists | 0 (0.0%) | 69 (100.0%) |
| Total (Category) | 389 (46.4%) | 449 (53.6%) |
| Total (Overall) | 737 (51.0%) | 708 (49.0%) |
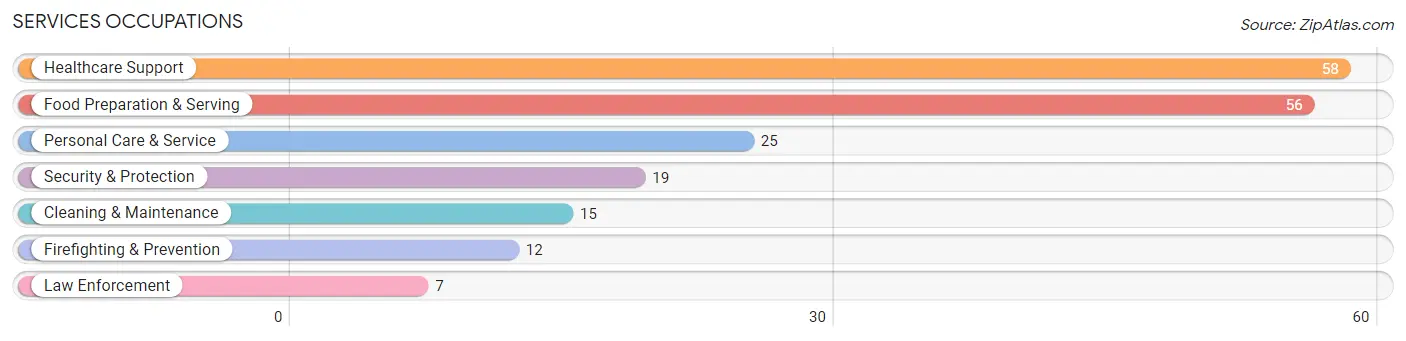
Services Occupations
The most common Services occupations in Jefferson are Healthcare Support (58 | 4.0%), Food Preparation & Serving (56 | 3.9%), Personal Care & Service (25 | 1.7%), Security & Protection (19 | 1.3%), and Cleaning & Maintenance (15 | 1.0%).
Services Occupations by Sex
Within the Services occupations in Jefferson, the most male-oriented occupations are Security & Protection (100.0%), Firefighting & Prevention (100.0%), and Law Enforcement (100.0%), while the most female-oriented occupations are Healthcare Support (100.0%), Personal Care & Service (100.0%), and Food Preparation & Serving (71.4%).
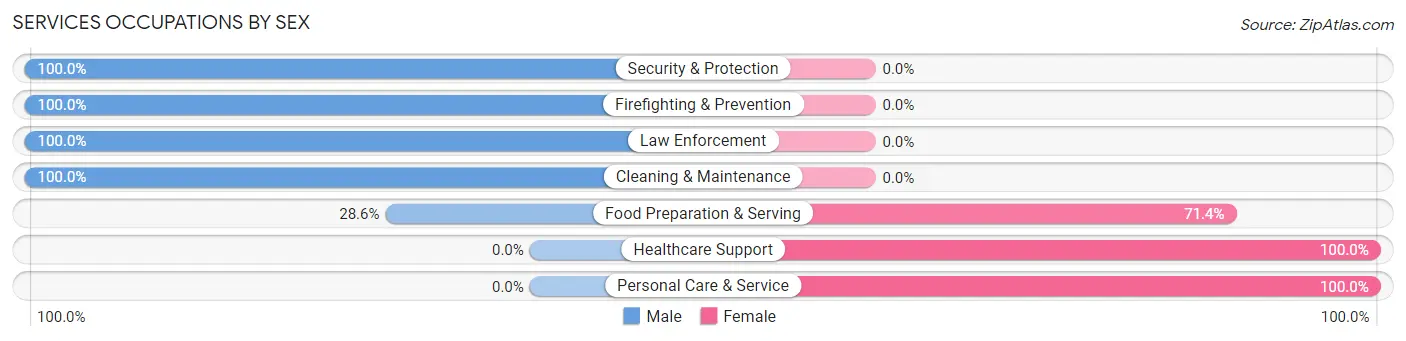
| Occupation | Male | Female |
| Healthcare Support | 0 (0.0%) | 58 (100.0%) |
| Security & Protection | 19 (100.0%) | 0 (0.0%) |
| Firefighting & Prevention | 12 (100.0%) | 0 (0.0%) |
| Law Enforcement | 7 (100.0%) | 0 (0.0%) |
| Food Preparation & Serving | 16 (28.6%) | 40 (71.4%) |
| Cleaning & Maintenance | 15 (100.0%) | 0 (0.0%) |
| Personal Care & Service | 0 (0.0%) | 25 (100.0%) |
| Total (Category) | 50 (28.9%) | 123 (71.1%) |
| Total (Overall) | 737 (51.0%) | 708 (49.0%) |
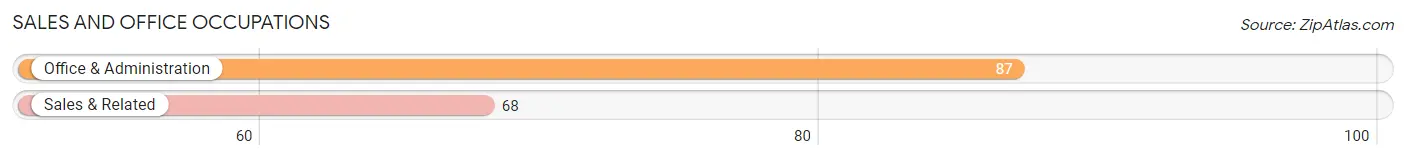
Sales and Office Occupations
The most common Sales and Office occupations in Jefferson are Office & Administration (87 | 6.0%), and Sales & Related (68 | 4.7%).
Sales and Office Occupations by Sex
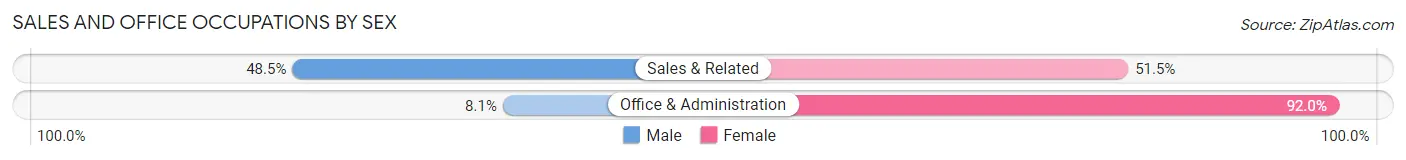
| Occupation | Male | Female |
| Sales & Related | 33 (48.5%) | 35 (51.5%) |
| Office & Administration | 7 (8.1%) | 80 (91.9%) |
| Total (Category) | 40 (25.8%) | 115 (74.2%) |
| Total (Overall) | 737 (51.0%) | 708 (49.0%) |
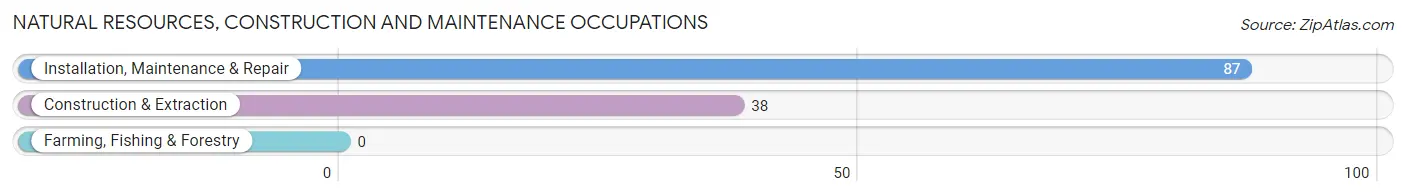
Natural Resources, Construction and Maintenance Occupations
The most common Natural Resources, Construction and Maintenance occupations in Jefferson are Installation, Maintenance & Repair (87 | 6.0%), and Construction & Extraction (38 | 2.6%).
Natural Resources, Construction and Maintenance Occupations by Sex
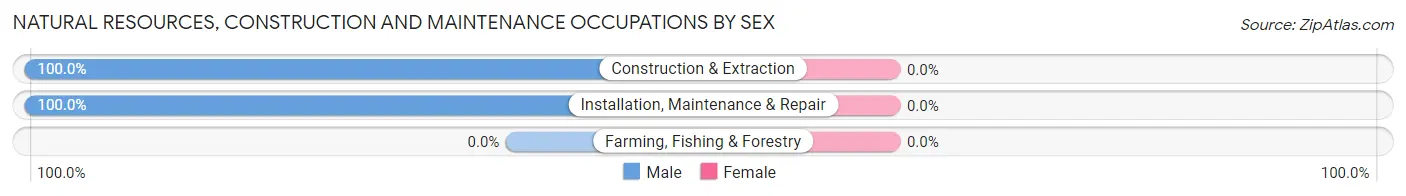
| Occupation | Male | Female |
| Farming, Fishing & Forestry | 0 (0.0%) | 0 (0.0%) |
| Construction & Extraction | 38 (100.0%) | 0 (0.0%) |
| Installation, Maintenance & Repair | 87 (100.0%) | 0 (0.0%) |
| Total (Category) | 125 (100.0%) | 0 (0.0%) |
| Total (Overall) | 737 (51.0%) | 708 (49.0%) |
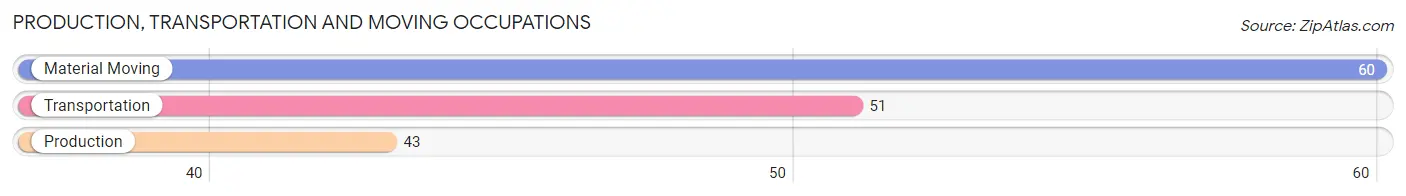
Production, Transportation and Moving Occupations
The most common Production, Transportation and Moving occupations in Jefferson are Material Moving (60 | 4.2%), Transportation (51 | 3.5%), and Production (43 | 3.0%).
Production, Transportation and Moving Occupations by Sex
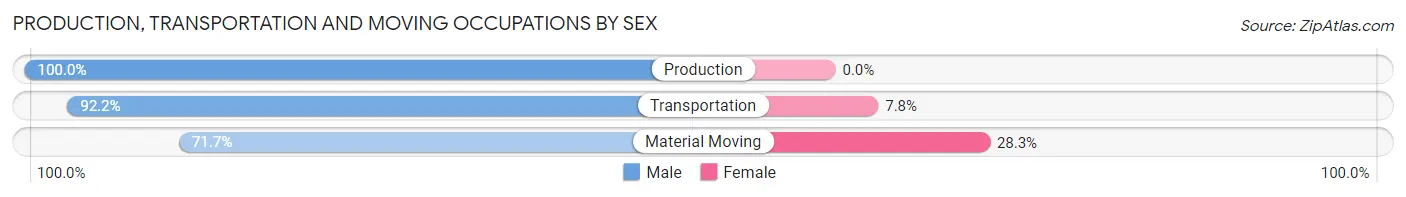
| Occupation | Male | Female |
| Production | 43 (100.0%) | 0 (0.0%) |
| Transportation | 47 (92.2%) | 4 (7.8%) |
| Material Moving | 43 (71.7%) | 17 (28.3%) |
| Total (Category) | 133 (86.4%) | 21 (13.6%) |
| Total (Overall) | 737 (51.0%) | 708 (49.0%) |
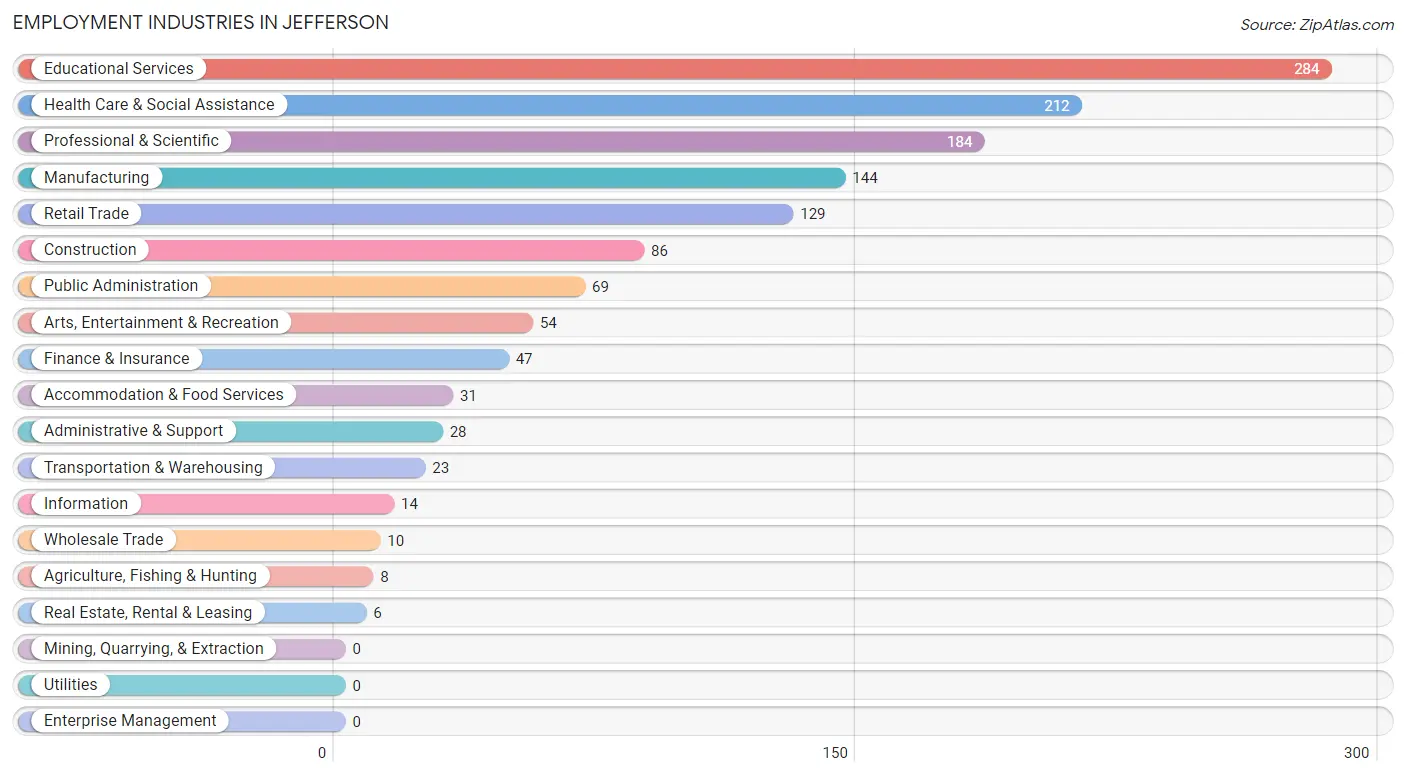
Employment Industries by Sex in Jefferson
Employment Industries in Jefferson
The major employment industries in Jefferson include Educational Services (284 | 19.7%), Health Care & Social Assistance (212 | 14.7%), Professional & Scientific (184 | 12.7%), Manufacturing (144 | 10.0%), and Retail Trade (129 | 8.9%).
Employment Industries by Sex in Jefferson
The Jefferson industries that see more men than women are Agriculture, Fishing & Hunting (100.0%), Construction (100.0%), and Wholesale Trade (100.0%), whereas the industries that tend to have a higher number of women are Transportation & Warehousing (100.0%), Health Care & Social Assistance (100.0%), and Arts, Entertainment & Recreation (100.0%).
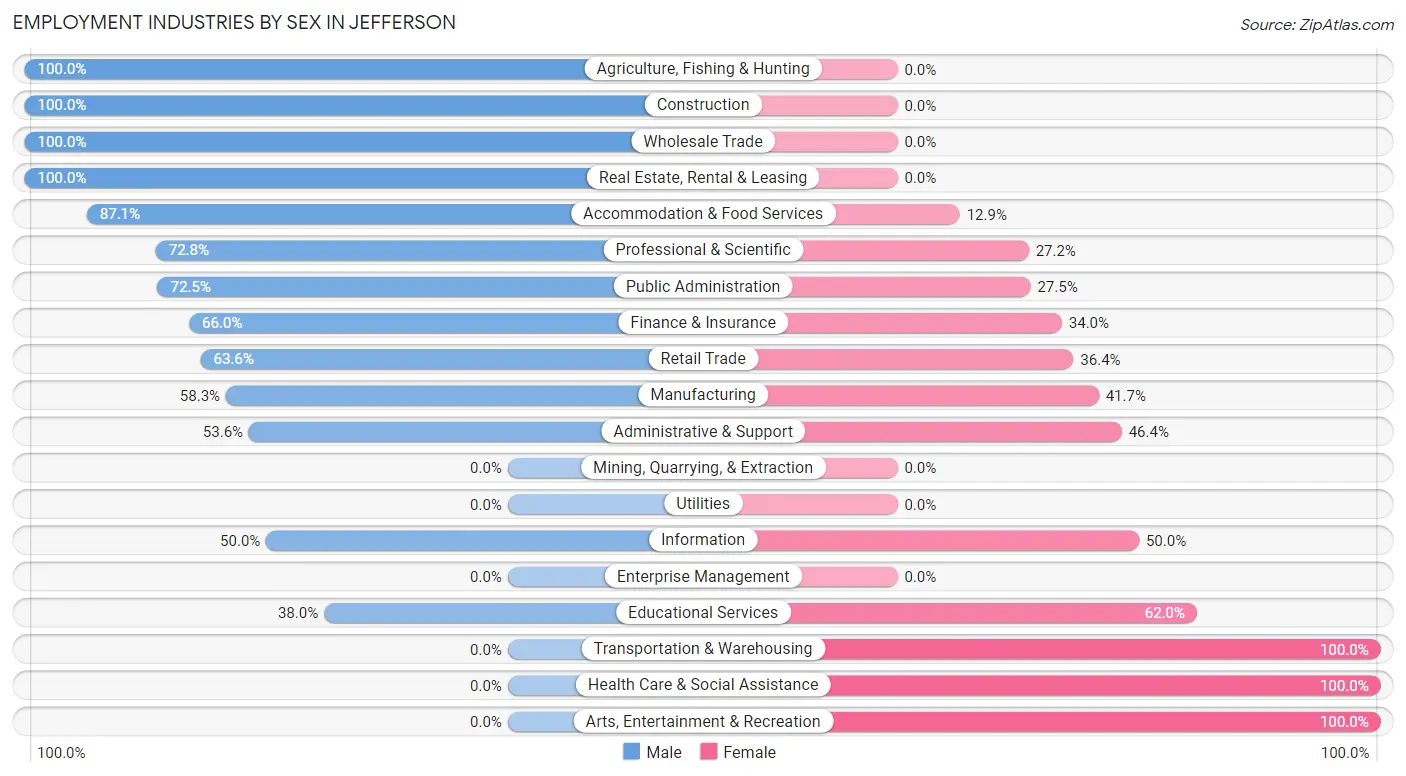
| Industry | Male | Female |
| Agriculture, Fishing & Hunting | 8 (100.0%) | 0 (0.0%) |
| Mining, Quarrying, & Extraction | 0 (0.0%) | 0 (0.0%) |
| Construction | 86 (100.0%) | 0 (0.0%) |
| Manufacturing | 84 (58.3%) | 60 (41.7%) |
| Wholesale Trade | 10 (100.0%) | 0 (0.0%) |
| Retail Trade | 82 (63.6%) | 47 (36.4%) |
| Transportation & Warehousing | 0 (0.0%) | 23 (100.0%) |
| Utilities | 0 (0.0%) | 0 (0.0%) |
| Information | 7 (50.0%) | 7 (50.0%) |
| Finance & Insurance | 31 (66.0%) | 16 (34.0%) |
| Real Estate, Rental & Leasing | 6 (100.0%) | 0 (0.0%) |
| Professional & Scientific | 134 (72.8%) | 50 (27.2%) |
| Enterprise Management | 0 (0.0%) | 0 (0.0%) |
| Administrative & Support | 15 (53.6%) | 13 (46.4%) |
| Educational Services | 108 (38.0%) | 176 (62.0%) |
| Health Care & Social Assistance | 0 (0.0%) | 212 (100.0%) |
| Arts, Entertainment & Recreation | 0 (0.0%) | 54 (100.0%) |
| Accommodation & Food Services | 27 (87.1%) | 4 (12.9%) |
| Public Administration | 50 (72.5%) | 19 (27.5%) |
| Total | 737 (51.0%) | 708 (49.0%) |
Education in Jefferson
School Enrollment in Jefferson
The most common levels of schooling among the 675 students in Jefferson are college / undergraduate (196 | 29.0%), elementary school (157 | 23.3%), and high school (135 | 20.0%).
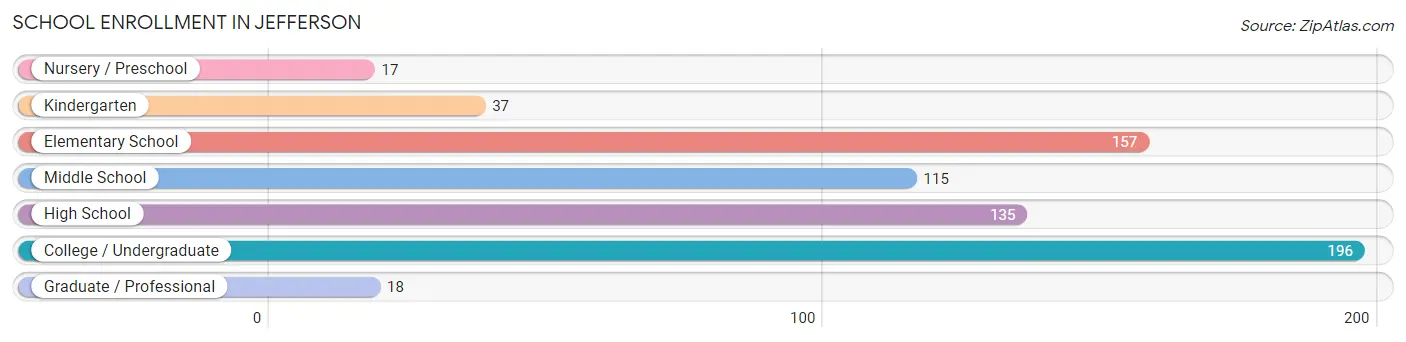
| School Level | # Students | % Students |
| Nursery / Preschool | 17 | 2.5% |
| Kindergarten | 37 | 5.5% |
| Elementary School | 157 | 23.3% |
| Middle School | 115 | 17.0% |
| High School | 135 | 20.0% |
| College / Undergraduate | 196 | 29.0% |
| Graduate / Professional | 18 | 2.7% |
| Total | 675 | 100.0% |
School Enrollment by Age by Funding Source in Jefferson
Out of a total of 675 students who are enrolled in schools in Jefferson, 167 (24.7%) attend a private institution, while the remaining 508 (75.3%) are enrolled in public schools. The age group of 20 to 24 year olds has the highest likelihood of being enrolled in private schools, with 62 (43.7% in the age bracket) enrolled. Conversely, the age group of 5 to 9 year old has the lowest likelihood of being enrolled in a private school, with 114 (92.7% in the age bracket) attending a public institution.
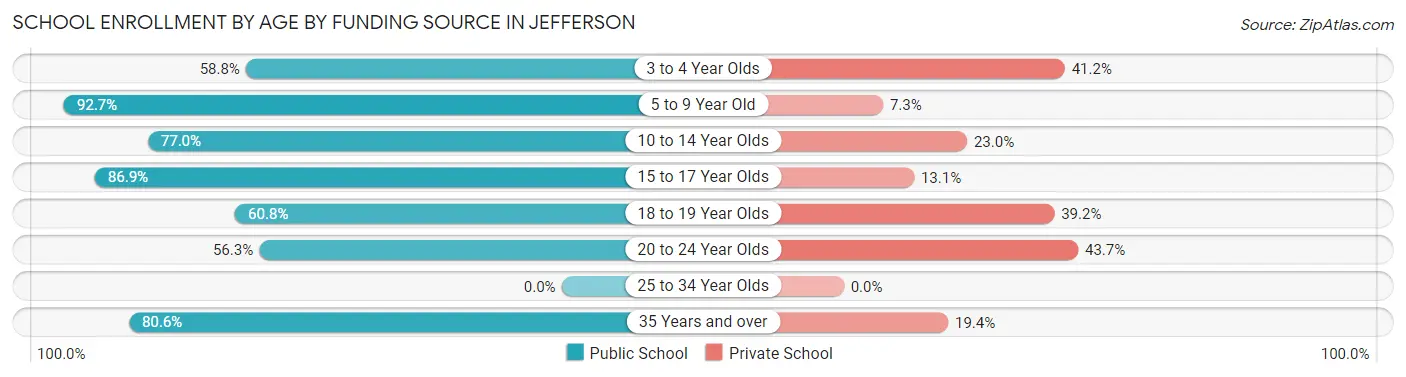
| Age Bracket | Public School | Private School |
| 3 to 4 Year Olds | 10 (58.8%) | 7 (41.2%) |
| 5 to 9 Year Old | 114 (92.7%) | 9 (7.3%) |
| 10 to 14 Year Olds | 171 (77.0%) | 51 (23.0%) |
| 15 to 17 Year Olds | 73 (86.9%) | 11 (13.1%) |
| 18 to 19 Year Olds | 31 (60.8%) | 20 (39.2%) |
| 20 to 24 Year Olds | 80 (56.3%) | 62 (43.7%) |
| 25 to 34 Year Olds | 0 (0.0%) | 0 (0.0%) |
| 35 Years and over | 29 (80.6%) | 7 (19.4%) |
| Total | 508 (75.3%) | 167 (24.7%) |
Educational Attainment by Field of Study in Jefferson
Education (139 | 17.5%), business (137 | 17.2%), science & technology (92 | 11.6%), psychology (89 | 11.2%), and computers & mathematics (75 | 9.5%) are the most common fields of study among 794 individuals in Jefferson who have obtained a bachelor's degree or higher.
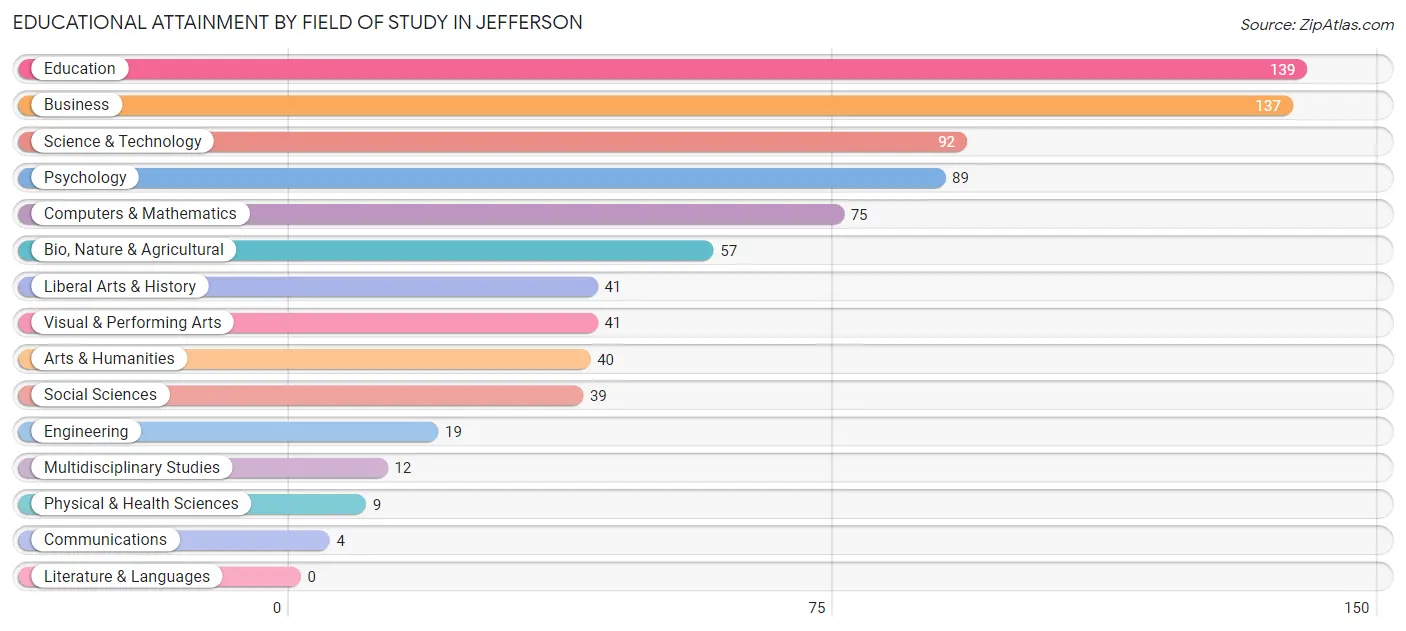
| Field of Study | # Graduates | % Graduates |
| Computers & Mathematics | 75 | 9.5% |
| Bio, Nature & Agricultural | 57 | 7.2% |
| Physical & Health Sciences | 9 | 1.1% |
| Psychology | 89 | 11.2% |
| Social Sciences | 39 | 4.9% |
| Engineering | 19 | 2.4% |
| Multidisciplinary Studies | 12 | 1.5% |
| Science & Technology | 92 | 11.6% |
| Business | 137 | 17.2% |
| Education | 139 | 17.5% |
| Literature & Languages | 0 | 0.0% |
| Liberal Arts & History | 41 | 5.2% |
| Visual & Performing Arts | 41 | 5.2% |
| Communications | 4 | 0.5% |
| Arts & Humanities | 40 | 5.0% |
| Total | 794 | 100.0% |
Transportation & Commute in Jefferson
Vehicle Availability by Sex in Jefferson
The most prevalent vehicle ownership categories in Jefferson are males with 2 vehicles (275, accounting for 38.0%) and females with 2 vehicles (312, making up 40.9%).
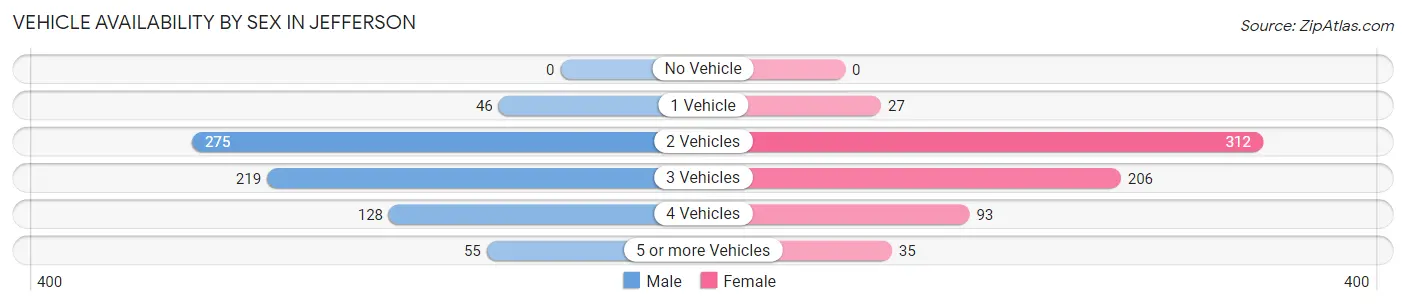
| Vehicles Available | Male | Female |
| No Vehicle | 0 (0.0%) | 0 (0.0%) |
| 1 Vehicle | 46 (6.4%) | 27 (4.0%) |
| 2 Vehicles | 275 (38.0%) | 312 (46.4%) |
| 3 Vehicles | 219 (30.3%) | 206 (30.6%) |
| 4 Vehicles | 128 (17.7%) | 93 (13.8%) |
| 5 or more Vehicles | 55 (7.6%) | 35 (5.2%) |
| Total | 723 (100.0%) | 673 (100.0%) |
Commute Time in Jefferson
The most frequently occuring commute durations in Jefferson are 15 to 19 minutes (322 commuters, 28.7%), 10 to 14 minutes (177 commuters, 15.8%), and 20 to 24 minutes (122 commuters, 10.9%).
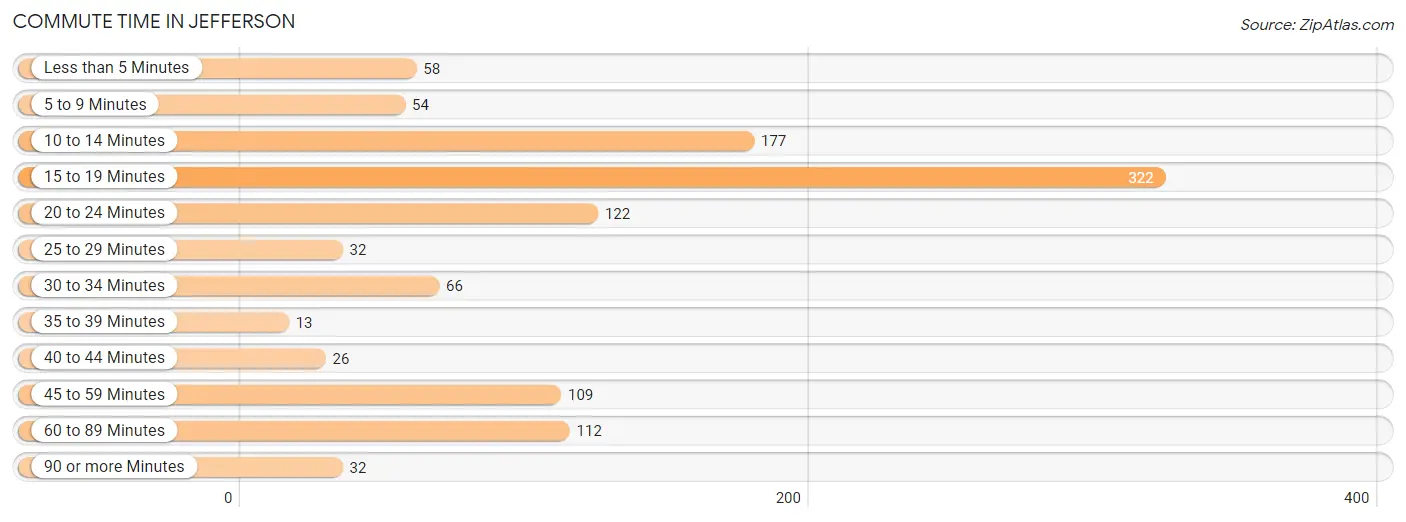
| Commute Time | # Commuters | % Commuters |
| Less than 5 Minutes | 58 | 5.2% |
| 5 to 9 Minutes | 54 | 4.8% |
| 10 to 14 Minutes | 177 | 15.8% |
| 15 to 19 Minutes | 322 | 28.7% |
| 20 to 24 Minutes | 122 | 10.9% |
| 25 to 29 Minutes | 32 | 2.9% |
| 30 to 34 Minutes | 66 | 5.9% |
| 35 to 39 Minutes | 13 | 1.2% |
| 40 to 44 Minutes | 26 | 2.3% |
| 45 to 59 Minutes | 109 | 9.7% |
| 60 to 89 Minutes | 112 | 10.0% |
| 90 or more Minutes | 32 | 2.9% |
Commute Time by Sex in Jefferson
The most common commute times in Jefferson are 15 to 19 minutes (170 commuters, 27.2%) for males and 15 to 19 minutes (152 commuters, 30.5%) for females.
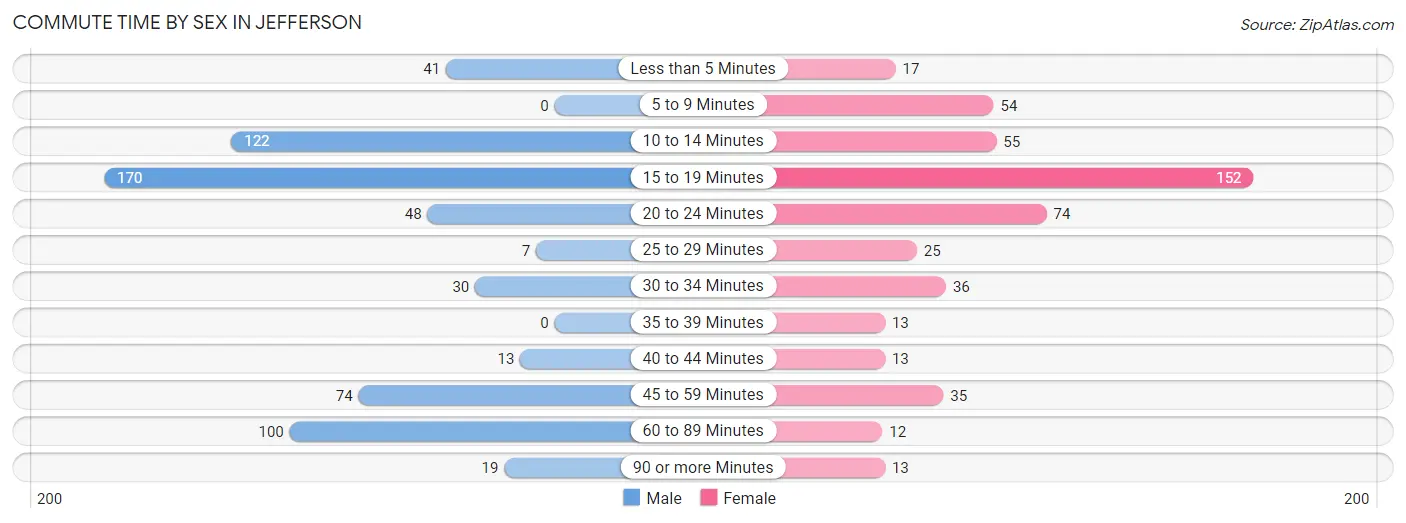
| Commute Time | Male | Female |
| Less than 5 Minutes | 41 (6.6%) | 17 (3.4%) |
| 5 to 9 Minutes | 0 (0.0%) | 54 (10.8%) |
| 10 to 14 Minutes | 122 (19.6%) | 55 (11.0%) |
| 15 to 19 Minutes | 170 (27.2%) | 152 (30.5%) |
| 20 to 24 Minutes | 48 (7.7%) | 74 (14.8%) |
| 25 to 29 Minutes | 7 (1.1%) | 25 (5.0%) |
| 30 to 34 Minutes | 30 (4.8%) | 36 (7.2%) |
| 35 to 39 Minutes | 0 (0.0%) | 13 (2.6%) |
| 40 to 44 Minutes | 13 (2.1%) | 13 (2.6%) |
| 45 to 59 Minutes | 74 (11.9%) | 35 (7.0%) |
| 60 to 89 Minutes | 100 (16.0%) | 12 (2.4%) |
| 90 or more Minutes | 19 (3.0%) | 13 (2.6%) |
Time of Departure to Work by Sex in Jefferson
The most frequent times of departure to work in Jefferson are 6:30 AM to 6:59 AM (136, 21.8%) for males and 6:30 AM to 6:59 AM (108, 21.6%) for females.
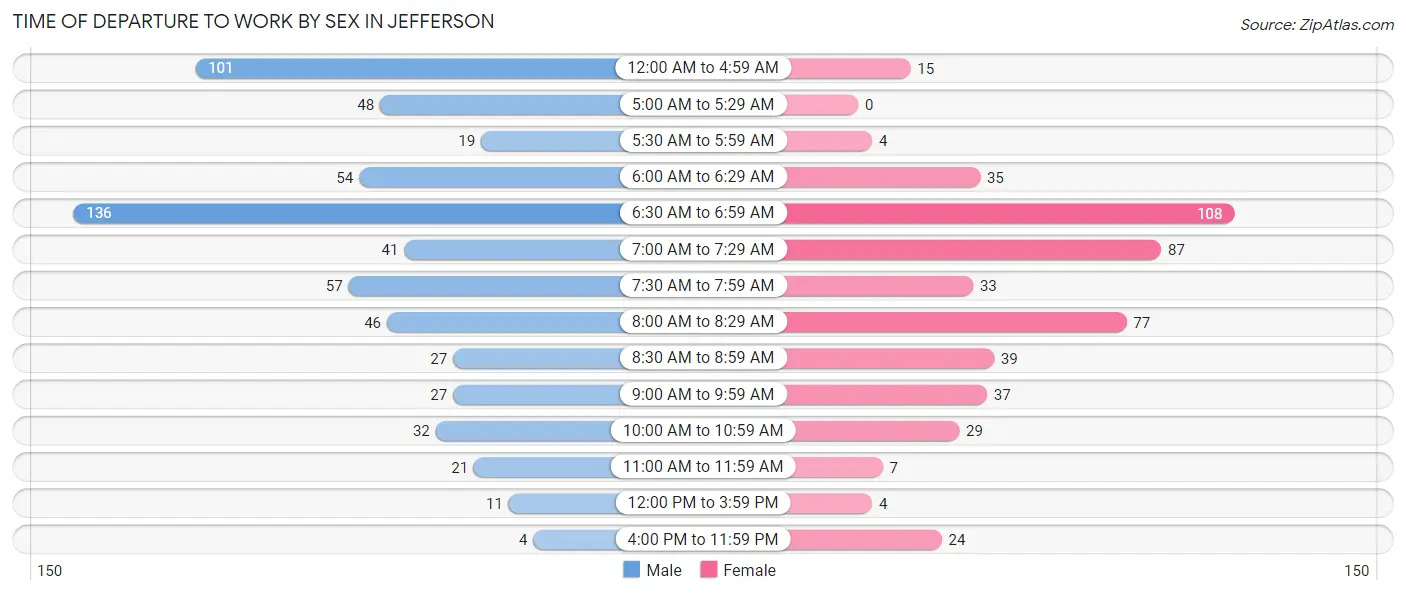
| Time of Departure | Male | Female |
| 12:00 AM to 4:59 AM | 101 (16.2%) | 15 (3.0%) |
| 5:00 AM to 5:29 AM | 48 (7.7%) | 0 (0.0%) |
| 5:30 AM to 5:59 AM | 19 (3.0%) | 4 (0.8%) |
| 6:00 AM to 6:29 AM | 54 (8.6%) | 35 (7.0%) |
| 6:30 AM to 6:59 AM | 136 (21.8%) | 108 (21.6%) |
| 7:00 AM to 7:29 AM | 41 (6.6%) | 87 (17.4%) |
| 7:30 AM to 7:59 AM | 57 (9.1%) | 33 (6.6%) |
| 8:00 AM to 8:29 AM | 46 (7.4%) | 77 (15.4%) |
| 8:30 AM to 8:59 AM | 27 (4.3%) | 39 (7.8%) |
| 9:00 AM to 9:59 AM | 27 (4.3%) | 37 (7.4%) |
| 10:00 AM to 10:59 AM | 32 (5.1%) | 29 (5.8%) |
| 11:00 AM to 11:59 AM | 21 (3.4%) | 7 (1.4%) |
| 12:00 PM to 3:59 PM | 11 (1.8%) | 4 (0.8%) |
| 4:00 PM to 11:59 PM | 4 (0.6%) | 24 (4.8%) |
| Total | 624 (100.0%) | 499 (100.0%) |
Housing Occupancy in Jefferson
Occupancy by Ownership in Jefferson
Of the total 956 dwellings in Jefferson, owner-occupied units account for 840 (87.9%), while renter-occupied units make up 116 (12.1%).
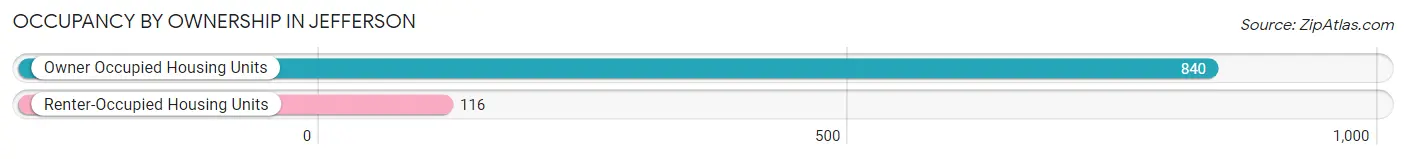
| Occupancy | # Housing Units | % Housing Units |
| Owner Occupied Housing Units | 840 | 87.9% |
| Renter-Occupied Housing Units | 116 | 12.1% |
| Total Occupied Housing Units | 956 | 100.0% |
Occupancy by Household Size in Jefferson
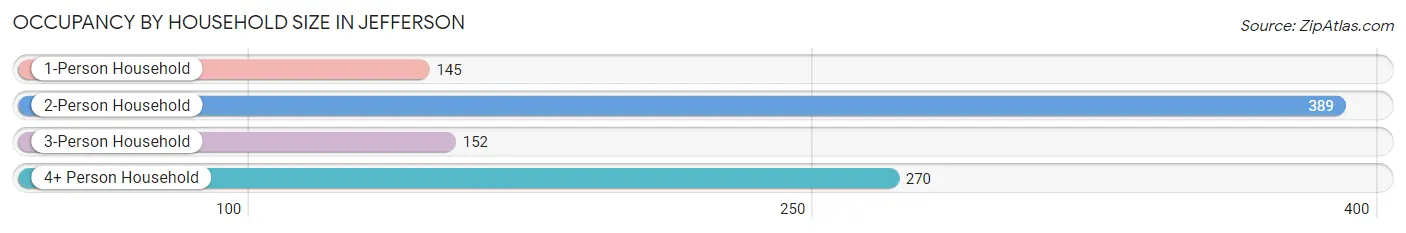
| Household Size | # Housing Units | % Housing Units |
| 1-Person Household | 145 | 15.2% |
| 2-Person Household | 389 | 40.7% |
| 3-Person Household | 152 | 15.9% |
| 4+ Person Household | 270 | 28.2% |
| Total Housing Units | 956 | 100.0% |
Occupancy by Ownership by Household Size in Jefferson
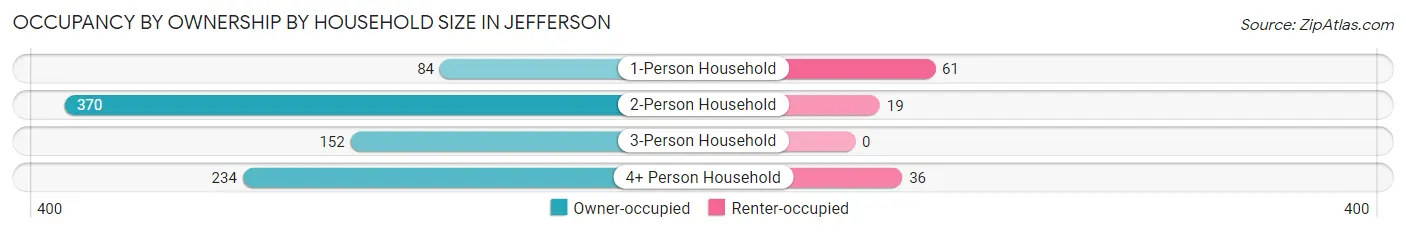
| Household Size | Owner-occupied | Renter-occupied |
| 1-Person Household | 84 (57.9%) | 61 (42.1%) |
| 2-Person Household | 370 (95.1%) | 19 (4.9%) |
| 3-Person Household | 152 (100.0%) | 0 (0.0%) |
| 4+ Person Household | 234 (86.7%) | 36 (13.3%) |
| Total Housing Units | 840 (87.9%) | 116 (12.1%) |
Occupancy by Educational Attainment in Jefferson
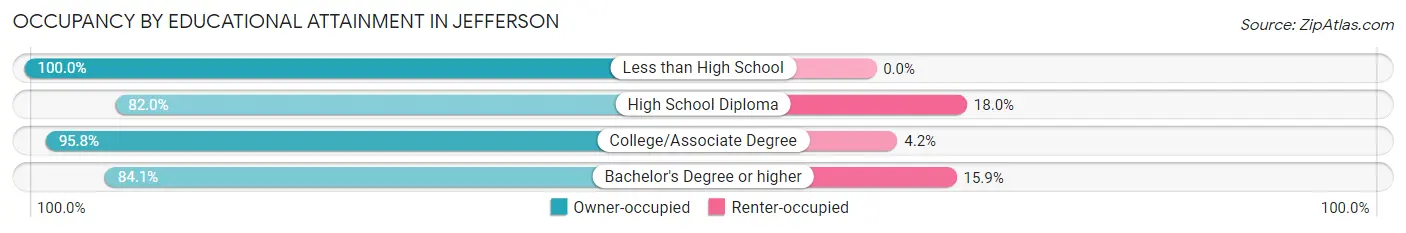
| Household Size | Owner-occupied | Renter-occupied |
| Less than High School | 6 (100.0%) | 0 (0.0%) |
| High School Diploma | 155 (82.0%) | 34 (18.0%) |
| College/Associate Degree | 320 (95.8%) | 14 (4.2%) |
| Bachelor's Degree or higher | 359 (84.1%) | 68 (15.9%) |
Occupancy by Age of Householder in Jefferson
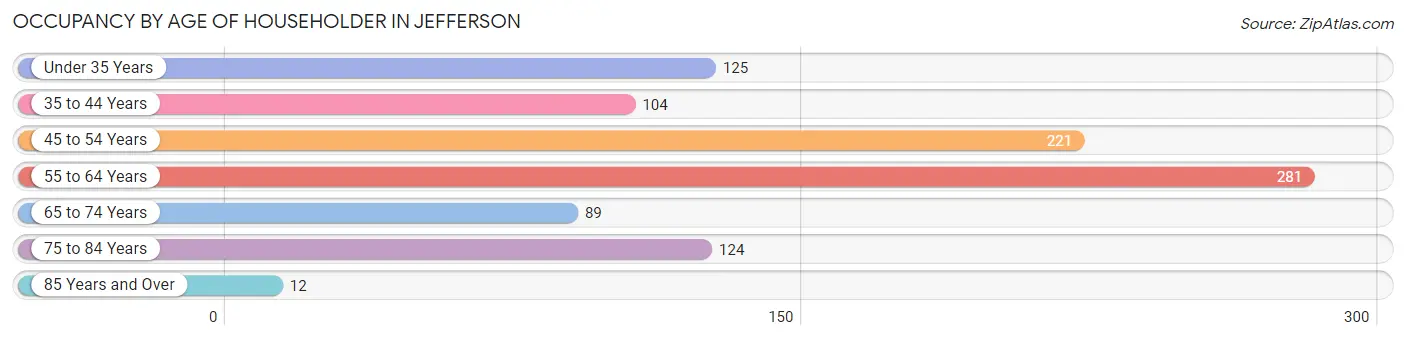
| Age Bracket | # Households | % Households |
| Under 35 Years | 125 | 13.1% |
| 35 to 44 Years | 104 | 10.9% |
| 45 to 54 Years | 221 | 23.1% |
| 55 to 64 Years | 281 | 29.4% |
| 65 to 74 Years | 89 | 9.3% |
| 75 to 84 Years | 124 | 13.0% |
| 85 Years and Over | 12 | 1.3% |
| Total | 956 | 100.0% |
Housing Finances in Jefferson
Median Income by Occupancy in Jefferson
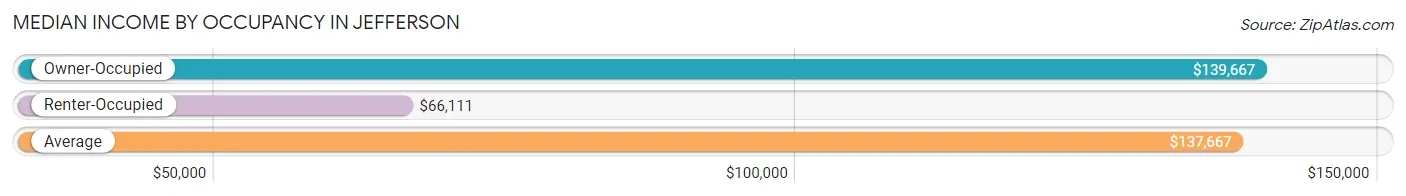
| Occupancy Type | # Households | Median Income |
| Owner-Occupied | 840 (87.9%) | $139,667 |
| Renter-Occupied | 116 (12.1%) | $66,111 |
| Average | 956 (100.0%) | $137,667 |
Occupancy by Householder Income Bracket in Jefferson
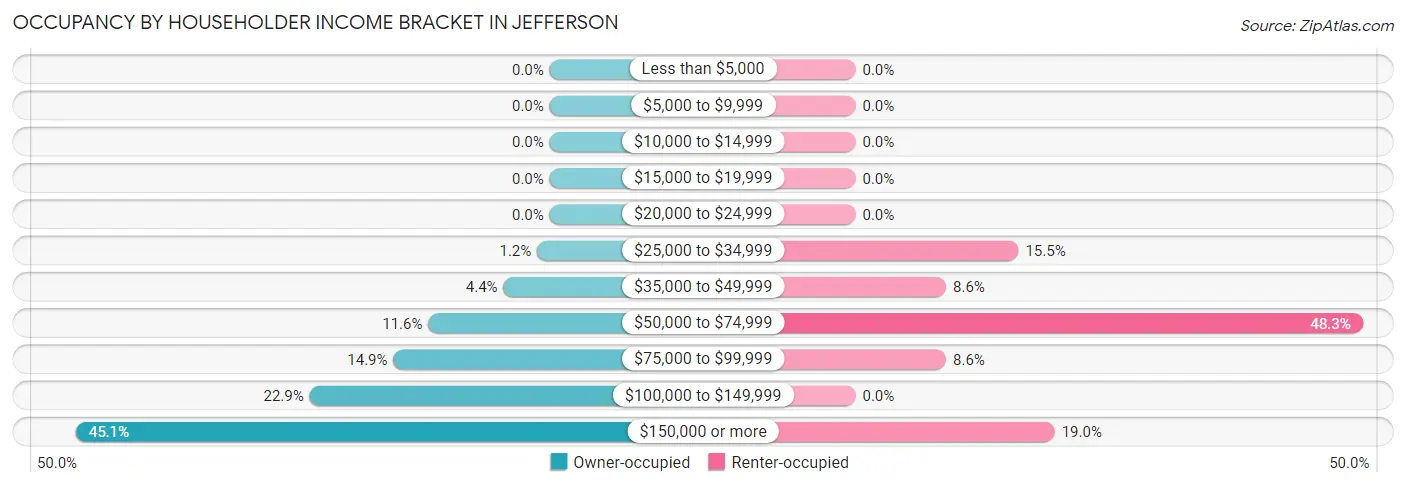
| Income Bracket | Owner-occupied | Renter-occupied |
| Less than $5,000 | 0 (0.0%) | 0 (0.0%) |
| $5,000 to $9,999 | 0 (0.0%) | 0 (0.0%) |
| $10,000 to $14,999 | 0 (0.0%) | 0 (0.0%) |
| $15,000 to $19,999 | 0 (0.0%) | 0 (0.0%) |
| $20,000 to $24,999 | 0 (0.0%) | 0 (0.0%) |
| $25,000 to $34,999 | 10 (1.2%) | 18 (15.5%) |
| $35,000 to $49,999 | 37 (4.4%) | 10 (8.6%) |
| $50,000 to $74,999 | 97 (11.6%) | 56 (48.3%) |
| $75,000 to $99,999 | 125 (14.9%) | 10 (8.6%) |
| $100,000 to $149,999 | 192 (22.9%) | 0 (0.0%) |
| $150,000 or more | 379 (45.1%) | 22 (19.0%) |
| Total | 840 (100.0%) | 116 (100.0%) |
Monthly Housing Cost Tiers in Jefferson
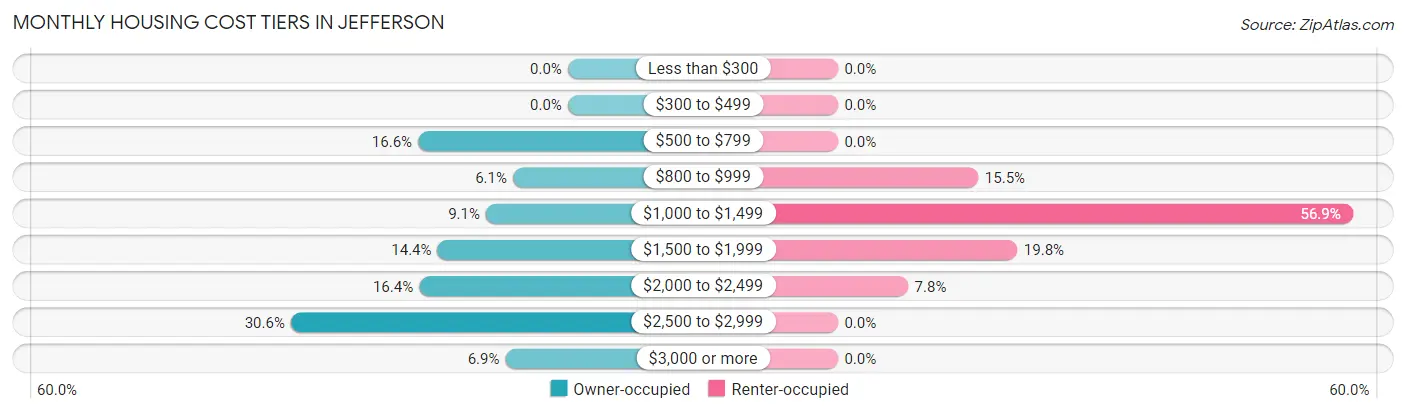
| Monthly Cost | Owner-occupied | Renter-occupied |
| Less than $300 | 0 (0.0%) | 0 (0.0%) |
| $300 to $499 | 0 (0.0%) | 0 (0.0%) |
| $500 to $799 | 139 (16.6%) | 0 (0.0%) |
| $800 to $999 | 51 (6.1%) | 18 (15.5%) |
| $1,000 to $1,499 | 76 (9.0%) | 66 (56.9%) |
| $1,500 to $1,999 | 121 (14.4%) | 23 (19.8%) |
| $2,000 to $2,499 | 138 (16.4%) | 9 (7.8%) |
| $2,500 to $2,999 | 257 (30.6%) | 0 (0.0%) |
| $3,000 or more | 58 (6.9%) | 0 (0.0%) |
| Total | 840 (100.0%) | 116 (100.0%) |
Physical Housing Characteristics in Jefferson
Housing Structures in Jefferson
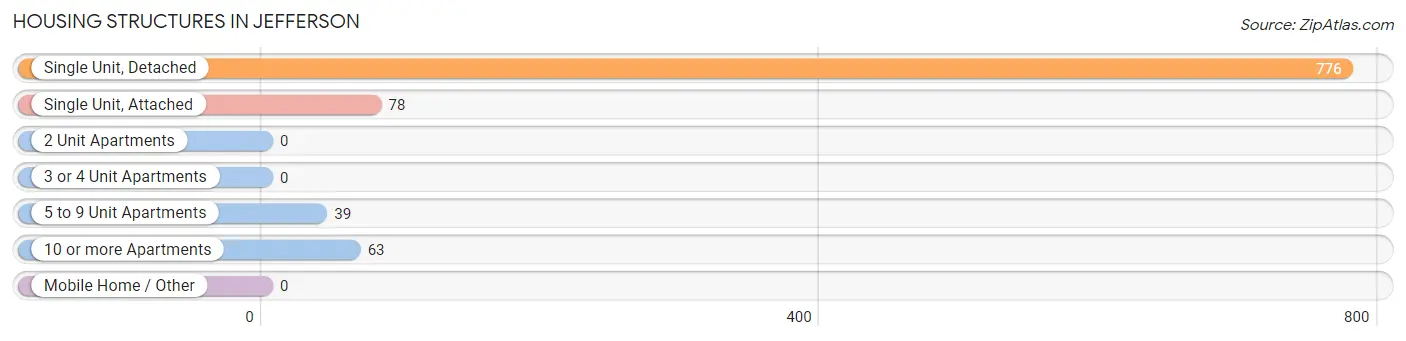
| Structure Type | # Housing Units | % Housing Units |
| Single Unit, Detached | 776 | 81.2% |
| Single Unit, Attached | 78 | 8.2% |
| 2 Unit Apartments | 0 | 0.0% |
| 3 or 4 Unit Apartments | 0 | 0.0% |
| 5 to 9 Unit Apartments | 39 | 4.1% |
| 10 or more Apartments | 63 | 6.6% |
| Mobile Home / Other | 0 | 0.0% |
| Total | 956 | 100.0% |
Housing Structures by Occupancy in Jefferson
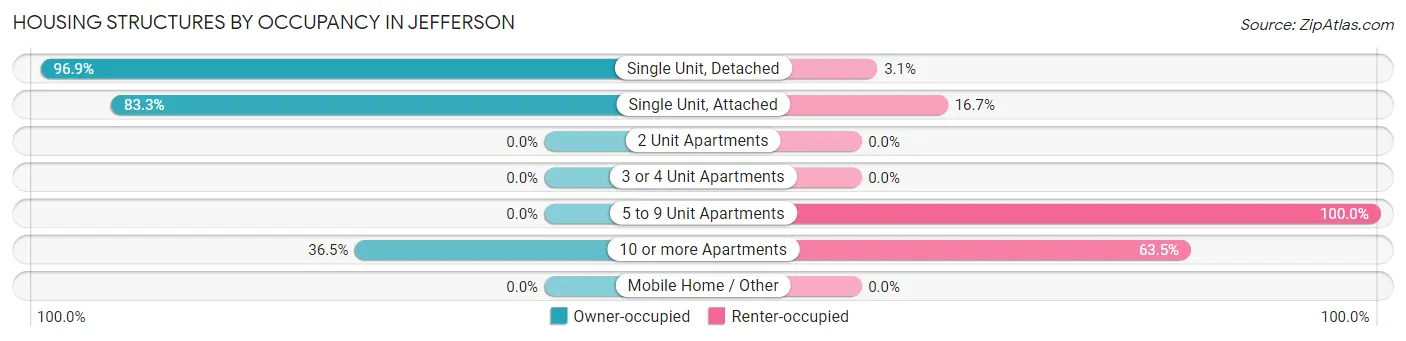
| Structure Type | Owner-occupied | Renter-occupied |
| Single Unit, Detached | 752 (96.9%) | 24 (3.1%) |
| Single Unit, Attached | 65 (83.3%) | 13 (16.7%) |
| 2 Unit Apartments | 0 (0.0%) | 0 (0.0%) |
| 3 or 4 Unit Apartments | 0 (0.0%) | 0 (0.0%) |
| 5 to 9 Unit Apartments | 0 (0.0%) | 39 (100.0%) |
| 10 or more Apartments | 23 (36.5%) | 40 (63.5%) |
| Mobile Home / Other | 0 (0.0%) | 0 (0.0%) |
| Total | 840 (87.9%) | 116 (12.1%) |
Housing Structures by Number of Rooms in Jefferson
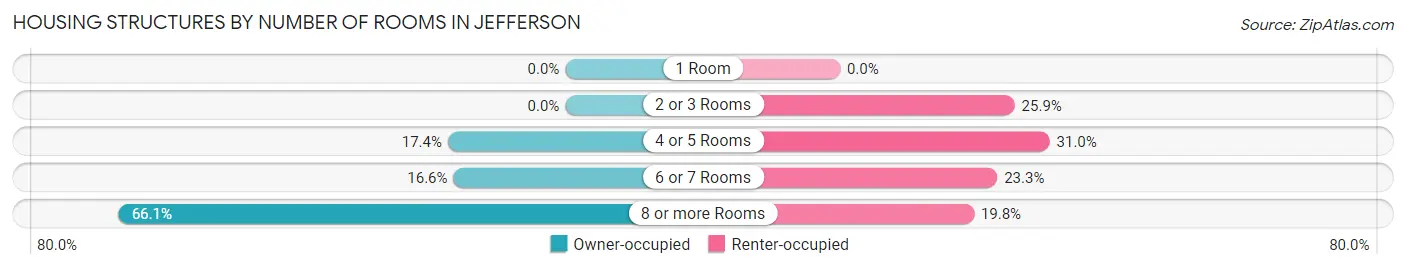
| Number of Rooms | Owner-occupied | Renter-occupied |
| 1 Room | 0 (0.0%) | 0 (0.0%) |
| 2 or 3 Rooms | 0 (0.0%) | 30 (25.9%) |
| 4 or 5 Rooms | 146 (17.4%) | 36 (31.0%) |
| 6 or 7 Rooms | 139 (16.6%) | 27 (23.3%) |
| 8 or more Rooms | 555 (66.1%) | 23 (19.8%) |
| Total | 840 (100.0%) | 116 (100.0%) |
Housing Structure by Heating Type in Jefferson
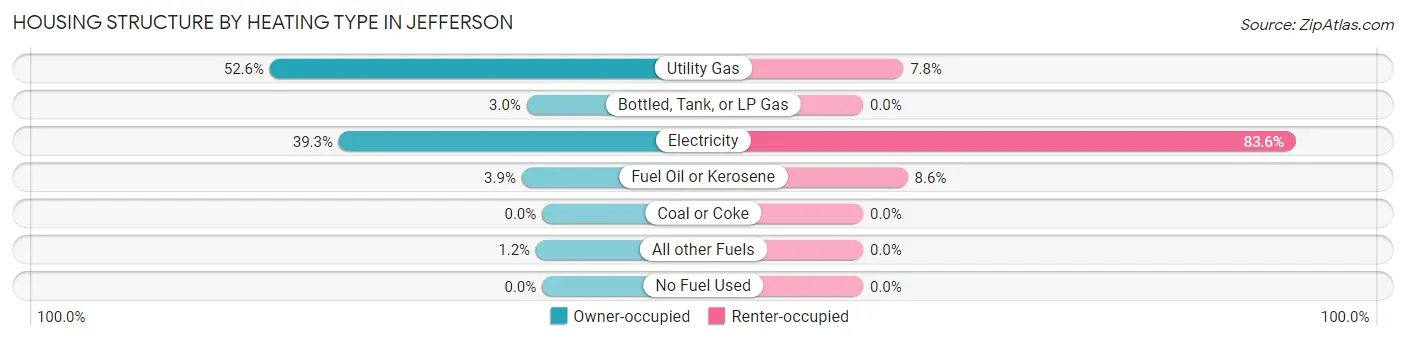
| Heating Type | Owner-occupied | Renter-occupied |
| Utility Gas | 442 (52.6%) | 9 (7.8%) |
| Bottled, Tank, or LP Gas | 25 (3.0%) | 0 (0.0%) |
| Electricity | 330 (39.3%) | 97 (83.6%) |
| Fuel Oil or Kerosene | 33 (3.9%) | 10 (8.6%) |
| Coal or Coke | 0 (0.0%) | 0 (0.0%) |
| All other Fuels | 10 (1.2%) | 0 (0.0%) |
| No Fuel Used | 0 (0.0%) | 0 (0.0%) |
| Total | 840 (100.0%) | 116 (100.0%) |
Household Vehicle Usage in Jefferson
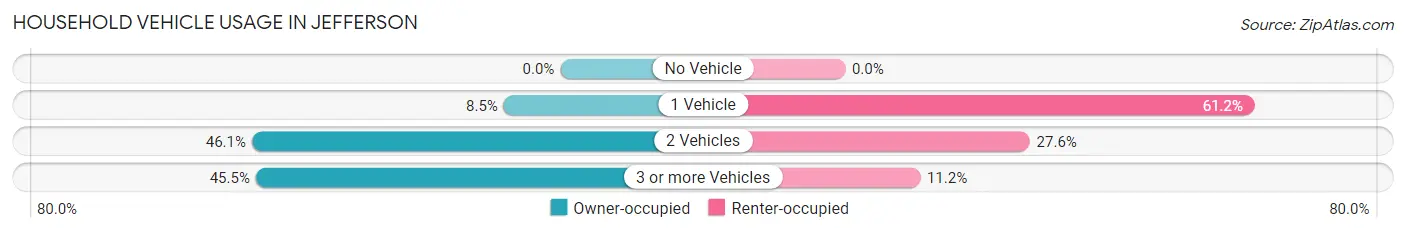
| Vehicles per Household | Owner-occupied | Renter-occupied |
| No Vehicle | 0 (0.0%) | 0 (0.0%) |
| 1 Vehicle | 71 (8.5%) | 71 (61.2%) |
| 2 Vehicles | 387 (46.1%) | 32 (27.6%) |
| 3 or more Vehicles | 382 (45.5%) | 13 (11.2%) |
| Total | 840 (100.0%) | 116 (100.0%) |
Real Estate & Mortgages in Jefferson
Real Estate and Mortgage Overview in Jefferson
| Characteristic | Without Mortgage | With Mortgage |
| Housing Units | 168 | 672 |
| Median Property Value | $423,600 | $447,100 |
| Median Household Income | $100,909 | $331 |
| Monthly Housing Costs | $664 | $58 |
| Real Estate Taxes | $3,908 | $7 |
Property Value by Mortgage Status in Jefferson
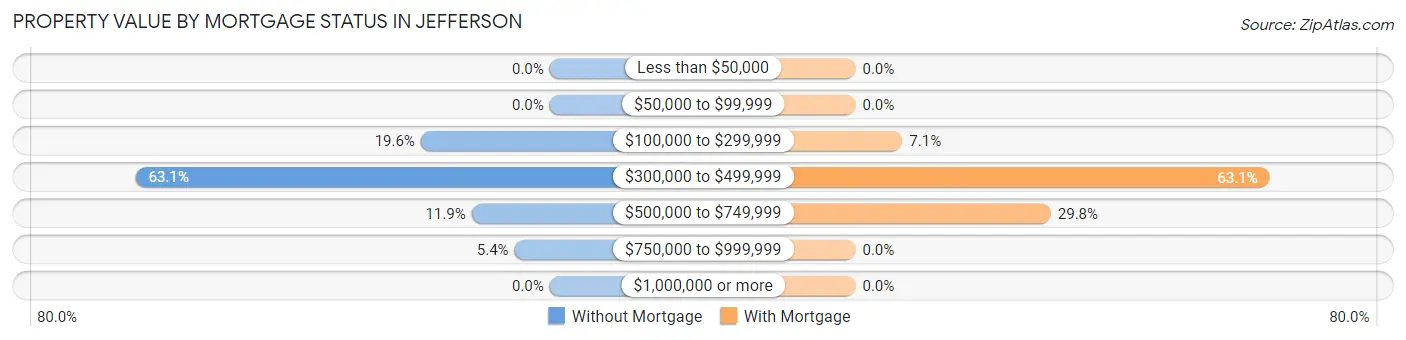
| Property Value | Without Mortgage | With Mortgage |
| Less than $50,000 | 0 (0.0%) | 0 (0.0%) |
| $50,000 to $99,999 | 0 (0.0%) | 0 (0.0%) |
| $100,000 to $299,999 | 33 (19.6%) | 48 (7.1%) |
| $300,000 to $499,999 | 106 (63.1%) | 424 (63.1%) |
| $500,000 to $749,999 | 20 (11.9%) | 200 (29.8%) |
| $750,000 to $999,999 | 9 (5.4%) | 0 (0.0%) |
| $1,000,000 or more | 0 (0.0%) | 0 (0.0%) |
| Total | 168 (100.0%) | 672 (100.0%) |
Household Income by Mortgage Status in Jefferson
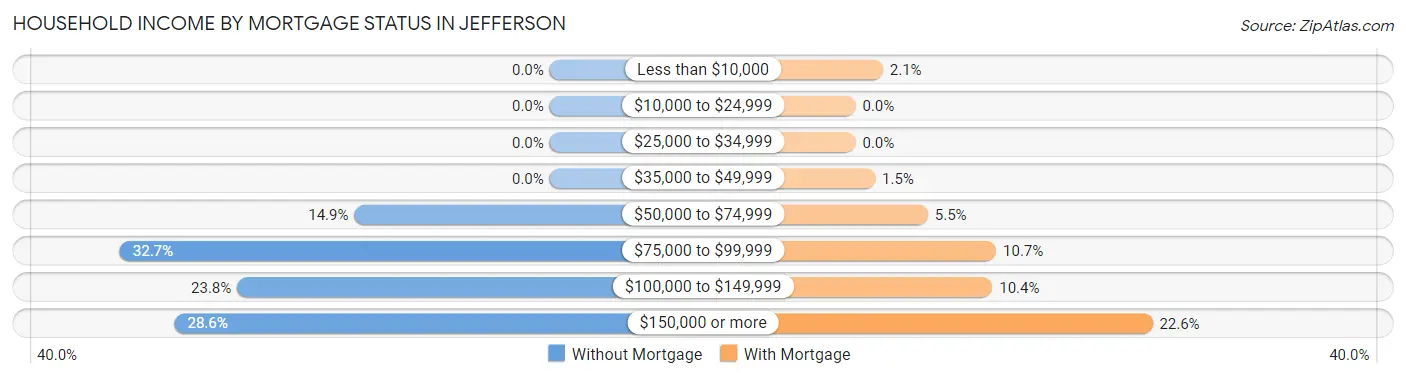
| Household Income | Without Mortgage | With Mortgage |
| Less than $10,000 | 0 (0.0%) | 14 (2.1%) |
| $10,000 to $24,999 | 0 (0.0%) | 0 (0.0%) |
| $25,000 to $34,999 | 0 (0.0%) | 0 (0.0%) |
| $35,000 to $49,999 | 0 (0.0%) | 10 (1.5%) |
| $50,000 to $74,999 | 25 (14.9%) | 37 (5.5%) |
| $75,000 to $99,999 | 55 (32.7%) | 72 (10.7%) |
| $100,000 to $149,999 | 40 (23.8%) | 70 (10.4%) |
| $150,000 or more | 48 (28.6%) | 152 (22.6%) |
| Total | 168 (100.0%) | 672 (100.0%) |
Property Value to Household Income Ratio in Jefferson
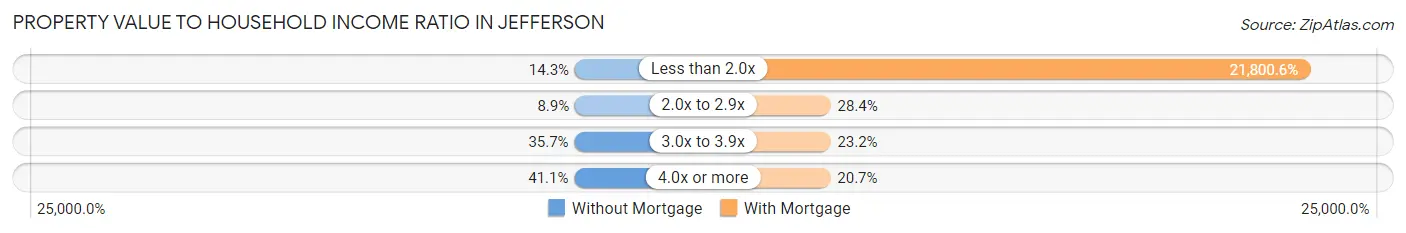
| Value-to-Income Ratio | Without Mortgage | With Mortgage |
| Less than 2.0x | 24 (14.3%) | 146,500 (21,800.6%) |
| 2.0x to 2.9x | 15 (8.9%) | 191 (28.4%) |
| 3.0x to 3.9x | 60 (35.7%) | 156 (23.2%) |
| 4.0x or more | 69 (41.1%) | 139 (20.7%) |
| Total | 168 (100.0%) | 672 (100.0%) |
Real Estate Taxes by Mortgage Status in Jefferson
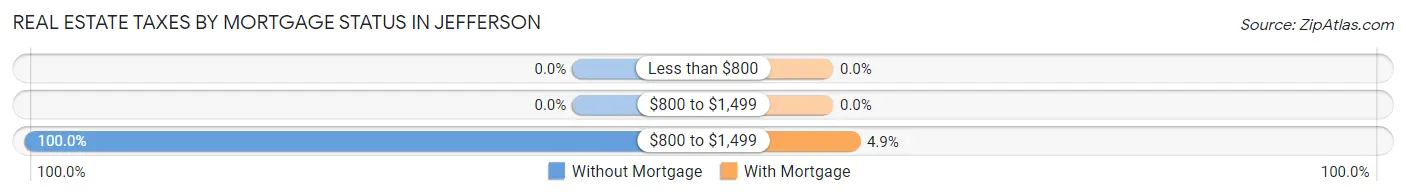
| Property Taxes | Without Mortgage | With Mortgage |
| Less than $800 | 0 (0.0%) | 0 (0.0%) |
| $800 to $1,499 | 0 (0.0%) | 0 (0.0%) |
| $800 to $1,499 | 168 (100.0%) | 33 (4.9%) |
| Total | 168 (100.0%) | 672 (100.0%) |
Health & Disability in Jefferson
Health Insurance Coverage by Age in Jefferson
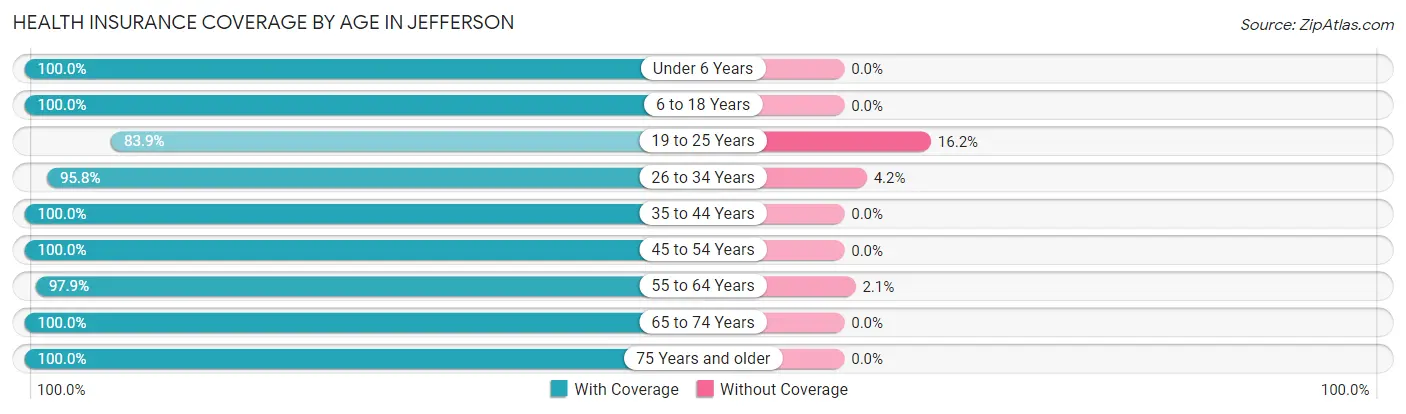
| Age Bracket | With Coverage | Without Coverage |
| Under 6 Years | 212 (100.0%) | 0 (0.0%) |
| 6 to 18 Years | 414 (100.0%) | 0 (0.0%) |
| 19 to 25 Years | 218 (83.9%) | 42 (16.2%) |
| 26 to 34 Years | 275 (95.8%) | 12 (4.2%) |
| 35 to 44 Years | 264 (100.0%) | 0 (0.0%) |
| 45 to 54 Years | 375 (100.0%) | 0 (0.0%) |
| 55 to 64 Years | 519 (97.9%) | 11 (2.1%) |
| 65 to 74 Years | 194 (100.0%) | 0 (0.0%) |
| 75 Years and older | 206 (100.0%) | 0 (0.0%) |
| Total | 2,677 (97.6%) | 65 (2.4%) |
Health Insurance Coverage by Citizenship Status in Jefferson
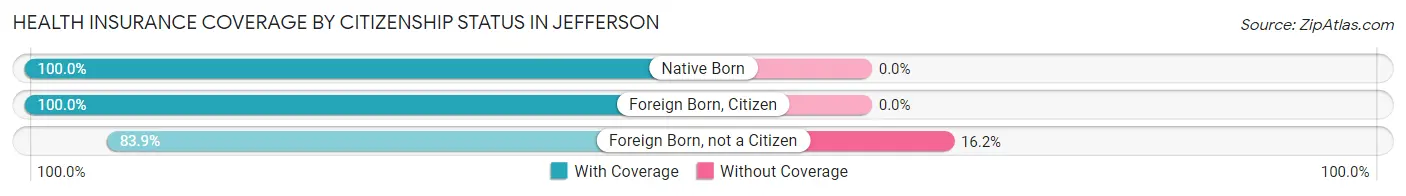
| Citizenship Status | With Coverage | Without Coverage |
| Native Born | 212 (100.0%) | 0 (0.0%) |
| Foreign Born, Citizen | 414 (100.0%) | 0 (0.0%) |
| Foreign Born, not a Citizen | 218 (83.9%) | 42 (16.2%) |
Health Insurance Coverage by Household Income in Jefferson
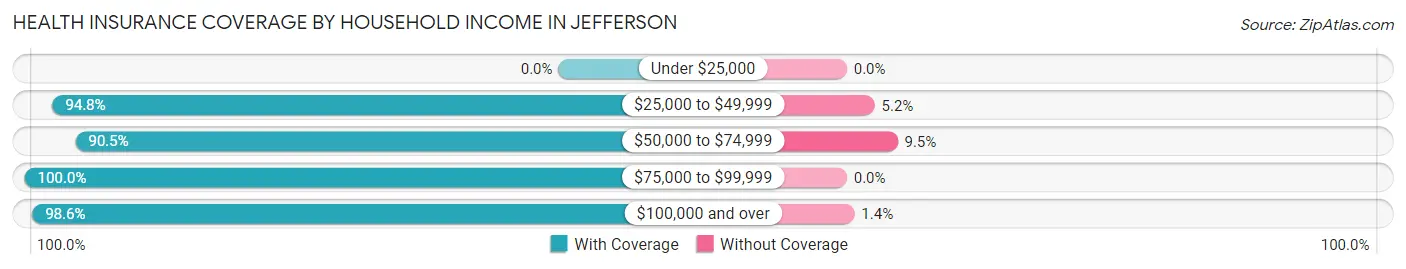
| Household Income | With Coverage | Without Coverage |
| Under $25,000 | 0 (0.0%) | 0 (0.0%) |
| $25,000 to $49,999 | 200 (94.8%) | 11 (5.2%) |
| $50,000 to $74,999 | 276 (90.5%) | 29 (9.5%) |
| $75,000 to $99,999 | 477 (100.0%) | 0 (0.0%) |
| $100,000 and over | 1,724 (98.6%) | 25 (1.4%) |
Public vs Private Health Insurance Coverage by Age in Jefferson
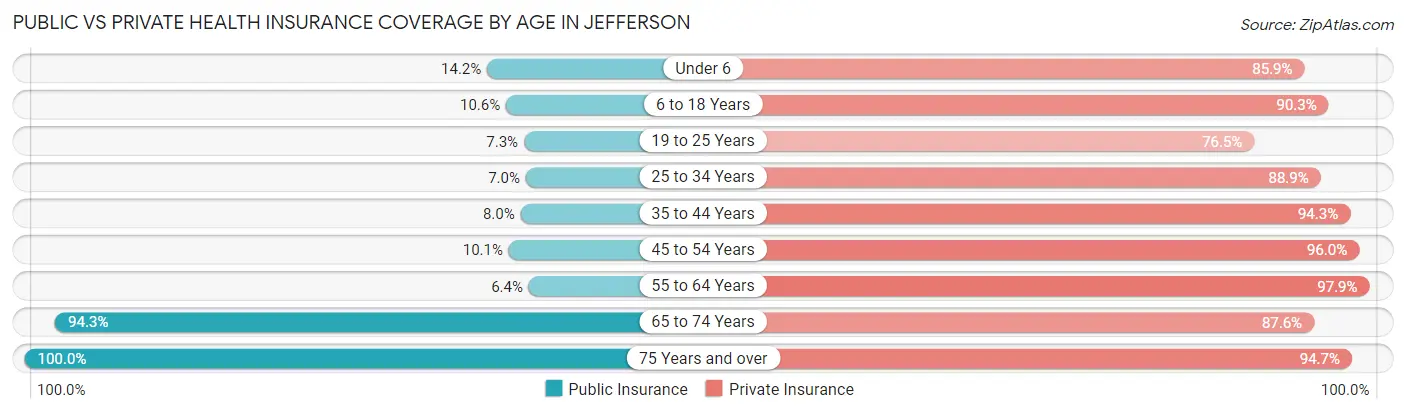
| Age Bracket | Public Insurance | Private Insurance |
| Under 6 | 30 (14.1%) | 182 (85.9%) |
| 6 to 18 Years | 44 (10.6%) | 374 (90.3%) |
| 19 to 25 Years | 19 (7.3%) | 199 (76.5%) |
| 25 to 34 Years | 20 (7.0%) | 255 (88.8%) |
| 35 to 44 Years | 21 (8.0%) | 249 (94.3%) |
| 45 to 54 Years | 38 (10.1%) | 360 (96.0%) |
| 55 to 64 Years | 34 (6.4%) | 519 (97.9%) |
| 65 to 74 Years | 183 (94.3%) | 170 (87.6%) |
| 75 Years and over | 206 (100.0%) | 195 (94.7%) |
| Total | 595 (21.7%) | 2,503 (91.3%) |
Disability Status by Sex by Age in Jefferson
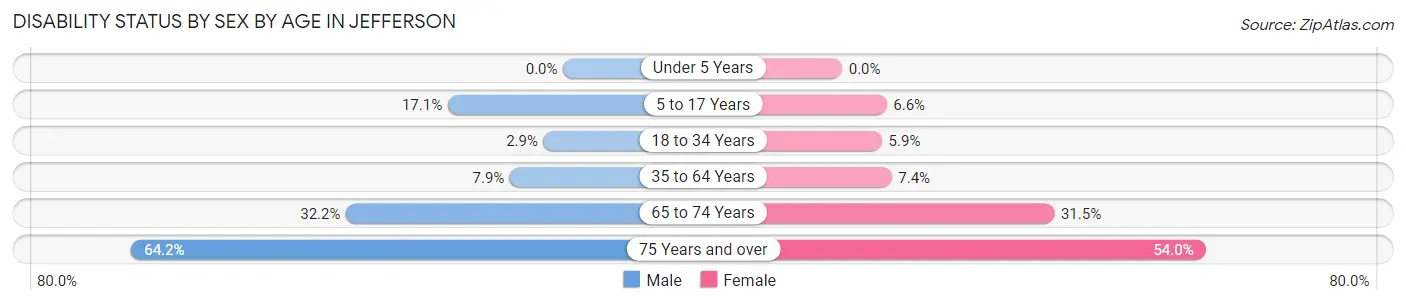
| Age Bracket | Male | Female |
| Under 5 Years | 0 (0.0%) | 0 (0.0%) |
| 5 to 17 Years | 37 (17.1%) | 16 (6.6%) |
| 18 to 34 Years | 7 (2.9%) | 19 (5.9%) |
| 35 to 64 Years | 43 (7.9%) | 46 (7.4%) |
| 65 to 74 Years | 39 (32.2%) | 23 (31.5%) |
| 75 Years and over | 68 (64.1%) | 54 (54.0%) |
Disability Class by Sex by Age in Jefferson
Disability Class: Hearing Difficulty
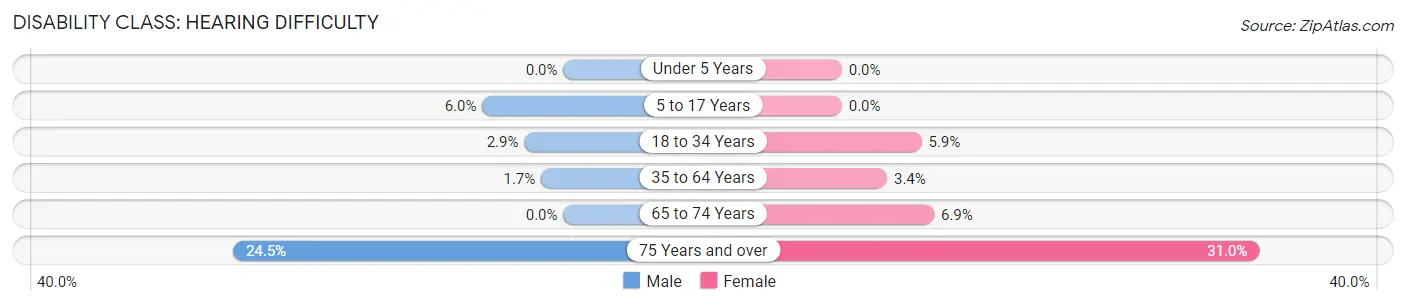
| Age Bracket | Male | Female |
| Under 5 Years | 0 (0.0%) | 0 (0.0%) |
| 5 to 17 Years | 13 (6.0%) | 0 (0.0%) |
| 18 to 34 Years | 7 (2.9%) | 19 (5.9%) |
| 35 to 64 Years | 9 (1.7%) | 21 (3.4%) |
| 65 to 74 Years | 0 (0.0%) | 5 (6.9%) |
| 75 Years and over | 26 (24.5%) | 31 (31.0%) |
Disability Class: Vision Difficulty
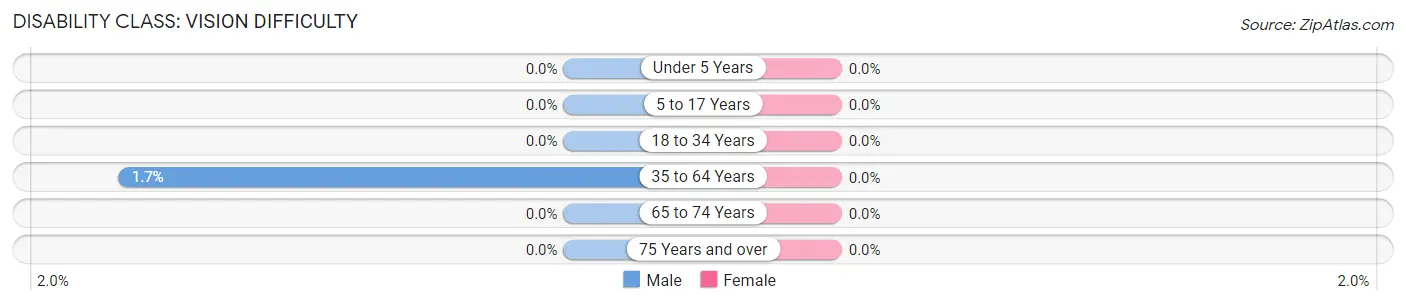
| Age Bracket | Male | Female |
| Under 5 Years | 0 (0.0%) | 0 (0.0%) |
| 5 to 17 Years | 0 (0.0%) | 0 (0.0%) |
| 18 to 34 Years | 0 (0.0%) | 0 (0.0%) |
| 35 to 64 Years | 9 (1.7%) | 0 (0.0%) |
| 65 to 74 Years | 0 (0.0%) | 0 (0.0%) |
| 75 Years and over | 0 (0.0%) | 0 (0.0%) |
Disability Class: Cognitive Difficulty
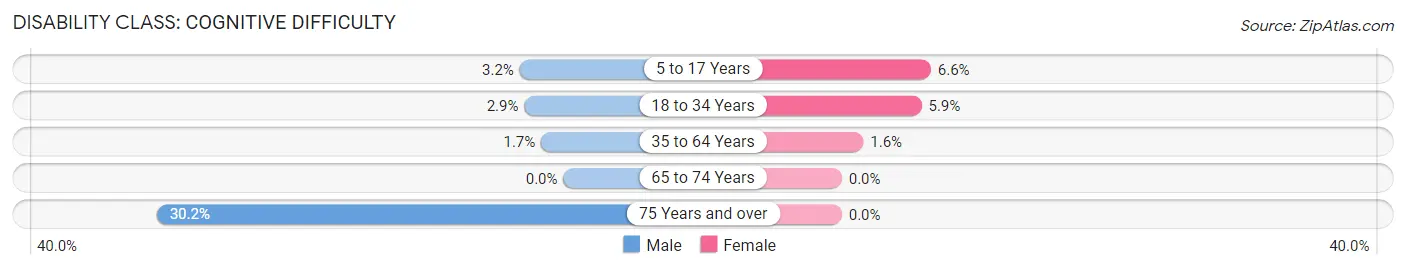
| Age Bracket | Male | Female |
| 5 to 17 Years | 7 (3.2%) | 16 (6.6%) |
| 18 to 34 Years | 7 (2.9%) | 19 (5.9%) |
| 35 to 64 Years | 9 (1.7%) | 10 (1.6%) |
| 65 to 74 Years | 0 (0.0%) | 0 (0.0%) |
| 75 Years and over | 32 (30.2%) | 0 (0.0%) |
Disability Class: Ambulatory Difficulty
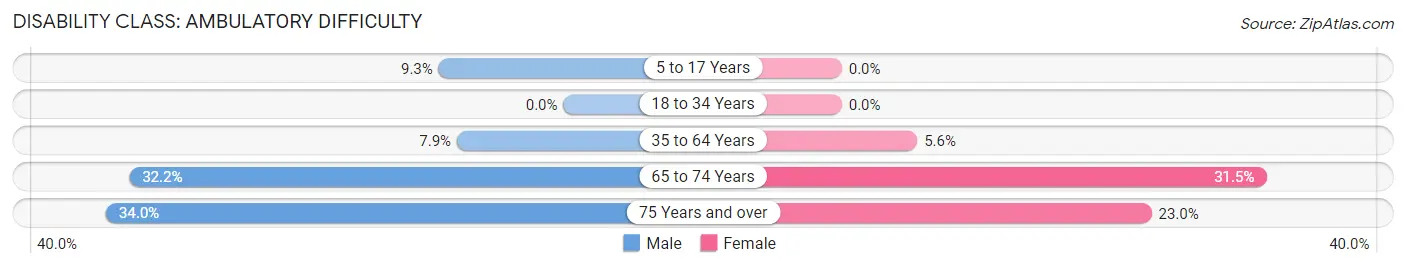
| Age Bracket | Male | Female |
| 5 to 17 Years | 20 (9.3%) | 0 (0.0%) |
| 18 to 34 Years | 0 (0.0%) | 0 (0.0%) |
| 35 to 64 Years | 43 (7.9%) | 35 (5.6%) |
| 65 to 74 Years | 39 (32.2%) | 23 (31.5%) |
| 75 Years and over | 36 (34.0%) | 23 (23.0%) |
Disability Class: Self-Care Difficulty
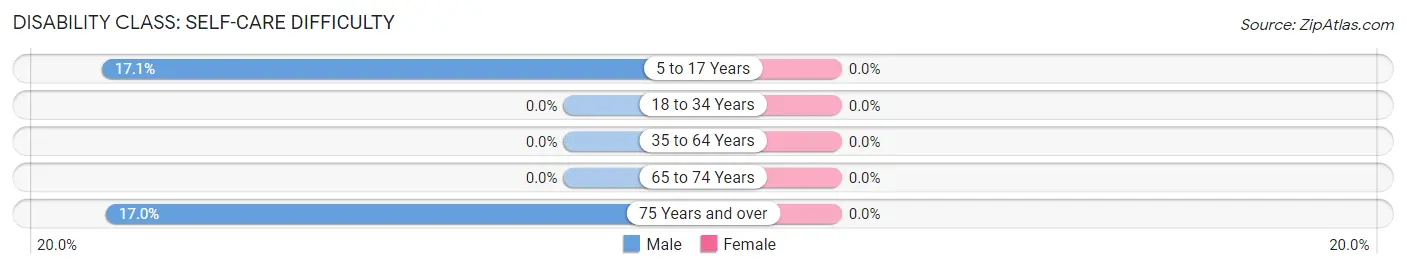
| Age Bracket | Male | Female |
| 5 to 17 Years | 37 (17.1%) | 0 (0.0%) |
| 18 to 34 Years | 0 (0.0%) | 0 (0.0%) |
| 35 to 64 Years | 0 (0.0%) | 0 (0.0%) |
| 65 to 74 Years | 0 (0.0%) | 0 (0.0%) |
| 75 Years and over | 18 (17.0%) | 0 (0.0%) |
Technology Access in Jefferson
Computing Device Access in Jefferson
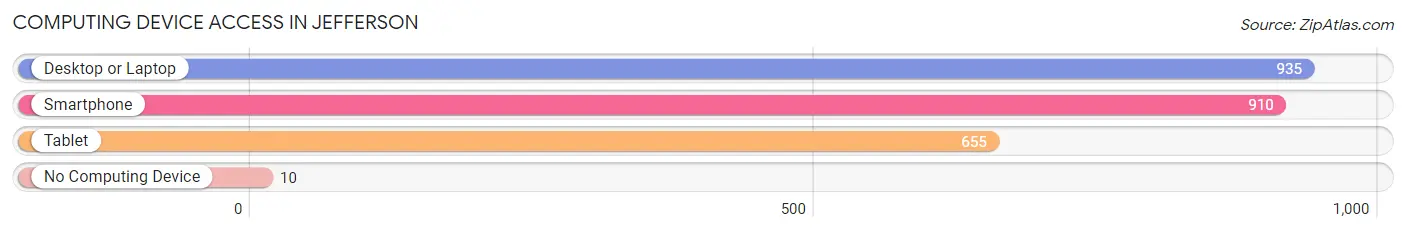
| Device Type | # Households | % Households |
| Desktop or Laptop | 935 | 97.8% |
| Smartphone | 910 | 95.2% |
| Tablet | 655 | 68.5% |
| No Computing Device | 10 | 1.1% |
| Total | 956 | 100.0% |
Internet Access in Jefferson
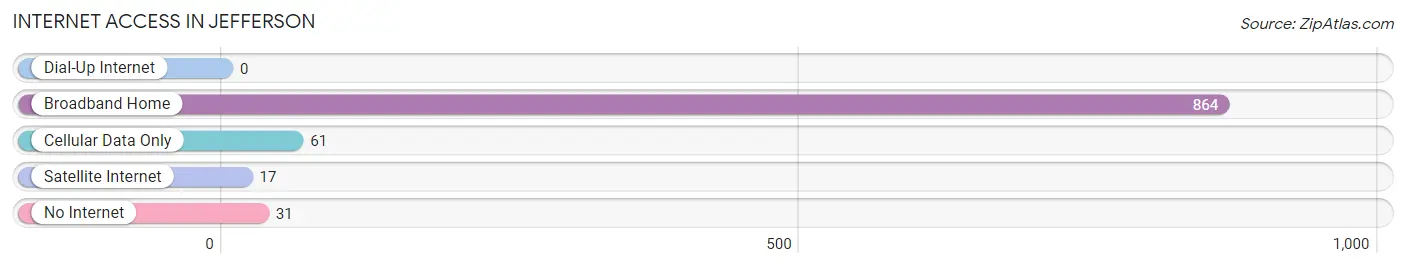
| Internet Type | # Households | % Households |
| Dial-Up Internet | 0 | 0.0% |
| Broadband Home | 864 | 90.4% |
| Cellular Data Only | 61 | 6.4% |
| Satellite Internet | 17 | 1.8% |
| No Internet | 31 | 3.2% |
| Total | 956 | 100.0% |
Jefferson Summary
Jefferson, Maryland is a small town located in Frederick County, Maryland. It is situated in the Catoctin Valley, approximately 25 miles northwest of Washington, D.C. The town was founded in 1744 and is named after Thomas Jefferson, the third President of the United States.
History
Jefferson was founded in 1744 by a group of German settlers who had migrated from Pennsylvania. The town was originally known as “Jeffersontown” and was the first settlement in the Catoctin Valley. The settlers were attracted to the area due to its fertile soil and abundant natural resources.
In 1776, the town was renamed “Jefferson” in honor of Thomas Jefferson, who had recently been elected as the third President of the United States. During the Civil War, the town was occupied by Confederate forces and was the site of several skirmishes.
In the late 19th century, Jefferson experienced a period of growth and prosperity. The town was home to several businesses, including a flour mill, a sawmill, a tannery, and a brickyard. The town also had a railroad station, which connected it to the larger cities of Baltimore and Washington, D.C.
Geography
Jefferson is located in the Catoctin Valley, which is part of the Appalachian Mountains. The town is situated at an elevation of 1,000 feet and is surrounded by rolling hills and forests. The Catoctin Creek runs through the town and is a popular spot for fishing and swimming.
The climate in Jefferson is temperate, with hot summers and cold winters. The average annual temperature is around 50 degrees Fahrenheit. The town receives an average of 40 inches of precipitation each year.
Economy
Jefferson’s economy is largely based on agriculture and tourism. The town is home to several farms, which produce a variety of crops, including corn, wheat, and hay. The town also has several wineries and breweries, which attract tourists from all over the region.
In addition, Jefferson is home to several small businesses, including restaurants, shops, and galleries. The town also has a few manufacturing companies, which produce a variety of products, including furniture and clothing.
Demographics
As of the 2010 census, Jefferson had a population of 1,845. The town is predominantly white, with a small African American population. The median household income is $50,000, and the median home value is $200,000.
Jefferson is a small, close-knit community with a rich history and a vibrant economy. The town is a popular destination for tourists, who come to enjoy the area’s natural beauty and its many attractions. The town is also home to a diverse population, which adds to its unique character.
Common Questions
What is Per Capita Income in Jefferson?
Per Capita income in Jefferson is $50,885.
What is the Median Family Income in Jefferson?
Median Family Income in Jefferson is $140,476.
What is the Median Household income in Jefferson?
Median Household Income in Jefferson is $137,667.
What is Income or Wage Gap in Jefferson?
Income or Wage Gap in Jefferson is 35.1%.
Women in Jefferson earn 64.9 cents for every dollar earned by a man.
What is Inequality or Gini Index in Jefferson?
Inequality or Gini Index in Jefferson is 0.33.
What is the Total Population of Jefferson?
Total Population of Jefferson is 2,742.
What is the Total Male Population of Jefferson?
Total Male Population of Jefferson is 1,312.
What is the Total Female Population of Jefferson?
Total Female Population of Jefferson is 1,430.
What is the Ratio of Males per 100 Females in Jefferson?
There are 91.75 Males per 100 Females in Jefferson.
What is the Ratio of Females per 100 Males in Jefferson?
There are 108.99 Females per 100 Males in Jefferson.
What is the Median Population Age in Jefferson?
Median Population Age in Jefferson is 41.4 Years.
What is the Average Family Size in Jefferson
Average Family Size in Jefferson is 3.2 People.
What is the Average Household Size in Jefferson
Average Household Size in Jefferson is 2.9 People.
How Large is the Labor Force in Jefferson?
There are 1,499 People in the Labor Forcein in Jefferson.
What is the Percentage of People in the Labor Force in Jefferson?
68.3% of People are in the Labor Force in Jefferson.
What is the Unemployment Rate in Jefferson?
Unemployment Rate in Jefferson is 3.5%.