Salisbury, MD Map & Demographics
Salisbury Map
Salisbury Overview
$29,264
PER CAPITA INCOME
$70,089
AVG FAMILY INCOME
$53,309
AVG HOUSEHOLD INCOME
14.3%
WAGE / INCOME GAP [ % ]
85.7¢/ $1
WAGE / INCOME GAP [ $ ]
$11,657
FAMILY INCOME DEFICIT
0.48
INEQUALITY / GINI INDEX
32,960
TOTAL POPULATION
15,485
MALE POPULATION
17,475
FEMALE POPULATION
88.61
MALES / 100 FEMALES
112.85
FEMALES / 100 MALES
30.3
MEDIAN AGE
3.1
AVG FAMILY SIZE
2.4
AVG HOUSEHOLD SIZE
17,245
LABOR FORCE [ PEOPLE ]
65.7%
PERCENT IN LABOR FORCE
9.9%
UNEMPLOYMENT RATE
Income in Salisbury
Income Overview in Salisbury
Per Capita Income in Salisbury is $29,264, while median incomes of families and households are $70,089 and $53,309 respectively.
| Characteristic | Number | Measure |
| Per Capita Income | 32,960 | $29,264 |
| Median Family Income | 7,084 | $70,089 |
| Mean Family Income | 7,084 | $87,135 |
| Median Household Income | 13,335 | $53,309 |
| Mean Household Income | 13,335 | $73,944 |
| Income Deficit | 7,084 | $11,657 |
| Wage / Income Gap (%) | 32,960 | 14.28% |
| Wage / Income Gap ($) | 32,960 | 85.72¢ per $1 |
| Gini / Inequality Index | 32,960 | 0.48 |
Earnings by Sex in Salisbury
Average Earnings in Salisbury are $28,360, $30,402 for men and $26,062 for women, a difference of 14.3%.
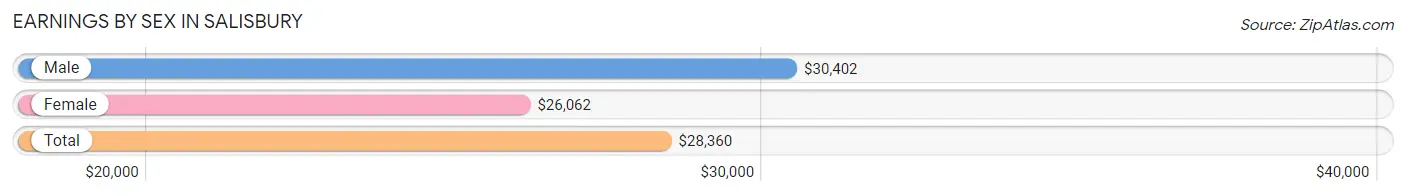
| Sex | Number | Average Earnings |
| Male | 8,820 (47.3%) | $30,402 |
| Female | 9,834 (52.7%) | $26,062 |
| Total | 18,654 (100.0%) | $28,360 |
Earnings by Sex by Income Bracket in Salisbury
The most common earnings brackets in Salisbury are $25,000 to $29,999 for men (825 | 9.3%) and $2,499 or less for women (916 | 9.3%).
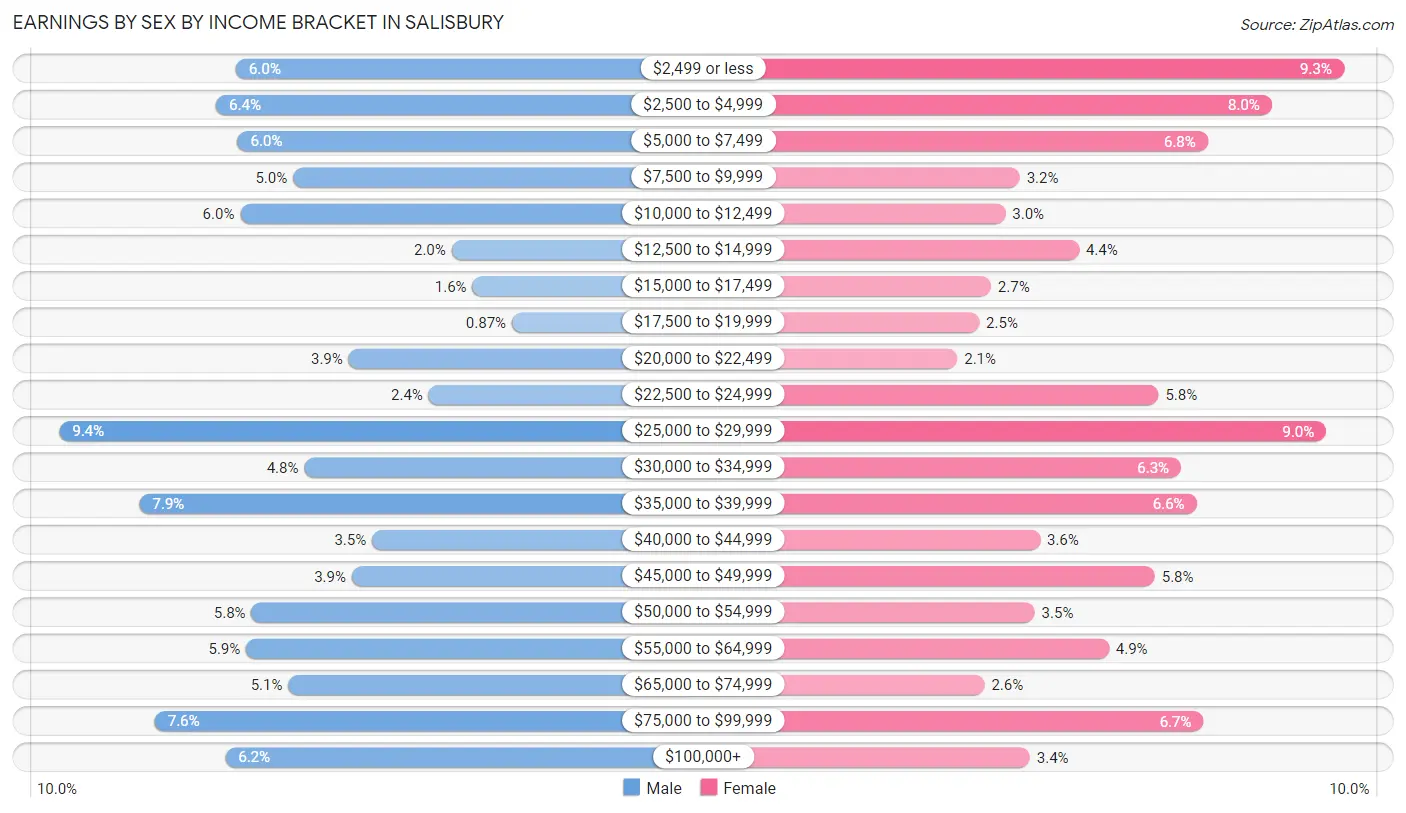
| Income | Male | Female |
| $2,499 or less | 533 (6.0%) | 916 (9.3%) |
| $2,500 to $4,999 | 565 (6.4%) | 783 (8.0%) |
| $5,000 to $7,499 | 530 (6.0%) | 665 (6.8%) |
| $7,500 to $9,999 | 438 (5.0%) | 319 (3.2%) |
| $10,000 to $12,499 | 526 (6.0%) | 292 (3.0%) |
| $12,500 to $14,999 | 176 (2.0%) | 428 (4.3%) |
| $15,000 to $17,499 | 142 (1.6%) | 266 (2.7%) |
| $17,500 to $19,999 | 77 (0.9%) | 244 (2.5%) |
| $20,000 to $22,499 | 347 (3.9%) | 204 (2.1%) |
| $22,500 to $24,999 | 214 (2.4%) | 574 (5.8%) |
| $25,000 to $29,999 | 825 (9.3%) | 883 (9.0%) |
| $30,000 to $34,999 | 420 (4.8%) | 616 (6.3%) |
| $35,000 to $39,999 | 692 (7.9%) | 644 (6.6%) |
| $40,000 to $44,999 | 308 (3.5%) | 356 (3.6%) |
| $45,000 to $49,999 | 341 (3.9%) | 567 (5.8%) |
| $50,000 to $54,999 | 507 (5.8%) | 346 (3.5%) |
| $55,000 to $64,999 | 516 (5.9%) | 483 (4.9%) |
| $65,000 to $74,999 | 446 (5.1%) | 254 (2.6%) |
| $75,000 to $99,999 | 667 (7.6%) | 657 (6.7%) |
| $100,000+ | 550 (6.2%) | 337 (3.4%) |
| Total | 8,820 (100.0%) | 9,834 (100.0%) |
Earnings by Sex by Educational Attainment in Salisbury
Average earnings in Salisbury are $39,724 for men and $33,681 for women, a difference of 15.2%. Men with an educational attainment of graduate degree enjoy the highest average annual earnings of $87,396, while those with less than high school education earn the least with $29,401. Women with an educational attainment of graduate degree earn the most with the average annual earnings of $59,885, while those with less than high school education have the smallest earnings of $19,276.
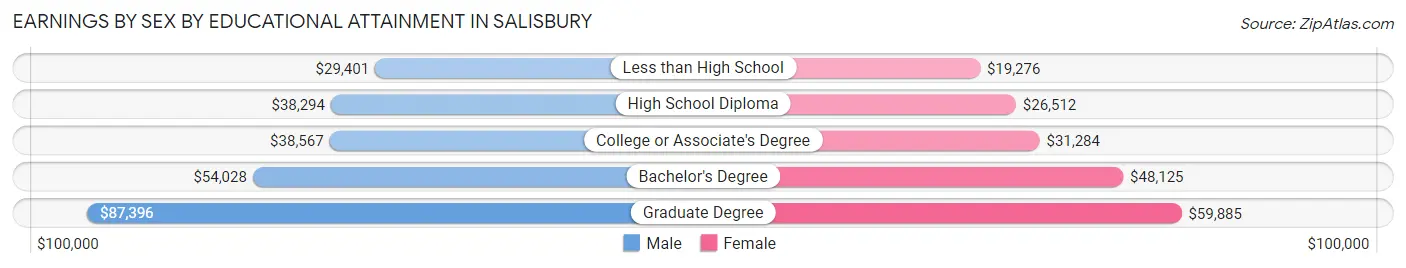
| Educational Attainment | Male Income | Female Income |
| Less than High School | $29,401 | $19,276 |
| High School Diploma | $38,294 | $26,512 |
| College or Associate's Degree | $38,567 | $31,284 |
| Bachelor's Degree | $54,028 | $48,125 |
| Graduate Degree | $87,396 | $59,885 |
| Total | $39,724 | $33,681 |
Family Income in Salisbury
Family Income Brackets in Salisbury
According to the Salisbury family income data, there are 1,218 families falling into the $100,000 to $149,999 income range, which is the most common income bracket and makes up 17.2% of all families. Conversely, the $10,000 to $14,999 income bracket is the least frequent group with only 92 families (1.3%) belonging to this category.
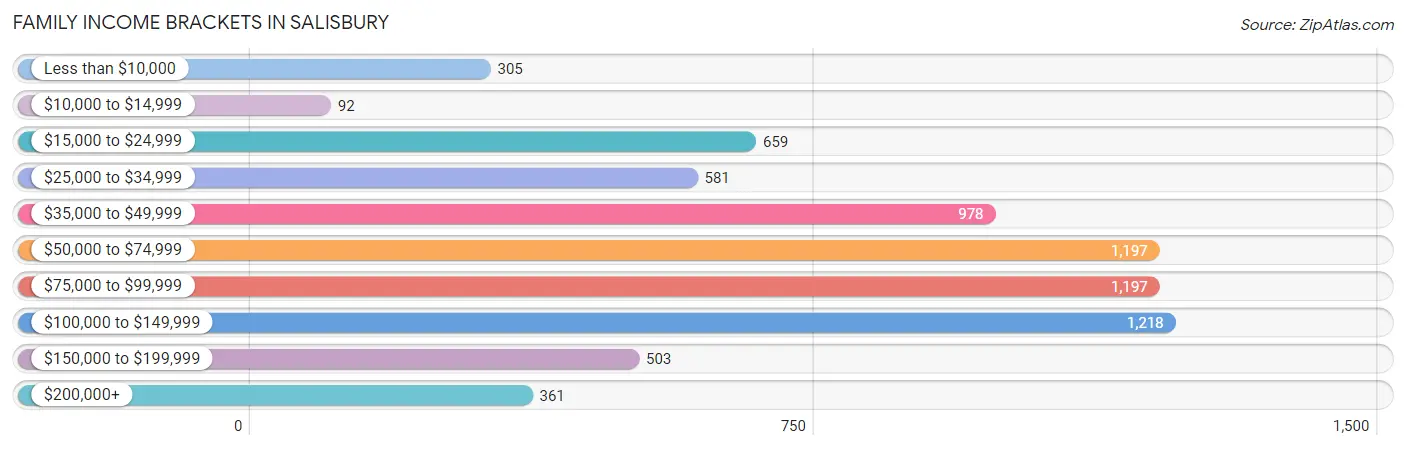
| Income Bracket | # Families | % Families |
| Less than $10,000 | 305 | 4.3% |
| $10,000 to $14,999 | 92 | 1.3% |
| $15,000 to $24,999 | 659 | 9.3% |
| $25,000 to $34,999 | 581 | 8.2% |
| $35,000 to $49,999 | 978 | 13.8% |
| $50,000 to $74,999 | 1,197 | 16.9% |
| $75,000 to $99,999 | 1,197 | 16.9% |
| $100,000 to $149,999 | 1,218 | 17.2% |
| $150,000 to $199,999 | 503 | 7.1% |
| $200,000+ | 361 | 5.1% |
Family Income by Famaliy Size in Salisbury
5-person families (610 | 8.6%) account for the highest median family income in Salisbury with $91,833 per family, while 2-person families (3,350 | 47.3%) have the highest median income of $32,424 per family member.
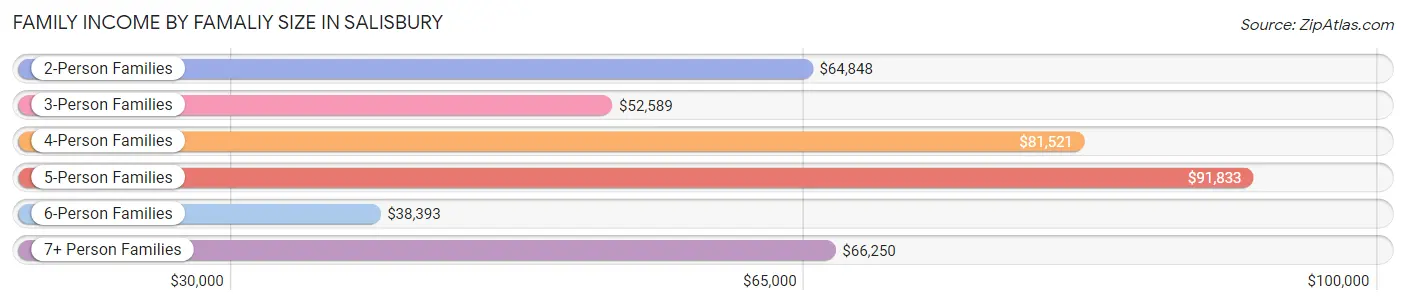
| Income Bracket | # Families | Median Income |
| 2-Person Families | 3,350 (47.3%) | $64,848 |
| 3-Person Families | 1,429 (20.2%) | $52,589 |
| 4-Person Families | 1,303 (18.4%) | $81,521 |
| 5-Person Families | 610 (8.6%) | $91,833 |
| 6-Person Families | 200 (2.8%) | $38,393 |
| 7+ Person Families | 192 (2.7%) | $66,250 |
| Total | 7,084 (100.0%) | $70,089 |
Family Income by Number of Earners in Salisbury
The median family income in Salisbury is $70,089, with families comprising 3+ earners (821) having the highest median family income of $107,399, while families with 1 earner (2,929) have the lowest median family income of $41,135, accounting for 11.6% and 41.3% of families, respectively.
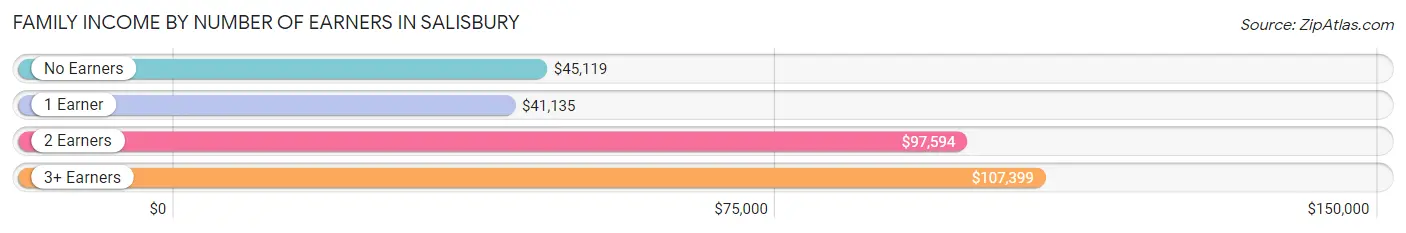
| Number of Earners | # Families | Median Income |
| No Earners | 600 (8.5%) | $45,119 |
| 1 Earner | 2,929 (41.3%) | $41,135 |
| 2 Earners | 2,734 (38.6%) | $97,594 |
| 3+ Earners | 821 (11.6%) | $107,399 |
| Total | 7,084 (100.0%) | $70,089 |
Household Income in Salisbury
Household Income Brackets in Salisbury
With 2,454 households falling in the category, the $50,000 to $74,999 income range is the most frequent in Salisbury, accounting for 18.4% of all households. In contrast, only 467 households (3.5%) fall into the $10,000 to $14,999 income bracket, making it the least populous group.
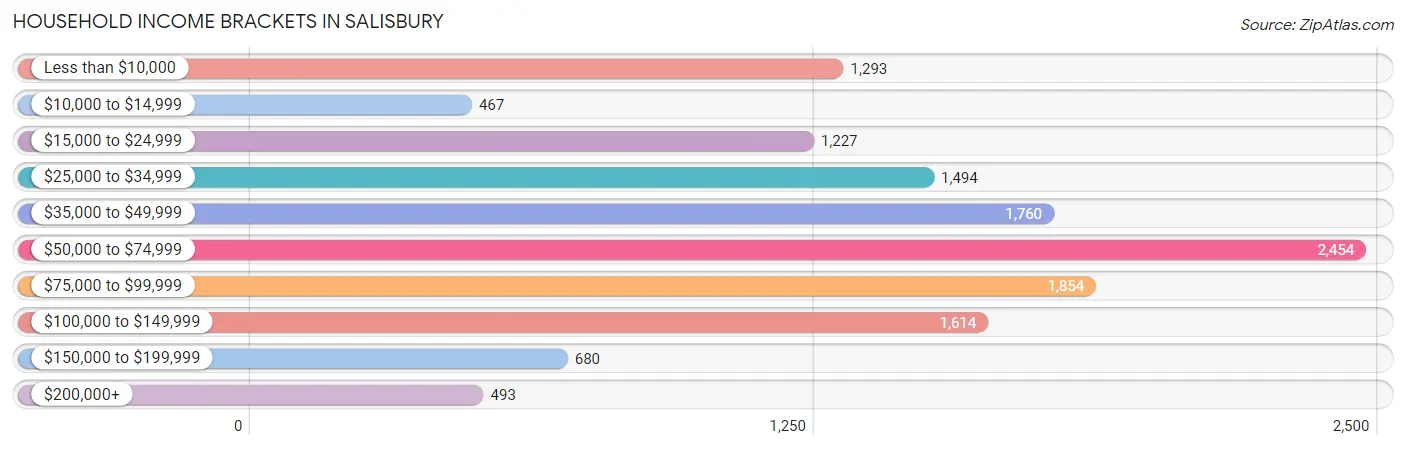
| Income Bracket | # Households | % Households |
| Less than $10,000 | 1,293 | 9.7% |
| $10,000 to $14,999 | 467 | 3.5% |
| $15,000 to $24,999 | 1,227 | 9.2% |
| $25,000 to $34,999 | 1,494 | 11.2% |
| $35,000 to $49,999 | 1,760 | 13.2% |
| $50,000 to $74,999 | 2,454 | 18.4% |
| $75,000 to $99,999 | 1,854 | 13.9% |
| $100,000 to $149,999 | 1,614 | 12.1% |
| $150,000 to $199,999 | 680 | 5.1% |
| $200,000+ | 493 | 3.7% |
Household Income by Householder Age in Salisbury
The median household income in Salisbury is $53,309, with the highest median household income of $61,706 found in the 45 to 64 years age bracket for the primary householder. A total of 3,434 households (25.8%) fall into this category. Meanwhile, the 15 to 24 years age bracket for the primary householder has the lowest median household income of $31,705, with 1,989 households (14.9%) in this group.
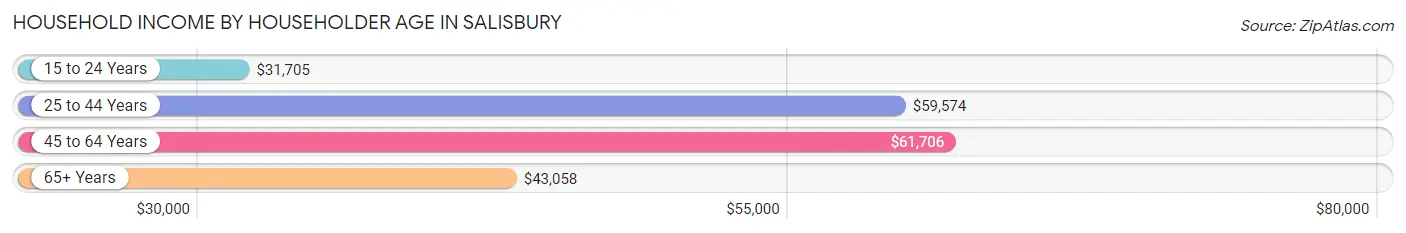
| Income Bracket | # Households | Median Income |
| 15 to 24 Years | 1,989 (14.9%) | $31,705 |
| 25 to 44 Years | 4,774 (35.8%) | $59,574 |
| 45 to 64 Years | 3,434 (25.8%) | $61,706 |
| 65+ Years | 3,138 (23.5%) | $43,058 |
| Total | 13,335 (100.0%) | $53,309 |
Poverty in Salisbury
Income Below Poverty by Sex and Age in Salisbury
With 20.0% poverty level for males and 26.7% for females among the residents of Salisbury, 5 year old males and 18 to 24 year old females are the most vulnerable to poverty, with 192 males (65.7%) and 1,544 females (51.7%) in their respective age groups living below the poverty level.
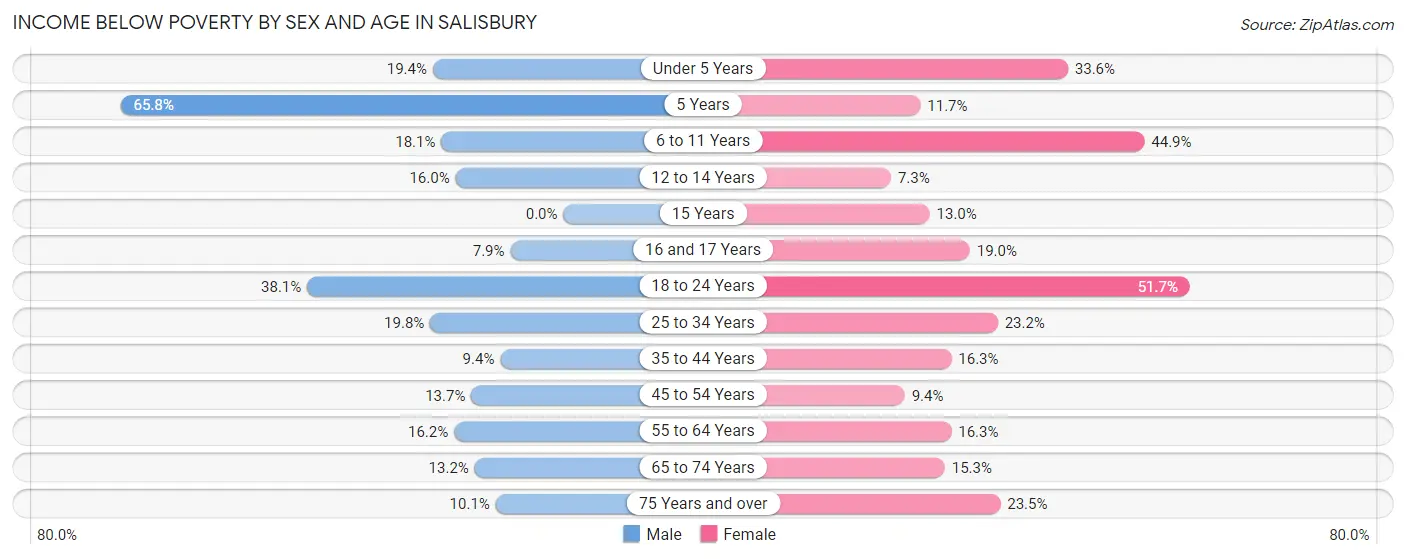
| Age Bracket | Male | Female |
| Under 5 Years | 269 (19.4%) | 329 (33.6%) |
| 5 Years | 192 (65.7%) | 28 (11.7%) |
| 6 to 11 Years | 193 (18.1%) | 625 (44.9%) |
| 12 to 14 Years | 120 (16.0%) | 27 (7.3%) |
| 15 Years | 0 (0.0%) | 6 (13.0%) |
| 16 and 17 Years | 30 (7.9%) | 69 (19.0%) |
| 18 to 24 Years | 906 (38.1%) | 1,544 (51.7%) |
| 25 to 34 Years | 546 (19.8%) | 605 (23.2%) |
| 35 to 44 Years | 139 (9.4%) | 330 (16.3%) |
| 45 to 54 Years | 154 (13.7%) | 139 (9.3%) |
| 55 to 64 Years | 265 (16.2%) | 284 (16.3%) |
| 65 to 74 Years | 141 (13.2%) | 197 (15.3%) |
| 75 Years and over | 60 (10.1%) | 305 (23.5%) |
| Total | 3,015 (20.0%) | 4,488 (26.7%) |
Income Above Poverty by Sex and Age in Salisbury
According to the poverty statistics in Salisbury, males aged 15 years and females aged 12 to 14 years are the age groups that are most secure financially, with 100.0% of males and 92.7% of females in these age groups living above the poverty line.
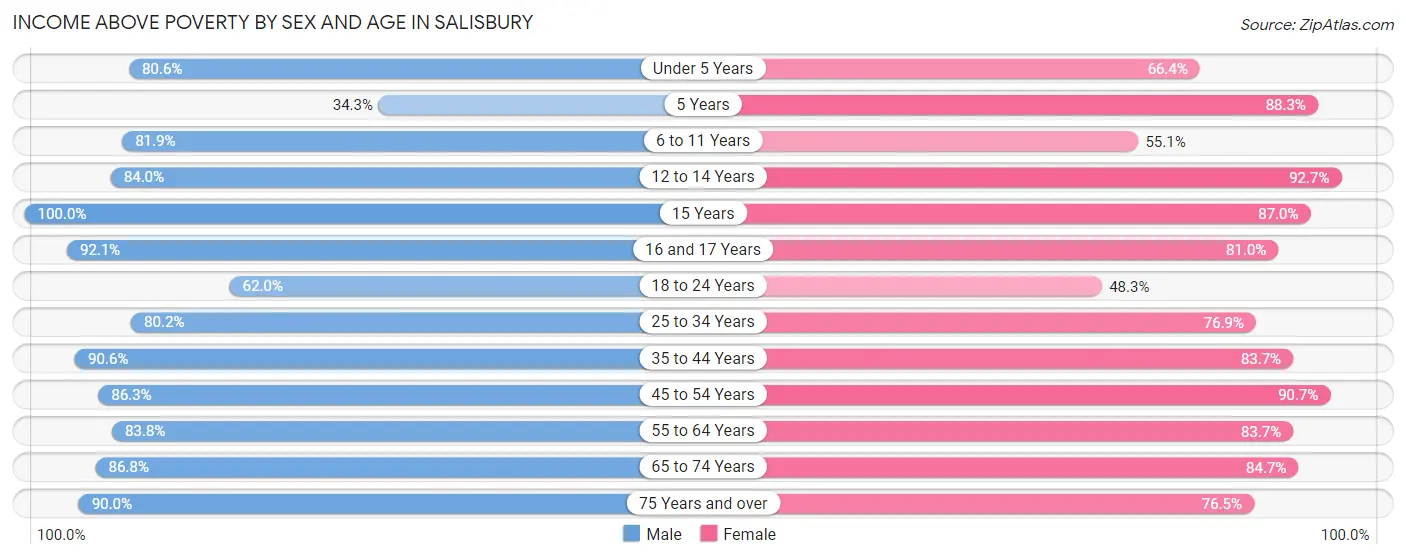
| Age Bracket | Male | Female |
| Under 5 Years | 1,119 (80.6%) | 651 (66.4%) |
| 5 Years | 100 (34.3%) | 212 (88.3%) |
| 6 to 11 Years | 872 (81.9%) | 766 (55.1%) |
| 12 to 14 Years | 629 (84.0%) | 343 (92.7%) |
| 15 Years | 116 (100.0%) | 40 (87.0%) |
| 16 and 17 Years | 351 (92.1%) | 294 (81.0%) |
| 18 to 24 Years | 1,475 (62.0%) | 1,445 (48.3%) |
| 25 to 34 Years | 2,214 (80.2%) | 2,008 (76.8%) |
| 35 to 44 Years | 1,345 (90.6%) | 1,698 (83.7%) |
| 45 to 54 Years | 972 (86.3%) | 1,348 (90.6%) |
| 55 to 64 Years | 1,368 (83.8%) | 1,463 (83.7%) |
| 65 to 74 Years | 930 (86.8%) | 1,091 (84.7%) |
| 75 Years and over | 537 (89.9%) | 991 (76.5%) |
| Total | 12,028 (80.0%) | 12,350 (73.4%) |
Income Below Poverty Among Married-Couple Families in Salisbury
The poverty statistics for married-couple families in Salisbury show that 5.2% or 187 of the total 3,571 families live below the poverty line. Families with 3 or 4 children have the highest poverty rate of 35.8%, comprising of 113 families. On the other hand, families with 1 or 2 children have the lowest poverty rate of 1.3%, which includes 15 families.
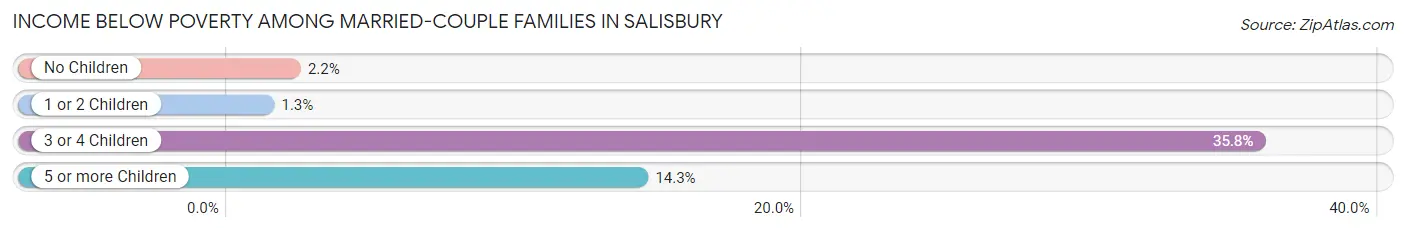
| Children | Above Poverty | Below Poverty |
| No Children | 1,916 (97.8%) | 43 (2.2%) |
| 1 or 2 Children | 1,169 (98.7%) | 15 (1.3%) |
| 3 or 4 Children | 203 (64.2%) | 113 (35.8%) |
| 5 or more Children | 96 (85.7%) | 16 (14.3%) |
| Total | 3,384 (94.8%) | 187 (5.2%) |
Income Below Poverty Among Single-Parent Households in Salisbury
According to the poverty data in Salisbury, 9.2% or 102 single-father households and 26.8% or 643 single-mother households are living below the poverty line. Among single-father households, those with 3 or 4 children have the highest poverty rate, with 71 households (74.7%) experiencing poverty. Likewise, among single-mother households, those with 3 or 4 children have the highest poverty rate, with 105 households (42.9%) falling below the poverty line.
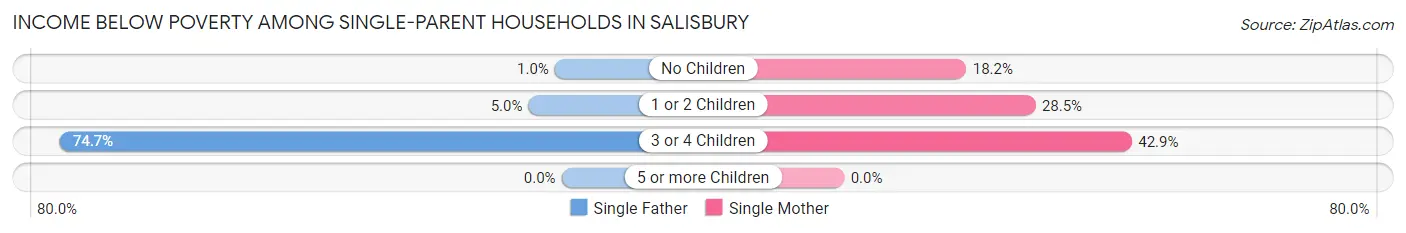
| Children | Single Father | Single Mother |
| No Children | 5 (1.0%) | 113 (18.2%) |
| 1 or 2 Children | 26 (5.0%) | 425 (28.5%) |
| 3 or 4 Children | 71 (74.7%) | 105 (42.9%) |
| 5 or more Children | 0 (0.0%) | 0 (0.0%) |
| Total | 102 (9.2%) | 643 (26.8%) |
Income Below Poverty Among Married-Couple vs Single-Parent Households in Salisbury
The poverty data for Salisbury shows that 187 of the married-couple family households (5.2%) and 745 of the single-parent households (21.2%) are living below the poverty level. Within the married-couple family households, those with 3 or 4 children have the highest poverty rate, with 113 households (35.8%) falling below the poverty line. Among the single-parent households, those with 3 or 4 children have the highest poverty rate, with 176 household (51.8%) living below poverty.
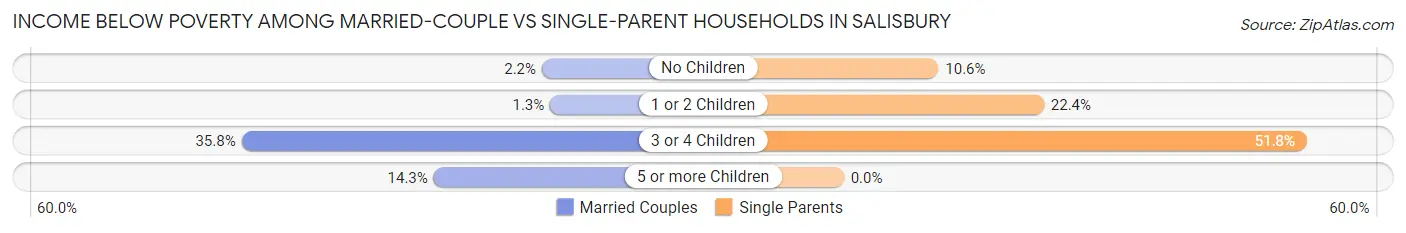
| Children | Married-Couple Families | Single-Parent Households |
| No Children | 43 (2.2%) | 118 (10.6%) |
| 1 or 2 Children | 15 (1.3%) | 451 (22.4%) |
| 3 or 4 Children | 113 (35.8%) | 176 (51.8%) |
| 5 or more Children | 16 (14.3%) | 0 (0.0%) |
| Total | 187 (5.2%) | 745 (21.2%) |
Race in Salisbury
The most populous races in Salisbury are White / Caucasian (15,140 | 45.9%), Black / African American (13,310 | 40.4%), and Two or more Races (2,484 | 7.5%).
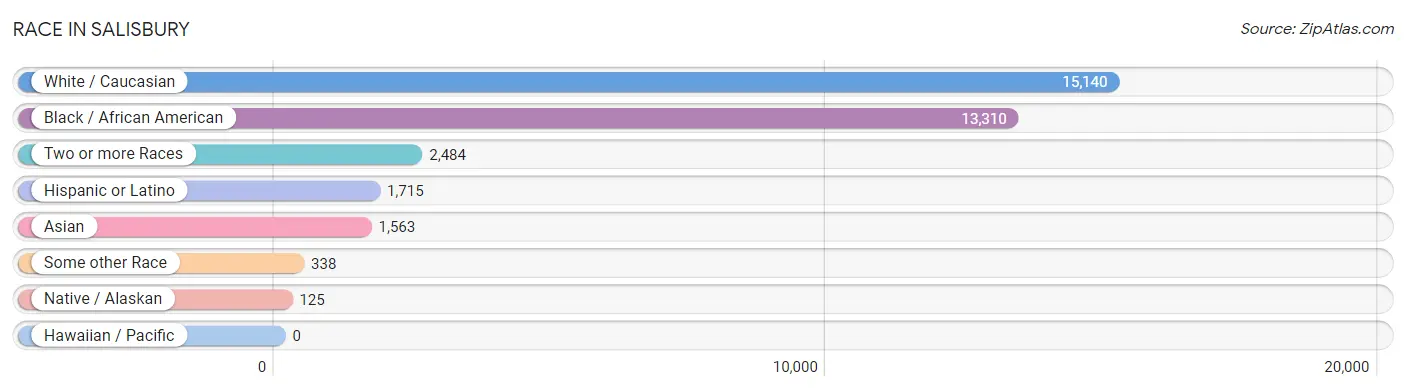
| Race | # Population | % Population |
| Asian | 1,563 | 4.7% |
| Black / African American | 13,310 | 40.4% |
| Hawaiian / Pacific | 0 | 0.0% |
| Hispanic or Latino | 1,715 | 5.2% |
| Native / Alaskan | 125 | 0.4% |
| White / Caucasian | 15,140 | 45.9% |
| Two or more Races | 2,484 | 7.5% |
| Some other Race | 338 | 1.0% |
| Total | 32,960 | 100.0% |
Ancestry in Salisbury
The most populous ancestries reported in Salisbury are German (3,443 | 10.4%), English (2,584 | 7.8%), Irish (2,495 | 7.6%), Haitian (2,324 | 7.0%), and American (1,932 | 5.9%), together accounting for 38.8% of all Salisbury residents.
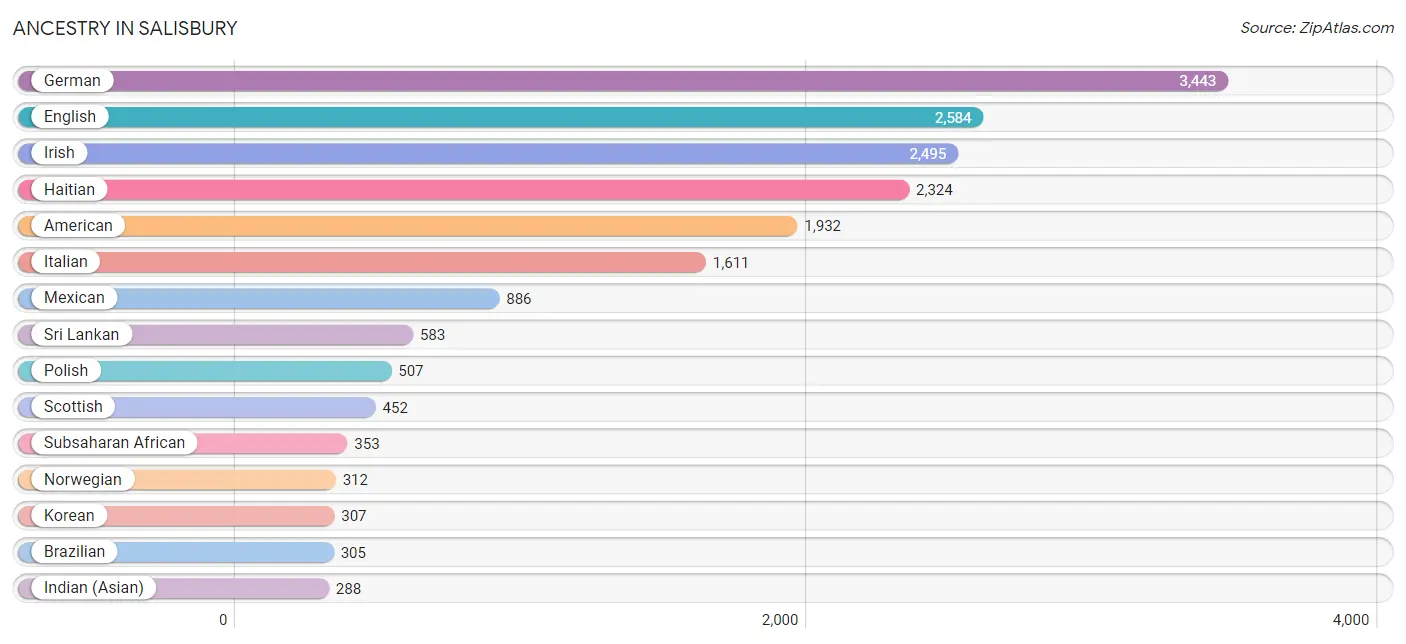
| Ancestry | # Population | % Population |
| African | 281 | 0.9% |
| American | 1,932 | 5.9% |
| Apache | 4 | 0.0% |
| Arab | 98 | 0.3% |
| Armenian | 2 | 0.0% |
| Austrian | 94 | 0.3% |
| Bahamian | 28 | 0.1% |
| Belgian | 51 | 0.2% |
| Bermudan | 45 | 0.1% |
| Bhutanese | 20 | 0.1% |
| Blackfeet | 13 | 0.0% |
| Brazilian | 305 | 0.9% |
| British | 203 | 0.6% |
| British West Indian | 2 | 0.0% |
| Burmese | 252 | 0.8% |
| Canadian | 10 | 0.0% |
| Celtic | 17 | 0.1% |
| Central American | 180 | 0.5% |
| Central American Indian | 114 | 0.4% |
| Cherokee | 79 | 0.2% |
| Colombian | 8 | 0.0% |
| Comanche | 47 | 0.1% |
| Costa Rican | 47 | 0.1% |
| Croatian | 46 | 0.1% |
| Cuban | 53 | 0.2% |
| Czech | 54 | 0.2% |
| Dominican | 262 | 0.8% |
| Dutch | 147 | 0.4% |
| Eastern European | 49 | 0.2% |
| Egyptian | 83 | 0.3% |
| English | 2,584 | 7.8% |
| Estonian | 7 | 0.0% |
| Ethiopian | 34 | 0.1% |
| European | 144 | 0.4% |
| Finnish | 16 | 0.1% |
| French | 243 | 0.7% |
| French Canadian | 39 | 0.1% |
| German | 3,443 | 10.4% |
| Ghanaian | 10 | 0.0% |
| Greek | 41 | 0.1% |
| Guatemalan | 8 | 0.0% |
| Haitian | 2,324 | 7.0% |
| Hungarian | 105 | 0.3% |
| Indian (Asian) | 288 | 0.9% |
| Iranian | 40 | 0.1% |
| Irish | 2,495 | 7.6% |
| Iroquois | 9 | 0.0% |
| Italian | 1,611 | 4.9% |
| Jamaican | 176 | 0.5% |
| Kiowa | 12 | 0.0% |
| Korean | 307 | 0.9% |
| Lebanese | 47 | 0.1% |
| Lithuanian | 13 | 0.0% |
| Mexican | 886 | 2.7% |
| Mexican American Indian | 53 | 0.2% |
| Native Hawaiian | 20 | 0.1% |
| Navajo | 6 | 0.0% |
| Northern European | 30 | 0.1% |
| Norwegian | 312 | 0.9% |
| Pennsylvania German | 14 | 0.0% |
| Peruvian | 43 | 0.1% |
| Polish | 507 | 1.5% |
| Portuguese | 202 | 0.6% |
| Pueblo | 4 | 0.0% |
| Puerto Rican | 87 | 0.3% |
| Romanian | 17 | 0.1% |
| Russian | 79 | 0.2% |
| Salvadoran | 125 | 0.4% |
| Scandinavian | 110 | 0.3% |
| Scotch-Irish | 130 | 0.4% |
| Scottish | 452 | 1.4% |
| Slovak | 90 | 0.3% |
| South American | 51 | 0.2% |
| Spaniard | 2 | 0.0% |
| Spanish | 4 | 0.0% |
| Sri Lankan | 583 | 1.8% |
| Subsaharan African | 353 | 1.1% |
| Sudanese | 20 | 0.1% |
| Swedish | 55 | 0.2% |
| Swiss | 43 | 0.1% |
| Syrian | 34 | 0.1% |
| Thai | 13 | 0.0% |
| Ukrainian | 28 | 0.1% |
| Welsh | 81 | 0.3% |
| West Indian | 47 | 0.1% | View All 85 Rows |
Immigrants in Salisbury
The most numerous immigrant groups reported in Salisbury came from Latin America (2,601 | 7.9%), Caribbean (1,875 | 5.7%), Haiti (1,716 | 5.2%), Asia (1,621 | 4.9%), and South Eastern Asia (705 | 2.1%), together accounting for 25.9% of all Salisbury residents.
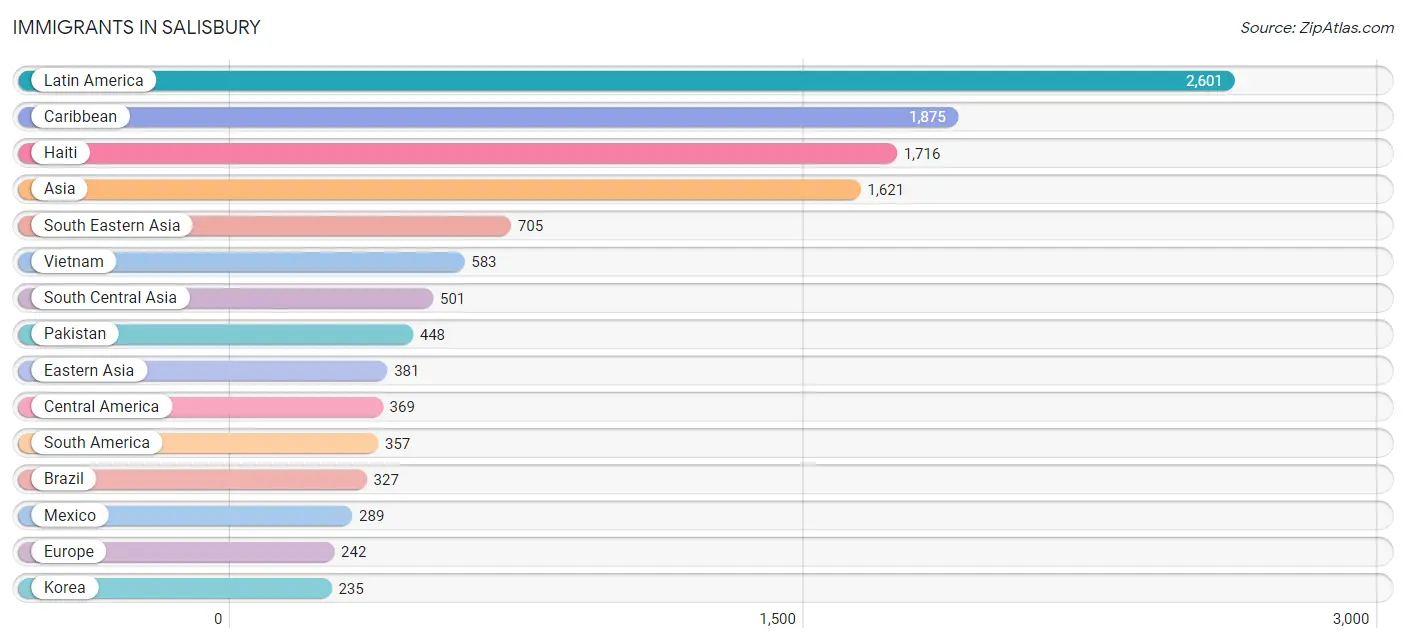
| Immigration Origin | # Population | % Population |
| Africa | 79 | 0.2% |
| Asia | 1,621 | 4.9% |
| Bahamas | 12 | 0.0% |
| Brazil | 327 | 1.0% |
| Cameroon | 8 | 0.0% |
| Canada | 11 | 0.0% |
| Caribbean | 1,875 | 5.7% |
| Central America | 369 | 1.1% |
| China | 146 | 0.4% |
| Colombia | 8 | 0.0% |
| Costa Rica | 15 | 0.1% |
| Cuba | 30 | 0.1% |
| Czechoslovakia | 9 | 0.0% |
| Dominican Republic | 111 | 0.3% |
| Eastern Africa | 29 | 0.1% |
| Eastern Asia | 381 | 1.2% |
| Eastern Europe | 40 | 0.1% |
| El Salvador | 57 | 0.2% |
| Ethiopia | 21 | 0.1% |
| Europe | 242 | 0.7% |
| France | 2 | 0.0% |
| Germany | 49 | 0.2% |
| Ghana | 16 | 0.1% |
| Guatemala | 8 | 0.0% |
| Haiti | 1,716 | 5.2% |
| Hong Kong | 34 | 0.1% |
| India | 13 | 0.0% |
| Iran | 40 | 0.1% |
| Jamaica | 6 | 0.0% |
| Kenya | 8 | 0.0% |
| Korea | 235 | 0.7% |
| Latin America | 2,601 | 7.9% |
| Mexico | 289 | 0.9% |
| Middle Africa | 8 | 0.0% |
| Moldova | 17 | 0.1% |
| Northern Africa | 20 | 0.1% |
| Northern Europe | 75 | 0.2% |
| Pakistan | 448 | 1.4% |
| Peru | 22 | 0.1% |
| Philippines | 122 | 0.4% |
| Portugal | 76 | 0.2% |
| Russia | 14 | 0.0% |
| Scotland | 58 | 0.2% |
| Sierra Leone | 6 | 0.0% |
| South America | 357 | 1.1% |
| South Central Asia | 501 | 1.5% |
| South Eastern Asia | 705 | 2.1% |
| Southern Europe | 76 | 0.2% |
| Sudan | 20 | 0.1% |
| Taiwan | 27 | 0.1% |
| Vietnam | 583 | 1.8% |
| Western Africa | 22 | 0.1% |
| Western Asia | 34 | 0.1% |
| Western Europe | 51 | 0.2% | View All 54 Rows |
Sex and Age in Salisbury
Sex and Age in Salisbury
The most populous age groups in Salisbury are 20 to 24 Years (1,916 | 12.4%) for men and 20 to 24 Years (2,489 | 14.2%) for women.
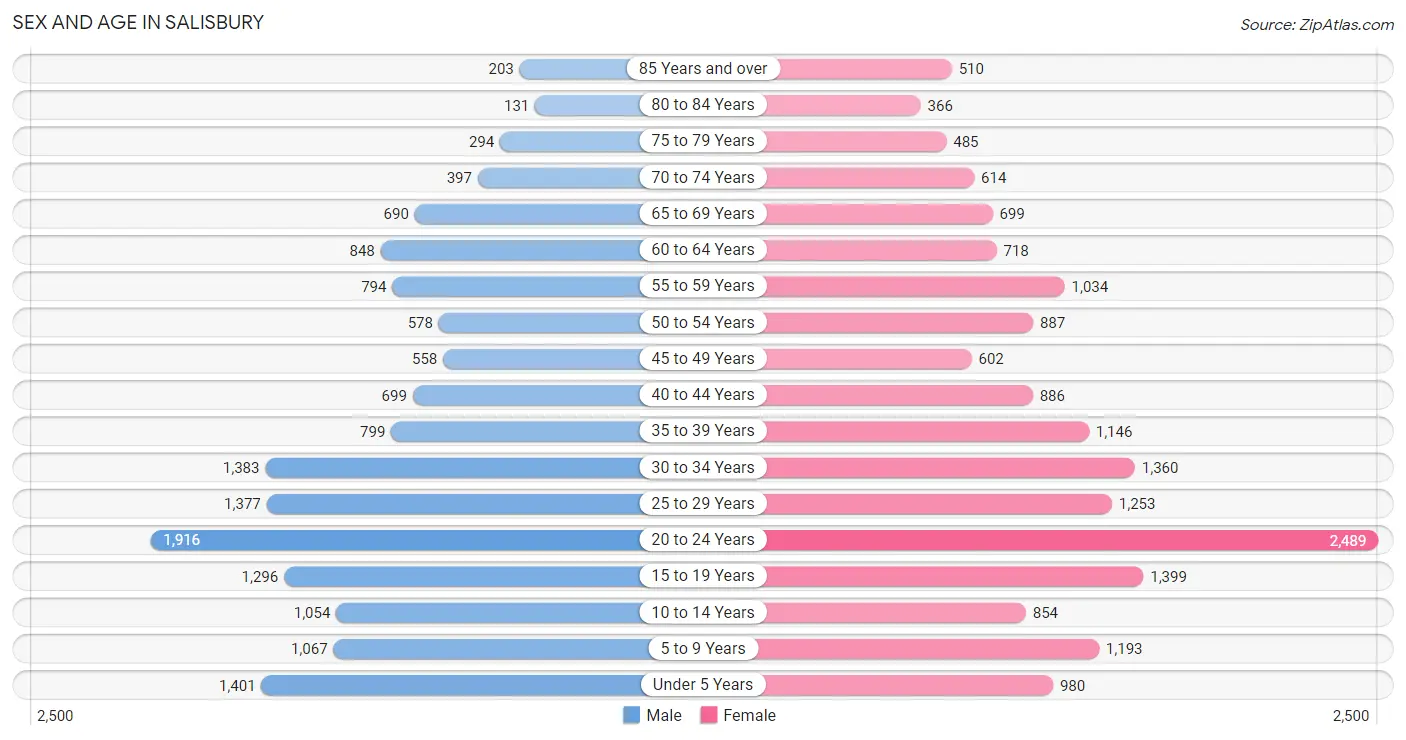
| Age Bracket | Male | Female |
| Under 5 Years | 1,401 (9.0%) | 980 (5.6%) |
| 5 to 9 Years | 1,067 (6.9%) | 1,193 (6.8%) |
| 10 to 14 Years | 1,054 (6.8%) | 854 (4.9%) |
| 15 to 19 Years | 1,296 (8.4%) | 1,399 (8.0%) |
| 20 to 24 Years | 1,916 (12.4%) | 2,489 (14.2%) |
| 25 to 29 Years | 1,377 (8.9%) | 1,253 (7.2%) |
| 30 to 34 Years | 1,383 (8.9%) | 1,360 (7.8%) |
| 35 to 39 Years | 799 (5.2%) | 1,146 (6.6%) |
| 40 to 44 Years | 699 (4.5%) | 886 (5.1%) |
| 45 to 49 Years | 558 (3.6%) | 602 (3.4%) |
| 50 to 54 Years | 578 (3.7%) | 887 (5.1%) |
| 55 to 59 Years | 794 (5.1%) | 1,034 (5.9%) |
| 60 to 64 Years | 848 (5.5%) | 718 (4.1%) |
| 65 to 69 Years | 690 (4.5%) | 699 (4.0%) |
| 70 to 74 Years | 397 (2.6%) | 614 (3.5%) |
| 75 to 79 Years | 294 (1.9%) | 485 (2.8%) |
| 80 to 84 Years | 131 (0.9%) | 366 (2.1%) |
| 85 Years and over | 203 (1.3%) | 510 (2.9%) |
| Total | 15,485 (100.0%) | 17,475 (100.0%) |
Families and Households in Salisbury
Median Family Size in Salisbury
The median family size in Salisbury is 3.07 persons per family, with married-couple families (3,571 | 50.4%) accounting for the largest median family size of 3.39 persons per family. On the other hand, single male/father families (1,114 | 15.7%) represent the smallest median family size with 2.12 persons per family.
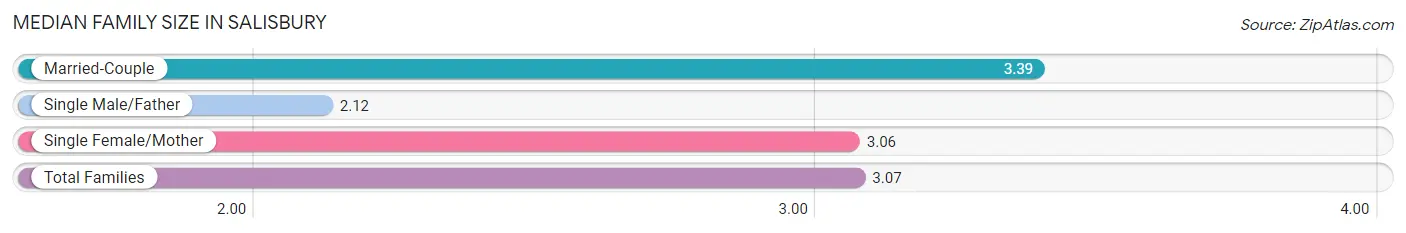
| Family Type | # Families | Family Size |
| Married-Couple | 3,571 (50.4%) | 3.39 |
| Single Male/Father | 1,114 (15.7%) | 2.12 |
| Single Female/Mother | 2,399 (33.9%) | 3.06 |
| Total Families | 7,084 (100.0%) | 3.07 |
Median Household Size in Salisbury
The median household size in Salisbury is 2.37 persons per household, with married-couple households (3,571 | 26.8%) accounting for the largest median household size of 3.41 persons per household. non-family households (6,251 | 46.9%) represent the smallest median household size with 1.43 persons per household.
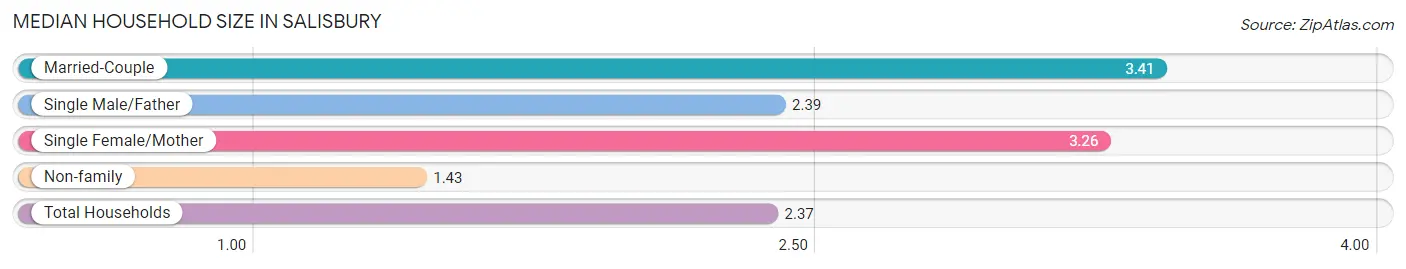
| Household Type | # Households | Household Size |
| Married-Couple | 3,571 (26.8%) | 3.41 |
| Single Male/Father | 1,114 (8.4%) | 2.39 |
| Single Female/Mother | 2,399 (18.0%) | 3.26 |
| Non-family | 6,251 (46.9%) | 1.43 |
| Total Households | 13,335 (100.0%) | 2.37 |
Household Size by Marriage Status in Salisbury
Out of a total of 13,335 households in Salisbury, 7,084 (53.1%) are family households, while 6,251 (46.9%) are nonfamily households. The most numerous type of family households are 2-person households, comprising 2,970, and the most common type of nonfamily households are 1-person households, comprising 4,130.
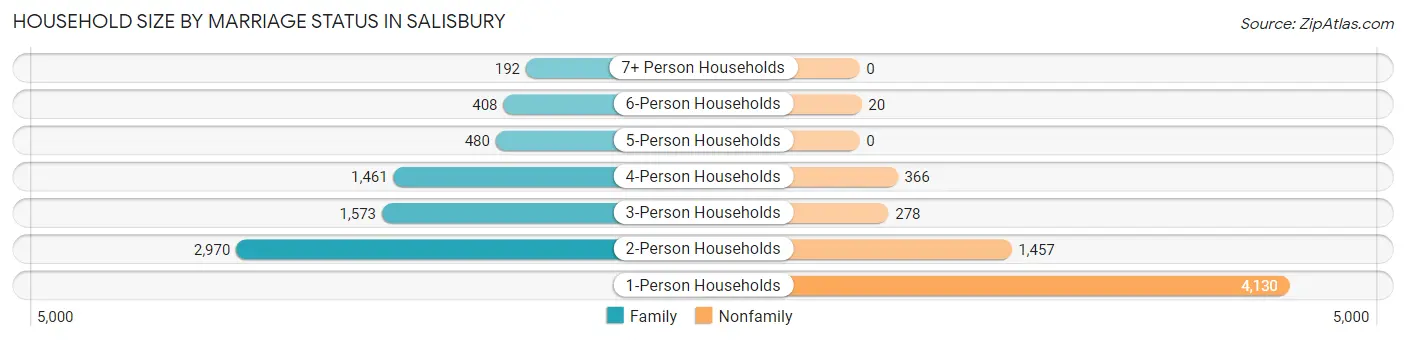
| Household Size | Family Households | Nonfamily Households |
| 1-Person Households | - | 4,130 (31.0%) |
| 2-Person Households | 2,970 (22.3%) | 1,457 (10.9%) |
| 3-Person Households | 1,573 (11.8%) | 278 (2.1%) |
| 4-Person Households | 1,461 (11.0%) | 366 (2.7%) |
| 5-Person Households | 480 (3.6%) | 0 (0.0%) |
| 6-Person Households | 408 (3.1%) | 20 (0.2%) |
| 7+ Person Households | 192 (1.4%) | 0 (0.0%) |
| Total | 7,084 (53.1%) | 6,251 (46.9%) |
Female Fertility in Salisbury
Fertility by Age in Salisbury
Average fertility rate in Salisbury is 18.0 births per 1,000 women. Women in the age bracket of 20 to 34 years have the highest fertility rate with 25.0 births per 1,000 women. Women in the age bracket of 20 to 34 years acount for 78.5% of all women with births.
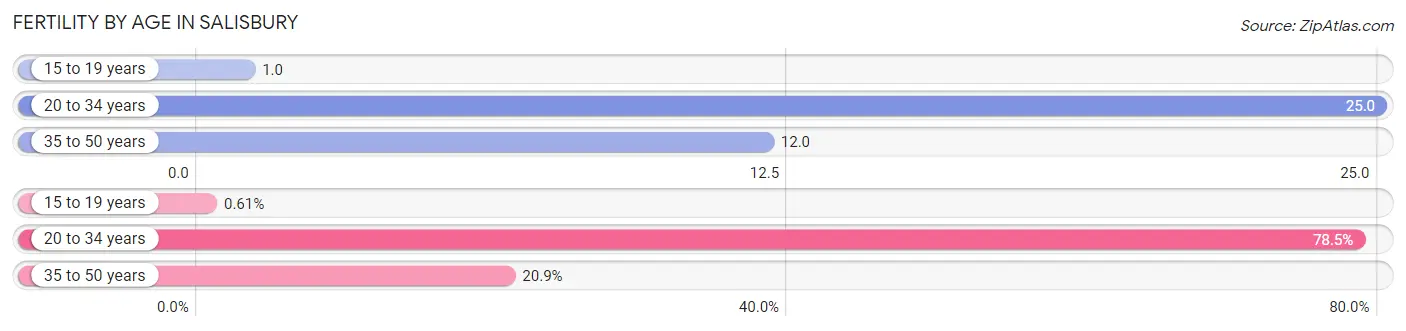
| Age Bracket | Women with Births | Births / 1,000 Women |
| 15 to 19 years | 1 (0.6%) | 1.0 |
| 20 to 34 years | 128 (78.5%) | 25.0 |
| 35 to 50 years | 34 (20.9%) | 12.0 |
| Total | 163 (100.0%) | 18.0 |
Fertility by Age by Marriage Status in Salisbury
33.1% of women with births (163) in Salisbury are married. The highest percentage of unmarried women with births falls into 15 to 19 years age bracket with 100.0% of them unmarried at the time of birth, while the lowest percentage of unmarried women with births belong to 35 to 50 years age bracket with 0.0% of them unmarried.
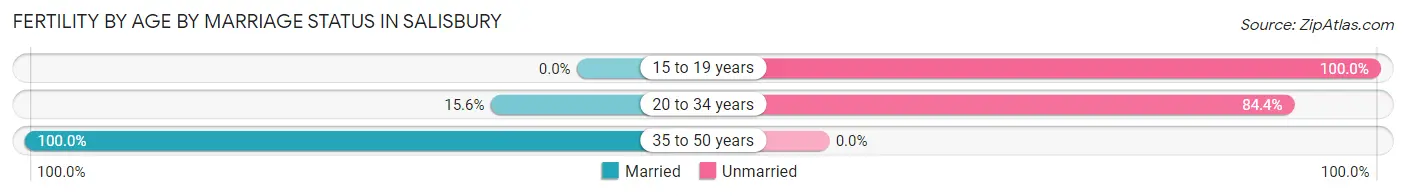
| Age Bracket | Married | Unmarried |
| 15 to 19 years | 0 (0.0%) | 1 (100.0%) |
| 20 to 34 years | 20 (15.6%) | 108 (84.4%) |
| 35 to 50 years | 34 (100.0%) | 0 (0.0%) |
| Total | 54 (33.1%) | 109 (66.9%) |
Fertility by Education in Salisbury
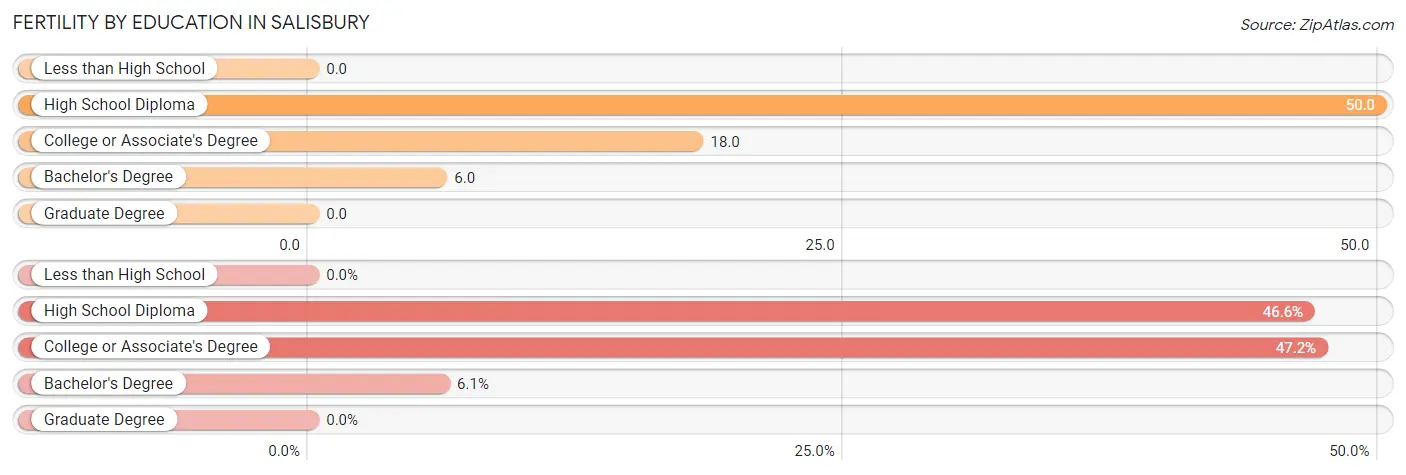
| Educational Attainment | Women with Births | Births / 1,000 Women |
| Less than High School | 0 (0.0%) | 0.0 |
| High School Diploma | 76 (46.6%) | 50.0 |
| College or Associate's Degree | 77 (47.2%) | 18.0 |
| Bachelor's Degree | 10 (6.1%) | 6.0 |
| Graduate Degree | 0 (0.0%) | 0.0 |
| Total | 163 (100.0%) | 18.0 |
Fertility by Education by Marriage Status in Salisbury
66.9% of women with births in Salisbury are unmarried. Women with the educational attainment of high school diploma are most likely to be married with 40.8% of them married at childbirth, while women with the educational attainment of bachelor's degree are least likely to be married with 100.0% of them unmarried at childbirth.
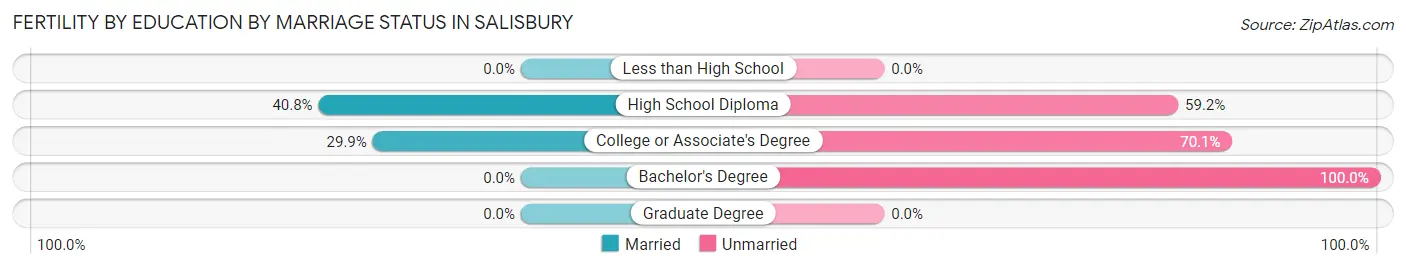
| Educational Attainment | Married | Unmarried |
| Less than High School | 0 (0.0%) | 0 (0.0%) |
| High School Diploma | 31 (40.8%) | 45 (59.2%) |
| College or Associate's Degree | 23 (29.9%) | 54 (70.1%) |
| Bachelor's Degree | 0 (0.0%) | 10 (100.0%) |
| Graduate Degree | 0 (0.0%) | 0 (0.0%) |
| Total | 54 (33.1%) | 109 (66.9%) |
Employment Characteristics in Salisbury
Employment by Class of Employer in Salisbury
Among the 15,399 employed individuals in Salisbury, private company employees (10,431 | 67.7%), state government employees (1,448 | 9.4%), and local government employees (1,349 | 8.8%) make up the most common classes of employment.
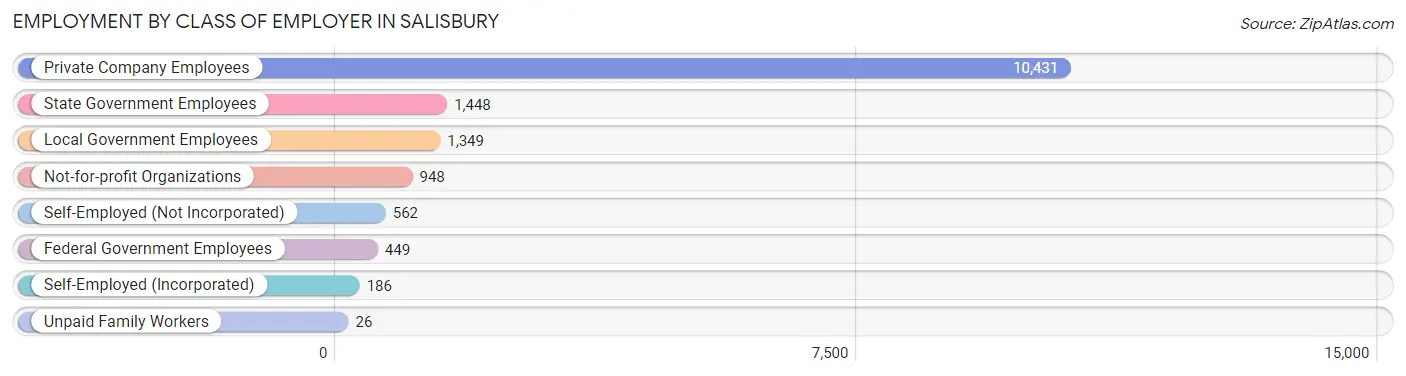
| Employer Class | # Employees | % Employees |
| Private Company Employees | 10,431 | 67.7% |
| Self-Employed (Incorporated) | 186 | 1.2% |
| Self-Employed (Not Incorporated) | 562 | 3.6% |
| Not-for-profit Organizations | 948 | 6.2% |
| Local Government Employees | 1,349 | 8.8% |
| State Government Employees | 1,448 | 9.4% |
| Federal Government Employees | 449 | 2.9% |
| Unpaid Family Workers | 26 | 0.2% |
| Total | 15,399 | 100.0% |
Employment Status by Age in Salisbury
According to the labor force statistics for Salisbury, out of the total population over 16 years of age (26,248), 65.7% or 17,245 individuals are in the labor force, with 9.9% or 1,707 of them unemployed. The age group with the highest labor force participation rate is 30 to 34 years, with 90.3% or 2,477 individuals in the labor force. Within the labor force, the 16 to 19 years age range has the highest percentage of unemployed individuals, with 33.2% or 372 of them being unemployed.
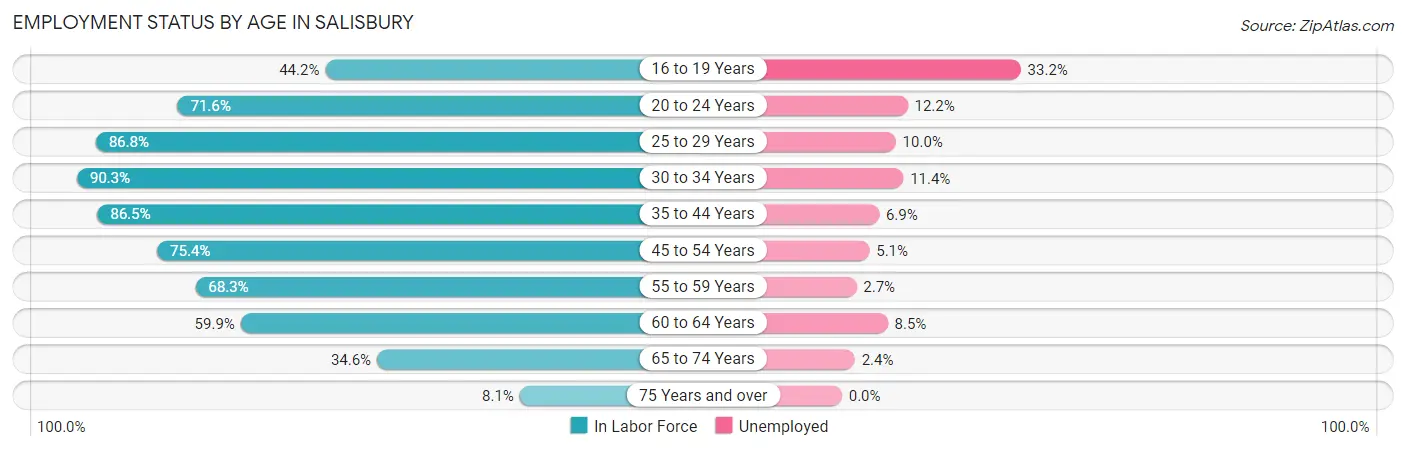
| Age Bracket | In Labor Force | Unemployed |
| 16 to 19 Years | 1,119 (44.2%) | 372 (33.2%) |
| 20 to 24 Years | 3,154 (71.6%) | 385 (12.2%) |
| 25 to 29 Years | 2,283 (86.8%) | 228 (10.0%) |
| 30 to 34 Years | 2,477 (90.3%) | 282 (11.4%) |
| 35 to 44 Years | 3,053 (86.5%) | 211 (6.9%) |
| 45 to 54 Years | 1,979 (75.4%) | 101 (5.1%) |
| 55 to 59 Years | 1,249 (68.3%) | 34 (2.7%) |
| 60 to 64 Years | 938 (59.9%) | 80 (8.5%) |
| 65 to 74 Years | 830 (34.6%) | 20 (2.4%) |
| 75 Years and over | 161 (8.1%) | 0 (0.0%) |
| Total | 17,245 (65.7%) | 1,707 (9.9%) |
Employment Status by Educational Attainment in Salisbury
According to labor force statistics for Salisbury, 80.3% of individuals (11,982) out of the total population between 25 and 64 years of age (14,922) are in the labor force, with 7.8% or 935 of them being unemployed. The group with the highest labor force participation rate are those with the educational attainment of bachelor's degree or higher, with 90.8% or 3,837 individuals in the labor force. Within the labor force, individuals with high school diploma education have the highest percentage of unemployment, with 11.1% or 394 of them being unemployed.
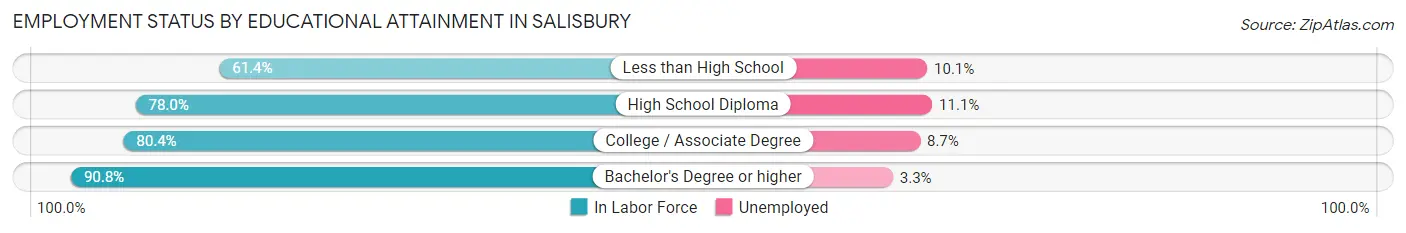
| Educational Attainment | In Labor Force | Unemployed |
| Less than High School | 1,133 (61.4%) | 186 (10.1%) |
| High School Diploma | 3,553 (78.0%) | 506 (11.1%) |
| College / Associate Degree | 3,454 (80.4%) | 374 (8.7%) |
| Bachelor's Degree or higher | 3,837 (90.8%) | 139 (3.3%) |
| Total | 11,982 (80.3%) | 1,164 (7.8%) |
Employment Occupations by Sex in Salisbury
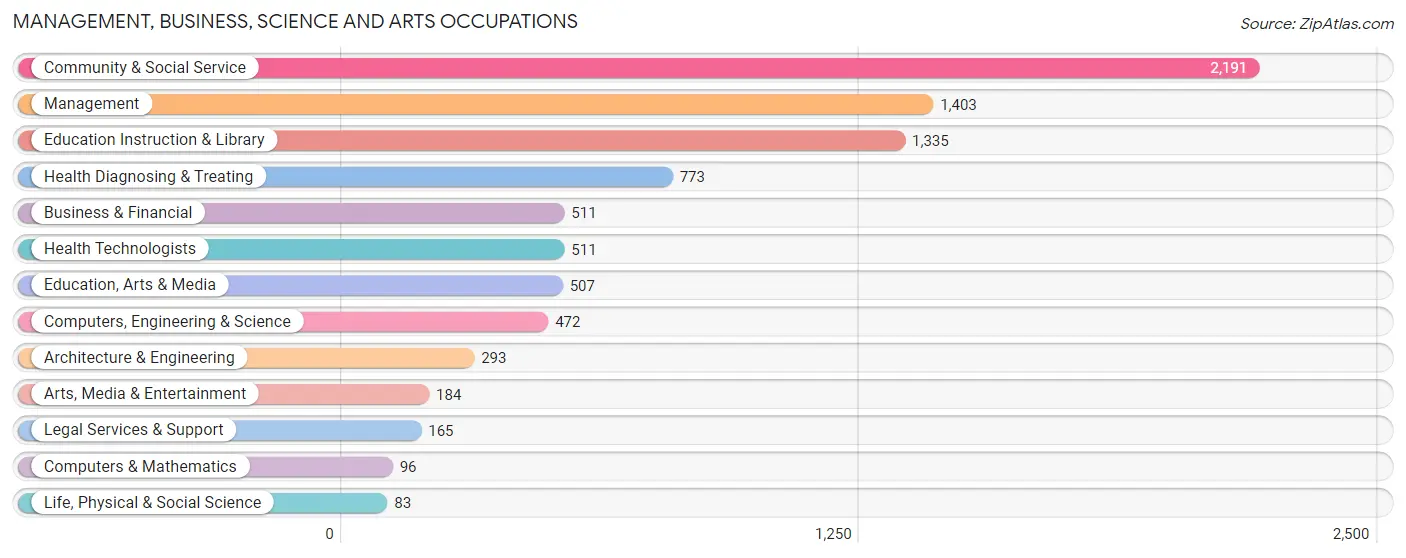
Management, Business, Science and Arts Occupations
The most common Management, Business, Science and Arts occupations in Salisbury are Community & Social Service (2,191 | 14.2%), Management (1,403 | 9.1%), Education Instruction & Library (1,335 | 8.6%), Health Diagnosing & Treating (773 | 5.0%), and Business & Financial (511 | 3.3%).
Management, Business, Science and Arts Occupations by Sex
Within the Management, Business, Science and Arts occupations in Salisbury, the most male-oriented occupations are Architecture & Engineering (87.4%), Computers, Engineering & Science (82.6%), and Computers & Mathematics (77.1%), while the most female-oriented occupations are Health Technologists (78.5%), Business & Financial (78.1%), and Education Instruction & Library (75.4%).
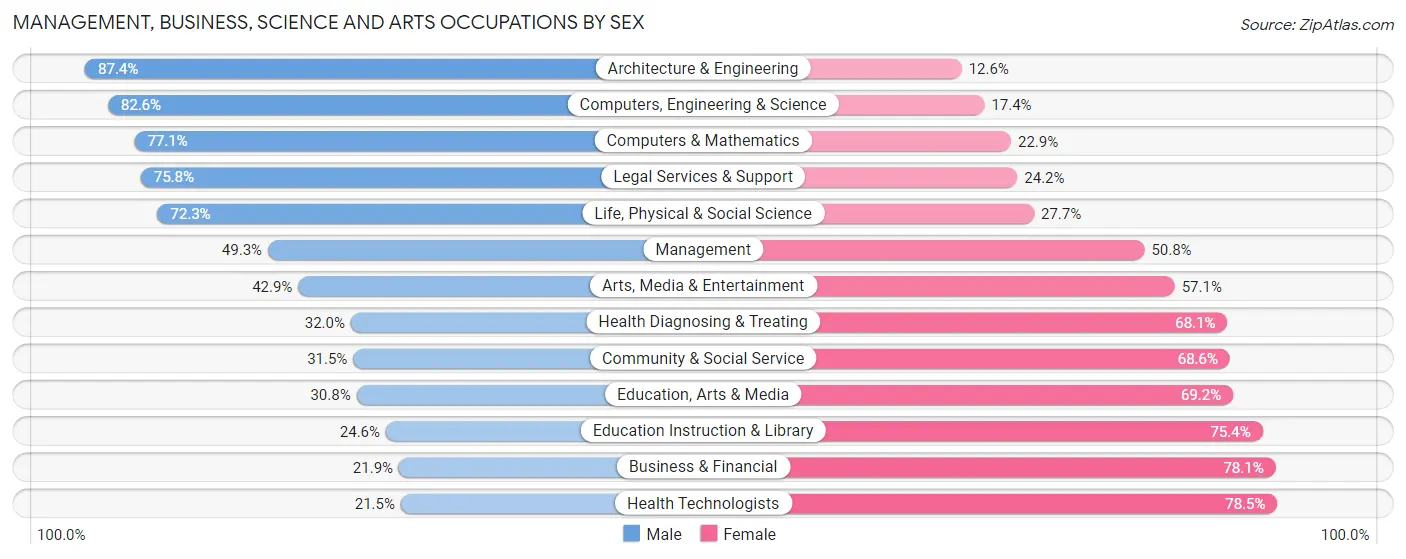
| Occupation | Male | Female |
| Management | 691 (49.2%) | 712 (50.7%) |
| Business & Financial | 112 (21.9%) | 399 (78.1%) |
| Computers, Engineering & Science | 390 (82.6%) | 82 (17.4%) |
| Computers & Mathematics | 74 (77.1%) | 22 (22.9%) |
| Architecture & Engineering | 256 (87.4%) | 37 (12.6%) |
| Life, Physical & Social Science | 60 (72.3%) | 23 (27.7%) |
| Community & Social Service | 689 (31.5%) | 1,502 (68.5%) |
| Education, Arts & Media | 156 (30.8%) | 351 (69.2%) |
| Legal Services & Support | 125 (75.8%) | 40 (24.2%) |
| Education Instruction & Library | 329 (24.6%) | 1,006 (75.4%) |
| Arts, Media & Entertainment | 79 (42.9%) | 105 (57.1%) |
| Health Diagnosing & Treating | 247 (32.0%) | 526 (68.0%) |
| Health Technologists | 110 (21.5%) | 401 (78.5%) |
| Total (Category) | 2,129 (39.8%) | 3,221 (60.2%) |
| Total (Overall) | 7,581 (49.1%) | 7,847 (50.9%) |
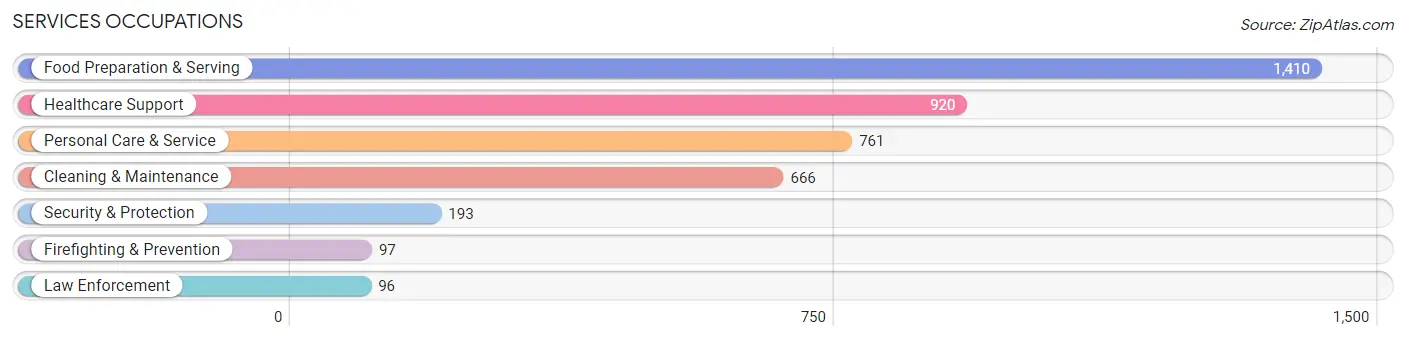
Services Occupations
The most common Services occupations in Salisbury are Food Preparation & Serving (1,410 | 9.1%), Healthcare Support (920 | 6.0%), Personal Care & Service (761 | 4.9%), Cleaning & Maintenance (666 | 4.3%), and Security & Protection (193 | 1.3%).
Services Occupations by Sex
Within the Services occupations in Salisbury, the most male-oriented occupations are Firefighting & Prevention (100.0%), Security & Protection (83.4%), and Law Enforcement (66.7%), while the most female-oriented occupations are Healthcare Support (74.9%), Food Preparation & Serving (65.9%), and Personal Care & Service (60.2%).
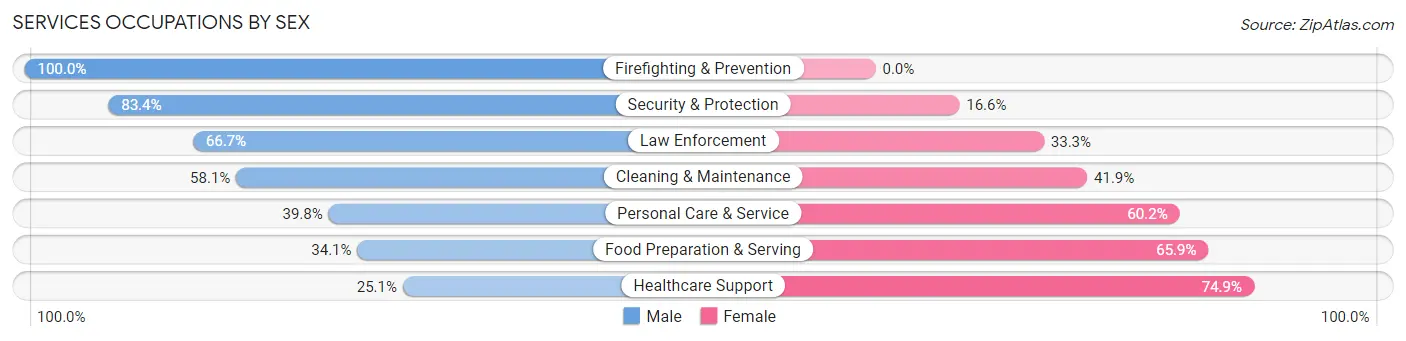
| Occupation | Male | Female |
| Healthcare Support | 231 (25.1%) | 689 (74.9%) |
| Security & Protection | 161 (83.4%) | 32 (16.6%) |
| Firefighting & Prevention | 97 (100.0%) | 0 (0.0%) |
| Law Enforcement | 64 (66.7%) | 32 (33.3%) |
| Food Preparation & Serving | 481 (34.1%) | 929 (65.9%) |
| Cleaning & Maintenance | 387 (58.1%) | 279 (41.9%) |
| Personal Care & Service | 303 (39.8%) | 458 (60.2%) |
| Total (Category) | 1,563 (39.6%) | 2,387 (60.4%) |
| Total (Overall) | 7,581 (49.1%) | 7,847 (50.9%) |
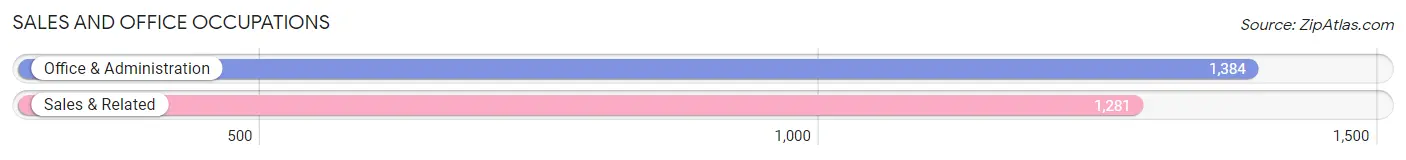
Sales and Office Occupations
The most common Sales and Office occupations in Salisbury are Office & Administration (1,384 | 9.0%), and Sales & Related (1,281 | 8.3%).
Sales and Office Occupations by Sex
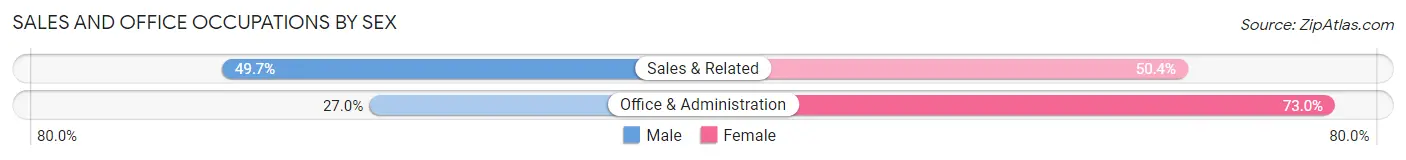
| Occupation | Male | Female |
| Sales & Related | 636 (49.6%) | 645 (50.3%) |
| Office & Administration | 374 (27.0%) | 1,010 (73.0%) |
| Total (Category) | 1,010 (37.9%) | 1,655 (62.1%) |
| Total (Overall) | 7,581 (49.1%) | 7,847 (50.9%) |
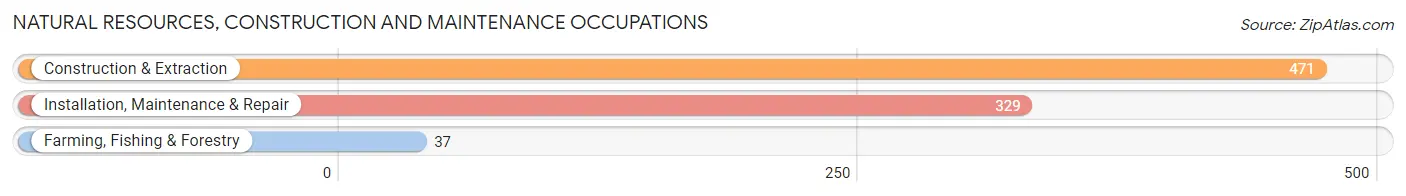
Natural Resources, Construction and Maintenance Occupations
The most common Natural Resources, Construction and Maintenance occupations in Salisbury are Construction & Extraction (471 | 3.0%), Installation, Maintenance & Repair (329 | 2.1%), and Farming, Fishing & Forestry (37 | 0.2%).
Natural Resources, Construction and Maintenance Occupations by Sex
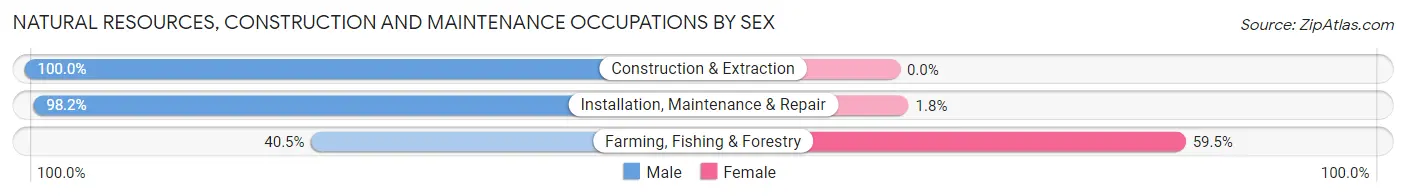
| Occupation | Male | Female |
| Farming, Fishing & Forestry | 15 (40.5%) | 22 (59.5%) |
| Construction & Extraction | 471 (100.0%) | 0 (0.0%) |
| Installation, Maintenance & Repair | 323 (98.2%) | 6 (1.8%) |
| Total (Category) | 809 (96.7%) | 28 (3.4%) |
| Total (Overall) | 7,581 (49.1%) | 7,847 (50.9%) |
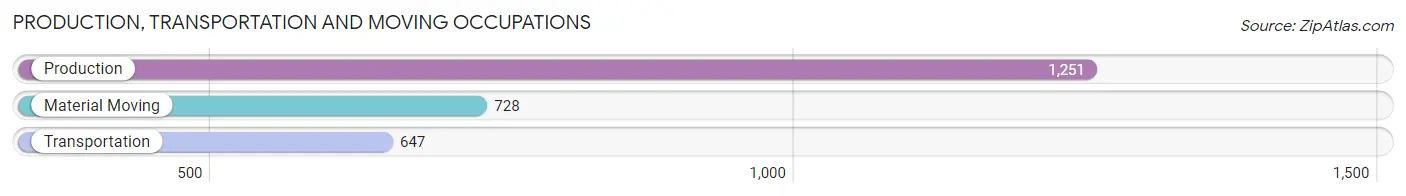
Production, Transportation and Moving Occupations
The most common Production, Transportation and Moving occupations in Salisbury are Production (1,251 | 8.1%), Material Moving (728 | 4.7%), and Transportation (647 | 4.2%).
Production, Transportation and Moving Occupations by Sex
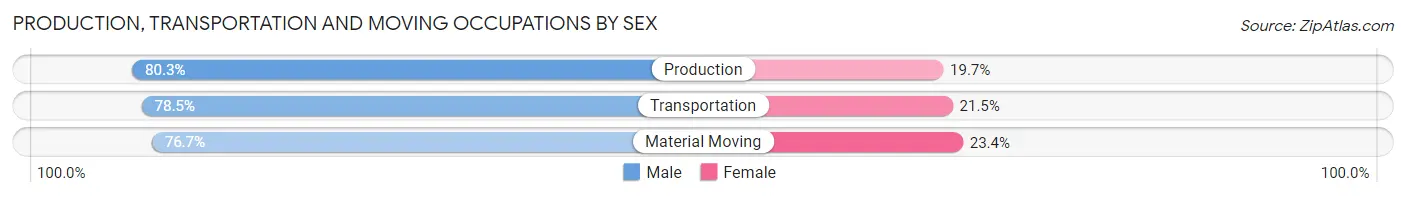
| Occupation | Male | Female |
| Production | 1,004 (80.3%) | 247 (19.7%) |
| Transportation | 508 (78.5%) | 139 (21.5%) |
| Material Moving | 558 (76.6%) | 170 (23.4%) |
| Total (Category) | 2,070 (78.8%) | 556 (21.2%) |
| Total (Overall) | 7,581 (49.1%) | 7,847 (50.9%) |
Employment Industries by Sex in Salisbury
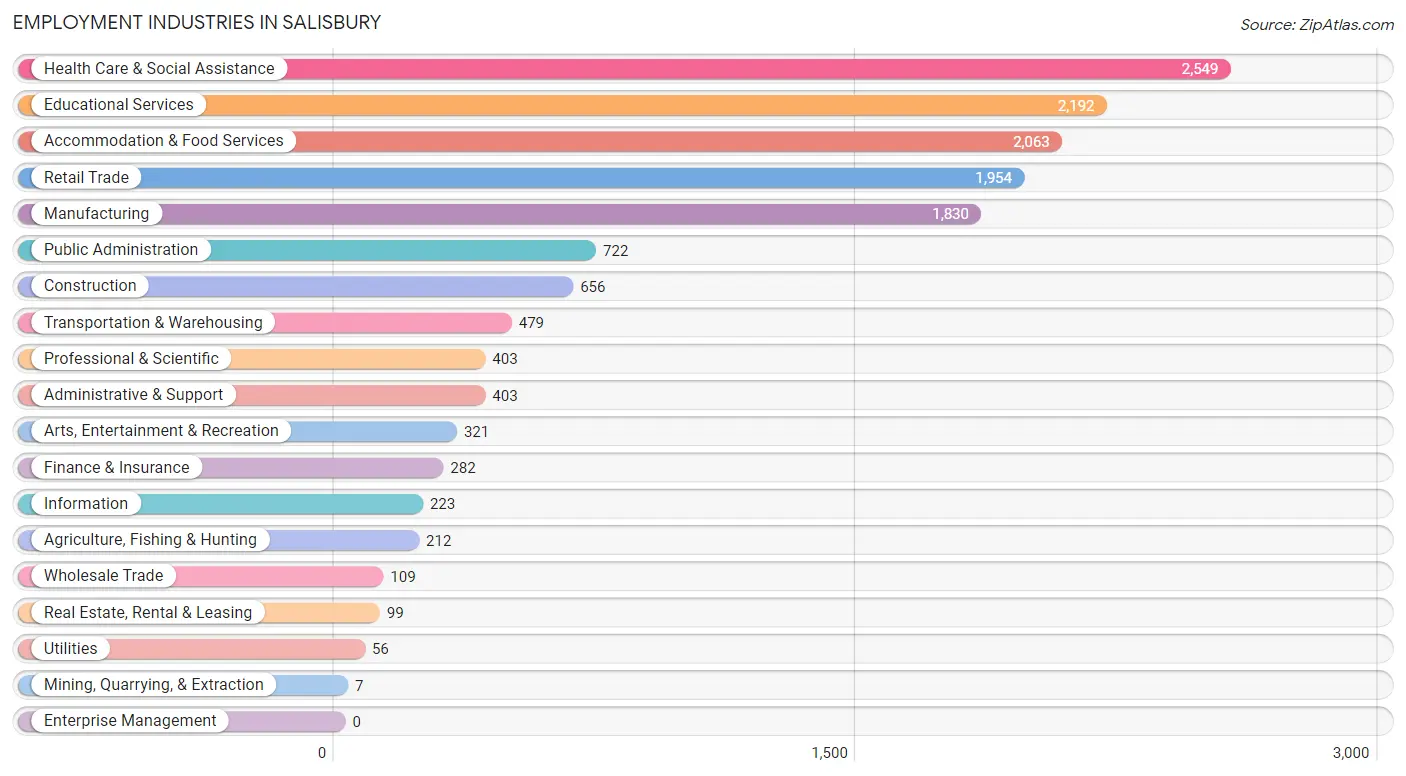
Employment Industries in Salisbury
The major employment industries in Salisbury include Health Care & Social Assistance (2,549 | 16.5%), Educational Services (2,192 | 14.2%), Accommodation & Food Services (2,063 | 13.4%), Retail Trade (1,954 | 12.7%), and Manufacturing (1,830 | 11.9%).
Employment Industries by Sex in Salisbury
The Salisbury industries that see more men than women are Mining, Quarrying, & Extraction (100.0%), Utilities (100.0%), and Construction (93.4%), whereas the industries that tend to have a higher number of women are Health Care & Social Assistance (74.7%), Educational Services (70.5%), and Public Administration (65.0%).
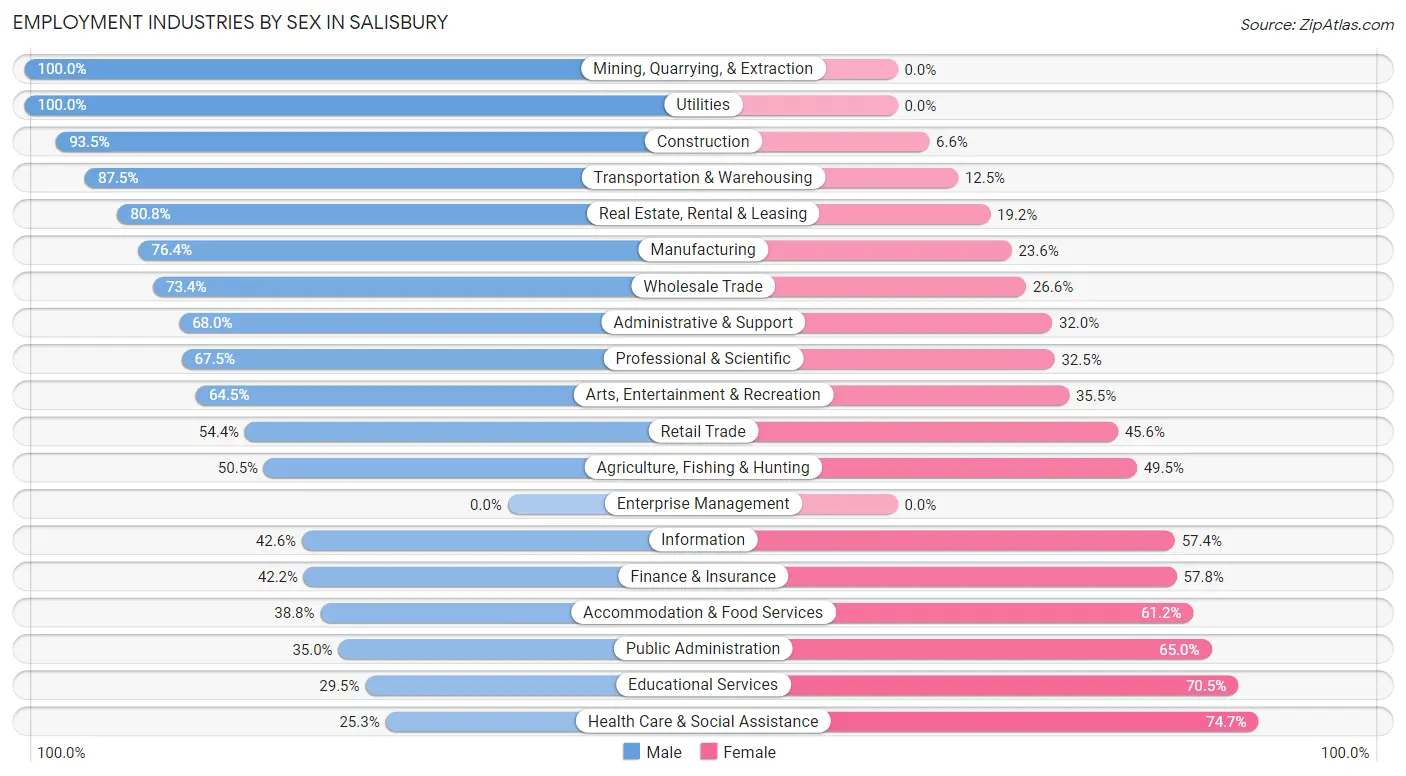
| Industry | Male | Female |
| Agriculture, Fishing & Hunting | 107 (50.5%) | 105 (49.5%) |
| Mining, Quarrying, & Extraction | 7 (100.0%) | 0 (0.0%) |
| Construction | 613 (93.4%) | 43 (6.6%) |
| Manufacturing | 1,398 (76.4%) | 432 (23.6%) |
| Wholesale Trade | 80 (73.4%) | 29 (26.6%) |
| Retail Trade | 1,063 (54.4%) | 891 (45.6%) |
| Transportation & Warehousing | 419 (87.5%) | 60 (12.5%) |
| Utilities | 56 (100.0%) | 0 (0.0%) |
| Information | 95 (42.6%) | 128 (57.4%) |
| Finance & Insurance | 119 (42.2%) | 163 (57.8%) |
| Real Estate, Rental & Leasing | 80 (80.8%) | 19 (19.2%) |
| Professional & Scientific | 272 (67.5%) | 131 (32.5%) |
| Enterprise Management | 0 (0.0%) | 0 (0.0%) |
| Administrative & Support | 274 (68.0%) | 129 (32.0%) |
| Educational Services | 646 (29.5%) | 1,546 (70.5%) |
| Health Care & Social Assistance | 645 (25.3%) | 1,904 (74.7%) |
| Arts, Entertainment & Recreation | 207 (64.5%) | 114 (35.5%) |
| Accommodation & Food Services | 800 (38.8%) | 1,263 (61.2%) |
| Public Administration | 253 (35.0%) | 469 (65.0%) |
| Total | 7,581 (49.1%) | 7,847 (50.9%) |
Education in Salisbury
School Enrollment in Salisbury
The most common levels of schooling among the 10,668 students in Salisbury are college / undergraduate (4,457 | 41.8%), middle school (1,442 | 13.5%), and elementary school (1,418 | 13.3%).
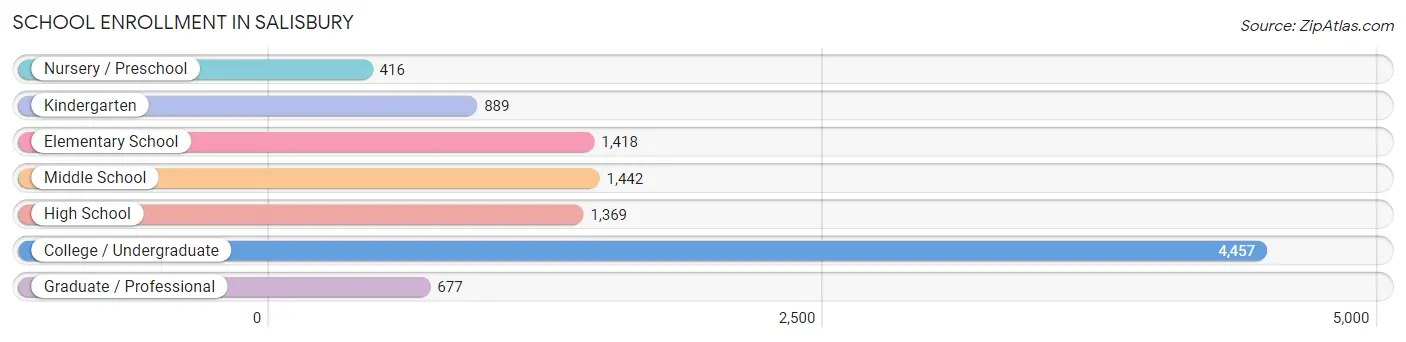
| School Level | # Students | % Students |
| Nursery / Preschool | 416 | 3.9% |
| Kindergarten | 889 | 8.3% |
| Elementary School | 1,418 | 13.3% |
| Middle School | 1,442 | 13.5% |
| High School | 1,369 | 12.8% |
| College / Undergraduate | 4,457 | 41.8% |
| Graduate / Professional | 677 | 6.4% |
| Total | 10,668 | 100.0% |
School Enrollment by Age by Funding Source in Salisbury
Out of a total of 10,668 students who are enrolled in schools in Salisbury, 875 (8.2%) attend a private institution, while the remaining 9,793 (91.8%) are enrolled in public schools. The age group of 3 to 4 year olds has the highest likelihood of being enrolled in private schools, with 261 (38.3% in the age bracket) enrolled. Conversely, the age group of 10 to 14 year olds has the lowest likelihood of being enrolled in a private school, with 1,854 (98.6% in the age bracket) attending a public institution.
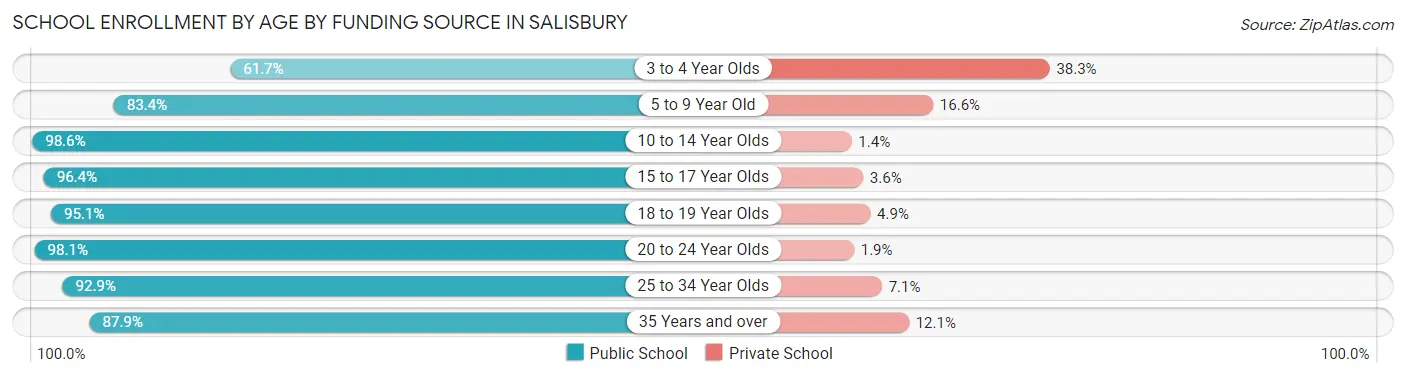
| Age Bracket | Public School | Private School |
| 3 to 4 Year Olds | 420 (61.7%) | 261 (38.3%) |
| 5 to 9 Year Old | 1,625 (83.4%) | 324 (16.6%) |
| 10 to 14 Year Olds | 1,854 (98.6%) | 27 (1.4%) |
| 15 to 17 Year Olds | 834 (96.4%) | 31 (3.6%) |
| 18 to 19 Year Olds | 1,369 (95.1%) | 71 (4.9%) |
| 20 to 24 Year Olds | 2,666 (98.1%) | 51 (1.9%) |
| 25 to 34 Year Olds | 472 (92.9%) | 36 (7.1%) |
| 35 Years and over | 551 (87.9%) | 76 (12.1%) |
| Total | 9,793 (91.8%) | 875 (8.2%) |
Educational Attainment by Field of Study in Salisbury
Business (1,150 | 19.8%), education (789 | 13.6%), arts & humanities (548 | 9.5%), science & technology (487 | 8.4%), and psychology (446 | 7.7%) are the most common fields of study among 5,802 individuals in Salisbury who have obtained a bachelor's degree or higher.
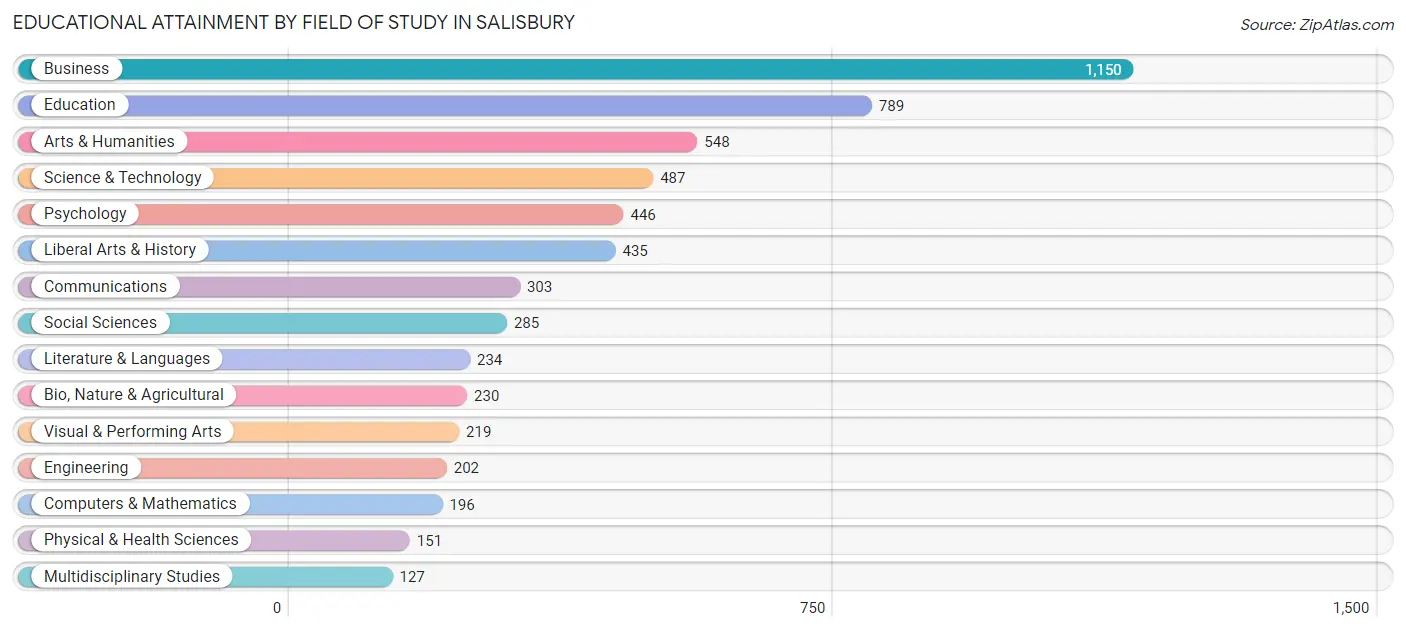
| Field of Study | # Graduates | % Graduates |
| Computers & Mathematics | 196 | 3.4% |
| Bio, Nature & Agricultural | 230 | 4.0% |
| Physical & Health Sciences | 151 | 2.6% |
| Psychology | 446 | 7.7% |
| Social Sciences | 285 | 4.9% |
| Engineering | 202 | 3.5% |
| Multidisciplinary Studies | 127 | 2.2% |
| Science & Technology | 487 | 8.4% |
| Business | 1,150 | 19.8% |
| Education | 789 | 13.6% |
| Literature & Languages | 234 | 4.0% |
| Liberal Arts & History | 435 | 7.5% |
| Visual & Performing Arts | 219 | 3.8% |
| Communications | 303 | 5.2% |
| Arts & Humanities | 548 | 9.5% |
| Total | 5,802 | 100.0% |
Transportation & Commute in Salisbury
Vehicle Availability by Sex in Salisbury
The most prevalent vehicle ownership categories in Salisbury are males with 2 vehicles (3,770, accounting for 49.8%) and females with 2 vehicles (2,998, making up 50.2%).
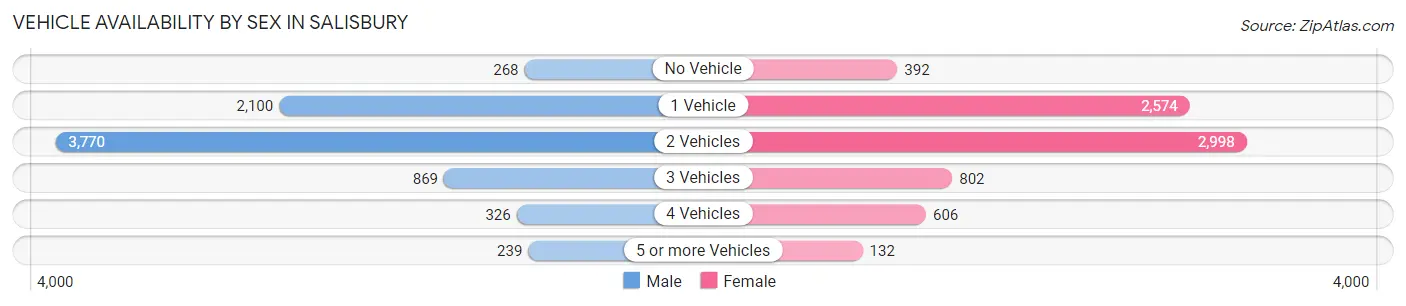
| Vehicles Available | Male | Female |
| No Vehicle | 268 (3.5%) | 392 (5.2%) |
| 1 Vehicle | 2,100 (27.7%) | 2,574 (34.3%) |
| 2 Vehicles | 3,770 (49.8%) | 2,998 (40.0%) |
| 3 Vehicles | 869 (11.5%) | 802 (10.7%) |
| 4 Vehicles | 326 (4.3%) | 606 (8.1%) |
| 5 or more Vehicles | 239 (3.2%) | 132 (1.8%) |
| Total | 7,572 (100.0%) | 7,504 (100.0%) |
Commute Time in Salisbury
The most frequently occuring commute durations in Salisbury are 15 to 19 minutes (3,071 commuters, 20.6%), 10 to 14 minutes (2,986 commuters, 20.0%), and 5 to 9 minutes (2,739 commuters, 18.3%).
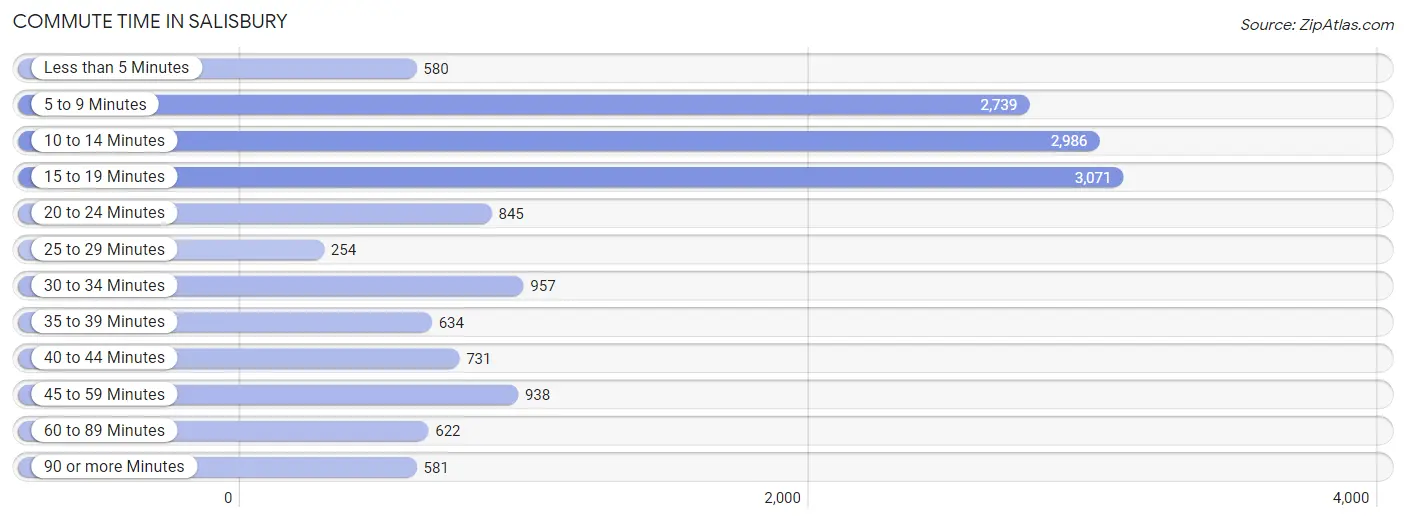
| Commute Time | # Commuters | % Commuters |
| Less than 5 Minutes | 580 | 3.9% |
| 5 to 9 Minutes | 2,739 | 18.3% |
| 10 to 14 Minutes | 2,986 | 20.0% |
| 15 to 19 Minutes | 3,071 | 20.6% |
| 20 to 24 Minutes | 845 | 5.7% |
| 25 to 29 Minutes | 254 | 1.7% |
| 30 to 34 Minutes | 957 | 6.4% |
| 35 to 39 Minutes | 634 | 4.2% |
| 40 to 44 Minutes | 731 | 4.9% |
| 45 to 59 Minutes | 938 | 6.3% |
| 60 to 89 Minutes | 622 | 4.2% |
| 90 or more Minutes | 581 | 3.9% |
Commute Time by Sex in Salisbury
The most common commute times in Salisbury are 10 to 14 minutes (1,442 commuters, 19.3%) for males and 15 to 19 minutes (1,764 commuters, 23.7%) for females.
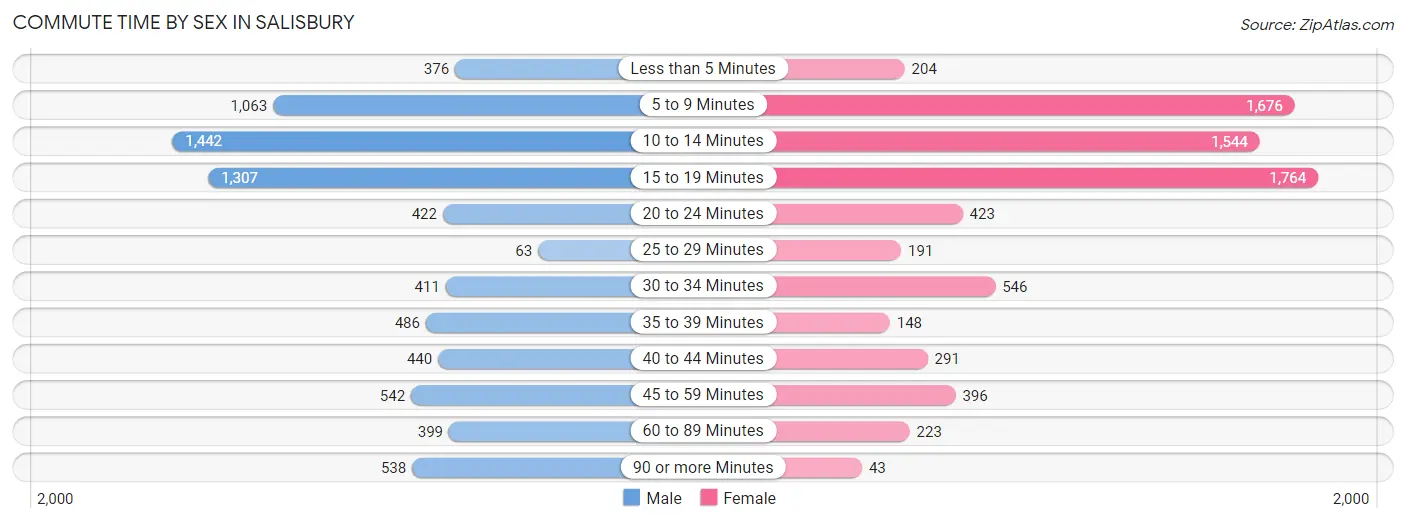
| Commute Time | Male | Female |
| Less than 5 Minutes | 376 (5.0%) | 204 (2.7%) |
| 5 to 9 Minutes | 1,063 (14.2%) | 1,676 (22.5%) |
| 10 to 14 Minutes | 1,442 (19.3%) | 1,544 (20.7%) |
| 15 to 19 Minutes | 1,307 (17.4%) | 1,764 (23.7%) |
| 20 to 24 Minutes | 422 (5.6%) | 423 (5.7%) |
| 25 to 29 Minutes | 63 (0.8%) | 191 (2.6%) |
| 30 to 34 Minutes | 411 (5.5%) | 546 (7.3%) |
| 35 to 39 Minutes | 486 (6.5%) | 148 (2.0%) |
| 40 to 44 Minutes | 440 (5.9%) | 291 (3.9%) |
| 45 to 59 Minutes | 542 (7.2%) | 396 (5.3%) |
| 60 to 89 Minutes | 399 (5.3%) | 223 (3.0%) |
| 90 or more Minutes | 538 (7.2%) | 43 (0.6%) |
Time of Departure to Work by Sex in Salisbury
The most frequent times of departure to work in Salisbury are 7:00 AM to 7:29 AM (1,355, 18.1%) for males and 7:30 AM to 7:59 AM (1,029, 13.8%) for females.
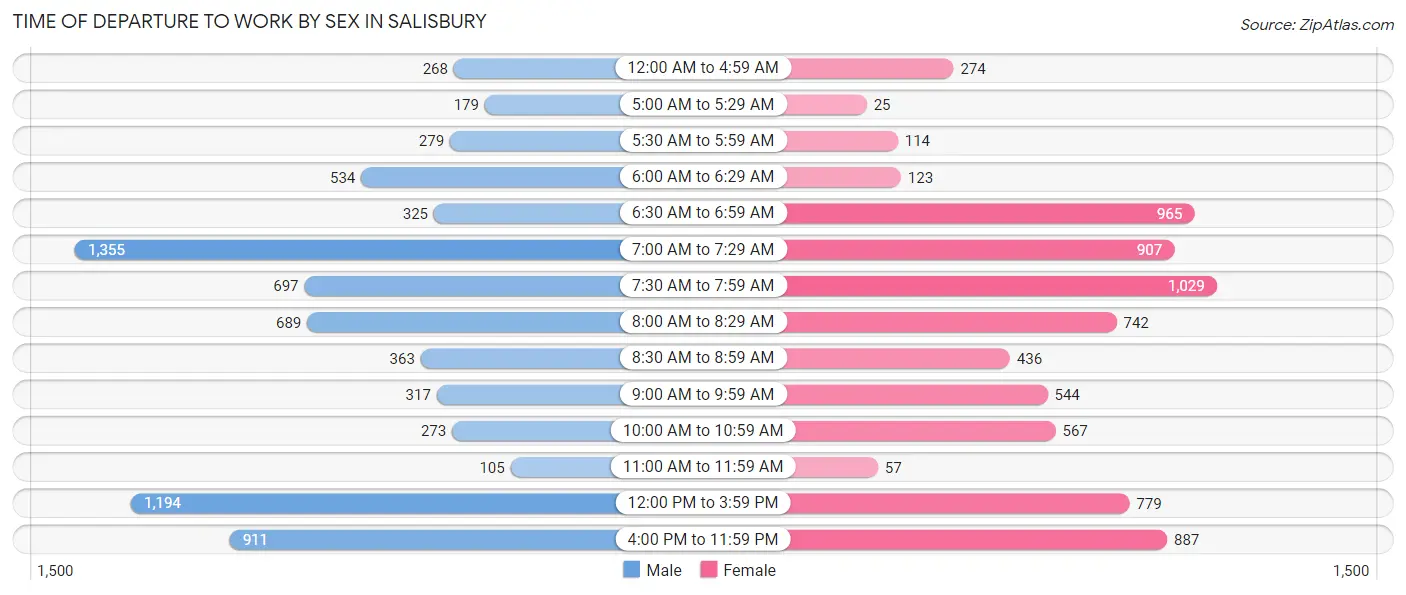
| Time of Departure | Male | Female |
| 12:00 AM to 4:59 AM | 268 (3.6%) | 274 (3.7%) |
| 5:00 AM to 5:29 AM | 179 (2.4%) | 25 (0.3%) |
| 5:30 AM to 5:59 AM | 279 (3.7%) | 114 (1.5%) |
| 6:00 AM to 6:29 AM | 534 (7.1%) | 123 (1.7%) |
| 6:30 AM to 6:59 AM | 325 (4.3%) | 965 (13.0%) |
| 7:00 AM to 7:29 AM | 1,355 (18.1%) | 907 (12.2%) |
| 7:30 AM to 7:59 AM | 697 (9.3%) | 1,029 (13.8%) |
| 8:00 AM to 8:29 AM | 689 (9.2%) | 742 (10.0%) |
| 8:30 AM to 8:59 AM | 363 (4.9%) | 436 (5.9%) |
| 9:00 AM to 9:59 AM | 317 (4.2%) | 544 (7.3%) |
| 10:00 AM to 10:59 AM | 273 (3.6%) | 567 (7.6%) |
| 11:00 AM to 11:59 AM | 105 (1.4%) | 57 (0.8%) |
| 12:00 PM to 3:59 PM | 1,194 (15.9%) | 779 (10.5%) |
| 4:00 PM to 11:59 PM | 911 (12.2%) | 887 (11.9%) |
| Total | 7,489 (100.0%) | 7,449 (100.0%) |
Housing Occupancy in Salisbury
Occupancy by Ownership in Salisbury
Of the total 13,335 dwellings in Salisbury, owner-occupied units account for 3,435 (25.8%), while renter-occupied units make up 9,900 (74.2%).
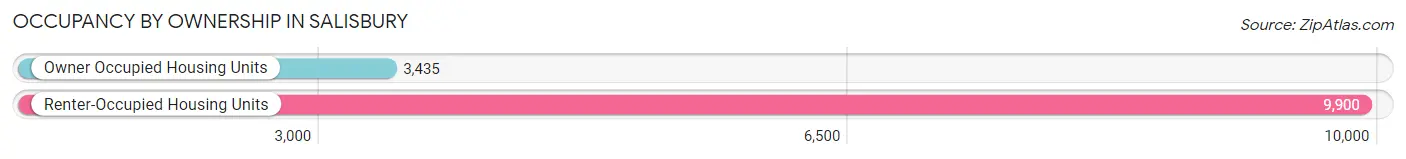
| Occupancy | # Housing Units | % Housing Units |
| Owner Occupied Housing Units | 3,435 | 25.8% |
| Renter-Occupied Housing Units | 9,900 | 74.2% |
| Total Occupied Housing Units | 13,335 | 100.0% |
Occupancy by Household Size in Salisbury
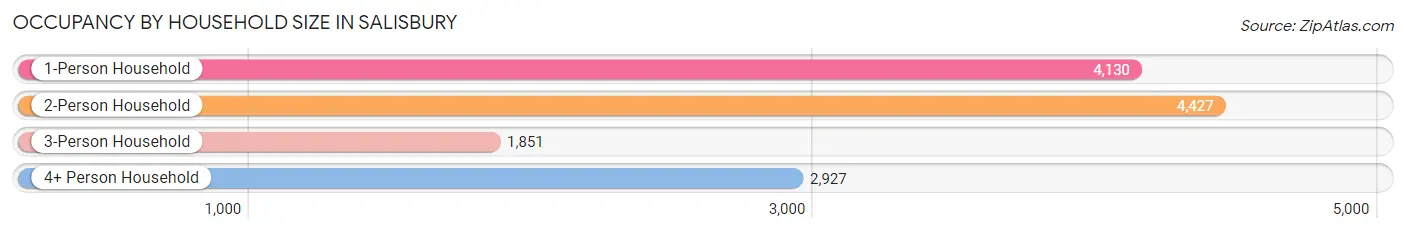
| Household Size | # Housing Units | % Housing Units |
| 1-Person Household | 4,130 | 31.0% |
| 2-Person Household | 4,427 | 33.2% |
| 3-Person Household | 1,851 | 13.9% |
| 4+ Person Household | 2,927 | 22.0% |
| Total Housing Units | 13,335 | 100.0% |
Occupancy by Ownership by Household Size in Salisbury
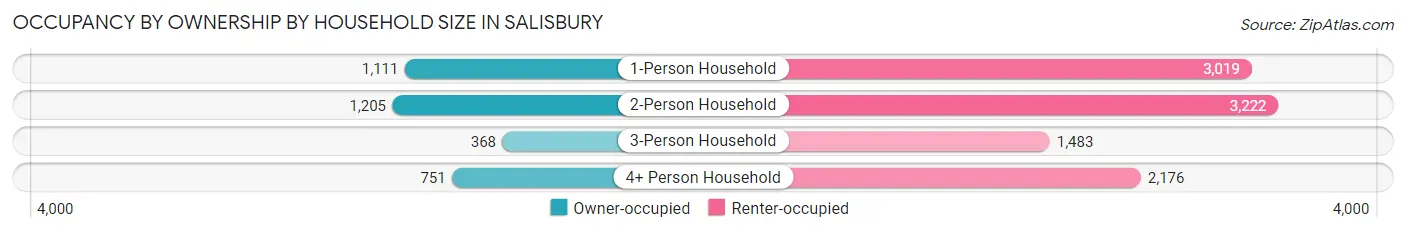
| Household Size | Owner-occupied | Renter-occupied |
| 1-Person Household | 1,111 (26.9%) | 3,019 (73.1%) |
| 2-Person Household | 1,205 (27.2%) | 3,222 (72.8%) |
| 3-Person Household | 368 (19.9%) | 1,483 (80.1%) |
| 4+ Person Household | 751 (25.7%) | 2,176 (74.3%) |
| Total Housing Units | 3,435 (25.8%) | 9,900 (74.2%) |
Occupancy by Educational Attainment in Salisbury
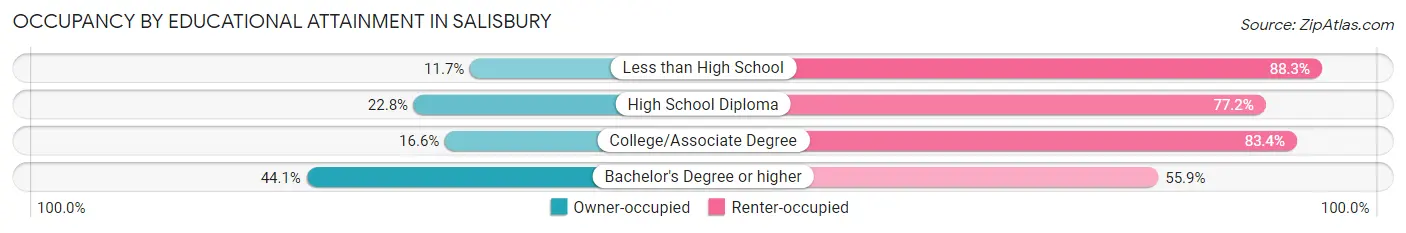
| Household Size | Owner-occupied | Renter-occupied |
| Less than High School | 146 (11.7%) | 1,106 (88.3%) |
| High School Diploma | 882 (22.8%) | 2,984 (77.2%) |
| College/Associate Degree | 735 (16.6%) | 3,688 (83.4%) |
| Bachelor's Degree or higher | 1,672 (44.1%) | 2,122 (55.9%) |
Occupancy by Age of Householder in Salisbury
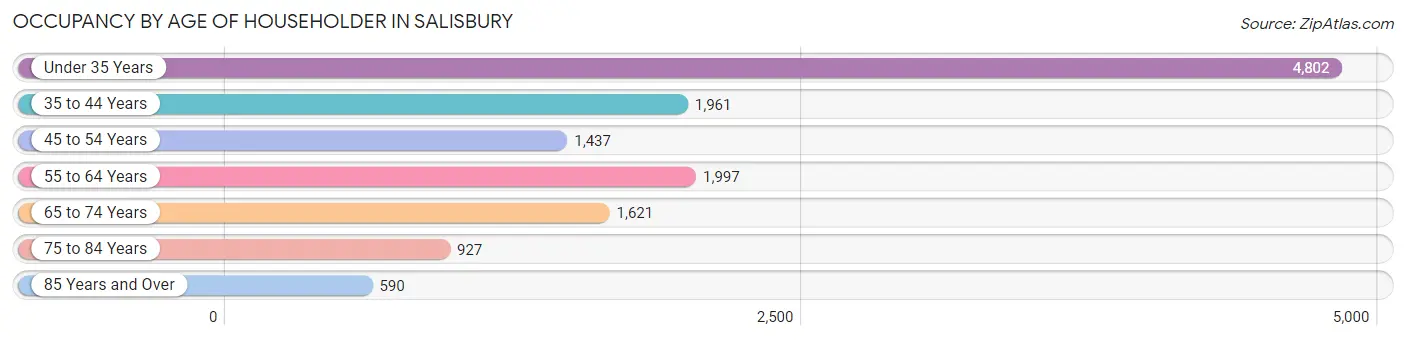
| Age Bracket | # Households | % Households |
| Under 35 Years | 4,802 | 36.0% |
| 35 to 44 Years | 1,961 | 14.7% |
| 45 to 54 Years | 1,437 | 10.8% |
| 55 to 64 Years | 1,997 | 15.0% |
| 65 to 74 Years | 1,621 | 12.2% |
| 75 to 84 Years | 927 | 7.0% |
| 85 Years and Over | 590 | 4.4% |
| Total | 13,335 | 100.0% |
Housing Finances in Salisbury
Median Income by Occupancy in Salisbury
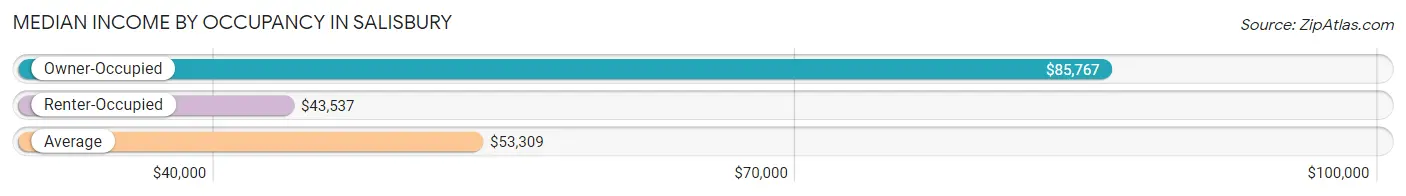
| Occupancy Type | # Households | Median Income |
| Owner-Occupied | 3,435 (25.8%) | $85,767 |
| Renter-Occupied | 9,900 (74.2%) | $43,537 |
| Average | 13,335 (100.0%) | $53,309 |
Occupancy by Householder Income Bracket in Salisbury
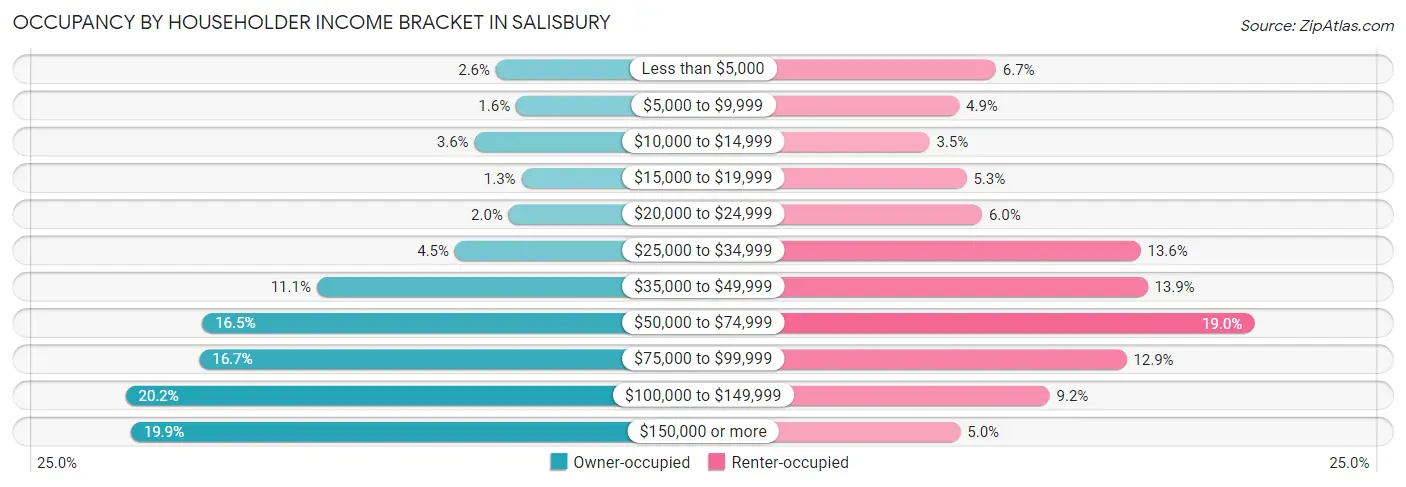
| Income Bracket | Owner-occupied | Renter-occupied |
| Less than $5,000 | 88 (2.6%) | 661 (6.7%) |
| $5,000 to $9,999 | 55 (1.6%) | 488 (4.9%) |
| $10,000 to $14,999 | 123 (3.6%) | 348 (3.5%) |
| $15,000 to $19,999 | 46 (1.3%) | 523 (5.3%) |
| $20,000 to $24,999 | 67 (1.9%) | 596 (6.0%) |
| $25,000 to $34,999 | 155 (4.5%) | 1,343 (13.6%) |
| $35,000 to $49,999 | 381 (11.1%) | 1,376 (13.9%) |
| $50,000 to $74,999 | 568 (16.5%) | 1,879 (19.0%) |
| $75,000 to $99,999 | 573 (16.7%) | 1,277 (12.9%) |
| $100,000 to $149,999 | 694 (20.2%) | 915 (9.2%) |
| $150,000 or more | 685 (19.9%) | 494 (5.0%) |
| Total | 3,435 (100.0%) | 9,900 (100.0%) |
Monthly Housing Cost Tiers in Salisbury
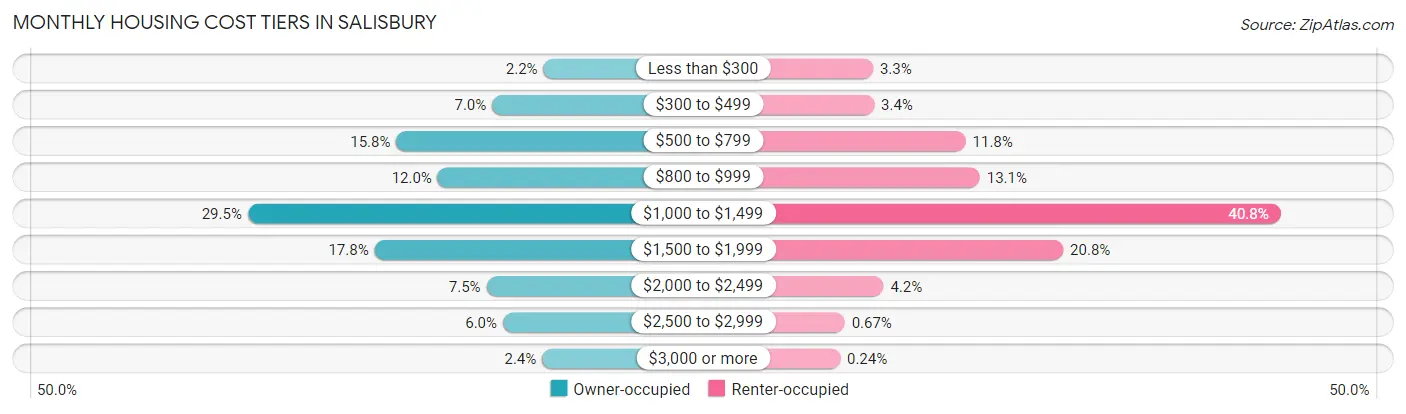
| Monthly Cost | Owner-occupied | Renter-occupied |
| Less than $300 | 77 (2.2%) | 324 (3.3%) |
| $300 to $499 | 239 (7.0%) | 335 (3.4%) |
| $500 to $799 | 542 (15.8%) | 1,168 (11.8%) |
| $800 to $999 | 411 (12.0%) | 1,298 (13.1%) |
| $1,000 to $1,499 | 1,012 (29.5%) | 4,038 (40.8%) |
| $1,500 to $1,999 | 611 (17.8%) | 2,057 (20.8%) |
| $2,000 to $2,499 | 257 (7.5%) | 420 (4.2%) |
| $2,500 to $2,999 | 205 (6.0%) | 66 (0.7%) |
| $3,000 or more | 81 (2.4%) | 24 (0.2%) |
| Total | 3,435 (100.0%) | 9,900 (100.0%) |
Physical Housing Characteristics in Salisbury
Housing Structures in Salisbury
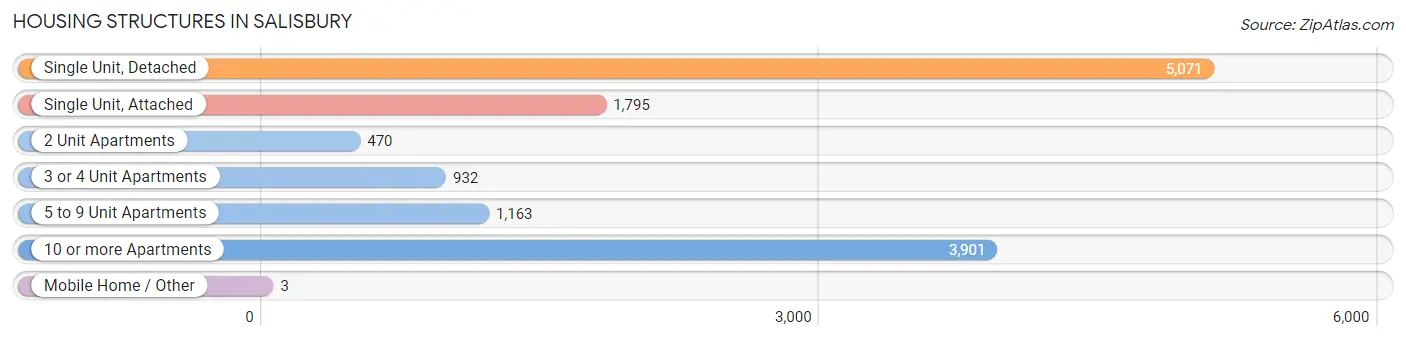
| Structure Type | # Housing Units | % Housing Units |
| Single Unit, Detached | 5,071 | 38.0% |
| Single Unit, Attached | 1,795 | 13.5% |
| 2 Unit Apartments | 470 | 3.5% |
| 3 or 4 Unit Apartments | 932 | 7.0% |
| 5 to 9 Unit Apartments | 1,163 | 8.7% |
| 10 or more Apartments | 3,901 | 29.2% |
| Mobile Home / Other | 3 | 0.0% |
| Total | 13,335 | 100.0% |
Housing Structures by Occupancy in Salisbury
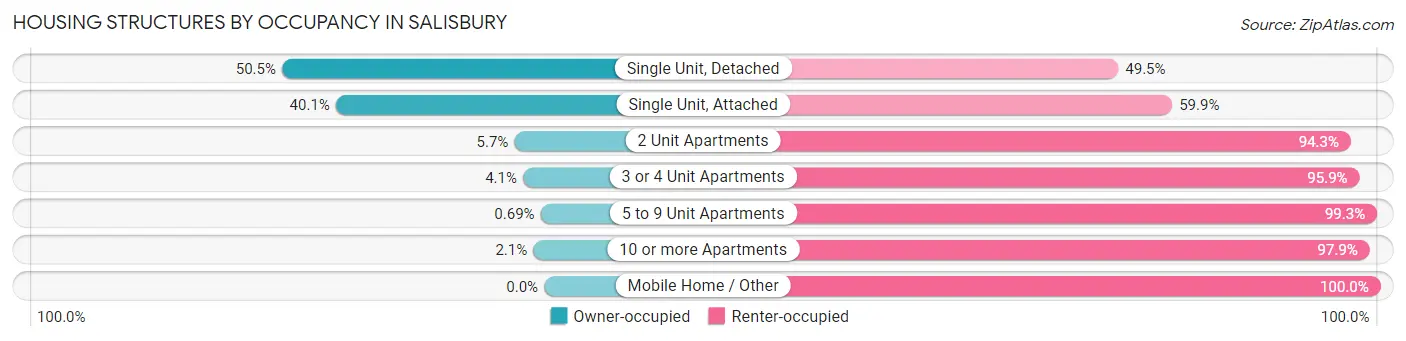
| Structure Type | Owner-occupied | Renter-occupied |
| Single Unit, Detached | 2,560 (50.5%) | 2,511 (49.5%) |
| Single Unit, Attached | 720 (40.1%) | 1,075 (59.9%) |
| 2 Unit Apartments | 27 (5.7%) | 443 (94.3%) |
| 3 or 4 Unit Apartments | 38 (4.1%) | 894 (95.9%) |
| 5 to 9 Unit Apartments | 8 (0.7%) | 1,155 (99.3%) |
| 10 or more Apartments | 82 (2.1%) | 3,819 (97.9%) |
| Mobile Home / Other | 0 (0.0%) | 3 (100.0%) |
| Total | 3,435 (25.8%) | 9,900 (74.2%) |
Housing Structures by Number of Rooms in Salisbury
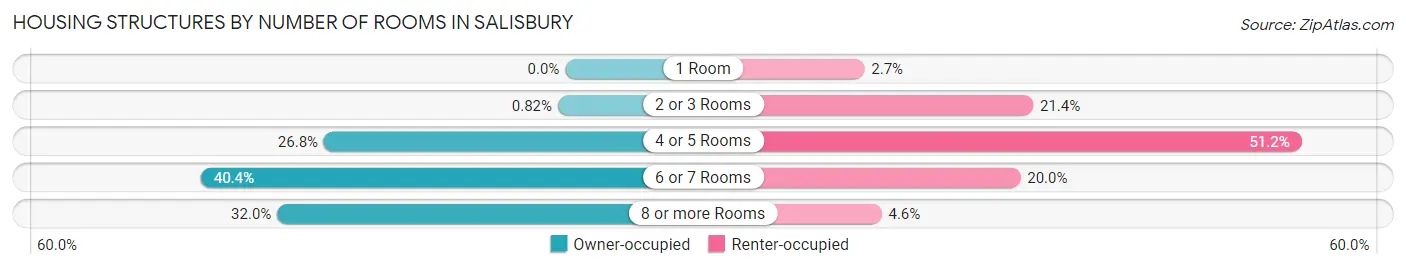
| Number of Rooms | Owner-occupied | Renter-occupied |
| 1 Room | 0 (0.0%) | 268 (2.7%) |
| 2 or 3 Rooms | 28 (0.8%) | 2,122 (21.4%) |
| 4 or 5 Rooms | 920 (26.8%) | 5,071 (51.2%) |
| 6 or 7 Rooms | 1,389 (40.4%) | 1,982 (20.0%) |
| 8 or more Rooms | 1,098 (32.0%) | 457 (4.6%) |
| Total | 3,435 (100.0%) | 9,900 (100.0%) |
Housing Structure by Heating Type in Salisbury
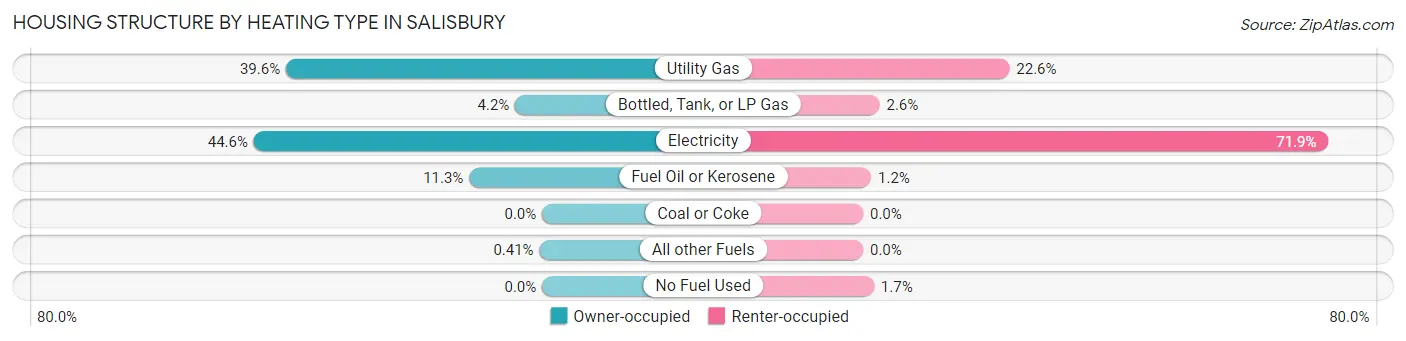
| Heating Type | Owner-occupied | Renter-occupied |
| Utility Gas | 1,360 (39.6%) | 2,239 (22.6%) |
| Bottled, Tank, or LP Gas | 143 (4.2%) | 252 (2.5%) |
| Electricity | 1,531 (44.6%) | 7,120 (71.9%) |
| Fuel Oil or Kerosene | 387 (11.3%) | 123 (1.2%) |
| Coal or Coke | 0 (0.0%) | 0 (0.0%) |
| All other Fuels | 14 (0.4%) | 0 (0.0%) |
| No Fuel Used | 0 (0.0%) | 166 (1.7%) |
| Total | 3,435 (100.0%) | 9,900 (100.0%) |
Household Vehicle Usage in Salisbury
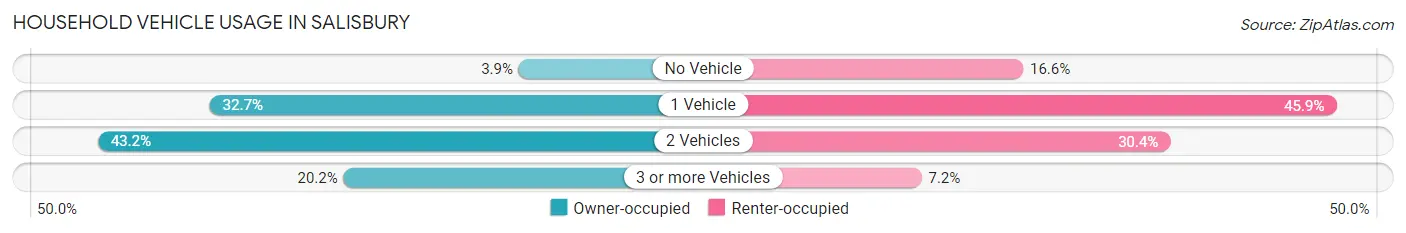
| Vehicles per Household | Owner-occupied | Renter-occupied |
| No Vehicle | 133 (3.9%) | 1,646 (16.6%) |
| 1 Vehicle | 1,124 (32.7%) | 4,540 (45.9%) |
| 2 Vehicles | 1,483 (43.2%) | 3,006 (30.4%) |
| 3 or more Vehicles | 695 (20.2%) | 708 (7.1%) |
| Total | 3,435 (100.0%) | 9,900 (100.0%) |
Real Estate & Mortgages in Salisbury
Real Estate and Mortgage Overview in Salisbury
| Characteristic | Without Mortgage | With Mortgage |
| Housing Units | 1,035 | 2,400 |
| Median Property Value | $207,200 | $196,100 |
| Median Household Income | $69,311 | $591 |
| Monthly Housing Costs | $636 | $81 |
| Real Estate Taxes | $3,002 | $42 |
Property Value by Mortgage Status in Salisbury
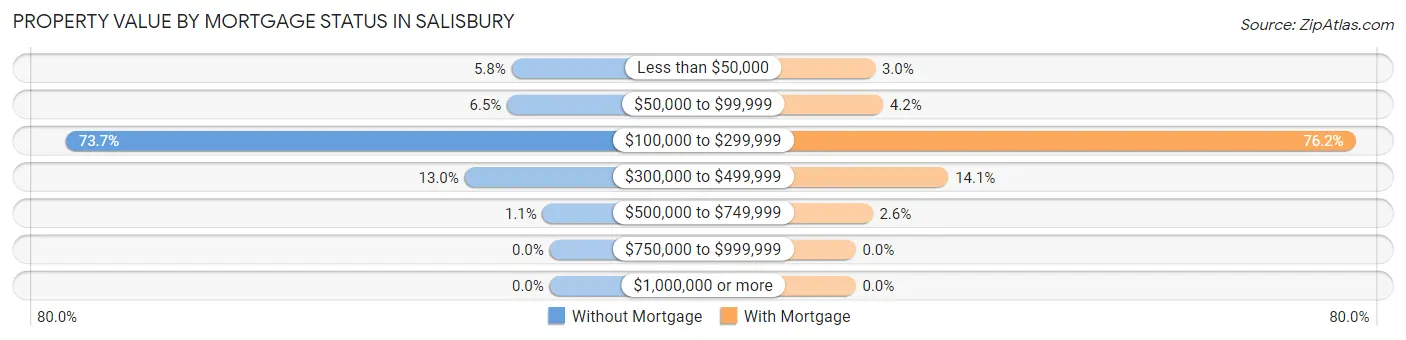
| Property Value | Without Mortgage | With Mortgage |
| Less than $50,000 | 60 (5.8%) | 71 (3.0%) |
| $50,000 to $99,999 | 67 (6.5%) | 100 (4.2%) |
| $100,000 to $299,999 | 763 (73.7%) | 1,828 (76.2%) |
| $300,000 to $499,999 | 134 (13.0%) | 339 (14.1%) |
| $500,000 to $749,999 | 11 (1.1%) | 62 (2.6%) |
| $750,000 to $999,999 | 0 (0.0%) | 0 (0.0%) |
| $1,000,000 or more | 0 (0.0%) | 0 (0.0%) |
| Total | 1,035 (100.0%) | 2,400 (100.0%) |
Household Income by Mortgage Status in Salisbury
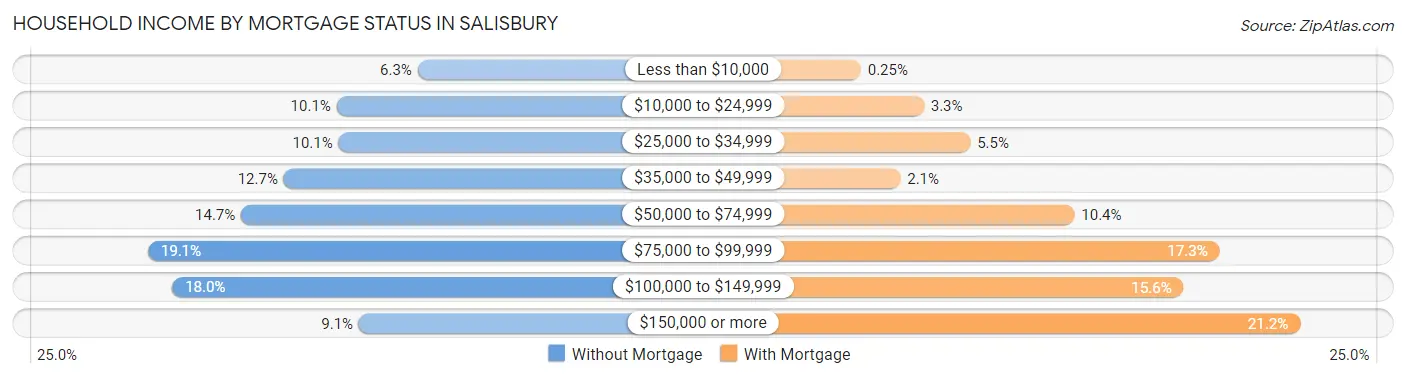
| Household Income | Without Mortgage | With Mortgage |
| Less than $10,000 | 65 (6.3%) | 6 (0.3%) |
| $10,000 to $24,999 | 105 (10.1%) | 78 (3.3%) |
| $25,000 to $34,999 | 104 (10.1%) | 131 (5.5%) |
| $35,000 to $49,999 | 131 (12.7%) | 51 (2.1%) |
| $50,000 to $74,999 | 152 (14.7%) | 250 (10.4%) |
| $75,000 to $99,999 | 198 (19.1%) | 416 (17.3%) |
| $100,000 to $149,999 | 186 (18.0%) | 375 (15.6%) |
| $150,000 or more | 94 (9.1%) | 508 (21.2%) |
| Total | 1,035 (100.0%) | 2,400 (100.0%) |
Property Value to Household Income Ratio in Salisbury
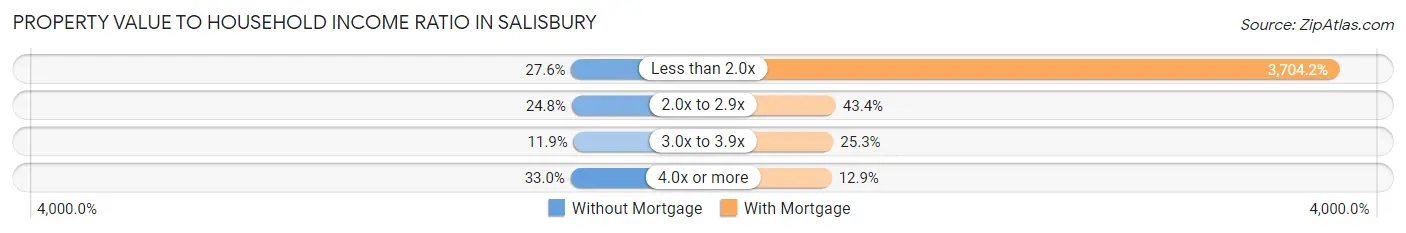
| Value-to-Income Ratio | Without Mortgage | With Mortgage |
| Less than 2.0x | 286 (27.6%) | 88,901 (3,704.2%) |
| 2.0x to 2.9x | 257 (24.8%) | 1,041 (43.4%) |
| 3.0x to 3.9x | 123 (11.9%) | 607 (25.3%) |
| 4.0x or more | 342 (33.0%) | 310 (12.9%) |
| Total | 1,035 (100.0%) | 2,400 (100.0%) |
Real Estate Taxes by Mortgage Status in Salisbury
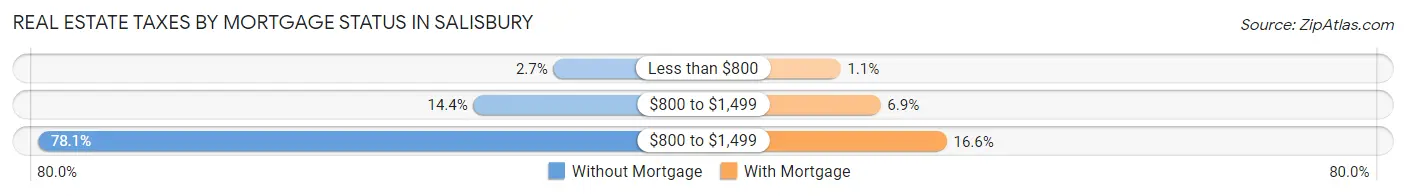
| Property Taxes | Without Mortgage | With Mortgage |
| Less than $800 | 28 (2.7%) | 26 (1.1%) |
| $800 to $1,499 | 149 (14.4%) | 166 (6.9%) |
| $800 to $1,499 | 808 (78.1%) | 398 (16.6%) |
| Total | 1,035 (100.0%) | 2,400 (100.0%) |
Health & Disability in Salisbury
Health Insurance Coverage by Age in Salisbury
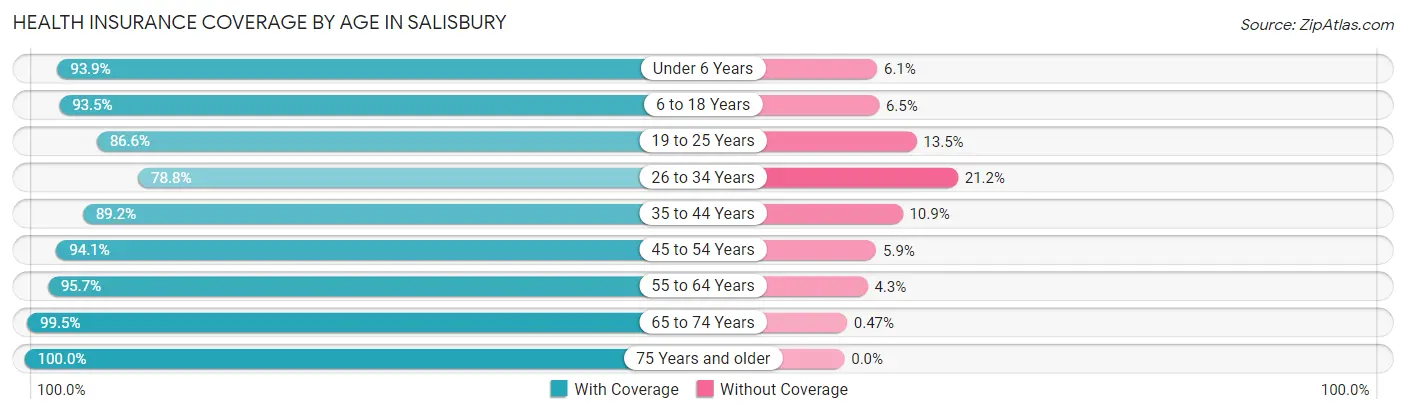
| Age Bracket | With Coverage | Without Coverage |
| Under 6 Years | 2,751 (93.9%) | 179 (6.1%) |
| 6 to 18 Years | 4,387 (93.5%) | 303 (6.5%) |
| 19 to 25 Years | 5,484 (86.6%) | 852 (13.5%) |
| 26 to 34 Years | 3,892 (78.8%) | 1,045 (21.2%) |
| 35 to 44 Years | 3,131 (89.1%) | 381 (10.8%) |
| 45 to 54 Years | 2,458 (94.1%) | 155 (5.9%) |
| 55 to 64 Years | 3,234 (95.7%) | 146 (4.3%) |
| 65 to 74 Years | 2,348 (99.5%) | 11 (0.5%) |
| 75 Years and older | 1,893 (100.0%) | 0 (0.0%) |
| Total | 29,578 (90.6%) | 3,072 (9.4%) |
Health Insurance Coverage by Citizenship Status in Salisbury
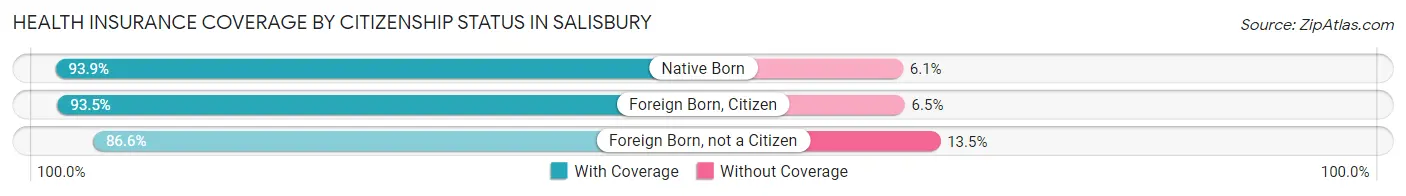
| Citizenship Status | With Coverage | Without Coverage |
| Native Born | 2,751 (93.9%) | 179 (6.1%) |
| Foreign Born, Citizen | 4,387 (93.5%) | 303 (6.5%) |
| Foreign Born, not a Citizen | 5,484 (86.6%) | 852 (13.5%) |
Health Insurance Coverage by Household Income in Salisbury
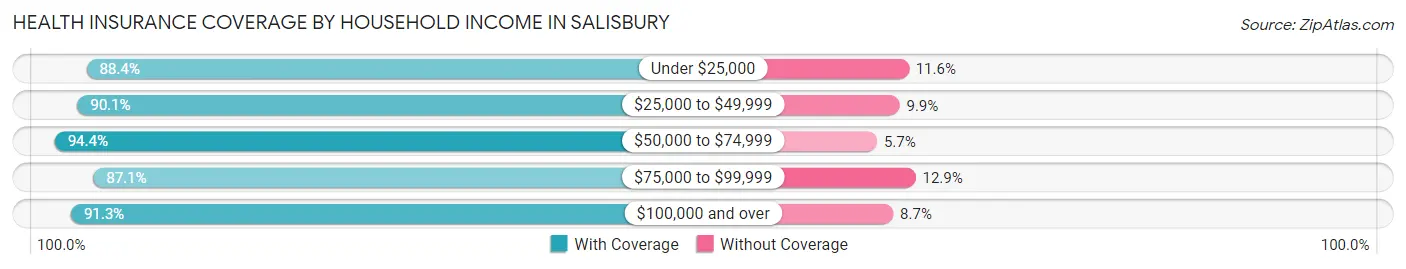
| Household Income | With Coverage | Without Coverage |
| Under $25,000 | 5,215 (88.4%) | 684 (11.6%) |
| $25,000 to $49,999 | 5,895 (90.1%) | 646 (9.9%) |
| $50,000 to $74,999 | 5,849 (94.4%) | 350 (5.7%) |
| $75,000 to $99,999 | 4,452 (87.1%) | 658 (12.9%) |
| $100,000 and over | 7,070 (91.3%) | 673 (8.7%) |
Public vs Private Health Insurance Coverage by Age in Salisbury
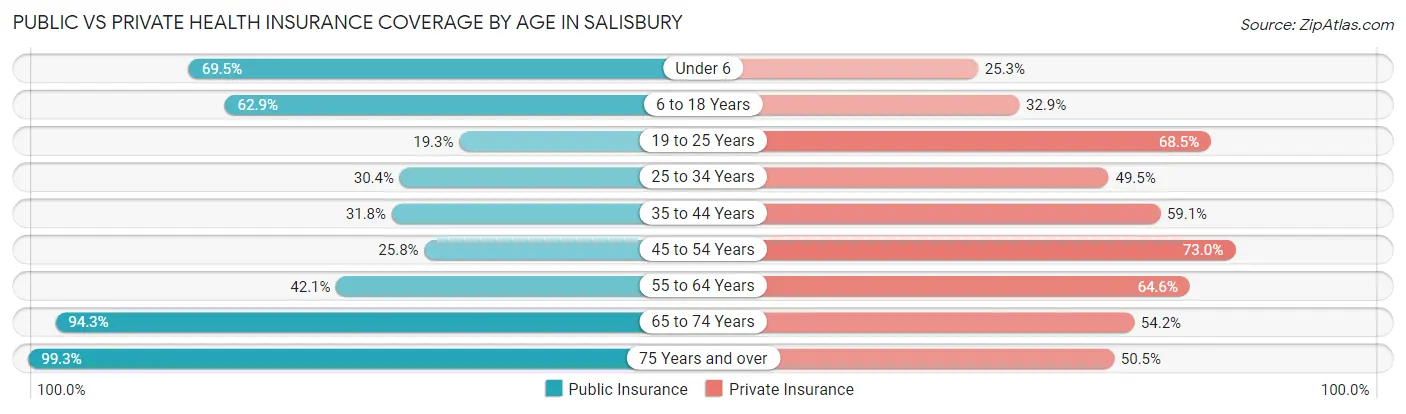
| Age Bracket | Public Insurance | Private Insurance |
| Under 6 | 2,037 (69.5%) | 740 (25.3%) |
| 6 to 18 Years | 2,948 (62.9%) | 1,543 (32.9%) |
| 19 to 25 Years | 1,224 (19.3%) | 4,342 (68.5%) |
| 25 to 34 Years | 1,499 (30.4%) | 2,445 (49.5%) |
| 35 to 44 Years | 1,118 (31.8%) | 2,074 (59.1%) |
| 45 to 54 Years | 674 (25.8%) | 1,907 (73.0%) |
| 55 to 64 Years | 1,424 (42.1%) | 2,183 (64.6%) |
| 65 to 74 Years | 2,224 (94.3%) | 1,279 (54.2%) |
| 75 Years and over | 1,880 (99.3%) | 956 (50.5%) |
| Total | 15,028 (46.0%) | 17,469 (53.5%) |
Disability Status by Sex by Age in Salisbury
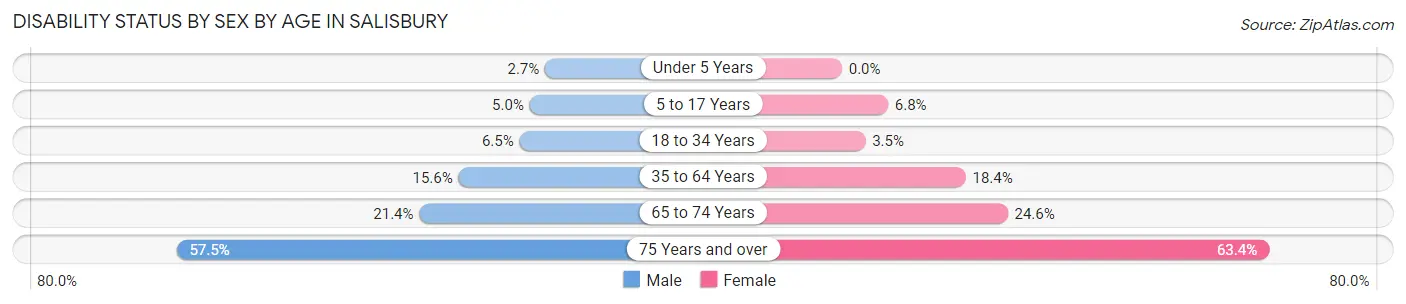
| Age Bracket | Male | Female |
| Under 5 Years | 38 (2.7%) | 0 (0.0%) |
| 5 to 17 Years | 131 (5.0%) | 168 (6.8%) |
| 18 to 34 Years | 348 (6.5%) | 212 (3.5%) |
| 35 to 64 Years | 660 (15.6%) | 967 (18.4%) |
| 65 to 74 Years | 229 (21.4%) | 317 (24.6%) |
| 75 Years and over | 343 (57.5%) | 822 (63.4%) |
Disability Class by Sex by Age in Salisbury
Disability Class: Hearing Difficulty
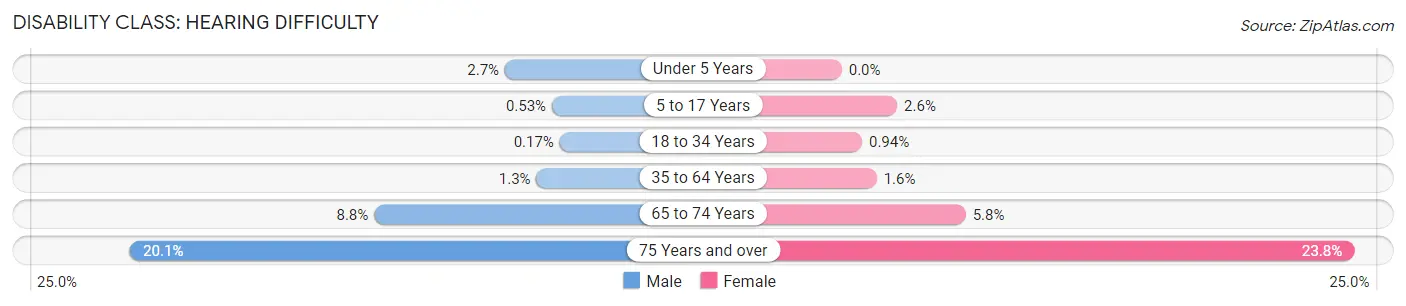
| Age Bracket | Male | Female |
| Under 5 Years | 38 (2.7%) | 0 (0.0%) |
| 5 to 17 Years | 14 (0.5%) | 63 (2.6%) |
| 18 to 34 Years | 9 (0.2%) | 57 (0.9%) |
| 35 to 64 Years | 53 (1.3%) | 85 (1.6%) |
| 65 to 74 Years | 94 (8.8%) | 74 (5.8%) |
| 75 Years and over | 120 (20.1%) | 308 (23.8%) |
Disability Class: Vision Difficulty
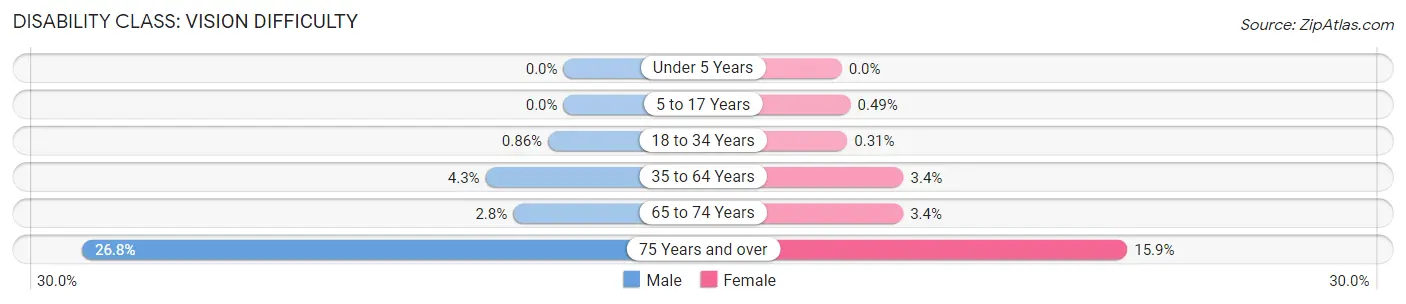
| Age Bracket | Male | Female |
| Under 5 Years | 0 (0.0%) | 0 (0.0%) |
| 5 to 17 Years | 0 (0.0%) | 12 (0.5%) |
| 18 to 34 Years | 46 (0.9%) | 19 (0.3%) |
| 35 to 64 Years | 184 (4.3%) | 181 (3.4%) |
| 65 to 74 Years | 30 (2.8%) | 44 (3.4%) |
| 75 Years and over | 160 (26.8%) | 206 (15.9%) |
Disability Class: Cognitive Difficulty
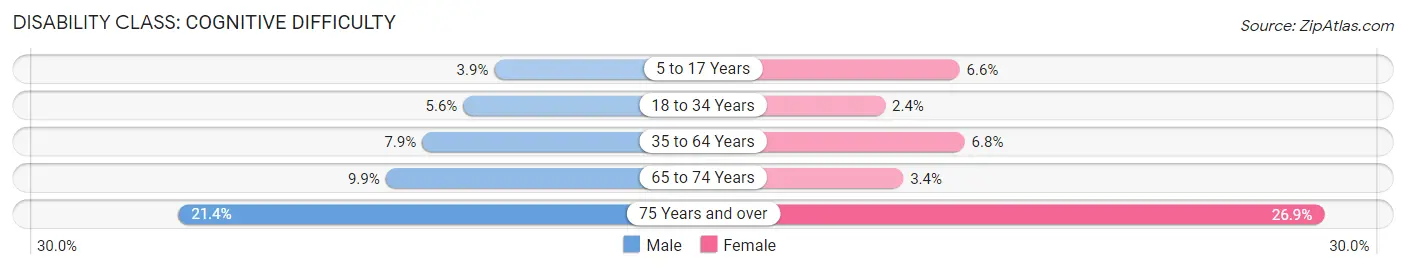
| Age Bracket | Male | Female |
| 5 to 17 Years | 101 (3.8%) | 161 (6.6%) |
| 18 to 34 Years | 298 (5.6%) | 147 (2.4%) |
| 35 to 64 Years | 334 (7.9%) | 360 (6.8%) |
| 65 to 74 Years | 106 (9.9%) | 44 (3.4%) |
| 75 Years and over | 128 (21.4%) | 348 (26.9%) |
Disability Class: Ambulatory Difficulty
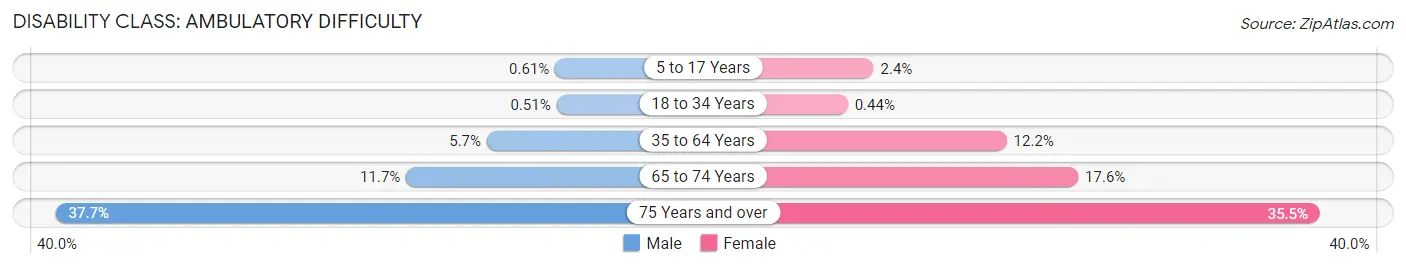
| Age Bracket | Male | Female |
| 5 to 17 Years | 16 (0.6%) | 58 (2.4%) |
| 18 to 34 Years | 27 (0.5%) | 27 (0.4%) |
| 35 to 64 Years | 241 (5.7%) | 644 (12.2%) |
| 65 to 74 Years | 125 (11.7%) | 226 (17.5%) |
| 75 Years and over | 225 (37.7%) | 460 (35.5%) |
Disability Class: Self-Care Difficulty
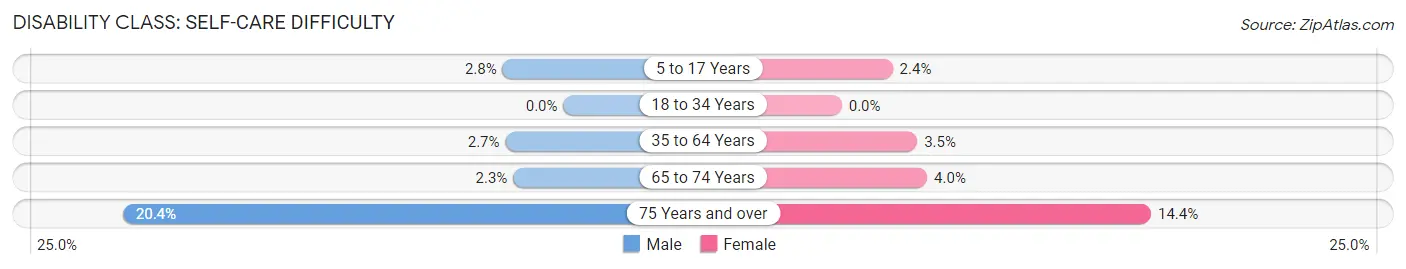
| Age Bracket | Male | Female |
| 5 to 17 Years | 74 (2.8%) | 58 (2.4%) |
| 18 to 34 Years | 0 (0.0%) | 0 (0.0%) |
| 35 to 64 Years | 114 (2.7%) | 184 (3.5%) |
| 65 to 74 Years | 25 (2.3%) | 51 (4.0%) |
| 75 Years and over | 122 (20.4%) | 186 (14.3%) |
Technology Access in Salisbury
Computing Device Access in Salisbury
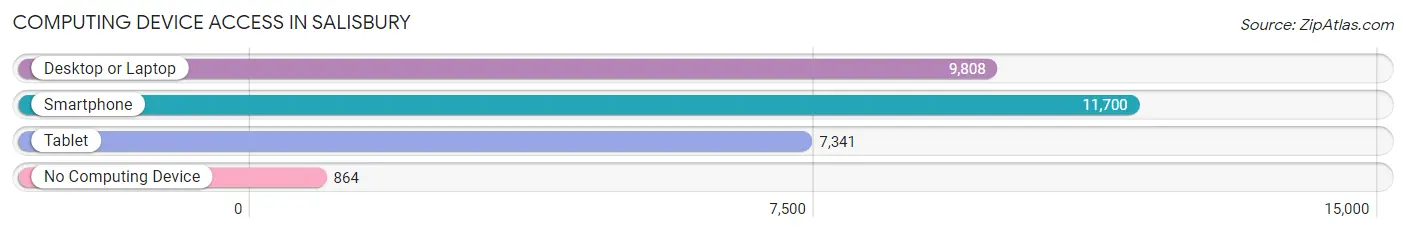
| Device Type | # Households | % Households |
| Desktop or Laptop | 9,808 | 73.6% |
| Smartphone | 11,700 | 87.7% |
| Tablet | 7,341 | 55.0% |
| No Computing Device | 864 | 6.5% |
| Total | 13,335 | 100.0% |
Internet Access in Salisbury
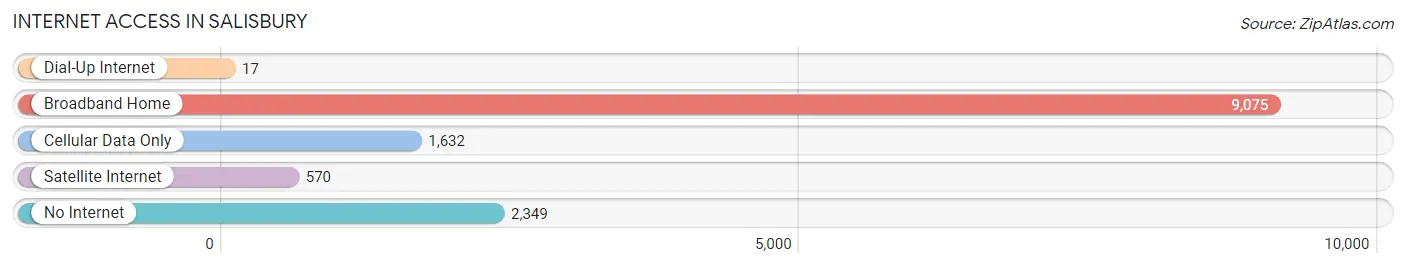
| Internet Type | # Households | % Households |
| Dial-Up Internet | 17 | 0.1% |
| Broadband Home | 9,075 | 68.0% |
| Cellular Data Only | 1,632 | 12.2% |
| Satellite Internet | 570 | 4.3% |
| No Internet | 2,349 | 17.6% |
| Total | 13,335 | 100.0% |
Salisbury Summary
Salisbury, Maryland is a city located in Wicomico County, Maryland, United States. It is the county seat of Wicomico County and the largest city in the Salisbury, Maryland-Delaware Metropolitan Statistical Area. The population was 30,343 at the 2010 census. It is the cultural, economic, and educational hub of the Delmarva Peninsula, which was long a rural area composed of small towns and farms.
History
Salisbury was founded in 1732 as a port town on the Nanticoke River. It was named after the English city of Salisbury, which is located in Wiltshire, England. The city was incorporated in 1854 and became the county seat of Wicomico County in 1867.
Salisbury was an important port city in the 19th century, and was a major center for the production of seafood and agricultural products. The city was also a major stop on the Underground Railroad, and was home to a large African-American population.
In the 20th century, Salisbury experienced a period of growth and development, becoming a major center for manufacturing, education, and healthcare. The city is now home to Salisbury University, Peninsula Regional Medical Center, and Perdue Farms.
Geography
Salisbury is located at 38°21′N 75°35′W (38.35, -75.58). It is situated on the Delmarva Peninsula, which is bordered by the Chesapeake Bay to the west and the Atlantic Ocean to the east. The city is located approximately 50 miles (80 km) south of Baltimore, Maryland, and 90 miles (145 km) east of Washington, D.C.
The city has a total area of 11.2 square miles (29 km2), of which 10.9 square miles (28 km2) is land and 0.3 square miles (0.78 km2) is water. The city is located in a humid subtropical climate zone, with hot, humid summers and mild winters.
Economy
Salisbury is the economic hub of the Delmarva Peninsula, and is home to a variety of industries. The city is a major center for manufacturing, with several large companies located in the area. These include Perdue Farms, a major poultry producer, and Allen Harim, a seafood processor.
The city is also home to a number of healthcare and educational institutions, including Peninsula Regional Medical Center, Salisbury University, Wor-Wic Community College, and the University of Maryland Eastern Shore.
Demographics
As of the 2010 census, there were 30,343 people, 11,983 households, and 6,945 families residing in the city. The population density was 2,788.3 people per square mile (1,077.2/km2). There were 13,092 housing units at an average density of 1,196.3 per square mile (461.7/km2). The racial makeup of the city was 54.2% White, 37.3% African American, 0.4% Native American, 2.2% Asian, 0.1% Pacific Islander, 3.2% from other races, and 2.7% from two or more races. Hispanic or Latino of any race were 6.7% of the population.
The median income for a household in the city was $37,837, and the median income for a family was $45,945. Males had a median income of $35,945 versus $27,945 for females. The per capita income for the city was $19,945. About 14.2% of families and 17.7% of the population were below the poverty line, including 25.2% of those under age 18 and 11.2% of those age 65 or over.
Common Questions
What is Per Capita Income in Salisbury?
Per Capita income in Salisbury is $29,264.
What is the Median Family Income in Salisbury?
Median Family Income in Salisbury is $70,089.
What is the Median Household income in Salisbury?
Median Household Income in Salisbury is $53,309.
What is Income or Wage Gap in Salisbury?
Income or Wage Gap in Salisbury is 14.3%.
Women in Salisbury earn 85.7 cents for every dollar earned by a man.
What is Family Income Deficit in Salisbury?
Family Income Deficit in Salisbury is $11,657.
Families that are below poverty line in Salisbury earn $11,657 less on average than the poverty threshold level.
What is Inequality or Gini Index in Salisbury?
Inequality or Gini Index in Salisbury is 0.48.
What is the Total Population of Salisbury?
Total Population of Salisbury is 32,960.
What is the Total Male Population of Salisbury?
Total Male Population of Salisbury is 15,485.
What is the Total Female Population of Salisbury?
Total Female Population of Salisbury is 17,475.
What is the Ratio of Males per 100 Females in Salisbury?
There are 88.61 Males per 100 Females in Salisbury.
What is the Ratio of Females per 100 Males in Salisbury?
There are 112.85 Females per 100 Males in Salisbury.
What is the Median Population Age in Salisbury?
Median Population Age in Salisbury is 30.3 Years.
What is the Average Family Size in Salisbury
Average Family Size in Salisbury is 3.1 People.
What is the Average Household Size in Salisbury
Average Household Size in Salisbury is 2.4 People.
How Large is the Labor Force in Salisbury?
There are 17,245 People in the Labor Forcein in Salisbury.
What is the Percentage of People in the Labor Force in Salisbury?
65.7% of People are in the Labor Force in Salisbury.
What is the Unemployment Rate in Salisbury?
Unemployment Rate in Salisbury is 9.9%.