Cities with the Highest Percentage of Honduran Population in Maryland
RELATED REPORTS & OPTIONS
Honduran
Maryland
Compare Cities
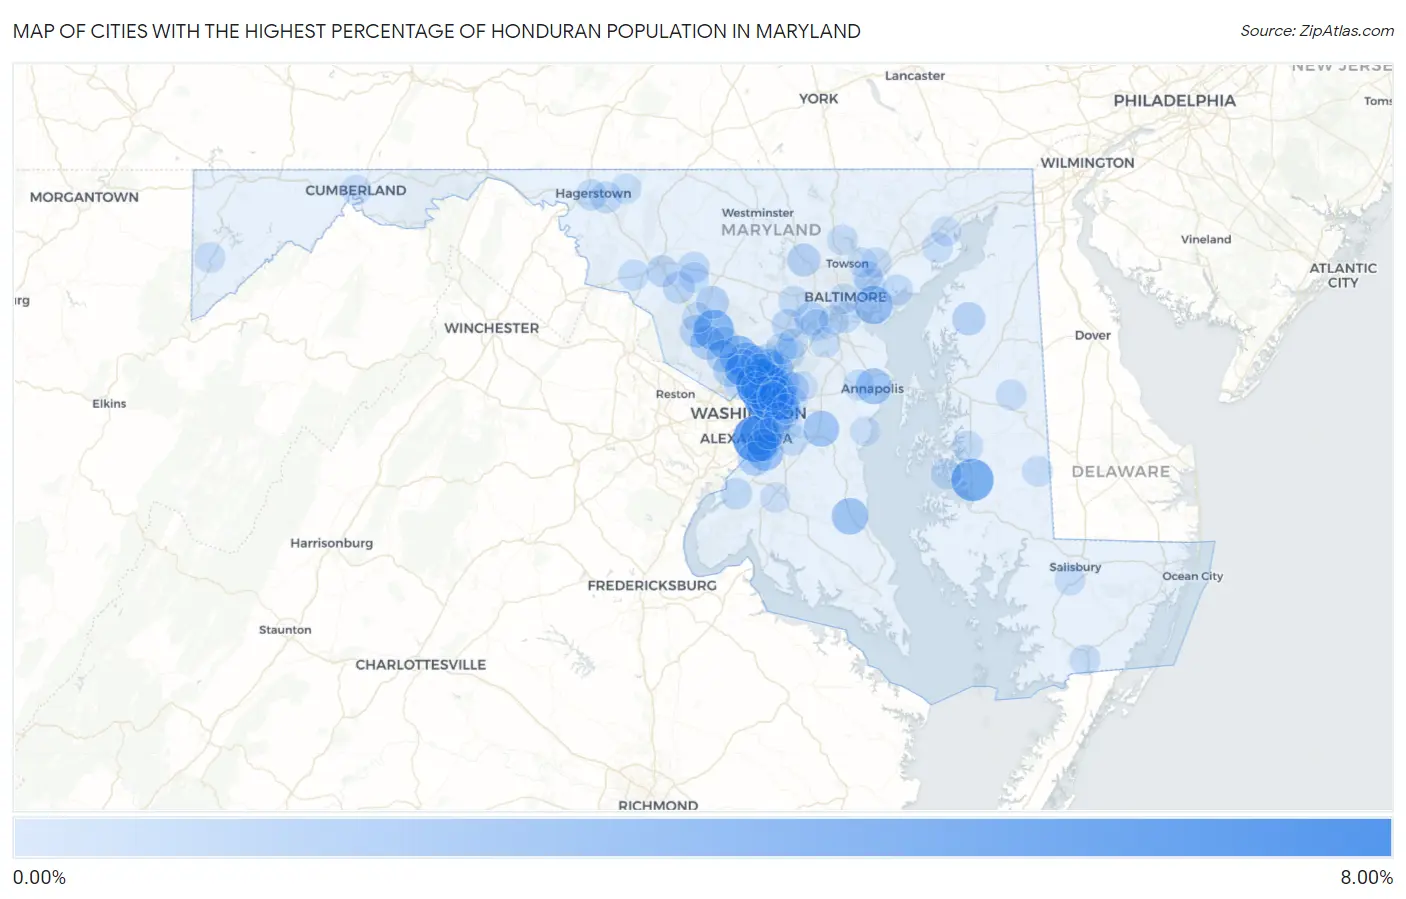
Map of Cities with the Highest Percentage of Honduran Population in Maryland
0.00%
8.00%
Cities with the Highest Percentage of Honduran Population in Maryland
| City | Honduran | vs State | vs National | |
| 1. | North Brentwood | 7.44% | 0.60%(+6.84)#1 | 0.32%(+7.12)#64 |
| 2. | Langley Park | 7.19% | 0.60%(+6.59)#2 | 0.32%(+6.86)#68 |
| 3. | Forest Heights | 6.32% | 0.60%(+5.73)#3 | 0.32%(+6.00)#85 |
| 4. | Trappe | 4.71% | 0.60%(+4.11)#4 | 0.32%(+4.39)#147 |
| 5. | Glassmanor | 4.06% | 0.60%(+3.46)#5 | 0.32%(+3.73)#190 |
| 6. | Montgomery Village | 3.94% | 0.60%(+3.34)#6 | 0.32%(+3.62)#202 |
| 7. | Aspen Hill | 3.38% | 0.60%(+2.78)#7 | 0.32%(+3.06)#240 |
| 8. | Adelphi | 3.37% | 0.60%(+2.77)#8 | 0.32%(+3.05)#241 |
| 9. | Mount Rainier | 3.16% | 0.60%(+2.56)#9 | 0.32%(+2.84)#265 |
| 10. | Dundalk | 3.14% | 0.60%(+2.55)#10 | 0.32%(+2.82)#268 |
| 11. | Glenmont | 3.09% | 0.60%(+2.49)#11 | 0.32%(+2.77)#278 |
| 12. | Cottage City | 3.05% | 0.60%(+2.45)#12 | 0.32%(+2.73)#282 |
| 13. | East Riverdale | 3.01% | 0.60%(+2.41)#13 | 0.32%(+2.69)#287 |
| 14. | Hyattsville | 2.84% | 0.60%(+2.25)#14 | 0.32%(+2.52)#315 |
| 15. | Wheaton | 2.78% | 0.60%(+2.18)#15 | 0.32%(+2.46)#324 |
| 16. | Brentwood | 2.64% | 0.60%(+2.05)#16 | 0.32%(+2.32)#348 |
| 17. | Friendly | 2.63% | 0.60%(+2.03)#17 | 0.32%(+2.31)#350 |
| 18. | Prince Frederick | 2.61% | 0.60%(+2.01)#18 | 0.32%(+2.29)#356 |
| 19. | Beltsville | 2.59% | 0.60%(+1.99)#19 | 0.32%(+2.27)#362 |
| 20. | College Park | 2.46% | 0.60%(+1.86)#20 | 0.32%(+2.14)#384 |
| 21. | Naval Academy | 2.43% | 0.60%(+1.83)#21 | 0.32%(+2.11)#388 |
| 22. | Marlboro Meadows | 2.40% | 0.60%(+1.80)#22 | 0.32%(+2.07)#396 |
| 23. | Colmar Manor | 2.37% | 0.60%(+1.78)#23 | 0.32%(+2.05)#400 |
| 24. | Chillum | 2.27% | 0.60%(+1.67)#24 | 0.32%(+1.95)#424 |
| 25. | Calverton | 2.11% | 0.60%(+1.51)#25 | 0.32%(+1.78)#463 |
| 26. | Flower Hill | 2.00% | 0.60%(+1.40)#26 | 0.32%(+1.67)#485 |
| 27. | Peppermill Village | 1.99% | 0.60%(+1.39)#27 | 0.32%(+1.67)#487 |
| 28. | Gaithersburg | 1.91% | 0.60%(+1.32)#28 | 0.32%(+1.59)#499 |
| 29. | Fort Washington | 1.71% | 0.60%(+1.11)#29 | 0.32%(+1.39)#546 |
| 30. | North Bethesda | 1.60% | 0.60%(+0.999)#30 | 0.32%(+1.27)#582 |
| 31. | Hillandale | 1.58% | 0.60%(+0.981)#31 | 0.32%(+1.26)#586 |
| 32. | Greenbelt | 1.57% | 0.60%(+0.972)#32 | 0.32%(+1.25)#589 |
| 33. | Silver Spring | 1.57% | 0.60%(+0.968)#33 | 0.32%(+1.24)#591 |
| 34. | Ilchester | 1.55% | 0.60%(+0.951)#34 | 0.32%(+1.23)#601 |
| 35. | Chestertown | 1.39% | 0.60%(+0.796)#35 | 0.32%(+1.07)#664 |
| 36. | Owings Mills | 1.38% | 0.60%(+0.782)#36 | 0.32%(+1.06)#672 |
| 37. | Damascus | 1.32% | 0.60%(+0.720)#37 | 0.32%(+0.995)#696 |
| 38. | Germantown | 1.32% | 0.60%(+0.718)#38 | 0.32%(+0.993)#697 |
| 39. | Landover | 1.30% | 0.60%(+0.699)#39 | 0.32%(+0.975)#706 |
| 40. | Seabrook | 1.29% | 0.60%(+0.693)#40 | 0.32%(+0.968)#714 |
| 41. | Oxon Hill | 1.29% | 0.60%(+0.692)#41 | 0.32%(+0.967)#715 |
| 42. | Bladensburg | 1.15% | 0.60%(+0.551)#42 | 0.32%(+0.826)#791 |
| 43. | Rockville | 1.15% | 0.60%(+0.550)#43 | 0.32%(+0.826)#792 |
| 44. | Urbana | 1.04% | 0.60%(+0.441)#44 | 0.32%(+0.717)#866 |
| 45. | Ballenger Creek | 1.00% | 0.60%(+0.401)#45 | 0.32%(+0.676)#895 |
| 46. | Fairland | 0.99% | 0.60%(+0.387)#46 | 0.32%(+0.662)#899 |
| 47. | Redland | 0.98% | 0.60%(+0.377)#47 | 0.32%(+0.653)#908 |
| 48. | Columbia | 0.97% | 0.60%(+0.372)#48 | 0.32%(+0.647)#914 |
| 49. | Chevy Chase | 0.96% | 0.60%(+0.362)#49 | 0.32%(+0.638)#923 |
| 50. | Woodlawn Cdp Prince George S County | 0.93% | 0.60%(+0.333)#50 | 0.32%(+0.609)#943 |
| 51. | Robinwood | 0.89% | 0.60%(+0.289)#51 | 0.32%(+0.565)#965 |
| 52. | New Market | 0.85% | 0.60%(+0.249)#52 | 0.32%(+0.525)#1,004 |
| 53. | Bryans Road | 0.84% | 0.60%(+0.240)#53 | 0.32%(+0.515)#1,015 |
| 54. | Laurel | 0.83% | 0.60%(+0.233)#54 | 0.32%(+0.509)#1,027 |
| 55. | Elkridge | 0.82% | 0.60%(+0.222)#55 | 0.32%(+0.497)#1,039 |
| 56. | Hagerstown | 0.77% | 0.60%(+0.176)#56 | 0.32%(+0.452)#1,084 |
| 57. | Colesville | 0.77% | 0.60%(+0.168)#57 | 0.32%(+0.444)#1,095 |
| 58. | West Laurel | 0.76% | 0.60%(+0.164)#58 | 0.32%(+0.439)#1,102 |
| 59. | Suitland | 0.73% | 0.60%(+0.133)#59 | 0.32%(+0.409)#1,135 |
| 60. | Melwood | 0.73% | 0.60%(+0.129)#60 | 0.32%(+0.405)#1,142 |
| 61. | Easton | 0.72% | 0.60%(+0.120)#61 | 0.32%(+0.396)#1,158 |
| 62. | Takoma Park | 0.72% | 0.60%(+0.120)#62 | 0.32%(+0.396)#1,159 |
| 63. | Rosedale | 0.72% | 0.60%(+0.120)#63 | 0.32%(+0.395)#1,160 |
| 64. | Brooklyn Park | 0.70% | 0.60%(+0.106)#64 | 0.32%(+0.382)#1,177 |
| 65. | Marlow Heights | 0.69% | 0.60%(+0.089)#65 | 0.32%(+0.365)#1,205 |
| 66. | Jefferson | 0.66% | 0.60%(+0.058)#66 | 0.32%(+0.334)#1,245 |
| 67. | Riverdale Park | 0.65% | 0.60%(+0.047)#67 | 0.32%(+0.323)#1,258 |
| 68. | Parole | 0.63% | 0.60%(+0.028)#68 | 0.32%(+0.303)#1,283 |
| 69. | Oxford | 0.61% | 0.60%(+0.014)#69 | 0.32%(+0.289)#1,294 |
| 70. | Bowleys Quarters | 0.61% | 0.60%(+0.010)#70 | 0.32%(+0.285)#1,299 |
| 71. | Monrovia | 0.60% | 0.60%(+0.006)#71 | 0.32%(+0.281)#1,307 |
| 72. | Federalsburg | 0.60% | 0.60%(+0.005)#72 | 0.32%(+0.281)#1,312 |
| 73. | Oakland | 0.60% | 0.60%(+0.003)#73 | 0.32%(+0.279)#1,313 |
| 74. | Cockeysville | 0.59% | 0.60%(-0.009)#74 | 0.32%(+0.267)#1,335 |
| 75. | Ellicott City | 0.59% | 0.60%(-0.010)#75 | 0.32%(+0.266)#1,336 |
| 76. | Perryman | 0.58% | 0.60%(-0.016)#76 | 0.32%(+0.260)#1,348 |
| 77. | Ridgely | 0.58% | 0.60%(-0.019)#77 | 0.32%(+0.256)#1,353 |
| 78. | Clarksburg | 0.58% | 0.60%(-0.023)#78 | 0.32%(+0.253)#1,358 |
| 79. | Perry Hall | 0.57% | 0.60%(-0.027)#79 | 0.32%(+0.248)#1,368 |
| 80. | Severn | 0.53% | 0.60%(-0.065)#80 | 0.32%(+0.211)#1,434 |
| 81. | Pocomoke City | 0.53% | 0.60%(-0.066)#81 | 0.32%(+0.210)#1,435 |
| 82. | North Laurel | 0.52% | 0.60%(-0.074)#82 | 0.32%(+0.202)#1,447 |
| 83. | Fruitland | 0.52% | 0.60%(-0.081)#83 | 0.32%(+0.195)#1,463 |
| 84. | Cumberland | 0.47% | 0.60%(-0.126)#84 | 0.32%(+0.150)#1,552 |
| 85. | Overlea | 0.46% | 0.60%(-0.137)#85 | 0.32%(+0.139)#1,579 |
| 86. | Baltimore | 0.46% | 0.60%(-0.140)#86 | 0.32%(+0.136)#1,588 |
| 87. | Edmonston | 0.46% | 0.60%(-0.141)#87 | 0.32%(+0.134)#1,592 |
| 88. | Capitol Heights | 0.42% | 0.60%(-0.177)#88 | 0.32%(+0.099)#1,672 |
| 89. | Smithsburg | 0.40% | 0.60%(-0.202)#89 | 0.32%(+0.074)#1,729 |
| 90. | North Kensington | 0.38% | 0.60%(-0.221)#90 | 0.32%(+0.055)#1,780 |
| 91. | Linthicum | 0.36% | 0.60%(-0.235)#91 | 0.32%(+0.041)#1,827 |
| 92. | Forestville | 0.35% | 0.60%(-0.248)#92 | 0.32%(+0.027)#1,860 |
| 93. | Carney | 0.35% | 0.60%(-0.251)#93 | 0.32%(+0.025)#1,868 |
| 94. | Aberdeen | 0.35% | 0.60%(-0.251)#94 | 0.32%(+0.024)#1,869 |
| 95. | Shady Side | 0.34% | 0.60%(-0.255)#95 | 0.32%(+0.020)#1,878 |
| 96. | White Oak | 0.34% | 0.60%(-0.256)#96 | 0.32%(+0.020)#1,880 |
| 97. | Glenn Dale | 0.34% | 0.60%(-0.257)#97 | 0.32%(+0.018)#1,883 |
| 98. | Springdale | 0.32% | 0.60%(-0.275)#98 | 0.32%(+0.001)#1,935 |
| 99. | Summerfield | 0.31% | 0.60%(-0.285)#99 | 0.32%(-0.009)#1,964 |
| 100. | Waldorf | 0.31% | 0.60%(-0.291)#100 | 0.32%(-0.016)#1,984 |
Common Questions
What are the Top 10 Cities with the Highest Percentage of Honduran Population in Maryland?
Top 10 Cities with the Highest Percentage of Honduran Population in Maryland are:
#1
7.44%
#2
7.19%
#3
6.32%
#4
4.71%
#5
4.06%
#6
3.94%
#7
3.38%
#8
3.37%
#9
3.16%
#10
3.14%
What city has the Highest Percentage of Honduran Population in Maryland?
North Brentwood has the Highest Percentage of Honduran Population in Maryland with 7.44%.
What is the Percentage of Honduran Population in the State of Maryland?
Percentage of Honduran Population in Maryland is 0.60%.
What is the Percentage of Honduran Population in the United States?
Percentage of Honduran Population in the United States is 0.32%.