Shady Side, MD Map & Demographics
Shady Side Map
Shady Side Overview
$64,390
PER CAPITA INCOME
$136,315
AVG FAMILY INCOME
$133,378
AVG HOUSEHOLD INCOME
40.9%
WAGE / INCOME GAP [ % ]
59.1¢/ $1
WAGE / INCOME GAP [ $ ]
0.37
INEQUALITY / GINI INDEX
4,959
TOTAL POPULATION
2,567
MALE POPULATION
2,392
FEMALE POPULATION
107.32
MALES / 100 FEMALES
93.18
FEMALES / 100 MALES
47.4
MEDIAN AGE
2.8
AVG FAMILY SIZE
2.5
AVG HOUSEHOLD SIZE
3,012
LABOR FORCE [ PEOPLE ]
71.5%
PERCENT IN LABOR FORCE
4.6%
UNEMPLOYMENT RATE
Shady Side Zip Codes
Shady Side Area Codes
Income in Shady Side
Income Overview in Shady Side
Per Capita Income in Shady Side is $64,390, while median incomes of families and households are $136,315 and $133,378 respectively.
| Characteristic | Number | Measure |
| Per Capita Income | 4,959 | $64,390 |
| Median Family Income | 1,609 | $136,315 |
| Mean Family Income | 1,609 | $165,239 |
| Median Household Income | 2,008 | $133,378 |
| Mean Household Income | 2,008 | $158,121 |
| Income Deficit | 1,609 | $0 |
| Wage / Income Gap (%) | 4,959 | 40.92% |
| Wage / Income Gap ($) | 4,959 | 59.08¢ per $1 |
| Gini / Inequality Index | 4,959 | 0.37 |
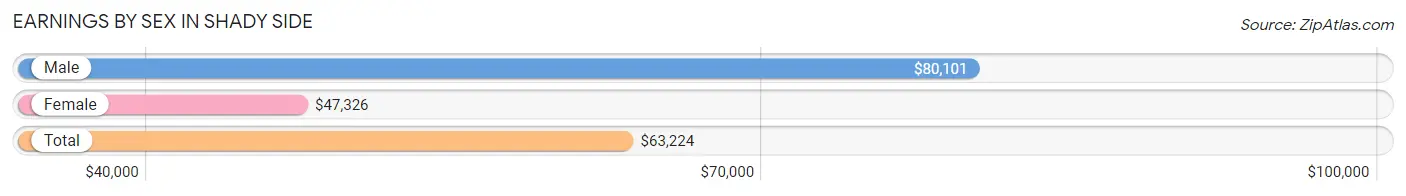
Earnings by Sex in Shady Side
Average Earnings in Shady Side are $63,224, $80,101 for men and $47,326 for women, a difference of 40.9%.
| Sex | Number | Average Earnings |
| Male | 1,661 (51.4%) | $80,101 |
| Female | 1,570 (48.6%) | $47,326 |
| Total | 3,231 (100.0%) | $63,224 |
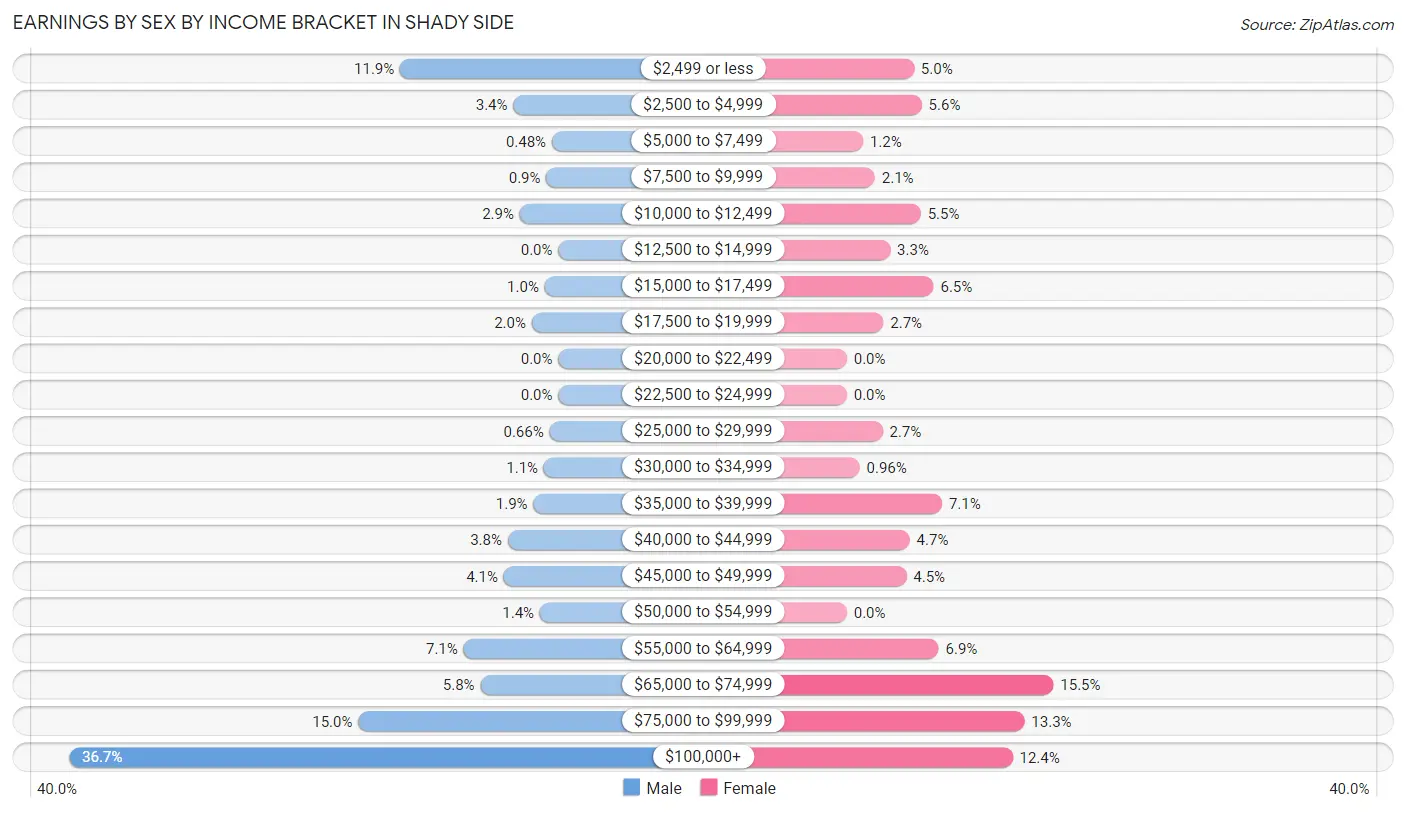
Earnings by Sex by Income Bracket in Shady Side
The most common earnings brackets in Shady Side are $100,000+ for men (609 | 36.7%) and $65,000 to $74,999 for women (243 | 15.5%).
| Income | Male | Female |
| $2,499 or less | 197 (11.9%) | 79 (5.0%) |
| $2,500 to $4,999 | 56 (3.4%) | 88 (5.6%) |
| $5,000 to $7,499 | 8 (0.5%) | 19 (1.2%) |
| $7,500 to $9,999 | 15 (0.9%) | 33 (2.1%) |
| $10,000 to $12,499 | 48 (2.9%) | 87 (5.5%) |
| $12,500 to $14,999 | 0 (0.0%) | 51 (3.3%) |
| $15,000 to $17,499 | 17 (1.0%) | 102 (6.5%) |
| $17,500 to $19,999 | 33 (2.0%) | 43 (2.7%) |
| $20,000 to $22,499 | 0 (0.0%) | 0 (0.0%) |
| $22,500 to $24,999 | 0 (0.0%) | 0 (0.0%) |
| $25,000 to $29,999 | 11 (0.7%) | 42 (2.7%) |
| $30,000 to $34,999 | 18 (1.1%) | 15 (1.0%) |
| $35,000 to $39,999 | 31 (1.9%) | 112 (7.1%) |
| $40,000 to $44,999 | 63 (3.8%) | 74 (4.7%) |
| $45,000 to $49,999 | 68 (4.1%) | 70 (4.5%) |
| $50,000 to $54,999 | 23 (1.4%) | 0 (0.0%) |
| $55,000 to $64,999 | 118 (7.1%) | 108 (6.9%) |
| $65,000 to $74,999 | 97 (5.8%) | 243 (15.5%) |
| $75,000 to $99,999 | 249 (15.0%) | 209 (13.3%) |
| $100,000+ | 609 (36.7%) | 195 (12.4%) |
| Total | 1,661 (100.0%) | 1,570 (100.0%) |
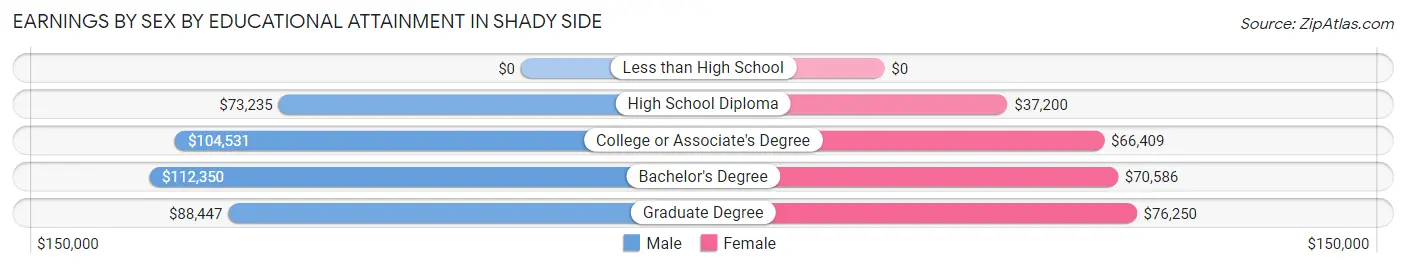
Earnings by Sex by Educational Attainment in Shady Side
Average earnings in Shady Side are $90,403 for men and $58,556 for women, a difference of 35.2%. Men with an educational attainment of bachelor's degree enjoy the highest average annual earnings of $112,350, while those with high school diploma education earn the least with $73,235. Women with an educational attainment of graduate degree earn the most with the average annual earnings of $76,250, while those with high school diploma education have the smallest earnings of $37,200.
| Educational Attainment | Male Income | Female Income |
| Less than High School | - | - |
| High School Diploma | $73,235 | $37,200 |
| College or Associate's Degree | $104,531 | $66,409 |
| Bachelor's Degree | $112,350 | $70,586 |
| Graduate Degree | $88,447 | $76,250 |
| Total | $90,403 | $58,556 |
Family Income in Shady Side
Family Income Brackets in Shady Side
According to the Shady Side family income data, there are 386 families falling into the $150,000 to $199,999 income range, which is the most common income bracket and makes up 24.0% of all families.
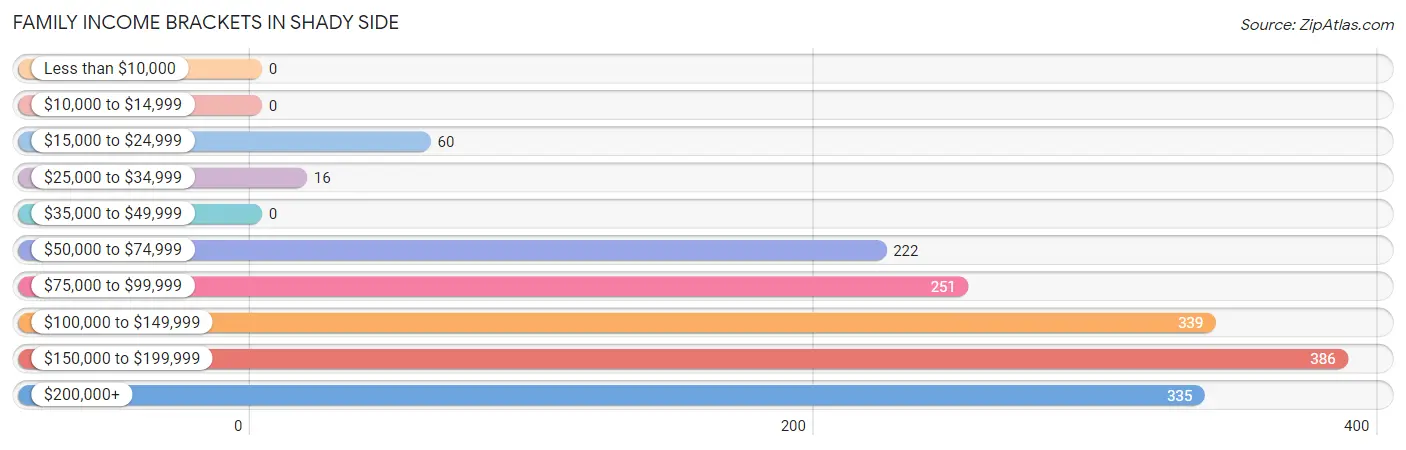
| Income Bracket | # Families | % Families |
| Less than $10,000 | 0 | 0.0% |
| $10,000 to $14,999 | 0 | 0.0% |
| $15,000 to $24,999 | 60 | 3.7% |
| $25,000 to $34,999 | 16 | 1.0% |
| $35,000 to $49,999 | 0 | 0.0% |
| $50,000 to $74,999 | 222 | 13.8% |
| $75,000 to $99,999 | 251 | 15.6% |
| $100,000 to $149,999 | 339 | 21.1% |
| $150,000 to $199,999 | 386 | 24.0% |
| $200,000+ | 335 | 20.8% |
Family Income by Famaliy Size in Shady Side
4-person families (291 | 18.1%) account for the highest median family income in Shady Side with $193,542 per family, while 2-person families (907 | 56.4%) have the highest median income of $56,802 per family member.
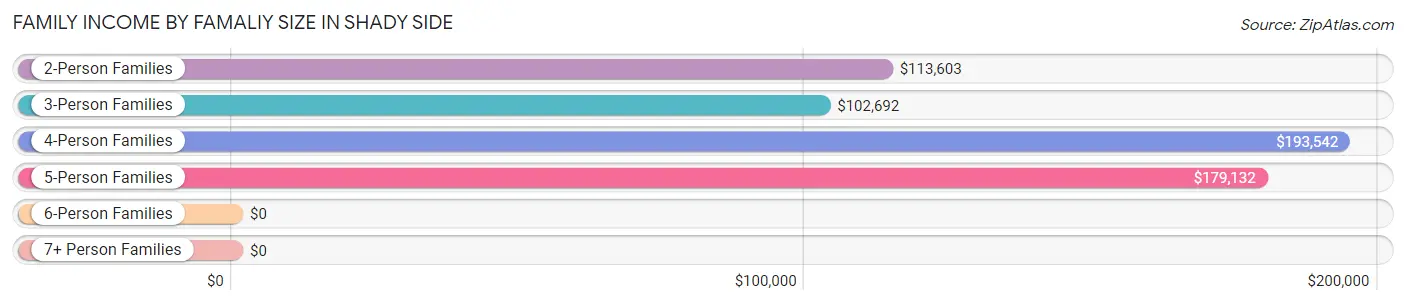
| Income Bracket | # Families | Median Income |
| 2-Person Families | 907 (56.4%) | $113,603 |
| 3-Person Families | 330 (20.5%) | $102,692 |
| 4-Person Families | 291 (18.1%) | $193,542 |
| 5-Person Families | 81 (5.0%) | $179,132 |
| 6-Person Families | 0 (0.0%) | $0 |
| 7+ Person Families | 0 (0.0%) | $0 |
| Total | 1,609 (100.0%) | $136,315 |
Family Income by Number of Earners in Shady Side
The median family income in Shady Side is $136,315, with families comprising 3+ earners (235) having the highest median family income of $174,018, while families with 1 earner (442) have the lowest median family income of $98,750, accounting for 14.6% and 27.5% of families, respectively.
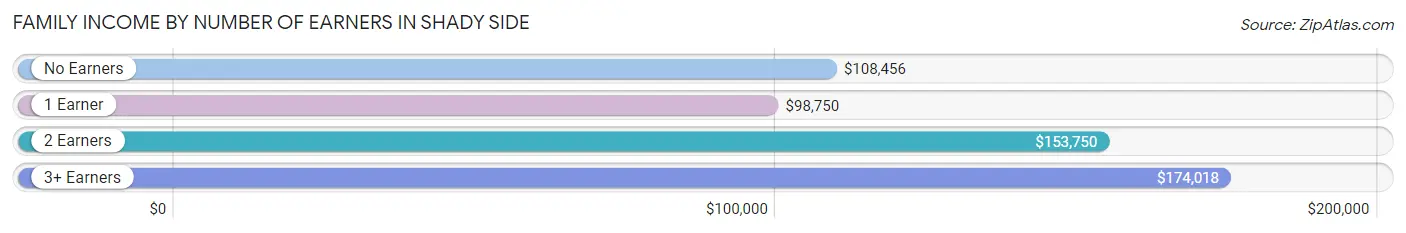
| Number of Earners | # Families | Median Income |
| No Earners | 131 (8.1%) | $108,456 |
| 1 Earner | 442 (27.5%) | $98,750 |
| 2 Earners | 801 (49.8%) | $153,750 |
| 3+ Earners | 235 (14.6%) | $174,018 |
| Total | 1,609 (100.0%) | $136,315 |
Household Income in Shady Side
Household Income Brackets in Shady Side
With 510 households falling in the category, the $100,000 to $149,999 income range is the most frequent in Shady Side, accounting for 25.4% of all households. In contrast, only 16 households (0.8%) fall into the $10,000 to $14,999 income bracket, making it the least populous group.
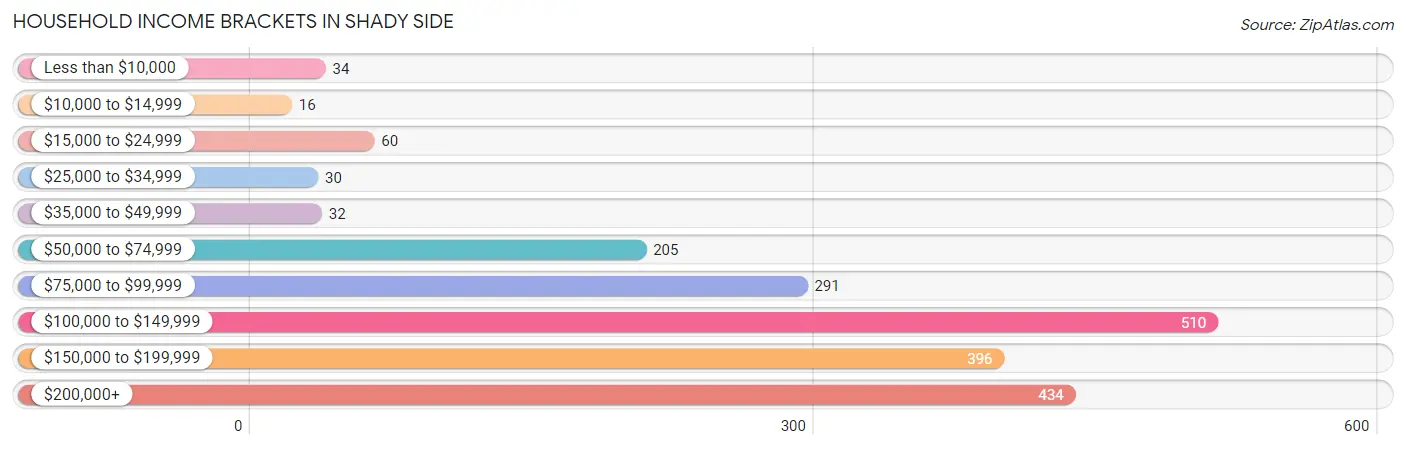
| Income Bracket | # Households | % Households |
| Less than $10,000 | 34 | 1.7% |
| $10,000 to $14,999 | 16 | 0.8% |
| $15,000 to $24,999 | 60 | 3.0% |
| $25,000 to $34,999 | 30 | 1.5% |
| $35,000 to $49,999 | 32 | 1.6% |
| $50,000 to $74,999 | 205 | 10.2% |
| $75,000 to $99,999 | 291 | 14.5% |
| $100,000 to $149,999 | 510 | 25.4% |
| $150,000 to $199,999 | 396 | 19.7% |
| $200,000+ | 434 | 21.6% |
Household Income by Householder Age in Shady Side
The median household income in Shady Side is $133,378, with the highest median household income of $144,716 found in the 25 to 44 years age bracket for the primary householder. A total of 445 households (22.2%) fall into this category.
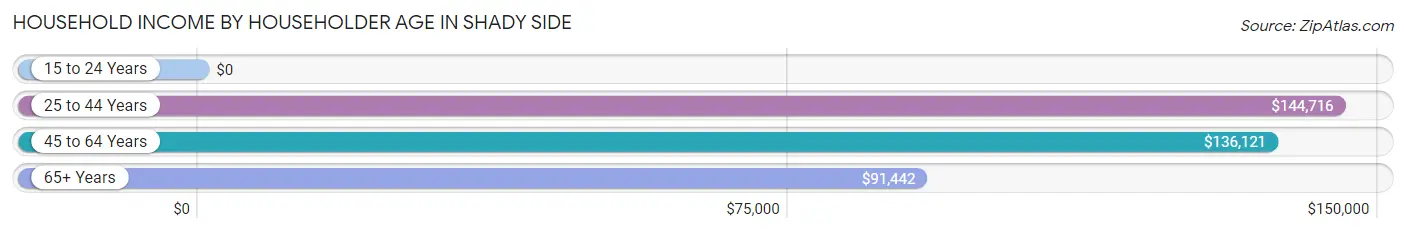
| Income Bracket | # Households | Median Income |
| 15 to 24 Years | 0 (0.0%) | $0 |
| 25 to 44 Years | 445 (22.2%) | $144,716 |
| 45 to 64 Years | 910 (45.3%) | $136,121 |
| 65+ Years | 653 (32.5%) | $91,442 |
| Total | 2,008 (100.0%) | $133,378 |
Poverty in Shady Side
Income Below Poverty by Sex and Age in Shady Side
With 4.7% poverty level for males and 3.9% for females among the residents of Shady Side, 16 and 17 year old males and 35 to 44 year old females are the most vulnerable to poverty, with 60 males (42.2%) and 60 females (19.5%) in their respective age groups living below the poverty level.
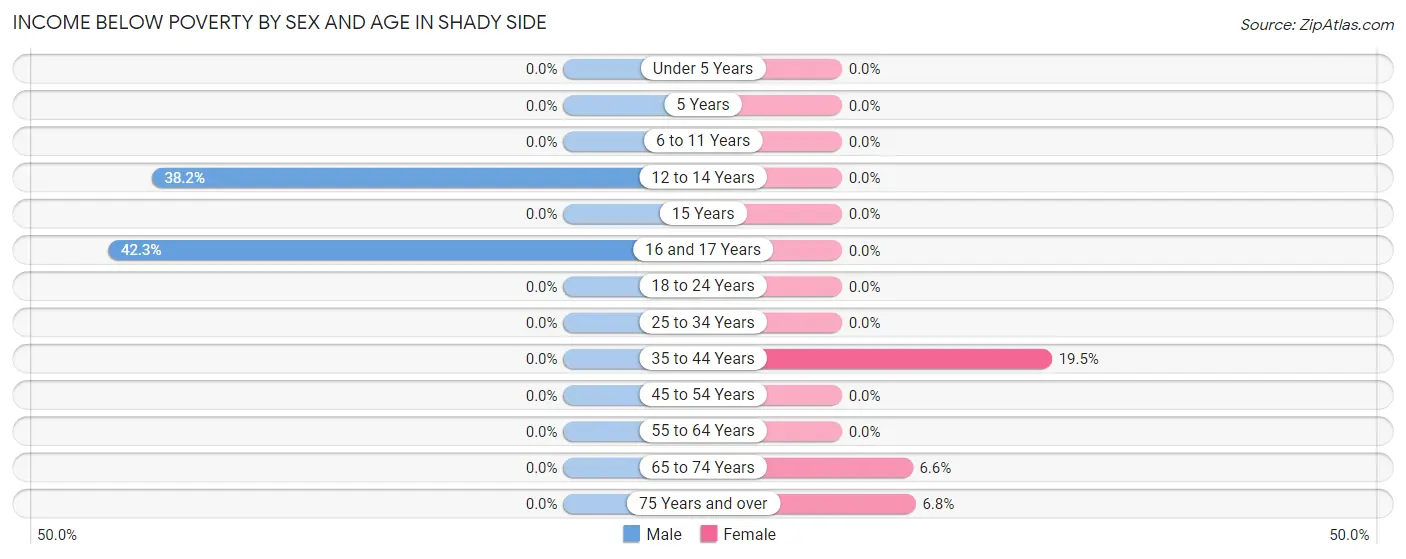
| Age Bracket | Male | Female |
| Under 5 Years | 0 (0.0%) | 0 (0.0%) |
| 5 Years | 0 (0.0%) | 0 (0.0%) |
| 6 to 11 Years | 0 (0.0%) | 0 (0.0%) |
| 12 to 14 Years | 60 (38.2%) | 0 (0.0%) |
| 15 Years | 0 (0.0%) | 0 (0.0%) |
| 16 and 17 Years | 60 (42.2%) | 0 (0.0%) |
| 18 to 24 Years | 0 (0.0%) | 0 (0.0%) |
| 25 to 34 Years | 0 (0.0%) | 0 (0.0%) |
| 35 to 44 Years | 0 (0.0%) | 60 (19.5%) |
| 45 to 54 Years | 0 (0.0%) | 0 (0.0%) |
| 55 to 64 Years | 0 (0.0%) | 0 (0.0%) |
| 65 to 74 Years | 0 (0.0%) | 16 (6.6%) |
| 75 Years and over | 0 (0.0%) | 18 (6.8%) |
| Total | 120 (4.7%) | 94 (3.9%) |
Income Above Poverty by Sex and Age in Shady Side
According to the poverty statistics in Shady Side, males aged under 5 years and females aged under 5 years are the age groups that are most secure financially, with 100.0% of males and 100.0% of females in these age groups living above the poverty line.
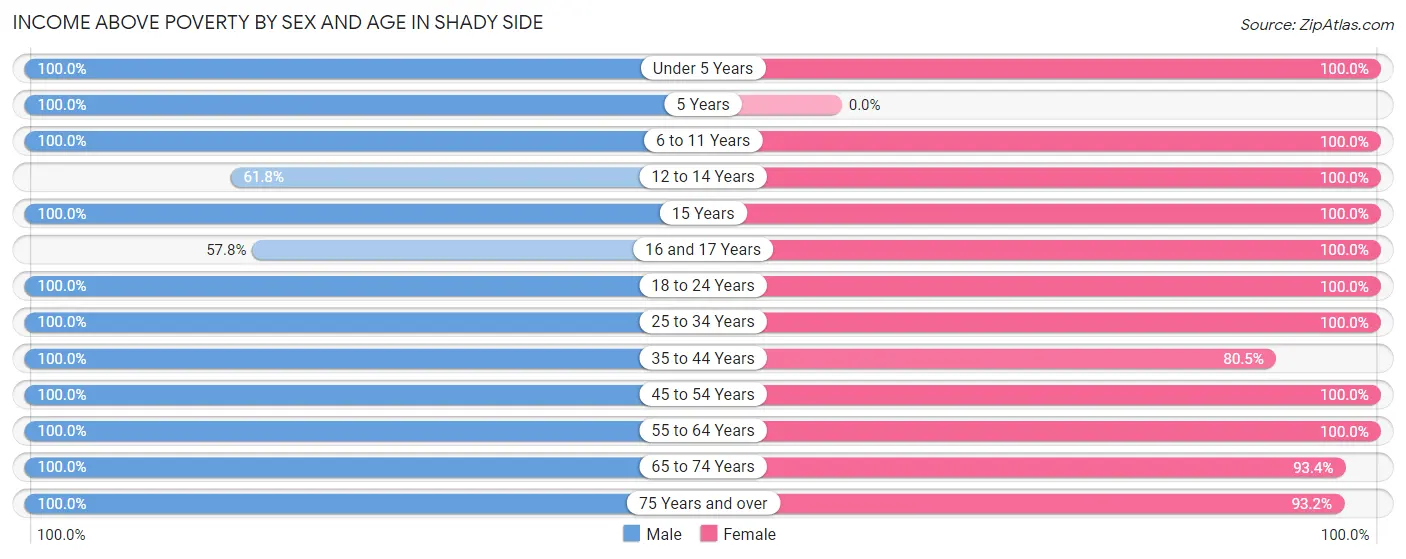
| Age Bracket | Male | Female |
| Under 5 Years | 111 (100.0%) | 71 (100.0%) |
| 5 Years | 24 (100.0%) | 0 (0.0%) |
| 6 to 11 Years | 150 (100.0%) | 130 (100.0%) |
| 12 to 14 Years | 97 (61.8%) | 72 (100.0%) |
| 15 Years | 15 (100.0%) | 17 (100.0%) |
| 16 and 17 Years | 82 (57.8%) | 68 (100.0%) |
| 18 to 24 Years | 254 (100.0%) | 132 (100.0%) |
| 25 to 34 Years | 309 (100.0%) | 258 (100.0%) |
| 35 to 44 Years | 176 (100.0%) | 248 (80.5%) |
| 45 to 54 Years | 365 (100.0%) | 357 (100.0%) |
| 55 to 64 Years | 423 (100.0%) | 472 (100.0%) |
| 65 to 74 Years | 268 (100.0%) | 228 (93.4%) |
| 75 Years and over | 173 (100.0%) | 245 (93.2%) |
| Total | 2,447 (95.3%) | 2,298 (96.1%) |
Income Below Poverty Among Married-Couple Families in Shady Side
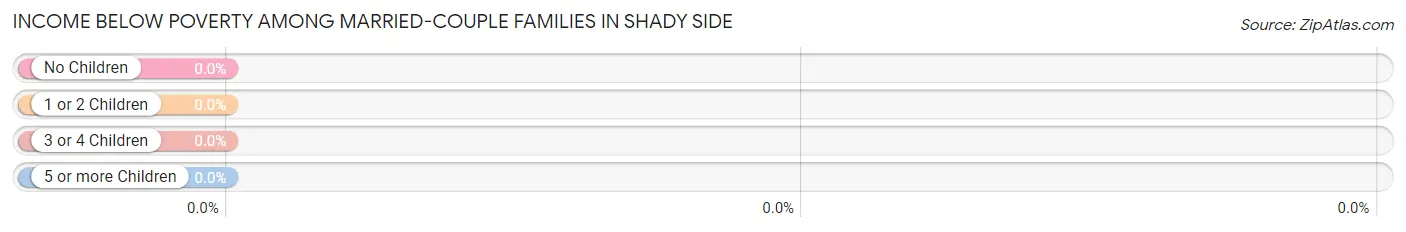
| Children | Above Poverty | Below Poverty |
| No Children | 765 (100.0%) | 0 (0.0%) |
| 1 or 2 Children | 374 (100.0%) | 0 (0.0%) |
| 3 or 4 Children | 81 (100.0%) | 0 (0.0%) |
| 5 or more Children | 0 (0.0%) | 0 (0.0%) |
| Total | 1,220 (100.0%) | 0 (0.0%) |
Income Below Poverty Among Single-Parent Households in Shady Side
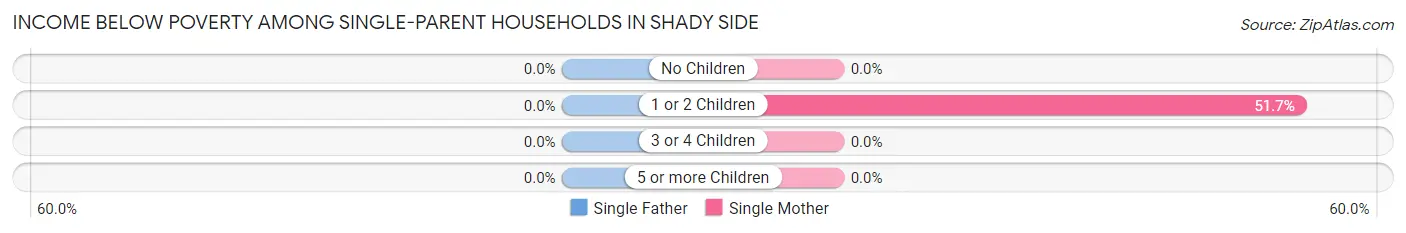
| Children | Single Father | Single Mother |
| No Children | 0 (0.0%) | 0 (0.0%) |
| 1 or 2 Children | 0 (0.0%) | 60 (51.7%) |
| 3 or 4 Children | 0 (0.0%) | 0 (0.0%) |
| 5 or more Children | 0 (0.0%) | 0 (0.0%) |
| Total | 0 (0.0%) | 60 (18.4%) |
Income Below Poverty Among Married-Couple vs Single-Parent Households in Shady Side
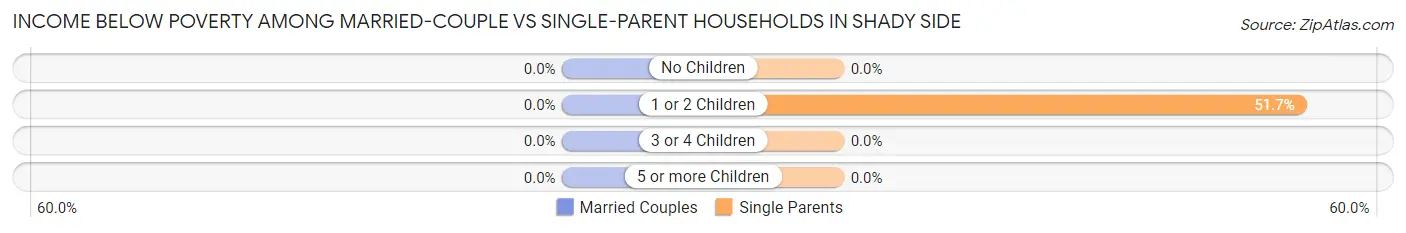
| Children | Married-Couple Families | Single-Parent Households |
| No Children | 0 (0.0%) | 0 (0.0%) |
| 1 or 2 Children | 0 (0.0%) | 60 (51.7%) |
| 3 or 4 Children | 0 (0.0%) | 0 (0.0%) |
| 5 or more Children | 0 (0.0%) | 0 (0.0%) |
| Total | 0 (0.0%) | 60 (15.4%) |
Race in Shady Side
The most populous races in Shady Side are White / Caucasian (4,218 | 85.1%), Black / African American (458 | 9.2%), and Two or more Races (168 | 3.4%).
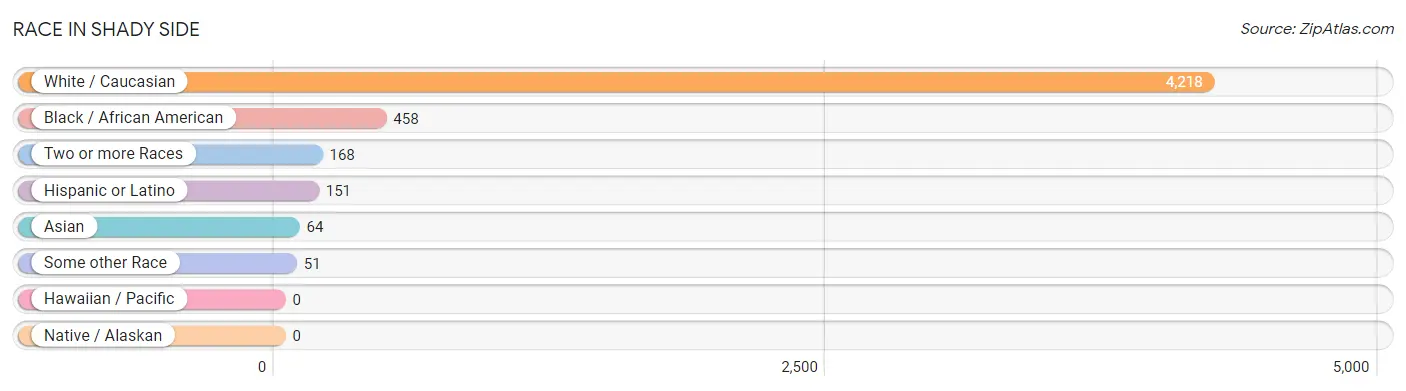
| Race | # Population | % Population |
| Asian | 64 | 1.3% |
| Black / African American | 458 | 9.2% |
| Hawaiian / Pacific | 0 | 0.0% |
| Hispanic or Latino | 151 | 3.0% |
| Native / Alaskan | 0 | 0.0% |
| White / Caucasian | 4,218 | 85.1% |
| Two or more Races | 168 | 3.4% |
| Some other Race | 51 | 1.0% |
| Total | 4,959 | 100.0% |
Ancestry in Shady Side
The most populous ancestries reported in Shady Side are Irish (1,026 | 20.7%), German (831 | 16.8%), English (520 | 10.5%), Polish (389 | 7.8%), and French (137 | 2.8%), together accounting for 58.5% of all Shady Side residents.
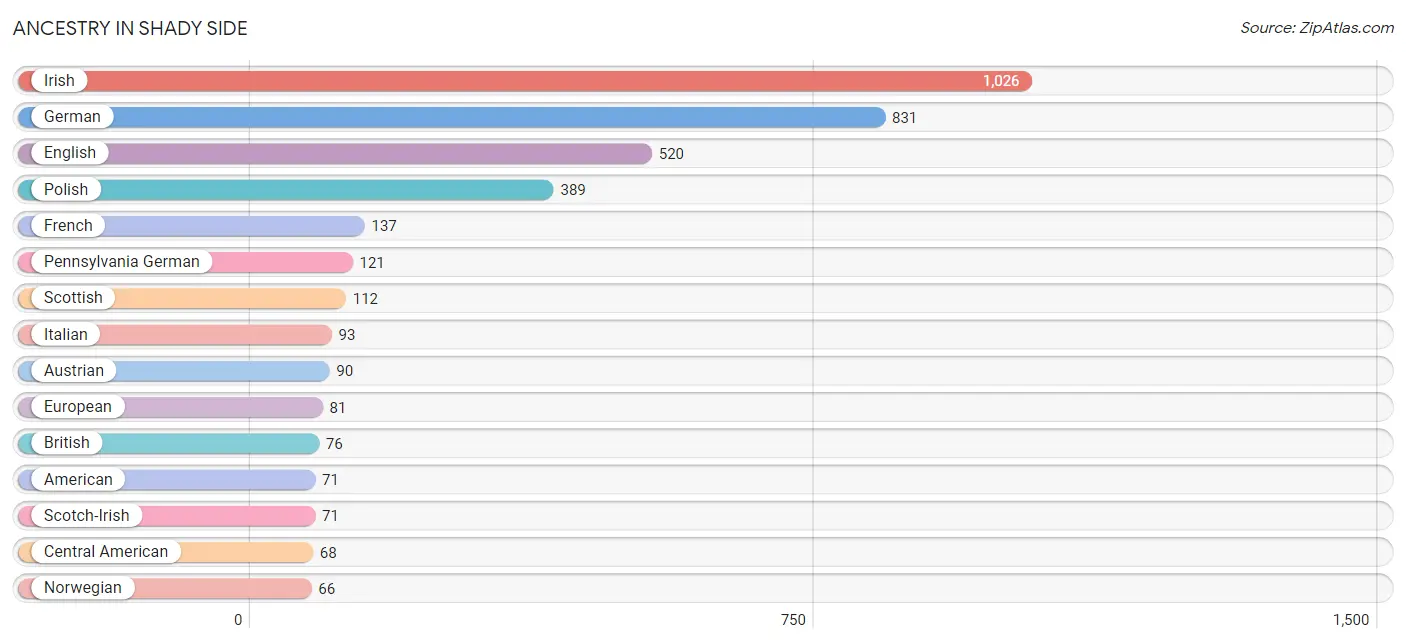
| Ancestry | # Population | % Population |
| African | 14 | 0.3% |
| American | 71 | 1.4% |
| Apache | 20 | 0.4% |
| Arab | 10 | 0.2% |
| Austrian | 90 | 1.8% |
| British | 76 | 1.5% |
| Canadian | 55 | 1.1% |
| Celtic | 29 | 0.6% |
| Central American | 68 | 1.4% |
| Cherokee | 20 | 0.4% |
| Czech | 16 | 0.3% |
| Czechoslovakian | 12 | 0.2% |
| Danish | 28 | 0.6% |
| Eastern European | 28 | 0.6% |
| English | 520 | 10.5% |
| European | 81 | 1.6% |
| Finnish | 44 | 0.9% |
| French | 137 | 2.8% |
| French Canadian | 9 | 0.2% |
| German | 831 | 16.8% |
| Guatemalan | 51 | 1.0% |
| Guyanese | 29 | 0.6% |
| Honduran | 17 | 0.3% |
| Irish | 1,026 | 20.7% |
| Italian | 93 | 1.9% |
| Jamaican | 19 | 0.4% |
| Korean | 64 | 1.3% |
| Lithuanian | 16 | 0.3% |
| Norwegian | 66 | 1.3% |
| Pennsylvania German | 121 | 2.4% |
| Polish | 389 | 7.8% |
| Puerto Rican | 15 | 0.3% |
| Romanian | 40 | 0.8% |
| Russian | 47 | 0.9% |
| Scotch-Irish | 71 | 1.4% |
| Scottish | 112 | 2.3% |
| Seminole | 27 | 0.5% |
| Serbian | 12 | 0.2% |
| Slovak | 50 | 1.0% |
| Subsaharan African | 14 | 0.3% |
| Swedish | 9 | 0.2% |
| Syrian | 10 | 0.2% |
| Thai | 25 | 0.5% |
| Welsh | 50 | 1.0% | View All 44 Rows |
Immigrants in Shady Side
The most numerous immigrant groups reported in Shady Side came from Latin America (130 | 2.6%), Central America (68 | 1.4%), Europe (65 | 1.3%), Guatemala (51 | 1.0%), and South America (43 | 0.9%), together accounting for 7.2% of all Shady Side residents.
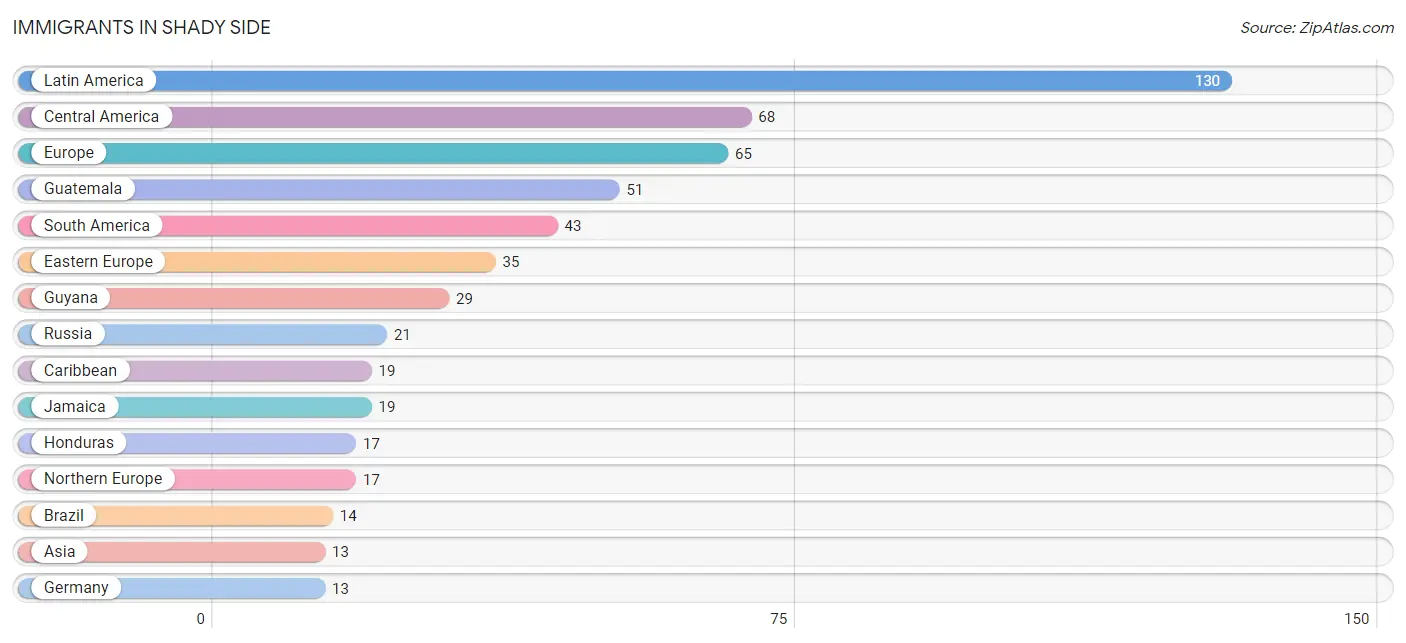
| Immigration Origin | # Population | % Population |
| Asia | 13 | 0.3% |
| Brazil | 14 | 0.3% |
| Caribbean | 19 | 0.4% |
| Central America | 68 | 1.4% |
| Eastern Europe | 35 | 0.7% |
| Europe | 65 | 1.3% |
| Germany | 13 | 0.3% |
| Guatemala | 51 | 1.0% |
| Guyana | 29 | 0.6% |
| Honduras | 17 | 0.3% |
| Jamaica | 19 | 0.4% |
| Latin America | 130 | 2.6% |
| Northern Europe | 17 | 0.3% |
| Philippines | 13 | 0.3% |
| Russia | 21 | 0.4% |
| South America | 43 | 0.9% |
| South Eastern Asia | 13 | 0.3% |
| Western Europe | 13 | 0.3% | View All 18 Rows |
Sex and Age in Shady Side
Sex and Age in Shady Side
The most populous age groups in Shady Side are 55 to 59 Years (251 | 9.8%) for men and 60 to 64 Years (286 | 12.0%) for women.
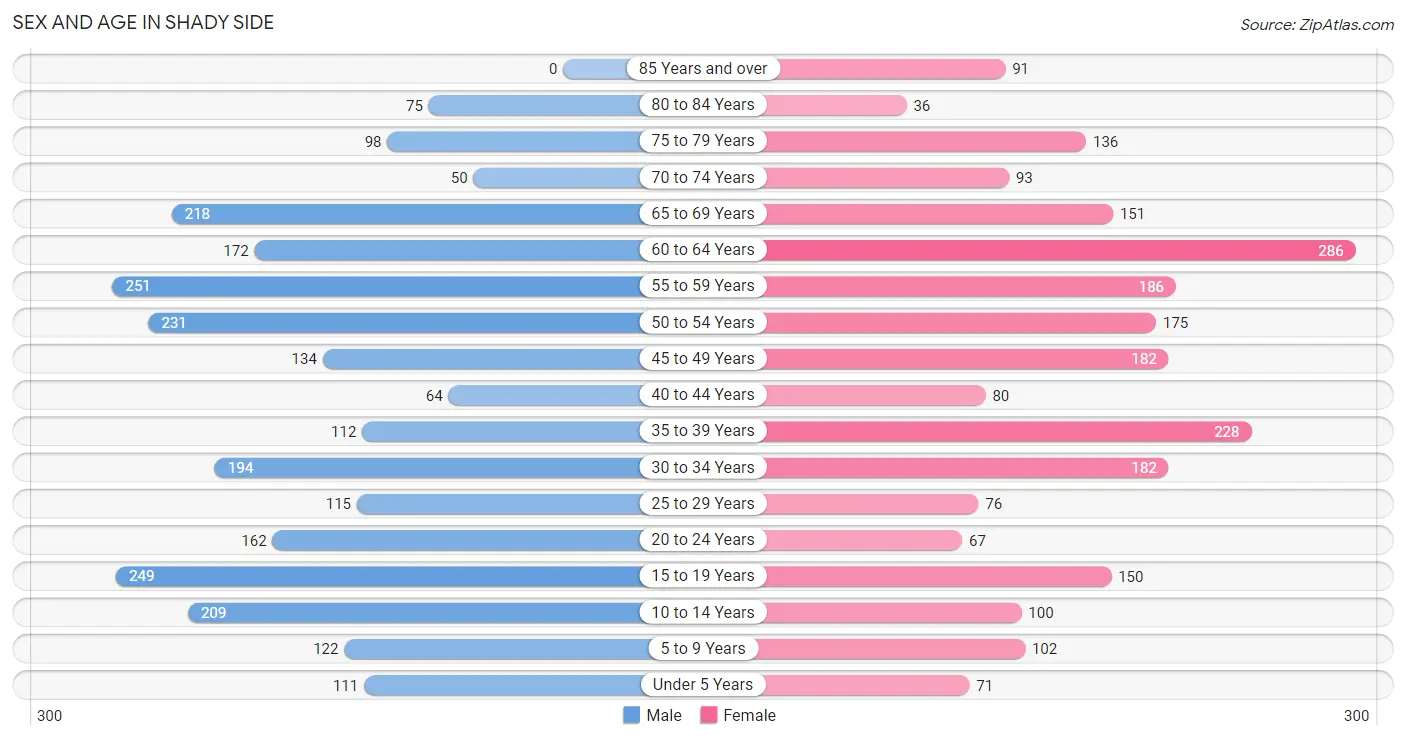
| Age Bracket | Male | Female |
| Under 5 Years | 111 (4.3%) | 71 (3.0%) |
| 5 to 9 Years | 122 (4.8%) | 102 (4.3%) |
| 10 to 14 Years | 209 (8.1%) | 100 (4.2%) |
| 15 to 19 Years | 249 (9.7%) | 150 (6.3%) |
| 20 to 24 Years | 162 (6.3%) | 67 (2.8%) |
| 25 to 29 Years | 115 (4.5%) | 76 (3.2%) |
| 30 to 34 Years | 194 (7.6%) | 182 (7.6%) |
| 35 to 39 Years | 112 (4.4%) | 228 (9.5%) |
| 40 to 44 Years | 64 (2.5%) | 80 (3.3%) |
| 45 to 49 Years | 134 (5.2%) | 182 (7.6%) |
| 50 to 54 Years | 231 (9.0%) | 175 (7.3%) |
| 55 to 59 Years | 251 (9.8%) | 186 (7.8%) |
| 60 to 64 Years | 172 (6.7%) | 286 (12.0%) |
| 65 to 69 Years | 218 (8.5%) | 151 (6.3%) |
| 70 to 74 Years | 50 (1.9%) | 93 (3.9%) |
| 75 to 79 Years | 98 (3.8%) | 136 (5.7%) |
| 80 to 84 Years | 75 (2.9%) | 36 (1.5%) |
| 85 Years and over | 0 (0.0%) | 91 (3.8%) |
| Total | 2,567 (100.0%) | 2,392 (100.0%) |
Families and Households in Shady Side
Median Family Size in Shady Side
The median family size in Shady Side is 2.77 persons per family, with married-couple families (1,220 | 75.8%) accounting for the largest median family size of 2.87 persons per family. On the other hand, single male/father families (63 | 3.9%) represent the smallest median family size with 2.27 persons per family.
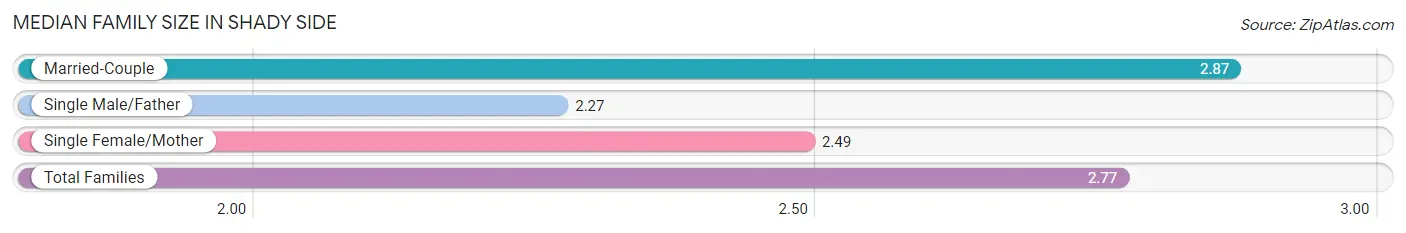
| Family Type | # Families | Family Size |
| Married-Couple | 1,220 (75.8%) | 2.87 |
| Single Male/Father | 63 (3.9%) | 2.27 |
| Single Female/Mother | 326 (20.3%) | 2.49 |
| Total Families | 1,609 (100.0%) | 2.77 |
Median Household Size in Shady Side
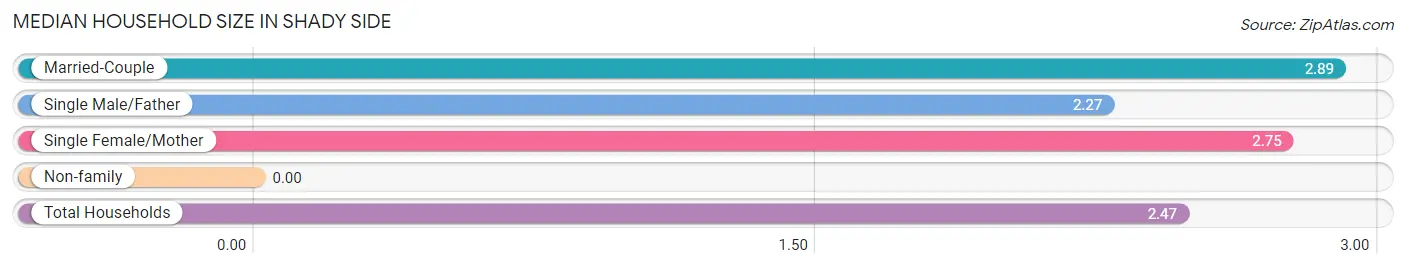
| Household Type | # Households | Household Size |
| Married-Couple | 1,220 (60.8%) | 2.89 |
| Single Male/Father | 63 (3.1%) | 2.27 |
| Single Female/Mother | 326 (16.2%) | 2.75 |
| Non-family | 399 (19.9%) | - |
| Total Households | 2,008 (100.0%) | 2.47 |
Household Size by Marriage Status in Shady Side
Out of a total of 2,008 households in Shady Side, 1,609 (80.1%) are family households, while 399 (19.9%) are nonfamily households. The most numerous type of family households are 2-person households, comprising 856, and the most common type of nonfamily households are 1-person households, comprising 399.
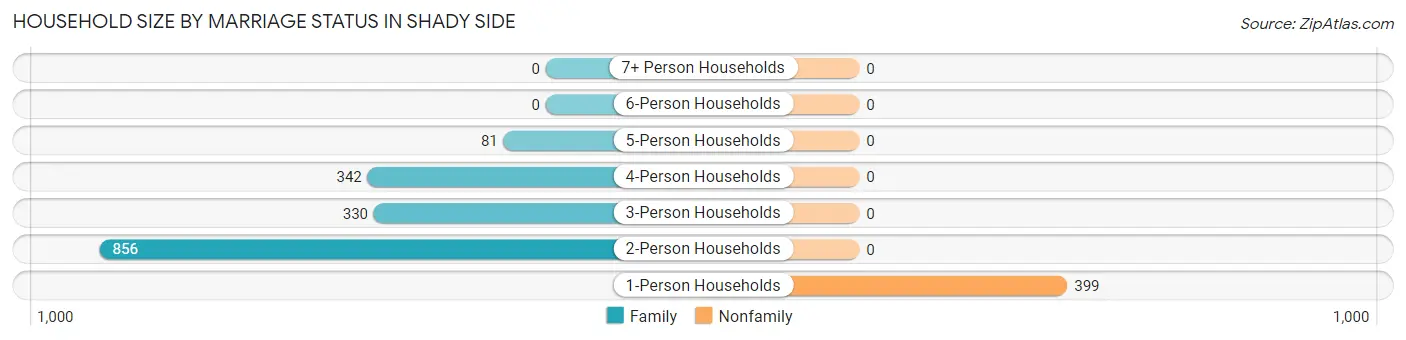
| Household Size | Family Households | Nonfamily Households |
| 1-Person Households | - | 399 (19.9%) |
| 2-Person Households | 856 (42.6%) | 0 (0.0%) |
| 3-Person Households | 330 (16.4%) | 0 (0.0%) |
| 4-Person Households | 342 (17.0%) | 0 (0.0%) |
| 5-Person Households | 81 (4.0%) | 0 (0.0%) |
| 6-Person Households | 0 (0.0%) | 0 (0.0%) |
| 7+ Person Households | 0 (0.0%) | 0 (0.0%) |
| Total | 1,609 (80.1%) | 399 (19.9%) |
Female Fertility in Shady Side
Fertility by Age in Shady Side
| Age Bracket | Women with Births | Births / 1,000 Women |
| 15 to 19 years | 0 (0.0%) | 0.0 |
| 20 to 34 years | 0 (0.0%) | 0.0 |
| 35 to 50 years | 0 (0.0%) | 0.0 |
| Total | 0 (0.0%) | 0.0 |
Fertility by Age by Marriage Status in Shady Side
| Age Bracket | Married | Unmarried |
| 15 to 19 years | 0 (0.0%) | 0 (0.0%) |
| 20 to 34 years | 0 (0.0%) | 0 (0.0%) |
| 35 to 50 years | 0 (0.0%) | 0 (0.0%) |
| Total | 0 (0.0%) | 0 (0.0%) |
Fertility by Education in Shady Side
| Educational Attainment | Women with Births | Births / 1,000 Women |
| Less than High School | 0 (0.0%) | 0.0 |
| High School Diploma | 0 (0.0%) | 0.0 |
| College or Associate's Degree | 0 (0.0%) | 0.0 |
| Bachelor's Degree | 0 (0.0%) | 0.0 |
| Graduate Degree | 0 (0.0%) | 0.0 |
| Total | 0 (0.0%) | 0.0 |
Fertility by Education by Marriage Status in Shady Side
| Educational Attainment | Married | Unmarried |
| Less than High School | 0 (0.0%) | 0 (0.0%) |
| High School Diploma | 0 (0.0%) | 0 (0.0%) |
| College or Associate's Degree | 0 (0.0%) | 0 (0.0%) |
| Bachelor's Degree | 0 (0.0%) | 0 (0.0%) |
| Graduate Degree | 0 (0.0%) | 0 (0.0%) |
| Total | 0 (0.0%) | 0 (0.0%) |
Employment Characteristics in Shady Side
Employment by Class of Employer in Shady Side
Among the 2,859 employed individuals in Shady Side, private company employees (1,741 | 60.9%), local government employees (318 | 11.1%), and not-for-profit organizations (255 | 8.9%) make up the most common classes of employment.
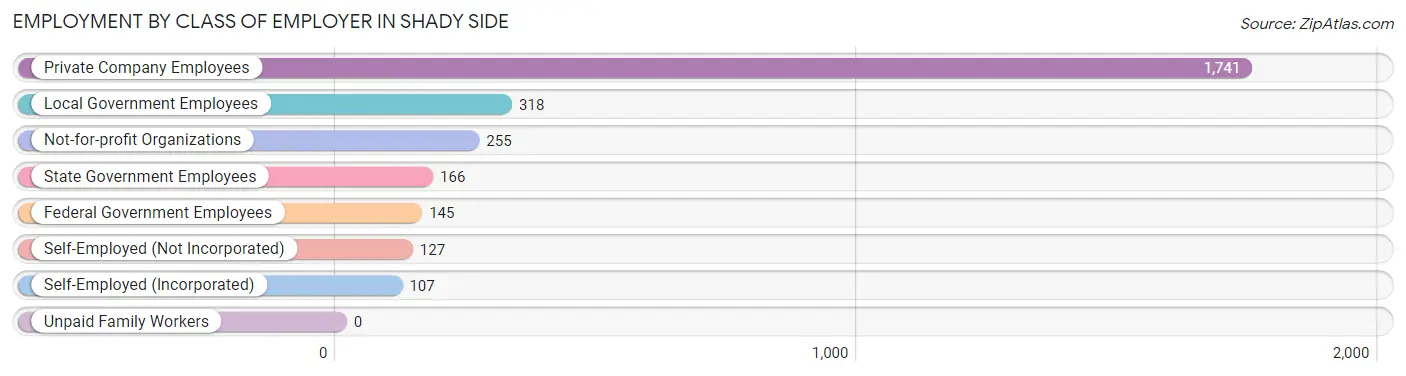
| Employer Class | # Employees | % Employees |
| Private Company Employees | 1,741 | 60.9% |
| Self-Employed (Incorporated) | 107 | 3.7% |
| Self-Employed (Not Incorporated) | 127 | 4.4% |
| Not-for-profit Organizations | 255 | 8.9% |
| Local Government Employees | 318 | 11.1% |
| State Government Employees | 166 | 5.8% |
| Federal Government Employees | 145 | 5.1% |
| Unpaid Family Workers | 0 | 0.0% |
| Total | 2,859 | 100.0% |
Employment Status by Age in Shady Side
According to the labor force statistics for Shady Side, out of the total population over 16 years of age (4,212), 71.5% or 3,012 individuals are in the labor force, with 4.6% or 139 of them unemployed. The age group with the highest labor force participation rate is 30 to 34 years, with 100.0% or 376 individuals in the labor force. Within the labor force, the 16 to 19 years age range has the highest percentage of unemployed individuals, with 24.1% or 27 of them being unemployed.
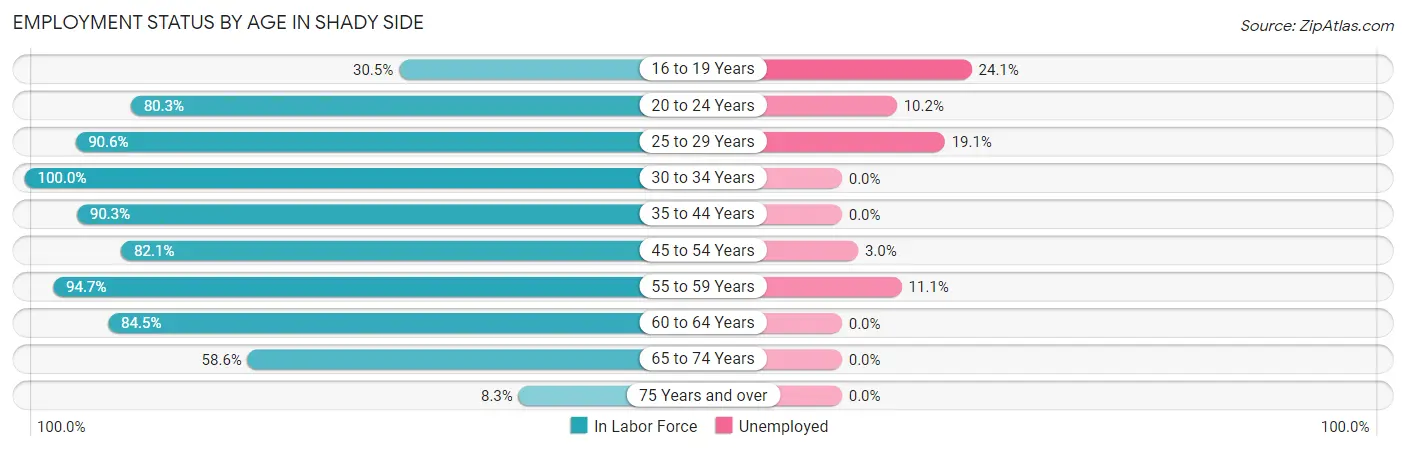
| Age Bracket | In Labor Force | Unemployed |
| 16 to 19 Years | 112 (30.5%) | 27 (24.1%) |
| 20 to 24 Years | 184 (80.3%) | 19 (10.2%) |
| 25 to 29 Years | 173 (90.6%) | 33 (19.1%) |
| 30 to 34 Years | 376 (100.0%) | 0 (0.0%) |
| 35 to 44 Years | 437 (90.3%) | 0 (0.0%) |
| 45 to 54 Years | 593 (82.1%) | 18 (3.0%) |
| 55 to 59 Years | 414 (94.7%) | 46 (11.1%) |
| 60 to 64 Years | 387 (84.5%) | 0 (0.0%) |
| 65 to 74 Years | 300 (58.6%) | 0 (0.0%) |
| 75 Years and over | 36 (8.3%) | 0 (0.0%) |
| Total | 3,012 (71.5%) | 139 (4.6%) |
Employment Status by Educational Attainment in Shady Side
According to labor force statistics for Shady Side, 89.2% of individuals (2,380) out of the total population between 25 and 64 years of age (2,668) are in the labor force, with 4.0% or 95 of them being unemployed. The group with the highest labor force participation rate are those with the educational attainment of less than high school, with 100.0% or 17 individuals in the labor force. Within the labor force, individuals with bachelor's degree or higher education have the highest percentage of unemployment, with 7.7% or 83 of them being unemployed.
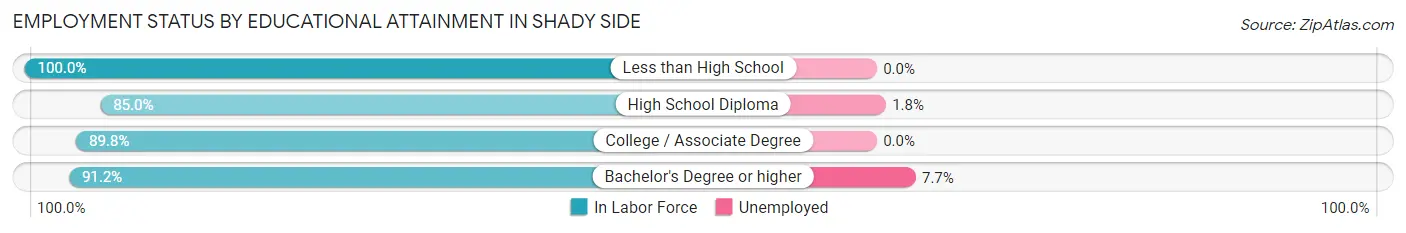
| Educational Attainment | In Labor Force | Unemployed |
| Less than High School | 17 (100.0%) | 0 (0.0%) |
| High School Diploma | 597 (85.0%) | 13 (1.8%) |
| College / Associate Degree | 684 (89.8%) | 0 (0.0%) |
| Bachelor's Degree or higher | 1,083 (91.2%) | 91 (7.7%) |
| Total | 2,380 (89.2%) | 107 (4.0%) |
Employment Occupations by Sex in Shady Side
Management, Business, Science and Arts Occupations
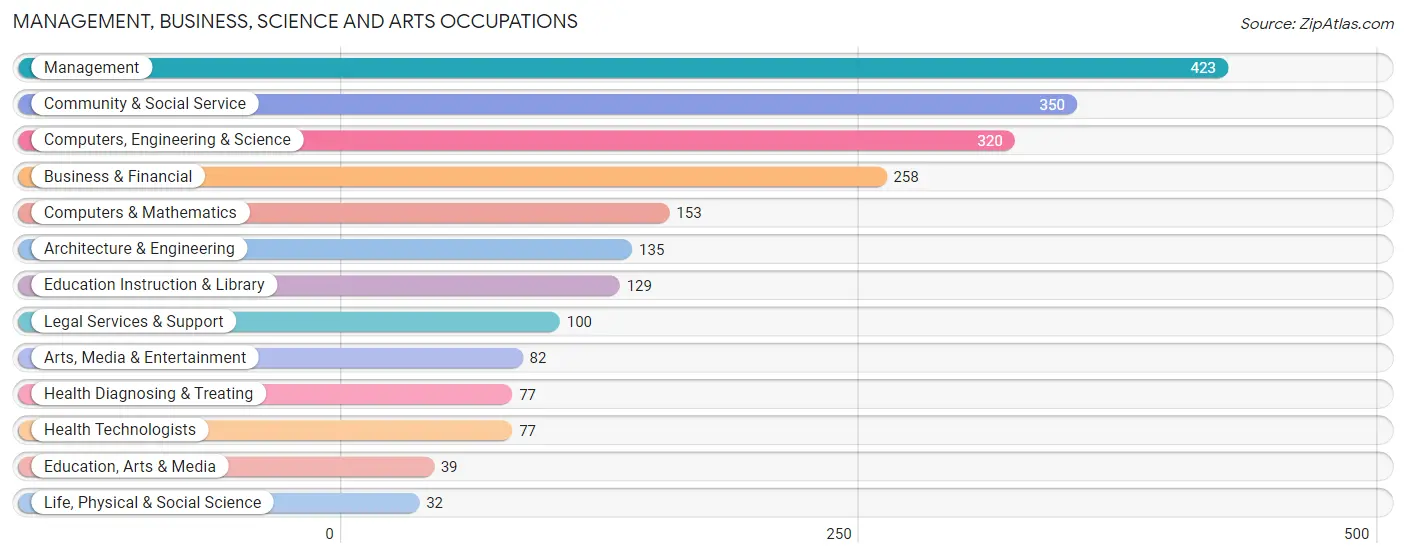
The most common Management, Business, Science and Arts occupations in Shady Side are Management (423 | 14.9%), Community & Social Service (350 | 12.3%), Computers, Engineering & Science (320 | 11.3%), Business & Financial (258 | 9.1%), and Computers & Mathematics (153 | 5.4%).
Management, Business, Science and Arts Occupations by Sex
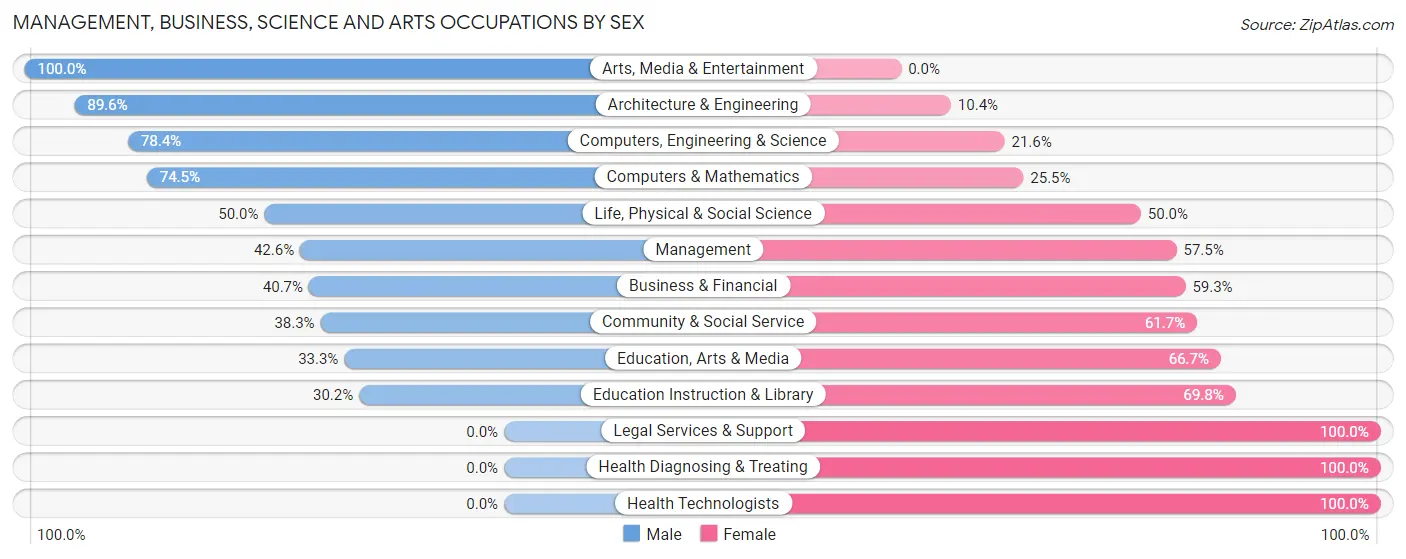
Within the Management, Business, Science and Arts occupations in Shady Side, the most male-oriented occupations are Arts, Media & Entertainment (100.0%), Architecture & Engineering (89.6%), and Computers, Engineering & Science (78.4%), while the most female-oriented occupations are Legal Services & Support (100.0%), Health Diagnosing & Treating (100.0%), and Health Technologists (100.0%).
| Occupation | Male | Female |
| Management | 180 (42.5%) | 243 (57.5%) |
| Business & Financial | 105 (40.7%) | 153 (59.3%) |
| Computers, Engineering & Science | 251 (78.4%) | 69 (21.6%) |
| Computers & Mathematics | 114 (74.5%) | 39 (25.5%) |
| Architecture & Engineering | 121 (89.6%) | 14 (10.4%) |
| Life, Physical & Social Science | 16 (50.0%) | 16 (50.0%) |
| Community & Social Service | 134 (38.3%) | 216 (61.7%) |
| Education, Arts & Media | 13 (33.3%) | 26 (66.7%) |
| Legal Services & Support | 0 (0.0%) | 100 (100.0%) |
| Education Instruction & Library | 39 (30.2%) | 90 (69.8%) |
| Arts, Media & Entertainment | 82 (100.0%) | 0 (0.0%) |
| Health Diagnosing & Treating | 0 (0.0%) | 77 (100.0%) |
| Health Technologists | 0 (0.0%) | 77 (100.0%) |
| Total (Category) | 670 (46.9%) | 758 (53.1%) |
| Total (Overall) | 1,357 (47.8%) | 1,484 (52.2%) |
Services Occupations
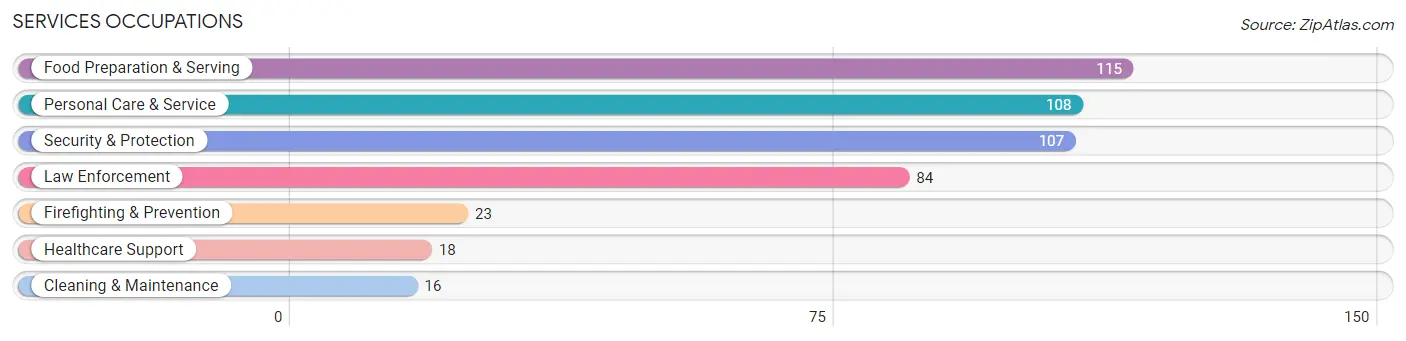
The most common Services occupations in Shady Side are Food Preparation & Serving (115 | 4.1%), Personal Care & Service (108 | 3.8%), Security & Protection (107 | 3.8%), Law Enforcement (84 | 3.0%), and Firefighting & Prevention (23 | 0.8%).
Services Occupations by Sex
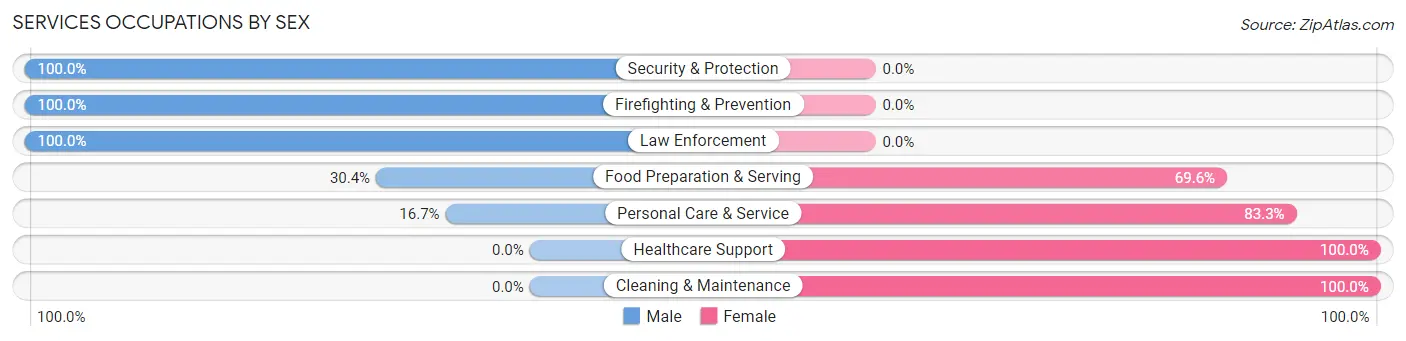
Within the Services occupations in Shady Side, the most male-oriented occupations are Security & Protection (100.0%), Firefighting & Prevention (100.0%), and Law Enforcement (100.0%), while the most female-oriented occupations are Healthcare Support (100.0%), Cleaning & Maintenance (100.0%), and Personal Care & Service (83.3%).
| Occupation | Male | Female |
| Healthcare Support | 0 (0.0%) | 18 (100.0%) |
| Security & Protection | 107 (100.0%) | 0 (0.0%) |
| Firefighting & Prevention | 23 (100.0%) | 0 (0.0%) |
| Law Enforcement | 84 (100.0%) | 0 (0.0%) |
| Food Preparation & Serving | 35 (30.4%) | 80 (69.6%) |
| Cleaning & Maintenance | 0 (0.0%) | 16 (100.0%) |
| Personal Care & Service | 18 (16.7%) | 90 (83.3%) |
| Total (Category) | 160 (44.0%) | 204 (56.0%) |
| Total (Overall) | 1,357 (47.8%) | 1,484 (52.2%) |
Sales and Office Occupations
The most common Sales and Office occupations in Shady Side are Office & Administration (390 | 13.7%), and Sales & Related (239 | 8.4%).
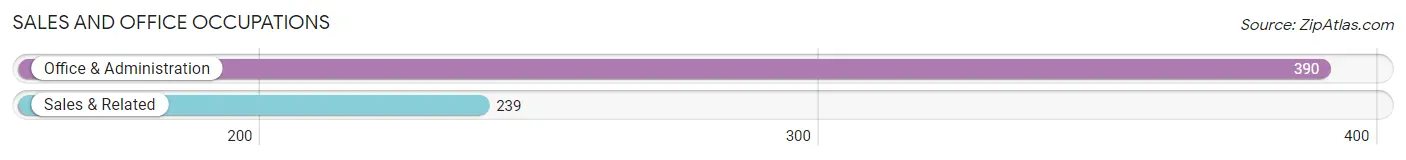
Sales and Office Occupations by Sex
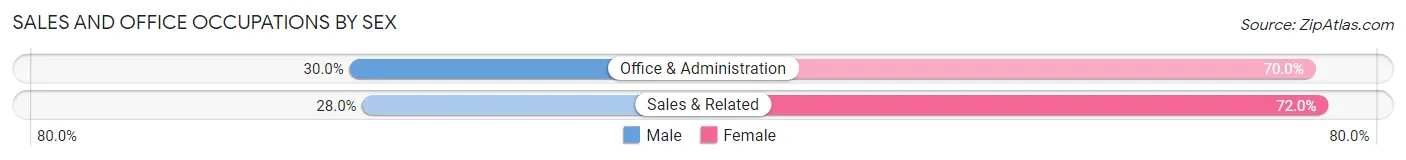
| Occupation | Male | Female |
| Sales & Related | 67 (28.0%) | 172 (72.0%) |
| Office & Administration | 117 (30.0%) | 273 (70.0%) |
| Total (Category) | 184 (29.2%) | 445 (70.8%) |
| Total (Overall) | 1,357 (47.8%) | 1,484 (52.2%) |
Natural Resources, Construction and Maintenance Occupations
The most common Natural Resources, Construction and Maintenance occupations in Shady Side are Construction & Extraction (183 | 6.4%), and Installation, Maintenance & Repair (84 | 3.0%).
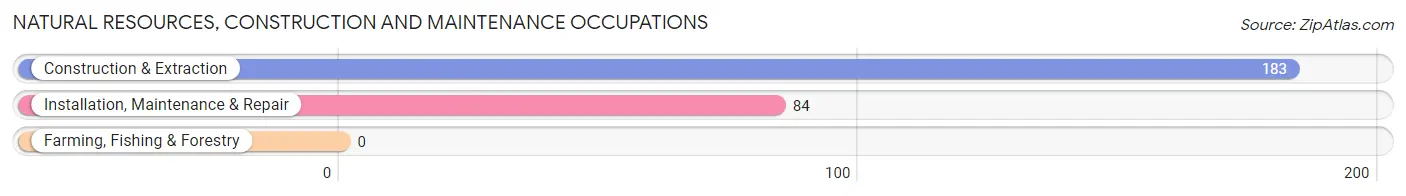
Natural Resources, Construction and Maintenance Occupations by Sex
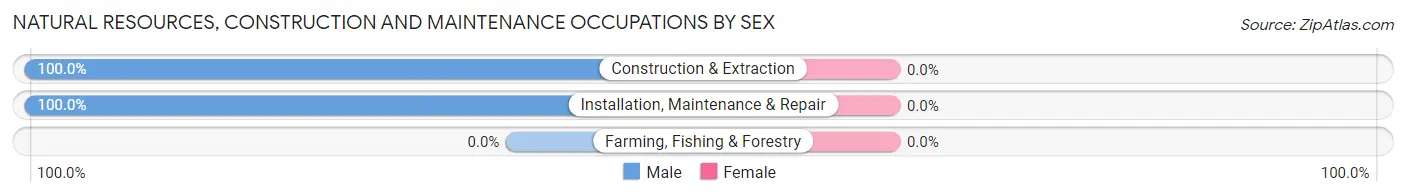
| Occupation | Male | Female |
| Farming, Fishing & Forestry | 0 (0.0%) | 0 (0.0%) |
| Construction & Extraction | 183 (100.0%) | 0 (0.0%) |
| Installation, Maintenance & Repair | 84 (100.0%) | 0 (0.0%) |
| Total (Category) | 267 (100.0%) | 0 (0.0%) |
| Total (Overall) | 1,357 (47.8%) | 1,484 (52.2%) |
Production, Transportation and Moving Occupations
The most common Production, Transportation and Moving occupations in Shady Side are Transportation (116 | 4.1%), Material Moving (20 | 0.7%), and Production (17 | 0.6%).
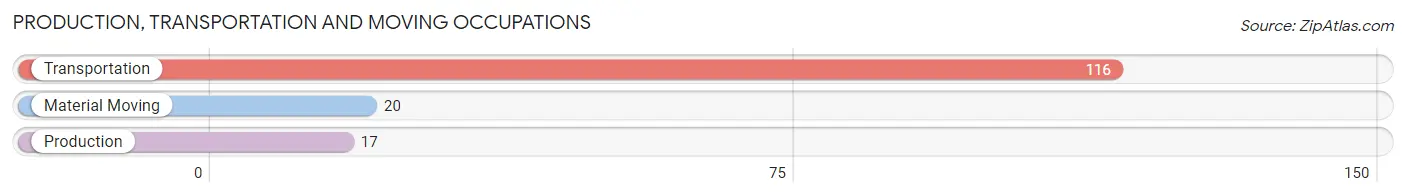
Production, Transportation and Moving Occupations by Sex
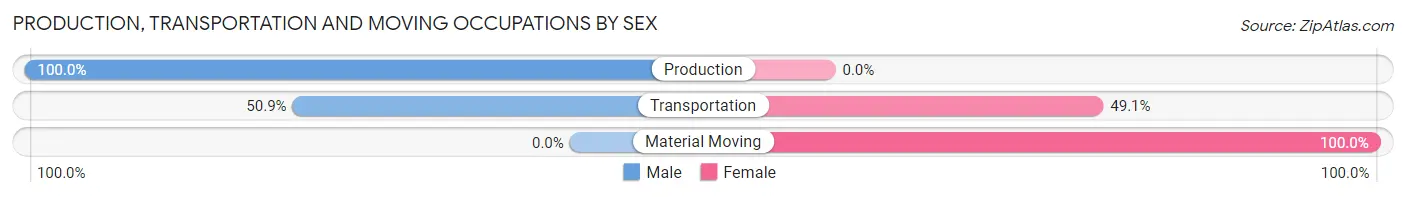
| Occupation | Male | Female |
| Production | 17 (100.0%) | 0 (0.0%) |
| Transportation | 59 (50.9%) | 57 (49.1%) |
| Material Moving | 0 (0.0%) | 20 (100.0%) |
| Total (Category) | 76 (49.7%) | 77 (50.3%) |
| Total (Overall) | 1,357 (47.8%) | 1,484 (52.2%) |
Employment Industries by Sex in Shady Side
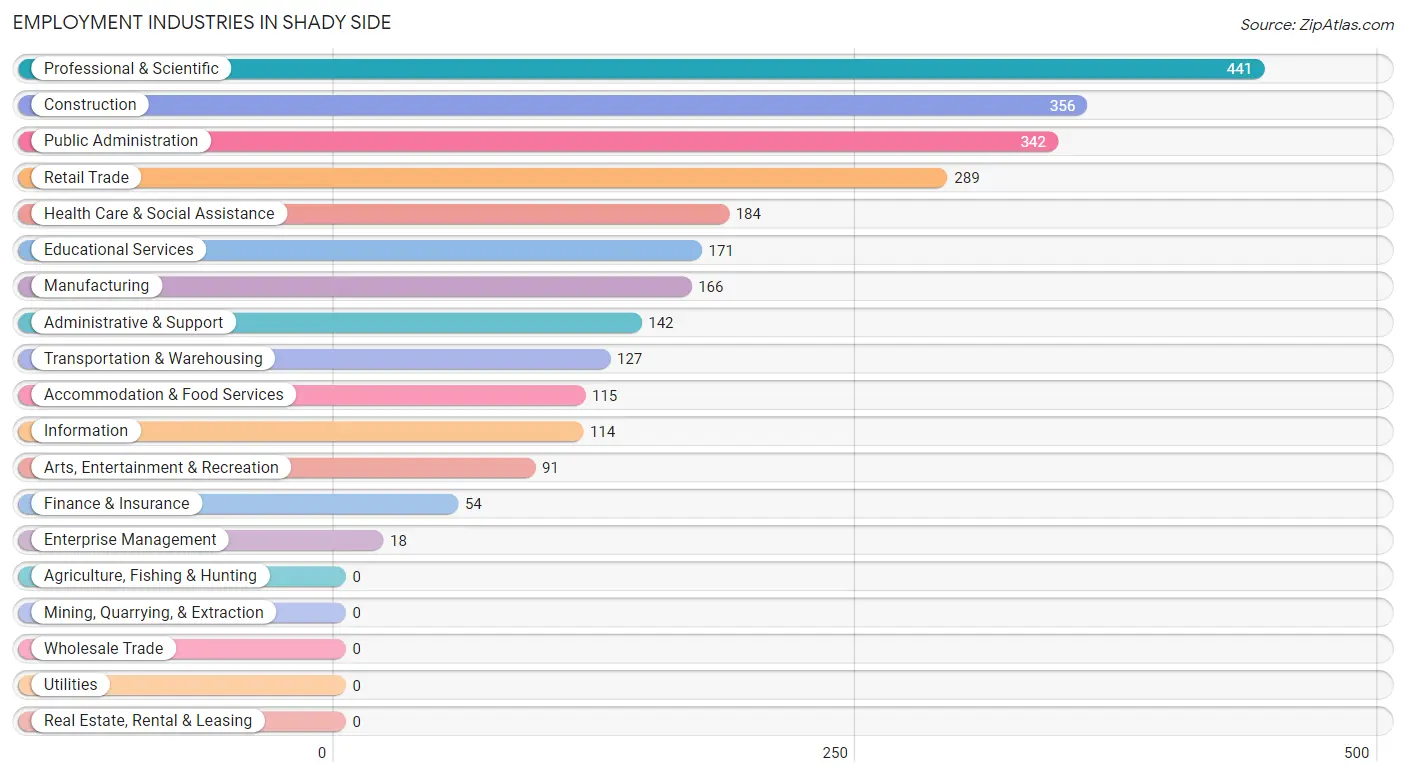
Employment Industries in Shady Side
The major employment industries in Shady Side include Professional & Scientific (441 | 15.5%), Construction (356 | 12.5%), Public Administration (342 | 12.0%), Retail Trade (289 | 10.2%), and Health Care & Social Assistance (184 | 6.5%).
Employment Industries by Sex in Shady Side
The Shady Side industries that see more men than women are Information (100.0%), Enterprise Management (100.0%), and Arts, Entertainment & Recreation (81.3%), whereas the industries that tend to have a higher number of women are Administrative & Support (100.0%), Health Care & Social Assistance (84.8%), and Retail Trade (81.7%).
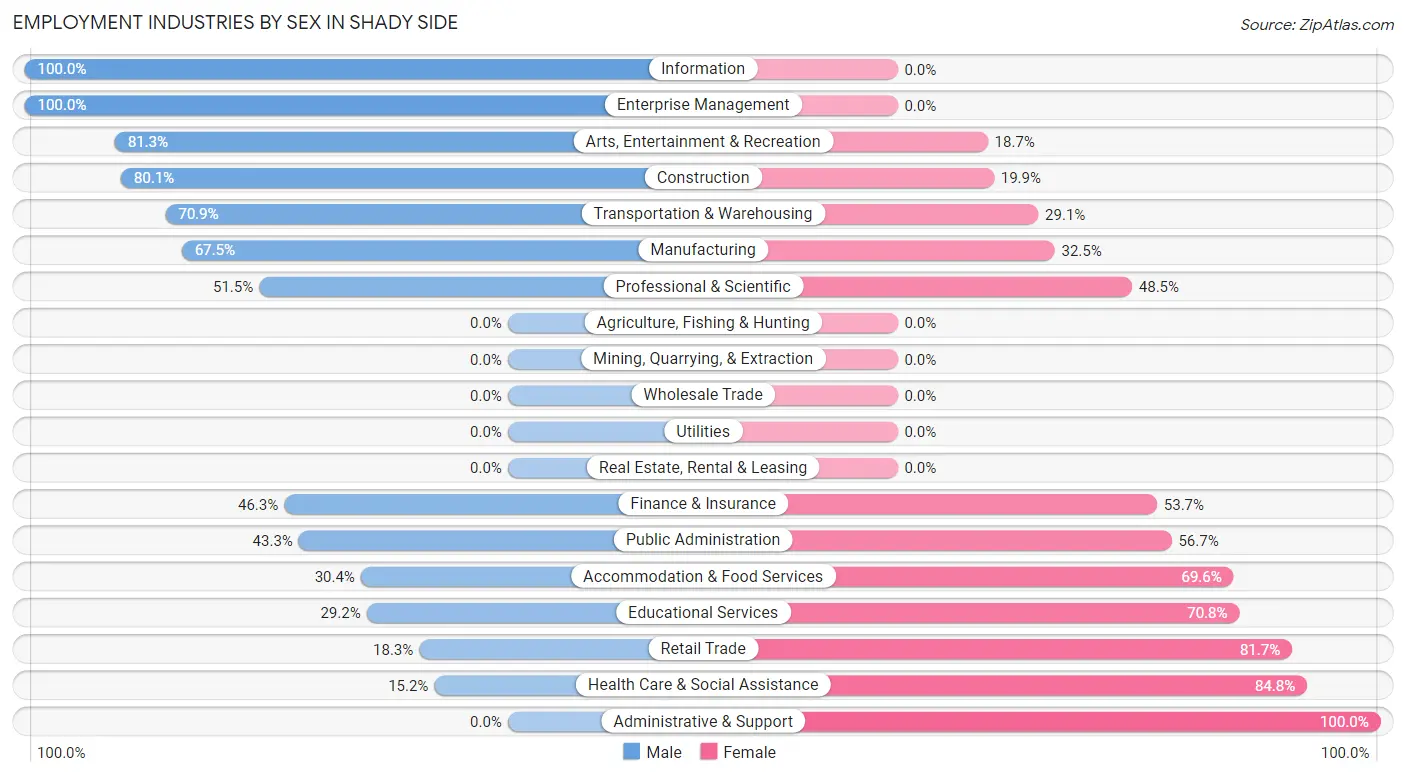
| Industry | Male | Female |
| Agriculture, Fishing & Hunting | 0 (0.0%) | 0 (0.0%) |
| Mining, Quarrying, & Extraction | 0 (0.0%) | 0 (0.0%) |
| Construction | 285 (80.1%) | 71 (19.9%) |
| Manufacturing | 112 (67.5%) | 54 (32.5%) |
| Wholesale Trade | 0 (0.0%) | 0 (0.0%) |
| Retail Trade | 53 (18.3%) | 236 (81.7%) |
| Transportation & Warehousing | 90 (70.9%) | 37 (29.1%) |
| Utilities | 0 (0.0%) | 0 (0.0%) |
| Information | 114 (100.0%) | 0 (0.0%) |
| Finance & Insurance | 25 (46.3%) | 29 (53.7%) |
| Real Estate, Rental & Leasing | 0 (0.0%) | 0 (0.0%) |
| Professional & Scientific | 227 (51.5%) | 214 (48.5%) |
| Enterprise Management | 18 (100.0%) | 0 (0.0%) |
| Administrative & Support | 0 (0.0%) | 142 (100.0%) |
| Educational Services | 50 (29.2%) | 121 (70.8%) |
| Health Care & Social Assistance | 28 (15.2%) | 156 (84.8%) |
| Arts, Entertainment & Recreation | 74 (81.3%) | 17 (18.7%) |
| Accommodation & Food Services | 35 (30.4%) | 80 (69.6%) |
| Public Administration | 148 (43.3%) | 194 (56.7%) |
| Total | 1,357 (47.8%) | 1,484 (52.2%) |
Education in Shady Side
School Enrollment in Shady Side
The most common levels of schooling among the 1,208 students in Shady Side are college / undergraduate (325 | 26.9%), high school (286 | 23.7%), and middle school (244 | 20.2%).
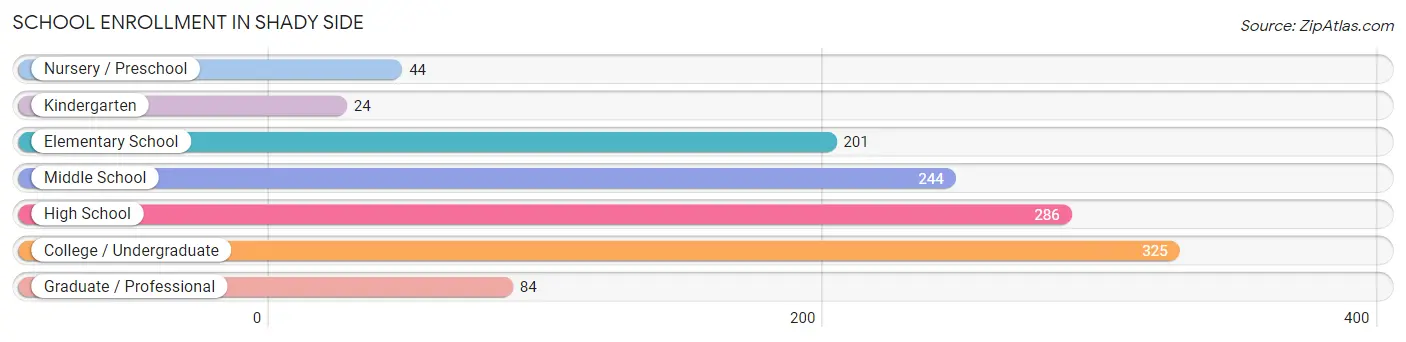
| School Level | # Students | % Students |
| Nursery / Preschool | 44 | 3.6% |
| Kindergarten | 24 | 2.0% |
| Elementary School | 201 | 16.6% |
| Middle School | 244 | 20.2% |
| High School | 286 | 23.7% |
| College / Undergraduate | 325 | 26.9% |
| Graduate / Professional | 84 | 7.0% |
| Total | 1,208 | 100.0% |
School Enrollment by Age by Funding Source in Shady Side
Out of a total of 1,208 students who are enrolled in schools in Shady Side, 176 (14.6%) attend a private institution, while the remaining 1,032 (85.4%) are enrolled in public schools. The age group of 3 to 4 year olds has the highest likelihood of being enrolled in private schools, with 44 (100.0% in the age bracket) enrolled. Conversely, the age group of 10 to 14 year olds has the lowest likelihood of being enrolled in a private school, with 309 (100.0% in the age bracket) attending a public institution.
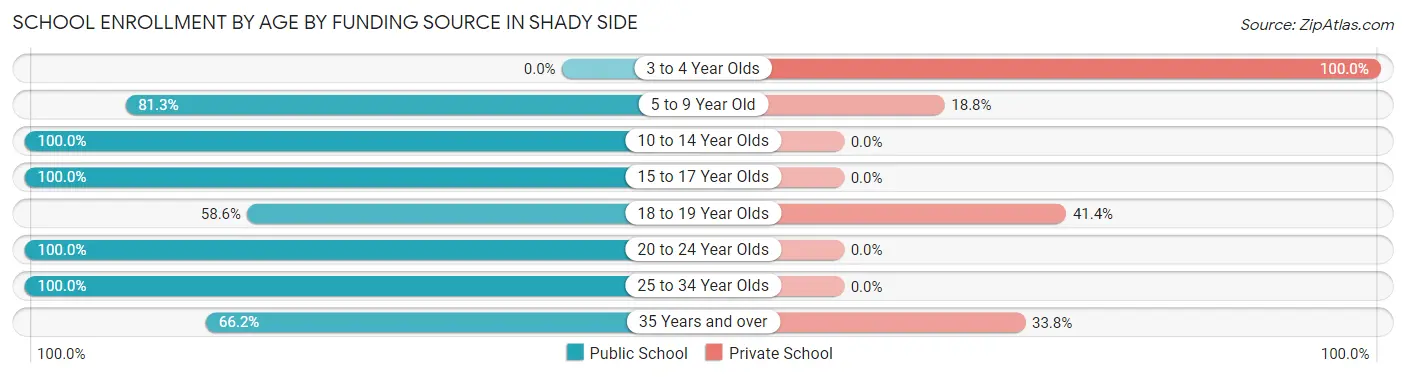
| Age Bracket | Public School | Private School |
| 3 to 4 Year Olds | 0 (0.0%) | 44 (100.0%) |
| 5 to 9 Year Old | 182 (81.2%) | 42 (18.8%) |
| 10 to 14 Year Olds | 309 (100.0%) | 0 (0.0%) |
| 15 to 17 Year Olds | 242 (100.0%) | 0 (0.0%) |
| 18 to 19 Year Olds | 92 (58.6%) | 65 (41.4%) |
| 20 to 24 Year Olds | 98 (100.0%) | 0 (0.0%) |
| 25 to 34 Year Olds | 60 (100.0%) | 0 (0.0%) |
| 35 Years and over | 49 (66.2%) | 25 (33.8%) |
| Total | 1,032 (85.4%) | 176 (14.6%) |
Educational Attainment by Field of Study in Shady Side
Business (234 | 14.5%), social sciences (219 | 13.6%), engineering (160 | 9.9%), education (156 | 9.7%), and bio, nature & agricultural (139 | 8.6%) are the most common fields of study among 1,616 individuals in Shady Side who have obtained a bachelor's degree or higher.
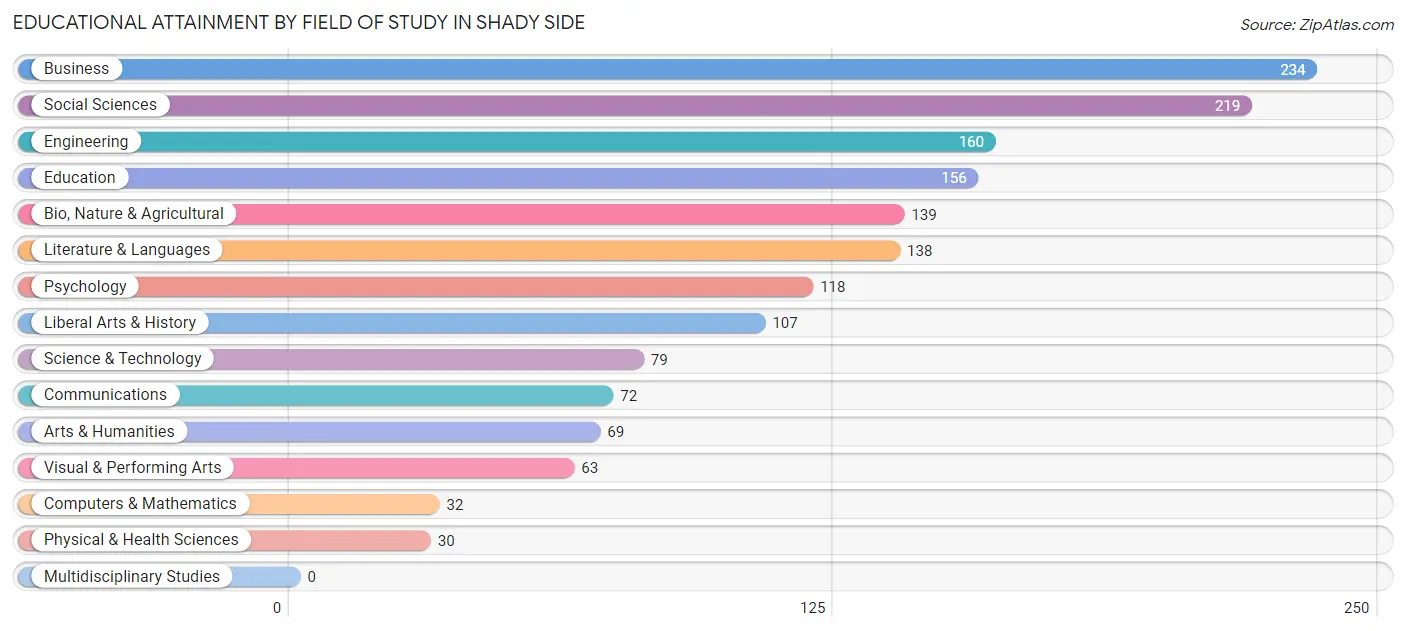
| Field of Study | # Graduates | % Graduates |
| Computers & Mathematics | 32 | 2.0% |
| Bio, Nature & Agricultural | 139 | 8.6% |
| Physical & Health Sciences | 30 | 1.9% |
| Psychology | 118 | 7.3% |
| Social Sciences | 219 | 13.6% |
| Engineering | 160 | 9.9% |
| Multidisciplinary Studies | 0 | 0.0% |
| Science & Technology | 79 | 4.9% |
| Business | 234 | 14.5% |
| Education | 156 | 9.7% |
| Literature & Languages | 138 | 8.5% |
| Liberal Arts & History | 107 | 6.6% |
| Visual & Performing Arts | 63 | 3.9% |
| Communications | 72 | 4.5% |
| Arts & Humanities | 69 | 4.3% |
| Total | 1,616 | 100.0% |
Transportation & Commute in Shady Side
Vehicle Availability by Sex in Shady Side
The most prevalent vehicle ownership categories in Shady Side are males with 2 vehicles (540, accounting for 39.3%) and females with 2 vehicles (626, making up 36.4%).
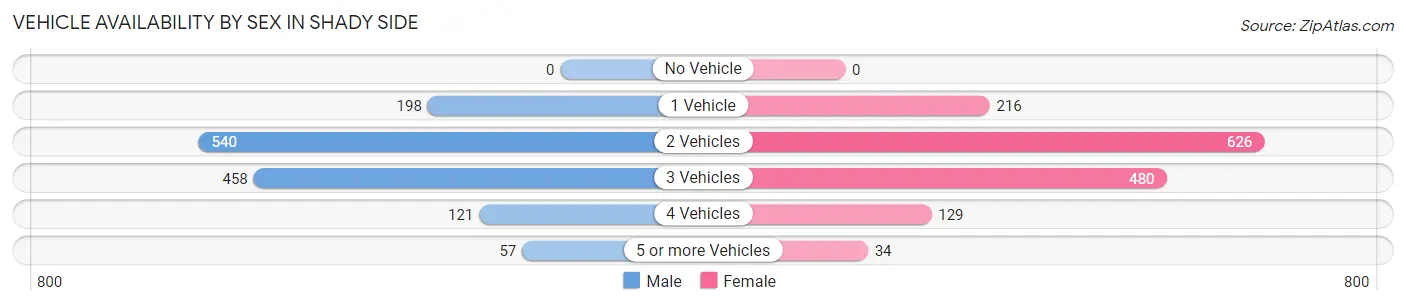
| Vehicles Available | Male | Female |
| No Vehicle | 0 (0.0%) | 0 (0.0%) |
| 1 Vehicle | 198 (14.4%) | 216 (14.5%) |
| 2 Vehicles | 540 (39.3%) | 626 (42.1%) |
| 3 Vehicles | 458 (33.3%) | 480 (32.3%) |
| 4 Vehicles | 121 (8.8%) | 129 (8.7%) |
| 5 or more Vehicles | 57 (4.2%) | 34 (2.3%) |
| Total | 1,374 (100.0%) | 1,485 (100.0%) |
Commute Time in Shady Side
The most frequently occuring commute durations in Shady Side are 45 to 59 minutes (577 commuters, 23.0%), 30 to 34 minutes (508 commuters, 20.3%), and 60 to 89 minutes (485 commuters, 19.3%).
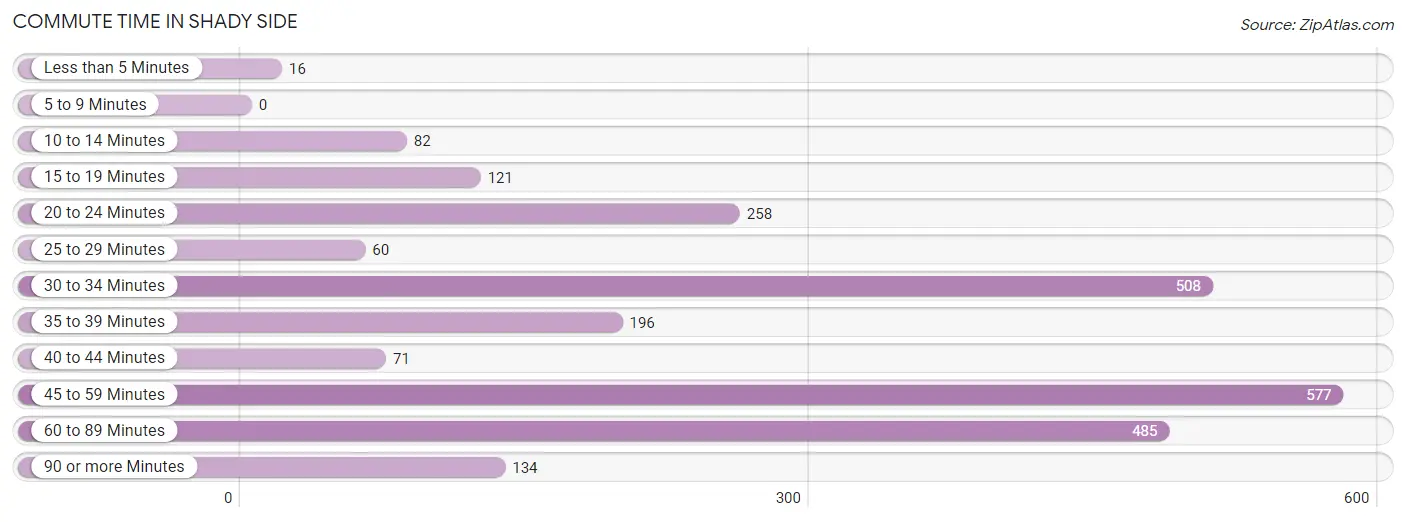
| Commute Time | # Commuters | % Commuters |
| Less than 5 Minutes | 16 | 0.6% |
| 5 to 9 Minutes | 0 | 0.0% |
| 10 to 14 Minutes | 82 | 3.3% |
| 15 to 19 Minutes | 121 | 4.8% |
| 20 to 24 Minutes | 258 | 10.3% |
| 25 to 29 Minutes | 60 | 2.4% |
| 30 to 34 Minutes | 508 | 20.3% |
| 35 to 39 Minutes | 196 | 7.8% |
| 40 to 44 Minutes | 71 | 2.8% |
| 45 to 59 Minutes | 577 | 23.0% |
| 60 to 89 Minutes | 485 | 19.3% |
| 90 or more Minutes | 134 | 5.3% |
Commute Time by Sex in Shady Side
The most common commute times in Shady Side are 60 to 89 minutes (313 commuters, 25.7%) for males and 30 to 34 minutes (323 commuters, 25.1%) for females.
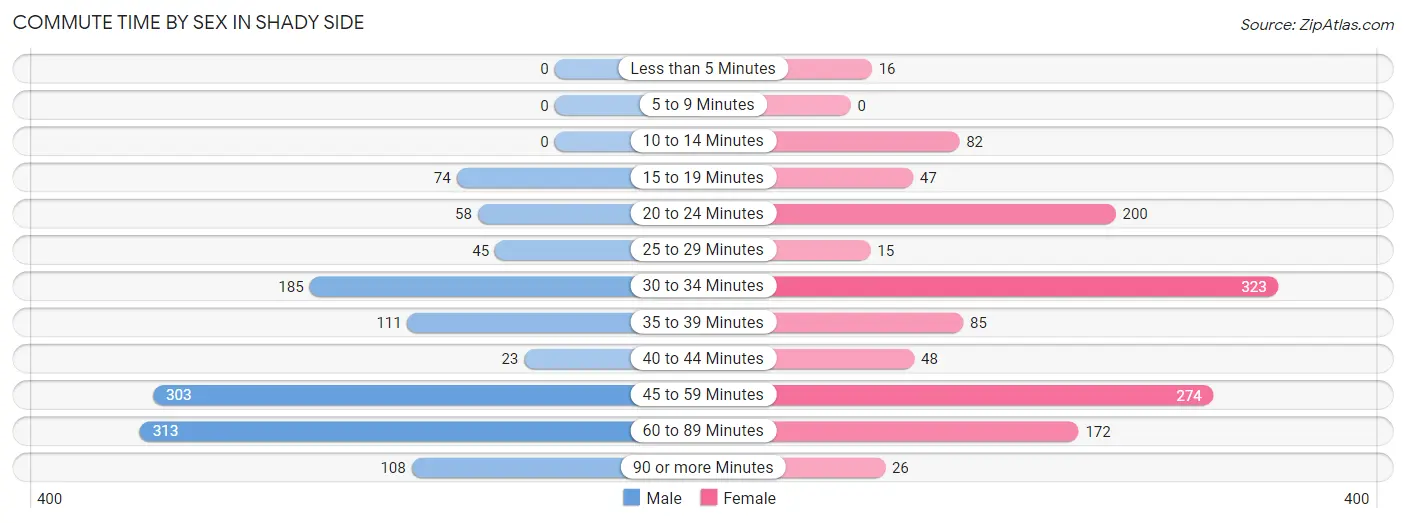
| Commute Time | Male | Female |
| Less than 5 Minutes | 0 (0.0%) | 16 (1.2%) |
| 5 to 9 Minutes | 0 (0.0%) | 0 (0.0%) |
| 10 to 14 Minutes | 0 (0.0%) | 82 (6.4%) |
| 15 to 19 Minutes | 74 (6.1%) | 47 (3.6%) |
| 20 to 24 Minutes | 58 (4.8%) | 200 (15.5%) |
| 25 to 29 Minutes | 45 (3.7%) | 15 (1.2%) |
| 30 to 34 Minutes | 185 (15.2%) | 323 (25.1%) |
| 35 to 39 Minutes | 111 (9.1%) | 85 (6.6%) |
| 40 to 44 Minutes | 23 (1.9%) | 48 (3.7%) |
| 45 to 59 Minutes | 303 (24.8%) | 274 (21.3%) |
| 60 to 89 Minutes | 313 (25.7%) | 172 (13.4%) |
| 90 or more Minutes | 108 (8.8%) | 26 (2.0%) |
Time of Departure to Work by Sex in Shady Side
The most frequent times of departure to work in Shady Side are 7:00 AM to 7:29 AM (381, 31.2%) for males and 8:00 AM to 8:29 AM (334, 25.9%) for females.
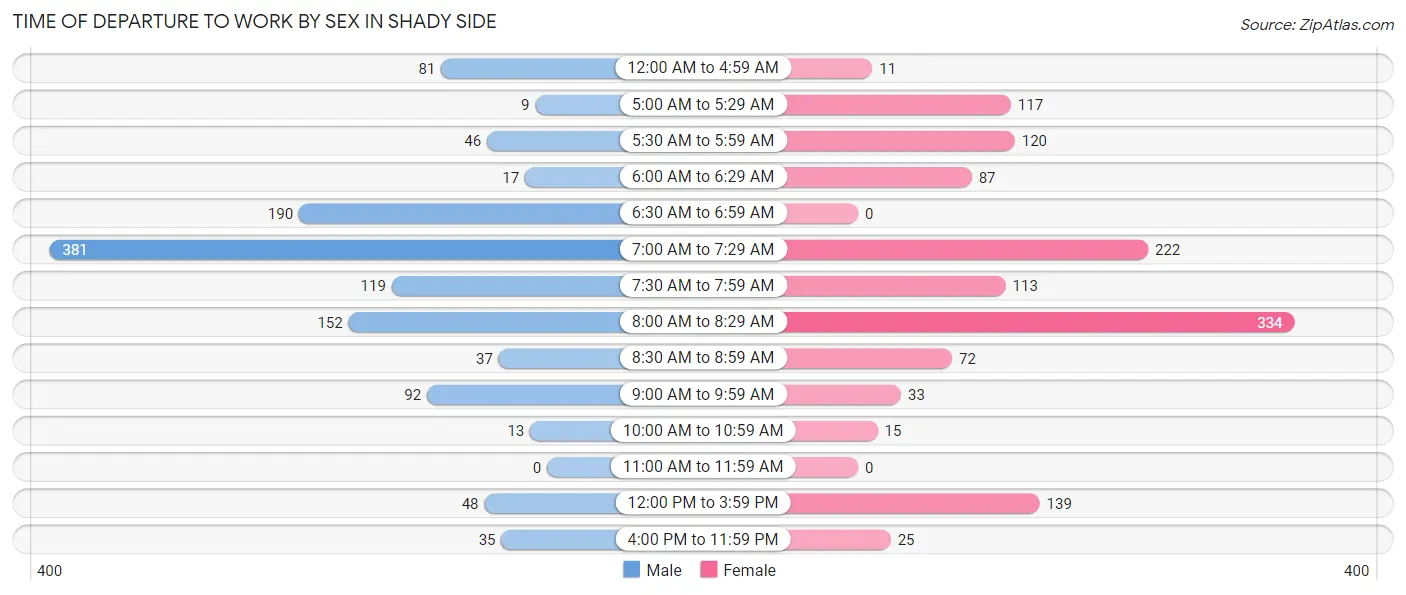
| Time of Departure | Male | Female |
| 12:00 AM to 4:59 AM | 81 (6.6%) | 11 (0.9%) |
| 5:00 AM to 5:29 AM | 9 (0.7%) | 117 (9.1%) |
| 5:30 AM to 5:59 AM | 46 (3.8%) | 120 (9.3%) |
| 6:00 AM to 6:29 AM | 17 (1.4%) | 87 (6.8%) |
| 6:30 AM to 6:59 AM | 190 (15.6%) | 0 (0.0%) |
| 7:00 AM to 7:29 AM | 381 (31.2%) | 222 (17.2%) |
| 7:30 AM to 7:59 AM | 119 (9.8%) | 113 (8.8%) |
| 8:00 AM to 8:29 AM | 152 (12.5%) | 334 (25.9%) |
| 8:30 AM to 8:59 AM | 37 (3.0%) | 72 (5.6%) |
| 9:00 AM to 9:59 AM | 92 (7.5%) | 33 (2.6%) |
| 10:00 AM to 10:59 AM | 13 (1.1%) | 15 (1.2%) |
| 11:00 AM to 11:59 AM | 0 (0.0%) | 0 (0.0%) |
| 12:00 PM to 3:59 PM | 48 (3.9%) | 139 (10.8%) |
| 4:00 PM to 11:59 PM | 35 (2.9%) | 25 (1.9%) |
| Total | 1,220 (100.0%) | 1,288 (100.0%) |
Housing Occupancy in Shady Side
Occupancy by Ownership in Shady Side
Of the total 2,008 dwellings in Shady Side, owner-occupied units account for 1,797 (89.5%), while renter-occupied units make up 211 (10.5%).
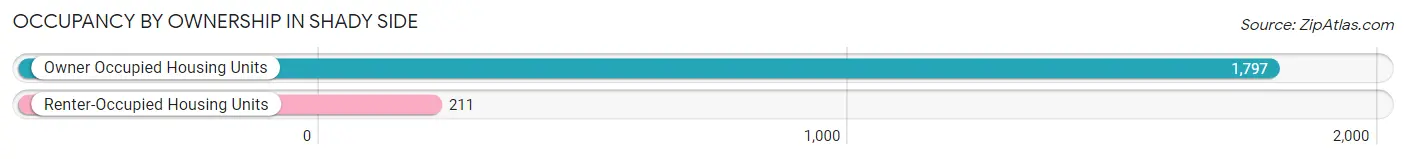
| Occupancy | # Housing Units | % Housing Units |
| Owner Occupied Housing Units | 1,797 | 89.5% |
| Renter-Occupied Housing Units | 211 | 10.5% |
| Total Occupied Housing Units | 2,008 | 100.0% |
Occupancy by Household Size in Shady Side
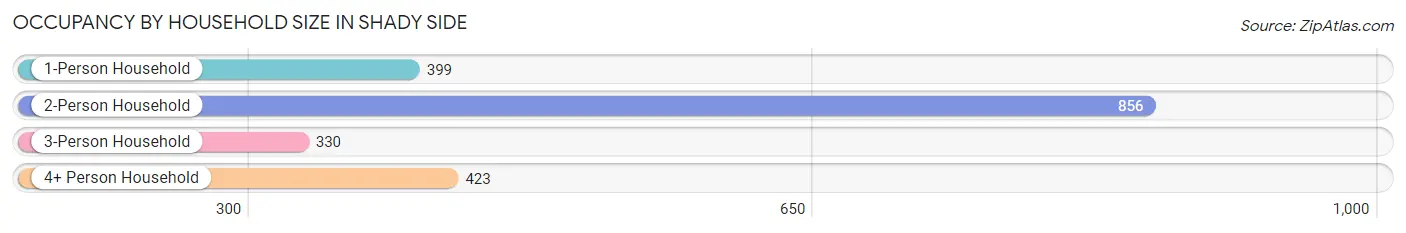
| Household Size | # Housing Units | % Housing Units |
| 1-Person Household | 399 | 19.9% |
| 2-Person Household | 856 | 42.6% |
| 3-Person Household | 330 | 16.4% |
| 4+ Person Household | 423 | 21.1% |
| Total Housing Units | 2,008 | 100.0% |
Occupancy by Ownership by Household Size in Shady Side

| Household Size | Owner-occupied | Renter-occupied |
| 1-Person Household | 384 (96.2%) | 15 (3.8%) |
| 2-Person Household | 750 (87.6%) | 106 (12.4%) |
| 3-Person Household | 257 (77.9%) | 73 (22.1%) |
| 4+ Person Household | 406 (96.0%) | 17 (4.0%) |
| Total Housing Units | 1,797 (89.5%) | 211 (10.5%) |
Occupancy by Educational Attainment in Shady Side
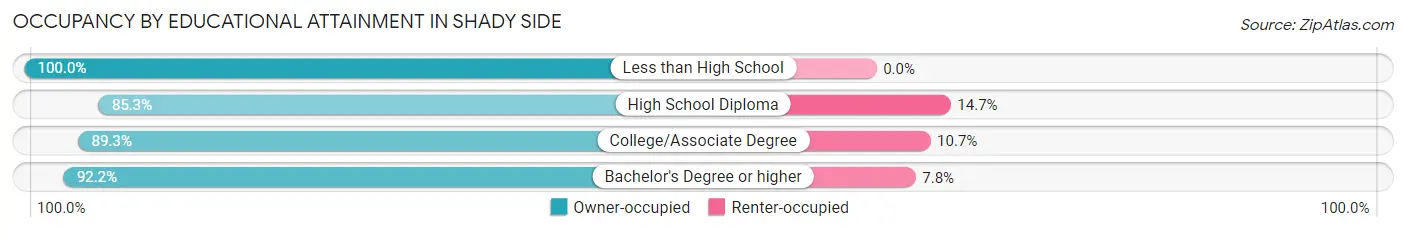
| Household Size | Owner-occupied | Renter-occupied |
| Less than High School | 13 (100.0%) | 0 (0.0%) |
| High School Diploma | 452 (85.3%) | 78 (14.7%) |
| College/Associate Degree | 584 (89.3%) | 70 (10.7%) |
| Bachelor's Degree or higher | 748 (92.2%) | 63 (7.8%) |
Occupancy by Age of Householder in Shady Side
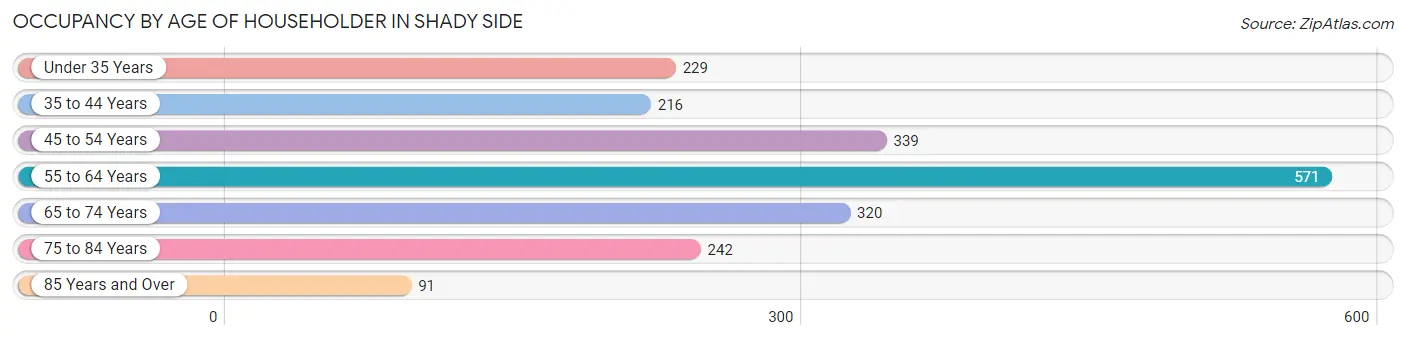
| Age Bracket | # Households | % Households |
| Under 35 Years | 229 | 11.4% |
| 35 to 44 Years | 216 | 10.8% |
| 45 to 54 Years | 339 | 16.9% |
| 55 to 64 Years | 571 | 28.4% |
| 65 to 74 Years | 320 | 15.9% |
| 75 to 84 Years | 242 | 12.0% |
| 85 Years and Over | 91 | 4.5% |
| Total | 2,008 | 100.0% |
Housing Finances in Shady Side
Median Income by Occupancy in Shady Side
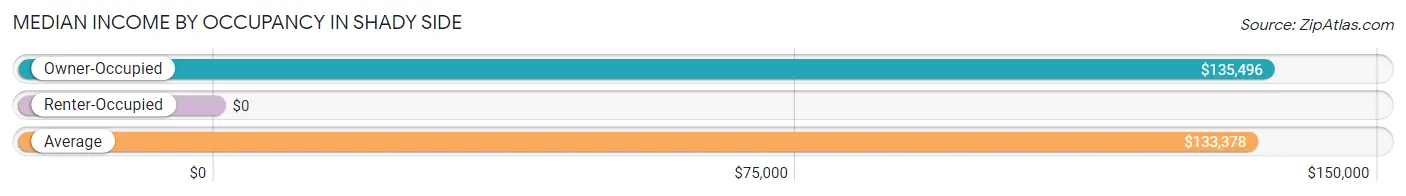
| Occupancy Type | # Households | Median Income |
| Owner-Occupied | 1,797 (89.5%) | $135,496 |
| Renter-Occupied | 211 (10.5%) | $0 |
| Average | 2,008 (100.0%) | $133,378 |
Occupancy by Householder Income Bracket in Shady Side
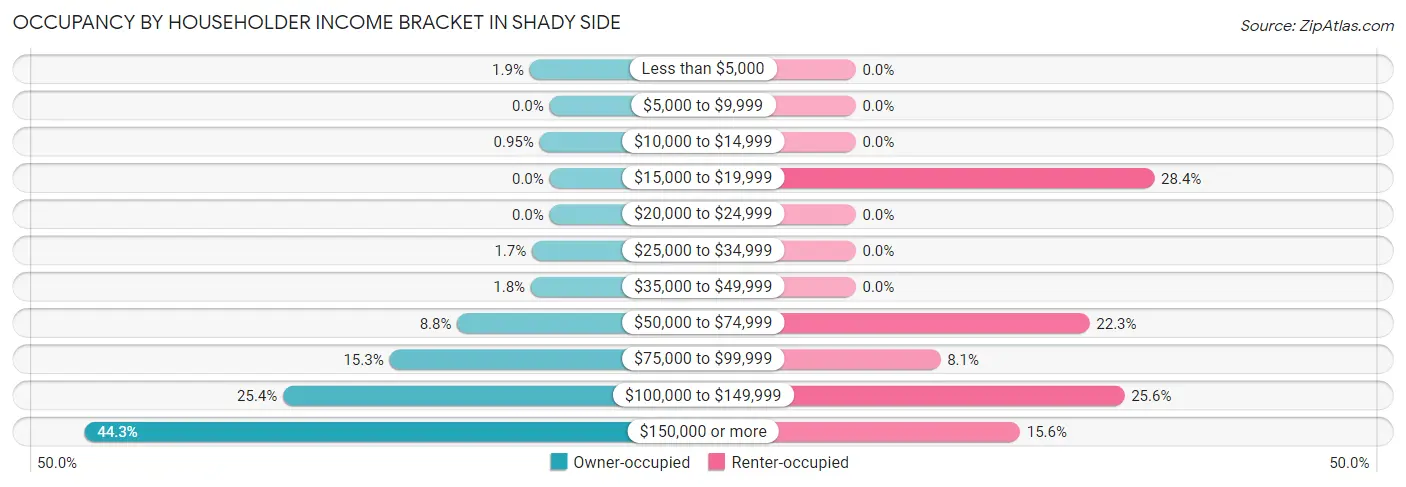
| Income Bracket | Owner-occupied | Renter-occupied |
| Less than $5,000 | 34 (1.9%) | 0 (0.0%) |
| $5,000 to $9,999 | 0 (0.0%) | 0 (0.0%) |
| $10,000 to $14,999 | 17 (0.9%) | 0 (0.0%) |
| $15,000 to $19,999 | 0 (0.0%) | 60 (28.4%) |
| $20,000 to $24,999 | 0 (0.0%) | 0 (0.0%) |
| $25,000 to $34,999 | 30 (1.7%) | 0 (0.0%) |
| $35,000 to $49,999 | 32 (1.8%) | 0 (0.0%) |
| $50,000 to $74,999 | 158 (8.8%) | 47 (22.3%) |
| $75,000 to $99,999 | 274 (15.2%) | 17 (8.1%) |
| $100,000 to $149,999 | 456 (25.4%) | 54 (25.6%) |
| $150,000 or more | 796 (44.3%) | 33 (15.6%) |
| Total | 1,797 (100.0%) | 211 (100.0%) |
Monthly Housing Cost Tiers in Shady Side
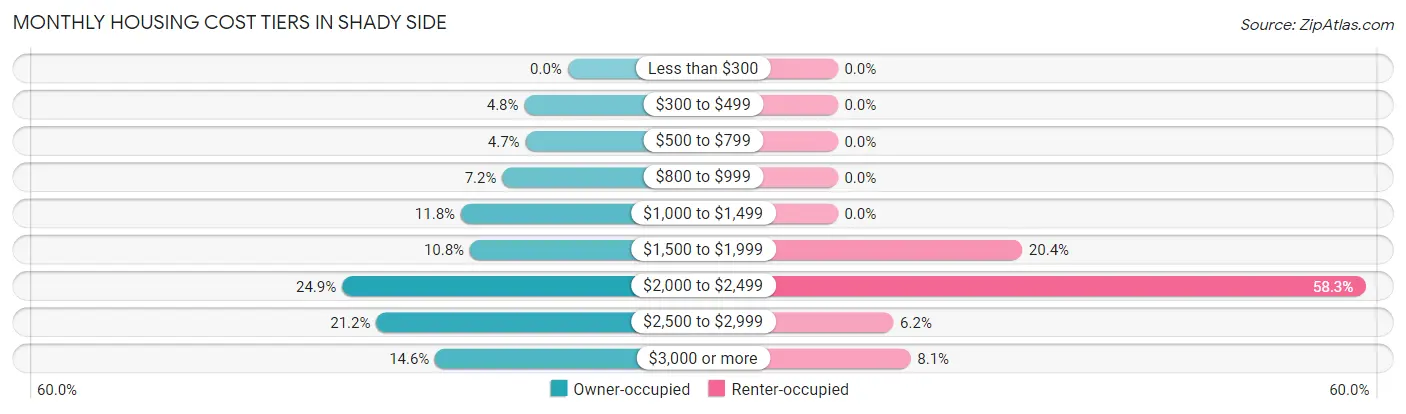
| Monthly Cost | Owner-occupied | Renter-occupied |
| Less than $300 | 0 (0.0%) | 0 (0.0%) |
| $300 to $499 | 86 (4.8%) | 0 (0.0%) |
| $500 to $799 | 84 (4.7%) | 0 (0.0%) |
| $800 to $999 | 130 (7.2%) | 0 (0.0%) |
| $1,000 to $1,499 | 212 (11.8%) | 0 (0.0%) |
| $1,500 to $1,999 | 194 (10.8%) | 43 (20.4%) |
| $2,000 to $2,499 | 448 (24.9%) | 123 (58.3%) |
| $2,500 to $2,999 | 380 (21.1%) | 13 (6.2%) |
| $3,000 or more | 263 (14.6%) | 17 (8.1%) |
| Total | 1,797 (100.0%) | 211 (100.0%) |
Physical Housing Characteristics in Shady Side
Housing Structures in Shady Side
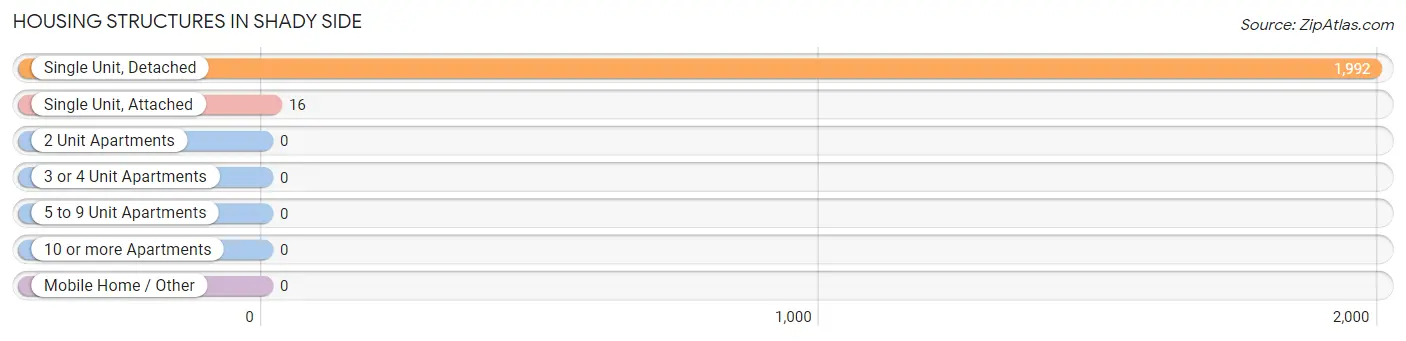
| Structure Type | # Housing Units | % Housing Units |
| Single Unit, Detached | 1,992 | 99.2% |
| Single Unit, Attached | 16 | 0.8% |
| 2 Unit Apartments | 0 | 0.0% |
| 3 or 4 Unit Apartments | 0 | 0.0% |
| 5 to 9 Unit Apartments | 0 | 0.0% |
| 10 or more Apartments | 0 | 0.0% |
| Mobile Home / Other | 0 | 0.0% |
| Total | 2,008 | 100.0% |
Housing Structures by Occupancy in Shady Side
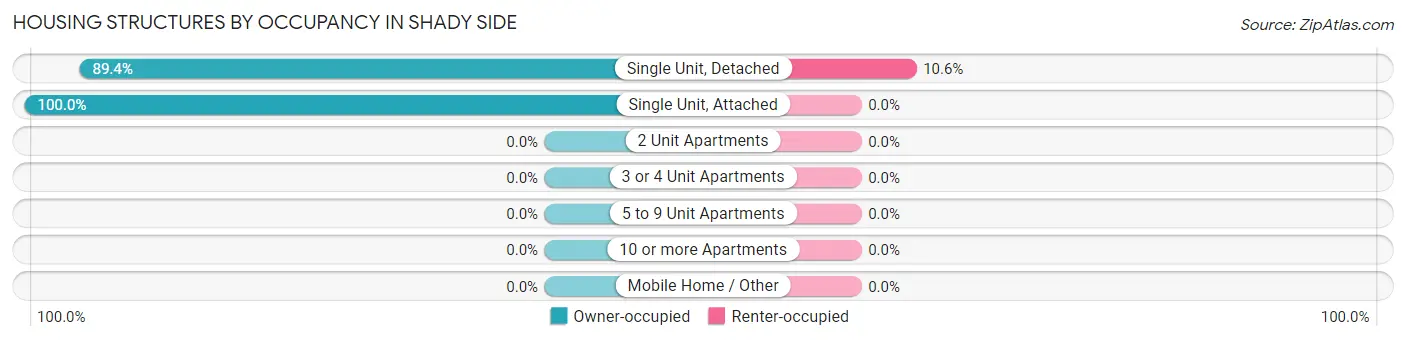
| Structure Type | Owner-occupied | Renter-occupied |
| Single Unit, Detached | 1,781 (89.4%) | 211 (10.6%) |
| Single Unit, Attached | 16 (100.0%) | 0 (0.0%) |
| 2 Unit Apartments | 0 (0.0%) | 0 (0.0%) |
| 3 or 4 Unit Apartments | 0 (0.0%) | 0 (0.0%) |
| 5 to 9 Unit Apartments | 0 (0.0%) | 0 (0.0%) |
| 10 or more Apartments | 0 (0.0%) | 0 (0.0%) |
| Mobile Home / Other | 0 (0.0%) | 0 (0.0%) |
| Total | 1,797 (89.5%) | 211 (10.5%) |
Housing Structures by Number of Rooms in Shady Side
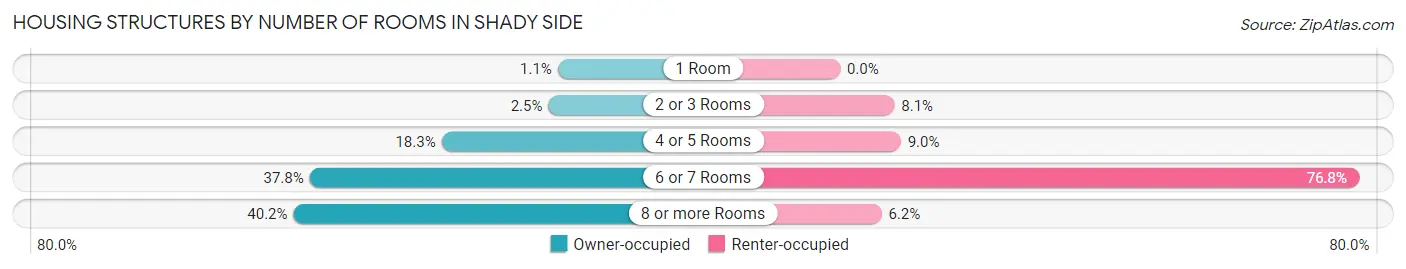
| Number of Rooms | Owner-occupied | Renter-occupied |
| 1 Room | 20 (1.1%) | 0 (0.0%) |
| 2 or 3 Rooms | 45 (2.5%) | 17 (8.1%) |
| 4 or 5 Rooms | 329 (18.3%) | 19 (9.0%) |
| 6 or 7 Rooms | 680 (37.8%) | 162 (76.8%) |
| 8 or more Rooms | 723 (40.2%) | 13 (6.2%) |
| Total | 1,797 (100.0%) | 211 (100.0%) |
Housing Structure by Heating Type in Shady Side
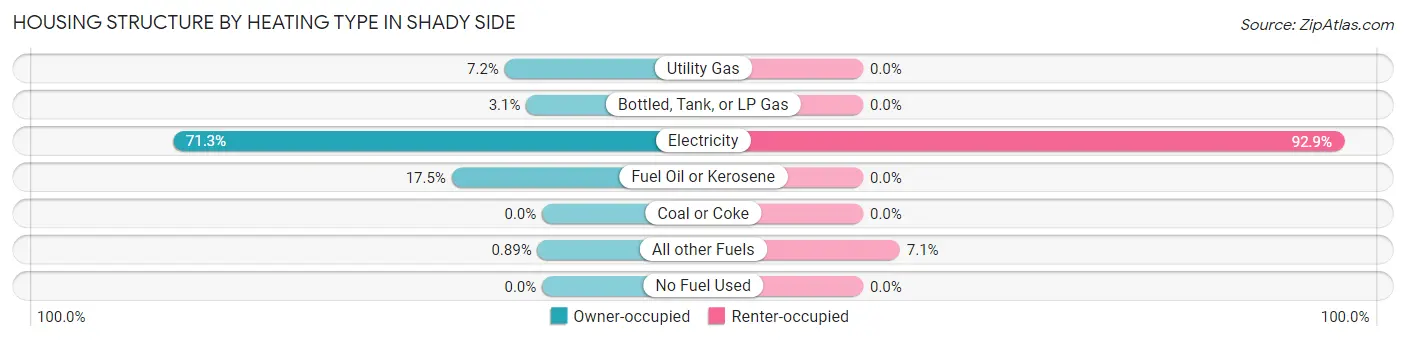
| Heating Type | Owner-occupied | Renter-occupied |
| Utility Gas | 130 (7.2%) | 0 (0.0%) |
| Bottled, Tank, or LP Gas | 55 (3.1%) | 0 (0.0%) |
| Electricity | 1,282 (71.3%) | 196 (92.9%) |
| Fuel Oil or Kerosene | 314 (17.5%) | 0 (0.0%) |
| Coal or Coke | 0 (0.0%) | 0 (0.0%) |
| All other Fuels | 16 (0.9%) | 15 (7.1%) |
| No Fuel Used | 0 (0.0%) | 0 (0.0%) |
| Total | 1,797 (100.0%) | 211 (100.0%) |
Household Vehicle Usage in Shady Side
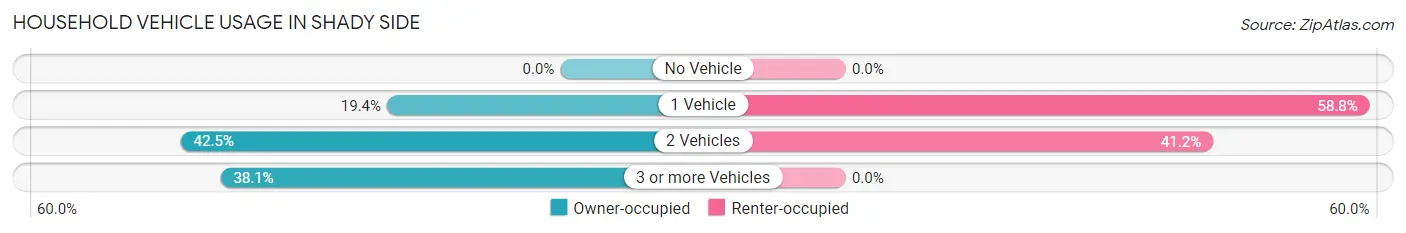
| Vehicles per Household | Owner-occupied | Renter-occupied |
| No Vehicle | 0 (0.0%) | 0 (0.0%) |
| 1 Vehicle | 349 (19.4%) | 124 (58.8%) |
| 2 Vehicles | 764 (42.5%) | 87 (41.2%) |
| 3 or more Vehicles | 684 (38.1%) | 0 (0.0%) |
| Total | 1,797 (100.0%) | 211 (100.0%) |
Real Estate & Mortgages in Shady Side
Real Estate and Mortgage Overview in Shady Side
| Characteristic | Without Mortgage | With Mortgage |
| Housing Units | 355 | 1,442 |
| Median Property Value | $369,000 | $405,600 |
| Median Household Income | $91,690 | $684 |
| Monthly Housing Costs | $946 | $263 |
| Real Estate Taxes | $3,726 | $15 |
Property Value by Mortgage Status in Shady Side
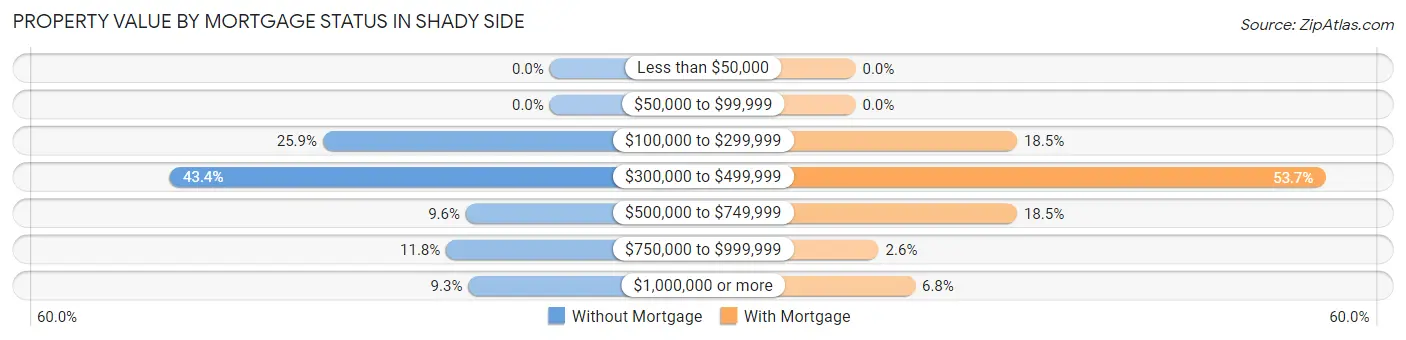
| Property Value | Without Mortgage | With Mortgage |
| Less than $50,000 | 0 (0.0%) | 0 (0.0%) |
| $50,000 to $99,999 | 0 (0.0%) | 0 (0.0%) |
| $100,000 to $299,999 | 92 (25.9%) | 266 (18.4%) |
| $300,000 to $499,999 | 154 (43.4%) | 774 (53.7%) |
| $500,000 to $749,999 | 34 (9.6%) | 266 (18.4%) |
| $750,000 to $999,999 | 42 (11.8%) | 38 (2.6%) |
| $1,000,000 or more | 33 (9.3%) | 98 (6.8%) |
| Total | 355 (100.0%) | 1,442 (100.0%) |
Household Income by Mortgage Status in Shady Side
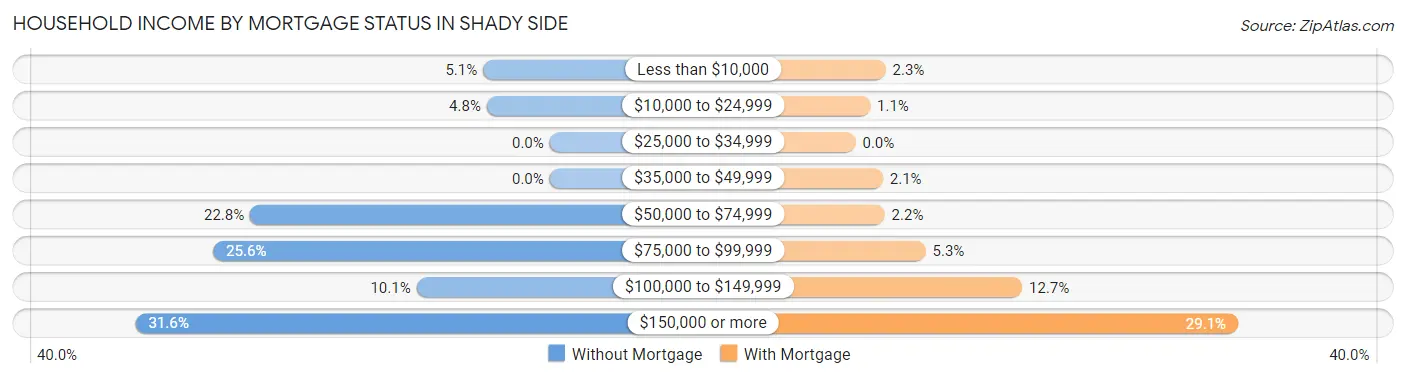
| Household Income | Without Mortgage | With Mortgage |
| Less than $10,000 | 18 (5.1%) | 33 (2.3%) |
| $10,000 to $24,999 | 17 (4.8%) | 16 (1.1%) |
| $25,000 to $34,999 | 0 (0.0%) | 0 (0.0%) |
| $35,000 to $49,999 | 0 (0.0%) | 30 (2.1%) |
| $50,000 to $74,999 | 81 (22.8%) | 32 (2.2%) |
| $75,000 to $99,999 | 91 (25.6%) | 77 (5.3%) |
| $100,000 to $149,999 | 36 (10.1%) | 183 (12.7%) |
| $150,000 or more | 112 (31.6%) | 420 (29.1%) |
| Total | 355 (100.0%) | 1,442 (100.0%) |
Property Value to Household Income Ratio in Shady Side
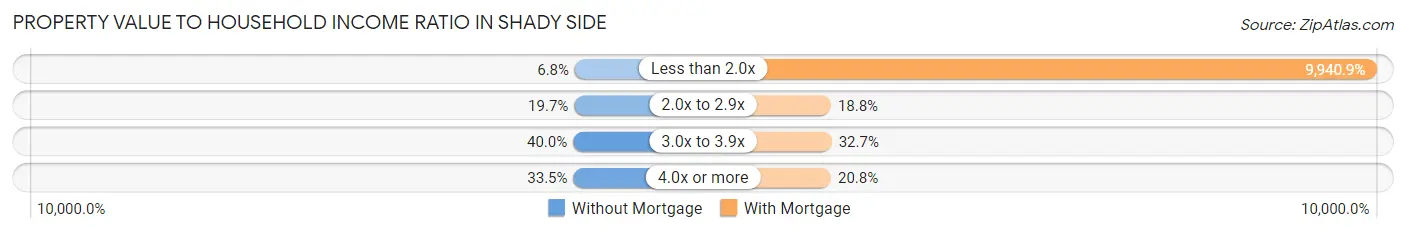
| Value-to-Income Ratio | Without Mortgage | With Mortgage |
| Less than 2.0x | 24 (6.8%) | 143,348 (9,940.9%) |
| 2.0x to 2.9x | 70 (19.7%) | 271 (18.8%) |
| 3.0x to 3.9x | 142 (40.0%) | 472 (32.7%) |
| 4.0x or more | 119 (33.5%) | 300 (20.8%) |
| Total | 355 (100.0%) | 1,442 (100.0%) |
Real Estate Taxes by Mortgage Status in Shady Side
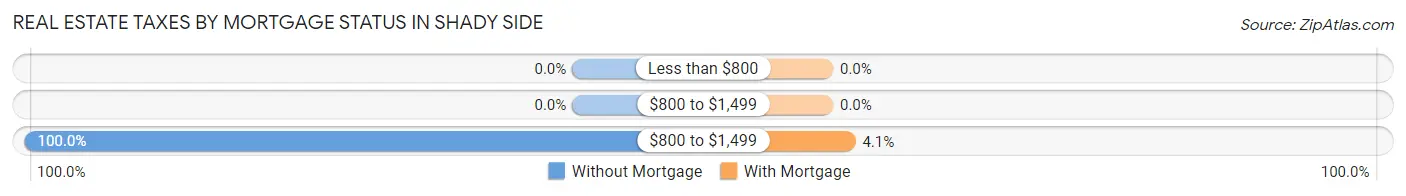
| Property Taxes | Without Mortgage | With Mortgage |
| Less than $800 | 0 (0.0%) | 0 (0.0%) |
| $800 to $1,499 | 0 (0.0%) | 0 (0.0%) |
| $800 to $1,499 | 355 (100.0%) | 59 (4.1%) |
| Total | 355 (100.0%) | 1,442 (100.0%) |
Health & Disability in Shady Side
Health Insurance Coverage by Age in Shady Side
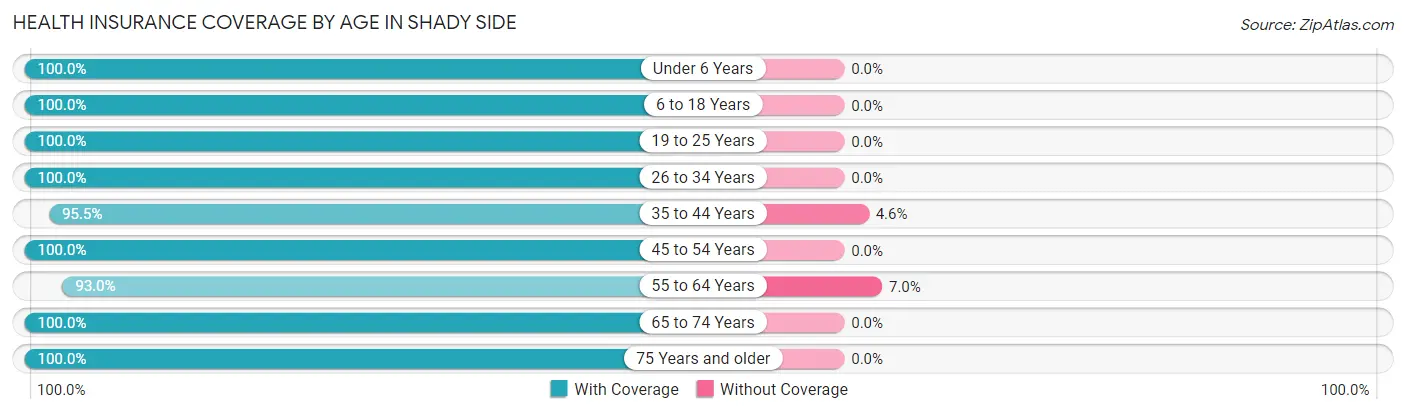
| Age Bracket | With Coverage | Without Coverage |
| Under 6 Years | 206 (100.0%) | 0 (0.0%) |
| 6 to 18 Years | 751 (100.0%) | 0 (0.0%) |
| 19 to 25 Years | 393 (100.0%) | 0 (0.0%) |
| 26 to 34 Years | 527 (100.0%) | 0 (0.0%) |
| 35 to 44 Years | 462 (95.5%) | 22 (4.5%) |
| 45 to 54 Years | 722 (100.0%) | 0 (0.0%) |
| 55 to 64 Years | 832 (93.0%) | 63 (7.0%) |
| 65 to 74 Years | 512 (100.0%) | 0 (0.0%) |
| 75 Years and older | 436 (100.0%) | 0 (0.0%) |
| Total | 4,841 (98.3%) | 85 (1.7%) |
Health Insurance Coverage by Citizenship Status in Shady Side
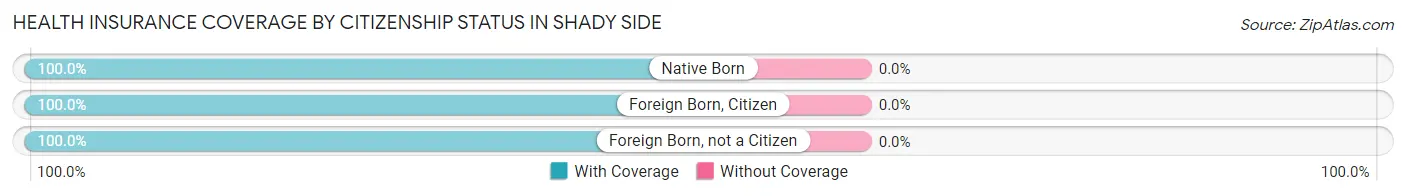
| Citizenship Status | With Coverage | Without Coverage |
| Native Born | 206 (100.0%) | 0 (0.0%) |
| Foreign Born, Citizen | 751 (100.0%) | 0 (0.0%) |
| Foreign Born, not a Citizen | 393 (100.0%) | 0 (0.0%) |
Health Insurance Coverage by Household Income in Shady Side
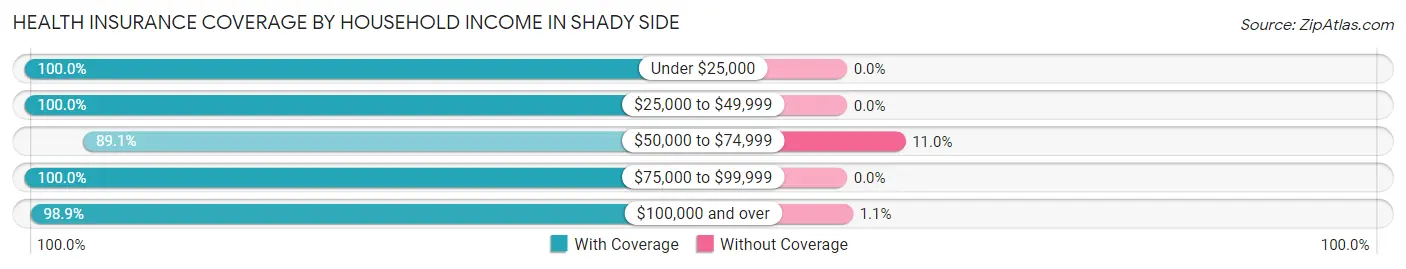
| Household Income | With Coverage | Without Coverage |
| Under $25,000 | 231 (100.0%) | 0 (0.0%) |
| $25,000 to $49,999 | 62 (100.0%) | 0 (0.0%) |
| $50,000 to $74,999 | 358 (89.0%) | 44 (11.0%) |
| $75,000 to $99,999 | 535 (100.0%) | 0 (0.0%) |
| $100,000 and over | 3,655 (98.9%) | 41 (1.1%) |
Public vs Private Health Insurance Coverage by Age in Shady Side
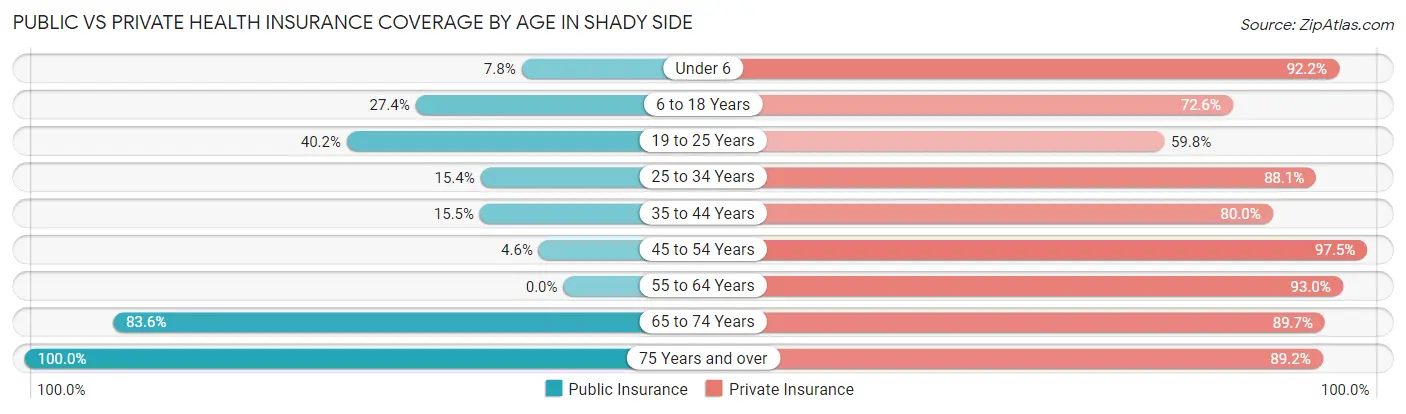
| Age Bracket | Public Insurance | Private Insurance |
| Under 6 | 16 (7.8%) | 190 (92.2%) |
| 6 to 18 Years | 206 (27.4%) | 545 (72.6%) |
| 19 to 25 Years | 158 (40.2%) | 235 (59.8%) |
| 25 to 34 Years | 81 (15.4%) | 464 (88.0%) |
| 35 to 44 Years | 75 (15.5%) | 387 (80.0%) |
| 45 to 54 Years | 33 (4.6%) | 704 (97.5%) |
| 55 to 64 Years | 0 (0.0%) | 832 (93.0%) |
| 65 to 74 Years | 428 (83.6%) | 459 (89.6%) |
| 75 Years and over | 436 (100.0%) | 389 (89.2%) |
| Total | 1,433 (29.1%) | 4,205 (85.4%) |
Disability Status by Sex by Age in Shady Side
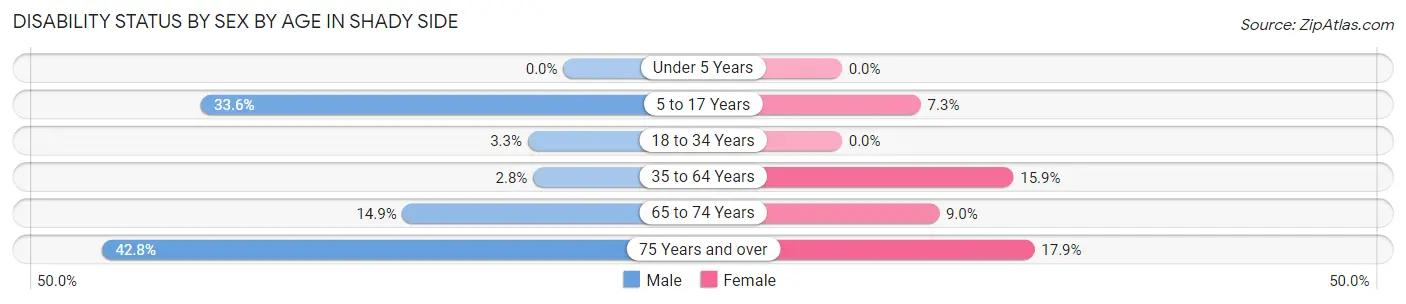
| Age Bracket | Male | Female |
| Under 5 Years | 0 (0.0%) | 0 (0.0%) |
| 5 to 17 Years | 164 (33.6%) | 21 (7.3%) |
| 18 to 34 Years | 18 (3.3%) | 0 (0.0%) |
| 35 to 64 Years | 27 (2.8%) | 181 (15.9%) |
| 65 to 74 Years | 40 (14.9%) | 22 (9.0%) |
| 75 Years and over | 74 (42.8%) | 47 (17.9%) |
Disability Class by Sex by Age in Shady Side
Disability Class: Hearing Difficulty
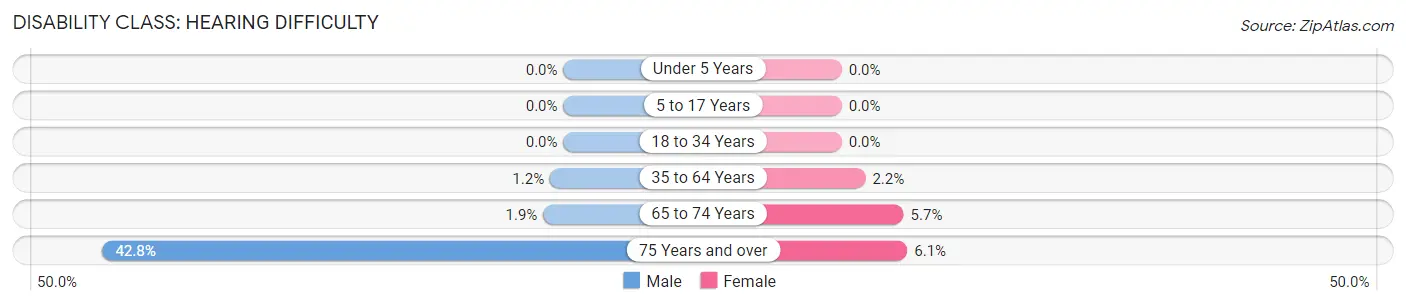
| Age Bracket | Male | Female |
| Under 5 Years | 0 (0.0%) | 0 (0.0%) |
| 5 to 17 Years | 0 (0.0%) | 0 (0.0%) |
| 18 to 34 Years | 0 (0.0%) | 0 (0.0%) |
| 35 to 64 Years | 12 (1.2%) | 25 (2.2%) |
| 65 to 74 Years | 5 (1.9%) | 14 (5.7%) |
| 75 Years and over | 74 (42.8%) | 16 (6.1%) |
Disability Class: Vision Difficulty
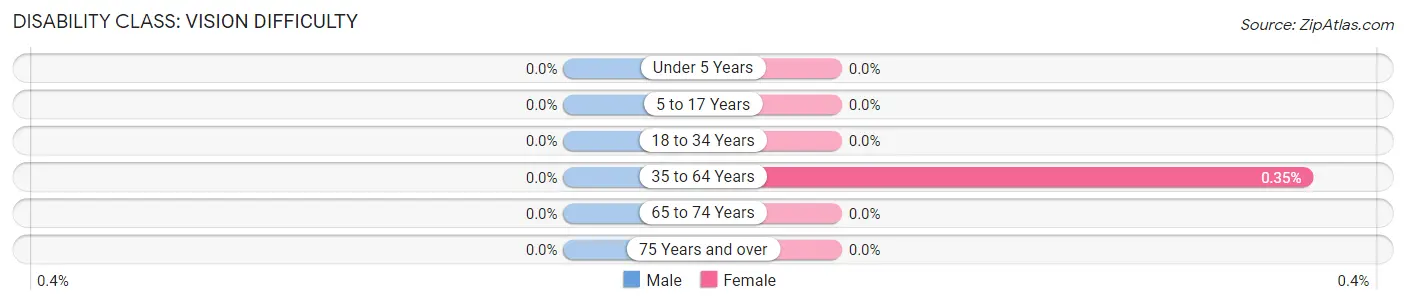
| Age Bracket | Male | Female |
| Under 5 Years | 0 (0.0%) | 0 (0.0%) |
| 5 to 17 Years | 0 (0.0%) | 0 (0.0%) |
| 18 to 34 Years | 0 (0.0%) | 0 (0.0%) |
| 35 to 64 Years | 0 (0.0%) | 4 (0.4%) |
| 65 to 74 Years | 0 (0.0%) | 0 (0.0%) |
| 75 Years and over | 0 (0.0%) | 0 (0.0%) |
Disability Class: Cognitive Difficulty
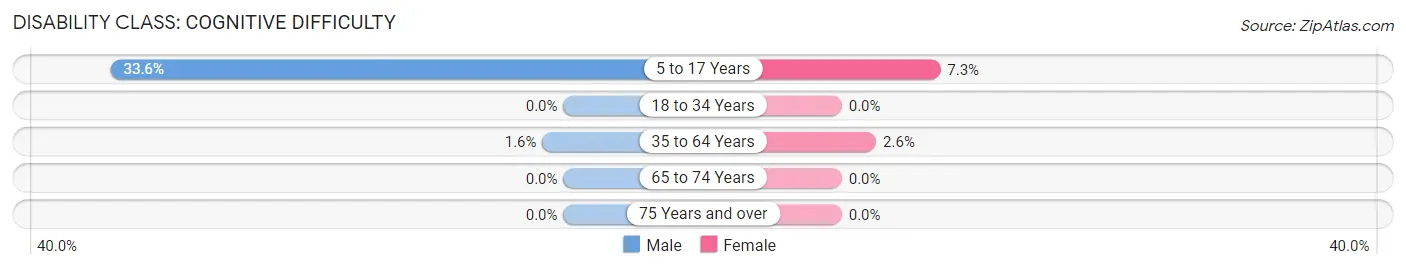
| Age Bracket | Male | Female |
| 5 to 17 Years | 164 (33.6%) | 21 (7.3%) |
| 18 to 34 Years | 0 (0.0%) | 0 (0.0%) |
| 35 to 64 Years | 15 (1.6%) | 29 (2.5%) |
| 65 to 74 Years | 0 (0.0%) | 0 (0.0%) |
| 75 Years and over | 0 (0.0%) | 0 (0.0%) |
Disability Class: Ambulatory Difficulty
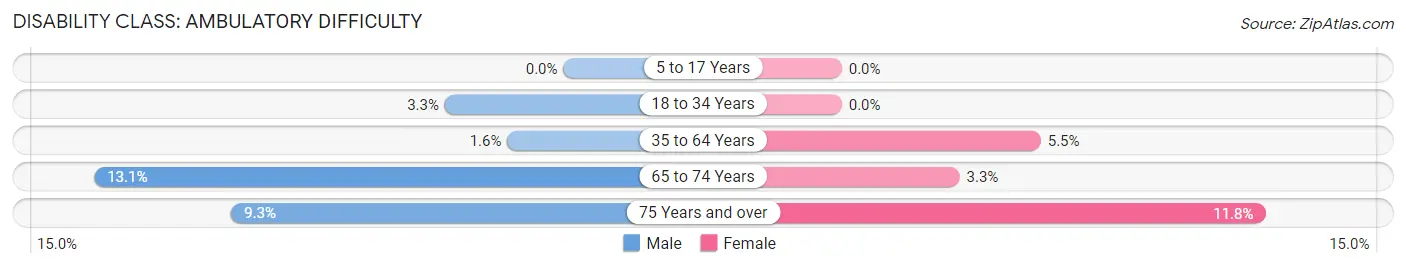
| Age Bracket | Male | Female |
| 5 to 17 Years | 0 (0.0%) | 0 (0.0%) |
| 18 to 34 Years | 18 (3.3%) | 0 (0.0%) |
| 35 to 64 Years | 15 (1.6%) | 63 (5.5%) |
| 65 to 74 Years | 35 (13.1%) | 8 (3.3%) |
| 75 Years and over | 16 (9.2%) | 31 (11.8%) |
Disability Class: Self-Care Difficulty
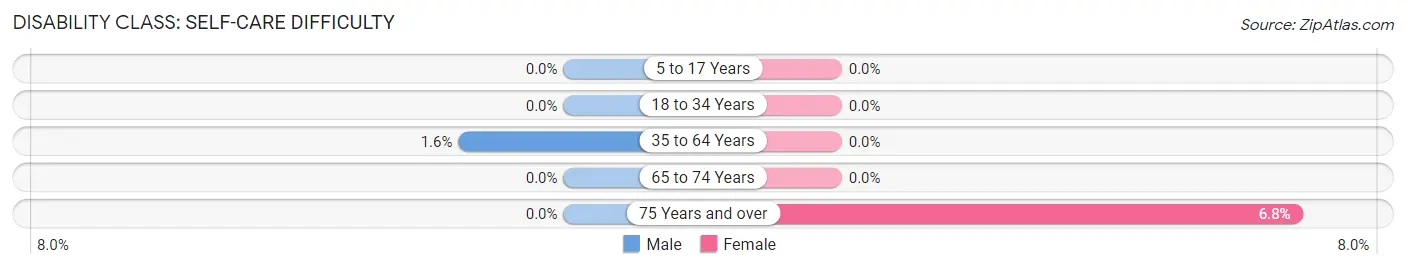
| Age Bracket | Male | Female |
| 5 to 17 Years | 0 (0.0%) | 0 (0.0%) |
| 18 to 34 Years | 0 (0.0%) | 0 (0.0%) |
| 35 to 64 Years | 15 (1.6%) | 0 (0.0%) |
| 65 to 74 Years | 0 (0.0%) | 0 (0.0%) |
| 75 Years and over | 0 (0.0%) | 18 (6.8%) |
Technology Access in Shady Side
Computing Device Access in Shady Side
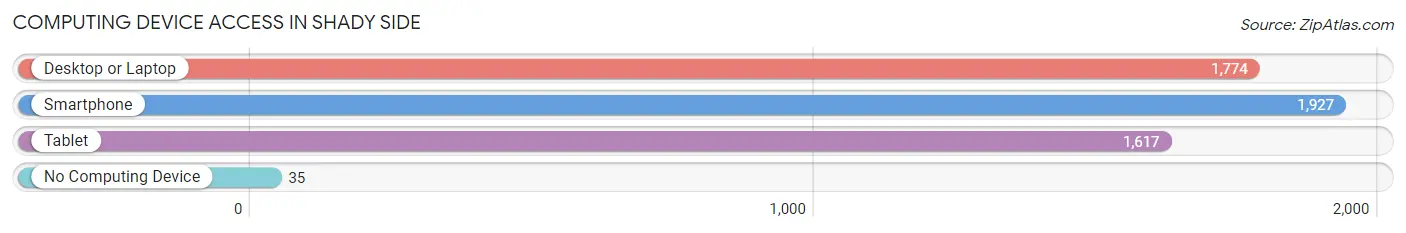
| Device Type | # Households | % Households |
| Desktop or Laptop | 1,774 | 88.3% |
| Smartphone | 1,927 | 96.0% |
| Tablet | 1,617 | 80.5% |
| No Computing Device | 35 | 1.7% |
| Total | 2,008 | 100.0% |
Internet Access in Shady Side
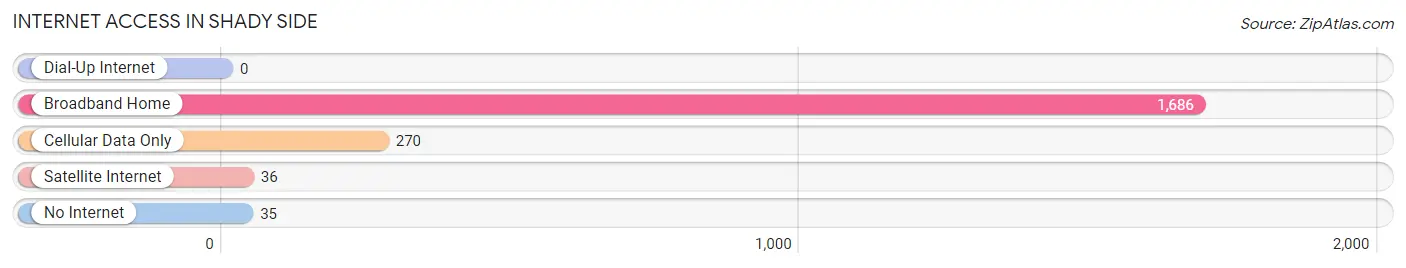
| Internet Type | # Households | % Households |
| Dial-Up Internet | 0 | 0.0% |
| Broadband Home | 1,686 | 84.0% |
| Cellular Data Only | 270 | 13.5% |
| Satellite Internet | 36 | 1.8% |
| No Internet | 35 | 1.7% |
| Total | 2,008 | 100.0% |
Shady Side Summary
Shady Side is a small unincorporated community located in Anne Arundel County, Maryland. It is situated on the western shore of the Chesapeake Bay, approximately 25 miles south of Baltimore and 30 miles east of Washington, D.C. The community is bordered by the towns of Deale, Edgewater, and Lothian.
History
Shady Side was first settled in the early 1700s by English colonists. The area was originally known as “The Neck” and was part of the larger tract of land known as “The Hundred”. The Hundred was granted to the Calvert family in 1658 and was divided into several smaller tracts of land. The Neck was one of these tracts and was granted to Thomas Sprigg in 1663. The area was renamed “Shady Side” in 1720 when it was purchased by William Sprigg, Thomas’ son.
The community was primarily an agricultural area until the late 19th century when the Chesapeake Bay became a popular destination for recreational activities. The area was home to several resorts and hotels, including the Shady Side Inn, which was built in 1891. The inn was a popular destination for wealthy Baltimoreans and Washingtonians who wanted to escape the city for a weekend.
Geography
Shady Side is located in Anne Arundel County, Maryland. It is situated on the western shore of the Chesapeake Bay, approximately 25 miles south of Baltimore and 30 miles east of Washington, D.C. The community is bordered by the towns of Deale, Edgewater, and Lothian.
The area is mostly flat and is composed of sandy soil. The climate is humid subtropical, with hot, humid summers and mild winters. The average annual temperature is around 60 degrees Fahrenheit.
Economy
Shady Side’s economy is largely based on tourism and recreation. The area is home to several marinas, boatyards, and charter fishing companies. The Chesapeake Bay is a popular destination for recreational activities such as fishing, boating, and crabbing.
The area is also home to several small businesses, including restaurants, convenience stores, and gift shops. The community is also home to a few small manufacturing companies.
Demographics
As of the 2010 census, the population of Shady Side was 4,541. The racial makeup of the community was 87.3% White, 8.2% African American, 0.7% Native American, 0.7% Asian, 0.1% Pacific Islander, and 2.0% from other races. The median household income was $68,958.
Shady Side is a small, close-knit community with a strong sense of community. The area is home to several churches, schools, and community organizations. The community is also home to a variety of recreational activities, including fishing, boating, and crabbing.
Common Questions
What is Per Capita Income in Shady Side?
Per Capita income in Shady Side is $64,390.
What is the Median Family Income in Shady Side?
Median Family Income in Shady Side is $136,315.
What is the Median Household income in Shady Side?
Median Household Income in Shady Side is $133,378.
What is Income or Wage Gap in Shady Side?
Income or Wage Gap in Shady Side is 40.9%.
Women in Shady Side earn 59.1 cents for every dollar earned by a man.
What is Inequality or Gini Index in Shady Side?
Inequality or Gini Index in Shady Side is 0.37.
What is the Total Population of Shady Side?
Total Population of Shady Side is 4,959.
What is the Total Male Population of Shady Side?
Total Male Population of Shady Side is 2,567.
What is the Total Female Population of Shady Side?
Total Female Population of Shady Side is 2,392.
What is the Ratio of Males per 100 Females in Shady Side?
There are 107.32 Males per 100 Females in Shady Side.
What is the Ratio of Females per 100 Males in Shady Side?
There are 93.18 Females per 100 Males in Shady Side.
What is the Median Population Age in Shady Side?
Median Population Age in Shady Side is 47.4 Years.
What is the Average Family Size in Shady Side
Average Family Size in Shady Side is 2.8 People.
What is the Average Household Size in Shady Side
Average Household Size in Shady Side is 2.5 People.
How Large is the Labor Force in Shady Side?
There are 3,012 People in the Labor Forcein in Shady Side.
What is the Percentage of People in the Labor Force in Shady Side?
71.5% of People are in the Labor Force in Shady Side.
What is the Unemployment Rate in Shady Side?
Unemployment Rate in Shady Side is 4.6%.