Cities with the Highest Percentage of Lithuanian Population in Maryland
RELATED REPORTS & OPTIONS
Lithuanian
Maryland
Compare Cities
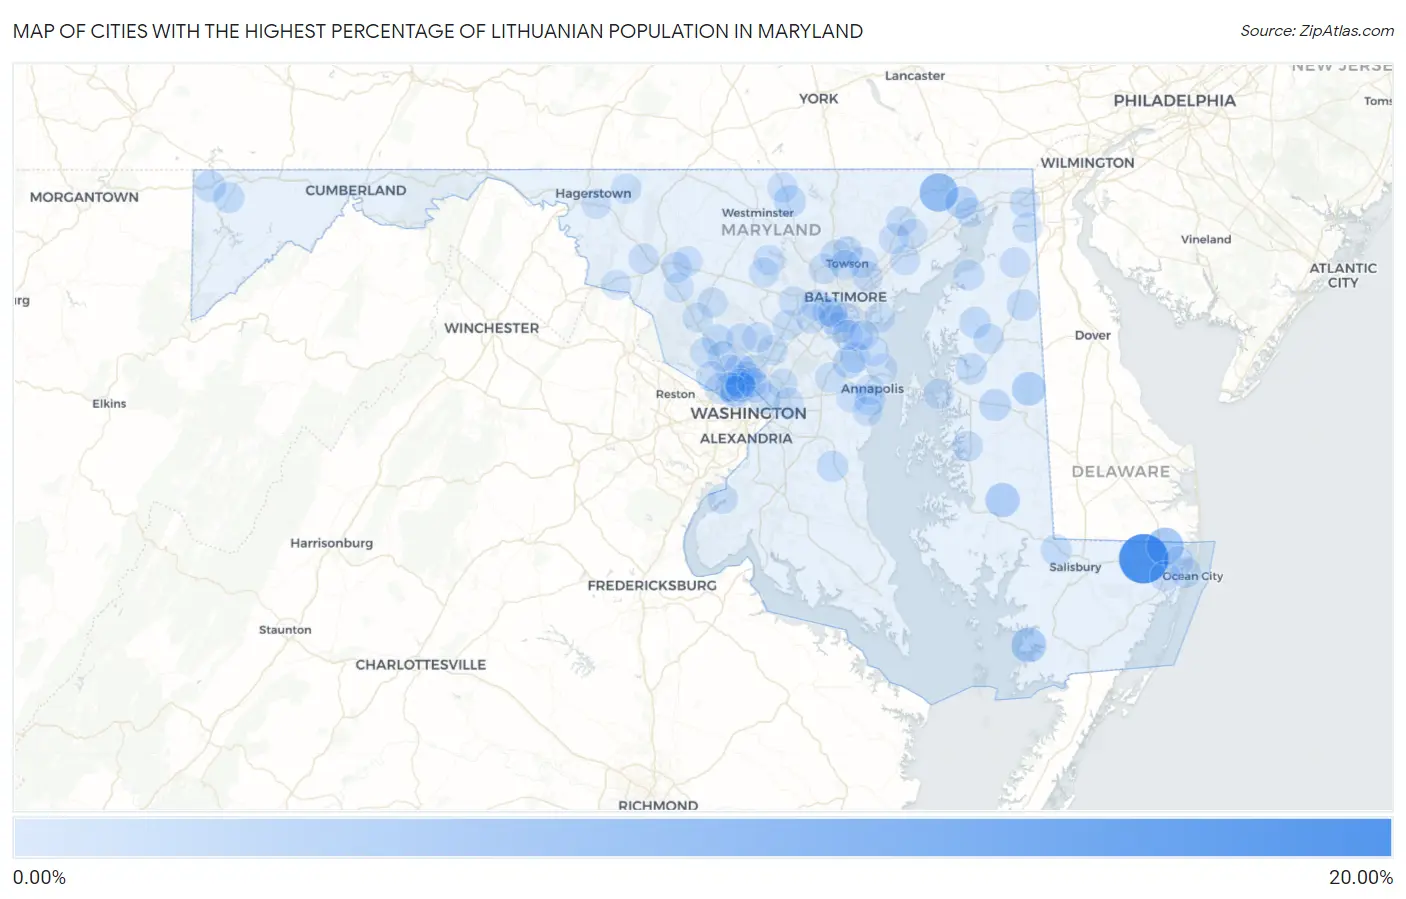
Map of Cities with the Highest Percentage of Lithuanian Population in Maryland
0.00%
20.00%
Cities with the Highest Percentage of Lithuanian Population in Maryland
| City | Lithuanian | vs State | vs National | |
| 1. | Whaleyville | 18.97% | 0.26%(+18.7)#1 | 0.19%(+18.8)#19 |
| 2. | Darlington | 7.95% | 0.26%(+7.69)#2 | 0.19%(+7.76)#63 |
| 3. | Bishopville | 6.93% | 0.26%(+6.68)#3 | 0.19%(+6.75)#80 |
| 4. | Fairmount | 4.63% | 0.26%(+4.38)#4 | 0.19%(+4.45)#145 |
| 5. | East New Market | 4.11% | 0.26%(+3.86)#5 | 0.19%(+3.93)#178 |
| 6. | Greensboro | 3.63% | 0.26%(+3.38)#6 | 0.19%(+3.45)#211 |
| 7. | Port Deposit | 2.21% | 0.26%(+1.96)#7 | 0.19%(+2.03)#397 |
| 8. | Friendship Heights Village | 2.16% | 0.26%(+1.90)#8 | 0.19%(+1.97)#417 |
| 9. | North Kensington | 2.10% | 0.26%(+1.84)#9 | 0.19%(+1.92)#427 |
| 10. | Queen Anne | 2.02% | 0.26%(+1.76)#10 | 0.19%(+1.84)#458 |
| 11. | Arden On The Severn | 1.98% | 0.26%(+1.72)#11 | 0.19%(+1.80)#474 |
| 12. | Chesapeake Landing | 1.81% | 0.26%(+1.56)#12 | 0.19%(+1.63)#533 |
| 13. | Hampstead | 1.80% | 0.26%(+1.54)#13 | 0.19%(+1.61)#543 |
| 14. | Friendsville | 1.70% | 0.26%(+1.45)#14 | 0.19%(+1.52)#588 |
| 15. | Honeygo | 1.70% | 0.26%(+1.45)#15 | 0.19%(+1.52)#589 |
| 16. | Mount Rainier | 1.68% | 0.26%(+1.43)#16 | 0.19%(+1.50)#605 |
| 17. | Washington Grove | 1.66% | 0.26%(+1.40)#17 | 0.19%(+1.47)#618 |
| 18. | Kingstown | 1.65% | 0.26%(+1.40)#18 | 0.19%(+1.47)#620 |
| 19. | Millington | 1.61% | 0.26%(+1.35)#19 | 0.19%(+1.42)#641 |
| 20. | North Chevy Chase | 1.47% | 0.26%(+1.21)#20 | 0.19%(+1.28)#727 |
| 21. | Centreville | 1.47% | 0.26%(+1.21)#21 | 0.19%(+1.28)#728 |
| 22. | Dunkirk | 1.41% | 0.26%(+1.15)#22 | 0.19%(+1.22)#761 |
| 23. | Accident | 1.28% | 0.26%(+1.02)#23 | 0.19%(+1.09)#846 |
| 24. | Annapolis Neck | 1.25% | 0.26%(+0.994)#24 | 0.19%(+1.07)#867 |
| 25. | Hebron | 1.15% | 0.26%(+0.897)#25 | 0.19%(+0.968)#952 |
| 26. | Cabin John | 1.14% | 0.26%(+0.882)#26 | 0.19%(+0.953)#964 |
| 27. | Betterton | 1.10% | 0.26%(+0.845)#27 | 0.19%(+0.917)#1,015 |
| 28. | Mays Chapel | 1.09% | 0.26%(+0.838)#28 | 0.19%(+0.909)#1,024 |
| 29. | Catonsville | 1.06% | 0.26%(+0.805)#29 | 0.19%(+0.876)#1,072 |
| 30. | Severna Park | 0.97% | 0.26%(+0.713)#30 | 0.19%(+0.784)#1,203 |
| 31. | Church Hill | 0.92% | 0.26%(+0.666)#31 | 0.19%(+0.737)#1,291 |
| 32. | Ferndale | 0.90% | 0.26%(+0.643)#32 | 0.19%(+0.715)#1,332 |
| 33. | Elkton | 0.90% | 0.26%(+0.641)#33 | 0.19%(+0.712)#1,341 |
| 34. | Bartonsville | 0.84% | 0.26%(+0.586)#34 | 0.19%(+0.658)#1,441 |
| 35. | Burtonsville | 0.83% | 0.26%(+0.577)#35 | 0.19%(+0.648)#1,462 |
| 36. | Easton | 0.82% | 0.26%(+0.561)#36 | 0.19%(+0.633)#1,497 |
| 37. | West Ocean City | 0.80% | 0.26%(+0.544)#37 | 0.19%(+0.615)#1,534 |
| 38. | Cecilton | 0.80% | 0.26%(+0.541)#38 | 0.19%(+0.612)#1,547 |
| 39. | Grasonville | 0.78% | 0.26%(+0.524)#39 | 0.19%(+0.595)#1,579 |
| 40. | Braddock Heights | 0.77% | 0.26%(+0.514)#40 | 0.19%(+0.585)#1,601 |
| 41. | Romancoke | 0.74% | 0.26%(+0.482)#41 | 0.19%(+0.553)#1,656 |
| 42. | Olney | 0.73% | 0.26%(+0.470)#42 | 0.19%(+0.541)#1,680 |
| 43. | Eldersburg | 0.70% | 0.26%(+0.448)#43 | 0.19%(+0.520)#1,731 |
| 44. | Carney | 0.70% | 0.26%(+0.438)#44 | 0.19%(+0.510)#1,756 |
| 45. | Ashton Sandy Spring | 0.68% | 0.26%(+0.425)#45 | 0.19%(+0.496)#1,797 |
| 46. | Pikesville | 0.66% | 0.26%(+0.406)#46 | 0.19%(+0.478)#1,837 |
| 47. | Joppatowne | 0.66% | 0.26%(+0.401)#47 | 0.19%(+0.472)#1,850 |
| 48. | Berlin | 0.65% | 0.26%(+0.396)#48 | 0.19%(+0.468)#1,861 |
| 49. | Chevy Chase Section Five | 0.63% | 0.26%(+0.372)#49 | 0.19%(+0.443)#1,935 |
| 50. | Takoma Park | 0.62% | 0.26%(+0.365)#50 | 0.19%(+0.436)#1,960 |
| 51. | Overlea | 0.60% | 0.26%(+0.345)#51 | 0.19%(+0.417)#2,027 |
| 52. | Manchester | 0.59% | 0.26%(+0.336)#52 | 0.19%(+0.407)#2,059 |
| 53. | Arbutus | 0.59% | 0.26%(+0.334)#53 | 0.19%(+0.406)#2,064 |
| 54. | Forest Glen | 0.57% | 0.26%(+0.312)#54 | 0.19%(+0.383)#2,152 |
| 55. | Pleasant Hills | 0.56% | 0.26%(+0.304)#55 | 0.19%(+0.375)#2,186 |
| 56. | Timonium | 0.56% | 0.26%(+0.299)#56 | 0.19%(+0.371)#2,215 |
| 57. | Linganore | 0.54% | 0.26%(+0.283)#57 | 0.19%(+0.354)#2,289 |
| 58. | Pasadena | 0.54% | 0.26%(+0.281)#58 | 0.19%(+0.353)#2,295 |
| 59. | Bel Air North | 0.53% | 0.26%(+0.271)#59 | 0.19%(+0.342)#2,344 |
| 60. | Greenbelt | 0.52% | 0.26%(+0.267)#60 | 0.19%(+0.338)#2,355 |
| 61. | North Bethesda | 0.52% | 0.26%(+0.266)#61 | 0.19%(+0.337)#2,362 |
| 62. | Ocean Pines | 0.52% | 0.26%(+0.263)#62 | 0.19%(+0.335)#2,369 |
| 63. | Brooklyn Park | 0.51% | 0.26%(+0.253)#63 | 0.19%(+0.324)#2,400 |
| 64. | Indian Head | 0.51% | 0.26%(+0.252)#64 | 0.19%(+0.324)#2,402 |
| 65. | Kemp Mill | 0.50% | 0.26%(+0.247)#65 | 0.19%(+0.318)#2,430 |
| 66. | Martin S Additions | 0.50% | 0.26%(+0.247)#66 | 0.19%(+0.318)#2,431 |
| 67. | Smithsburg | 0.50% | 0.26%(+0.239)#67 | 0.19%(+0.310)#2,459 |
| 68. | Columbia | 0.50% | 0.26%(+0.239)#68 | 0.19%(+0.310)#2,460 |
| 69. | Somerset | 0.49% | 0.26%(+0.230)#69 | 0.19%(+0.301)#2,489 |
| 70. | Chevy Chase | 0.48% | 0.26%(+0.224)#70 | 0.19%(+0.295)#2,514 |
| 71. | Cape St Claire | 0.48% | 0.26%(+0.221)#71 | 0.19%(+0.292)#2,527 |
| 72. | Towson | 0.48% | 0.26%(+0.219)#72 | 0.19%(+0.290)#2,537 |
| 73. | Edgemere | 0.47% | 0.26%(+0.217)#73 | 0.19%(+0.288)#2,551 |
| 74. | Lake Shore | 0.47% | 0.26%(+0.210)#74 | 0.19%(+0.281)#2,573 |
| 75. | Funkstown | 0.46% | 0.26%(+0.208)#75 | 0.19%(+0.279)#2,579 |
| 76. | Damascus | 0.46% | 0.26%(+0.206)#76 | 0.19%(+0.278)#2,583 |
| 77. | Bel Air South | 0.46% | 0.26%(+0.202)#77 | 0.19%(+0.274)#2,596 |
| 78. | Ilchester | 0.46% | 0.26%(+0.201)#78 | 0.19%(+0.273)#2,599 |
| 79. | Abingdon | 0.45% | 0.26%(+0.193)#79 | 0.19%(+0.265)#2,647 |
| 80. | Bethesda | 0.44% | 0.26%(+0.185)#80 | 0.19%(+0.257)#2,677 |
| 81. | Clarksburg | 0.43% | 0.26%(+0.174)#81 | 0.19%(+0.245)#2,736 |
| 82. | Glenarden | 0.43% | 0.26%(+0.170)#82 | 0.19%(+0.241)#2,756 |
| 83. | North Potomac | 0.41% | 0.26%(+0.153)#83 | 0.19%(+0.224)#2,856 |
| 84. | Linthicum | 0.40% | 0.26%(+0.144)#84 | 0.19%(+0.216)#2,900 |
| 85. | Lansdowne | 0.40% | 0.26%(+0.143)#85 | 0.19%(+0.215)#2,906 |
| 86. | Glen Burnie | 0.40% | 0.26%(+0.141)#86 | 0.19%(+0.212)#2,916 |
| 87. | Silver Spring | 0.39% | 0.26%(+0.136)#87 | 0.19%(+0.207)#2,956 |
| 88. | Riva | 0.38% | 0.26%(+0.120)#88 | 0.19%(+0.191)#3,050 |
| 89. | Chesapeake City | 0.37% | 0.26%(+0.118)#89 | 0.19%(+0.189)#3,063 |
| 90. | Rockville | 0.37% | 0.26%(+0.110)#90 | 0.19%(+0.181)#3,113 |
| 91. | Perryville | 0.36% | 0.26%(+0.107)#91 | 0.19%(+0.179)#3,124 |
| 92. | Annapolis | 0.36% | 0.26%(+0.107)#92 | 0.19%(+0.178)#3,127 |
| 93. | Riviera Beach | 0.35% | 0.26%(+0.098)#93 | 0.19%(+0.170)#3,169 |
| 94. | Crofton | 0.35% | 0.26%(+0.098)#94 | 0.19%(+0.169)#3,174 |
| 95. | Potomac | 0.35% | 0.26%(+0.094)#95 | 0.19%(+0.165)#3,207 |
| 96. | Ellicott City | 0.35% | 0.26%(+0.093)#96 | 0.19%(+0.164)#3,215 |
| 97. | Sykesville | 0.35% | 0.26%(+0.092)#97 | 0.19%(+0.163)#3,217 |
| 98. | Mayo | 0.34% | 0.26%(+0.083)#98 | 0.19%(+0.154)#3,278 |
| 99. | Urbana | 0.34% | 0.26%(+0.080)#99 | 0.19%(+0.151)#3,292 |
| 100. | Rosemont | 0.34% | 0.26%(+0.079)#100 | 0.19%(+0.150)#3,297 |
Common Questions
What are the Top 10 Cities with the Highest Percentage of Lithuanian Population in Maryland?
Top 10 Cities with the Highest Percentage of Lithuanian Population in Maryland are:
#1
18.97%
#2
7.95%
#3
6.93%
#4
4.63%
#5
4.11%
#6
3.63%
#7
2.21%
#8
2.16%
#9
2.10%
#10
2.02%
What city has the Highest Percentage of Lithuanian Population in Maryland?
Whaleyville has the Highest Percentage of Lithuanian Population in Maryland with 18.97%.
What is the Percentage of Lithuanian Population in the State of Maryland?
Percentage of Lithuanian Population in Maryland is 0.26%.
What is the Percentage of Lithuanian Population in the United States?
Percentage of Lithuanian Population in the United States is 0.19%.