Cities with the Highest Percentage of Swedish Population in Maryland
RELATED REPORTS & OPTIONS
Swedish
Maryland
Compare Cities
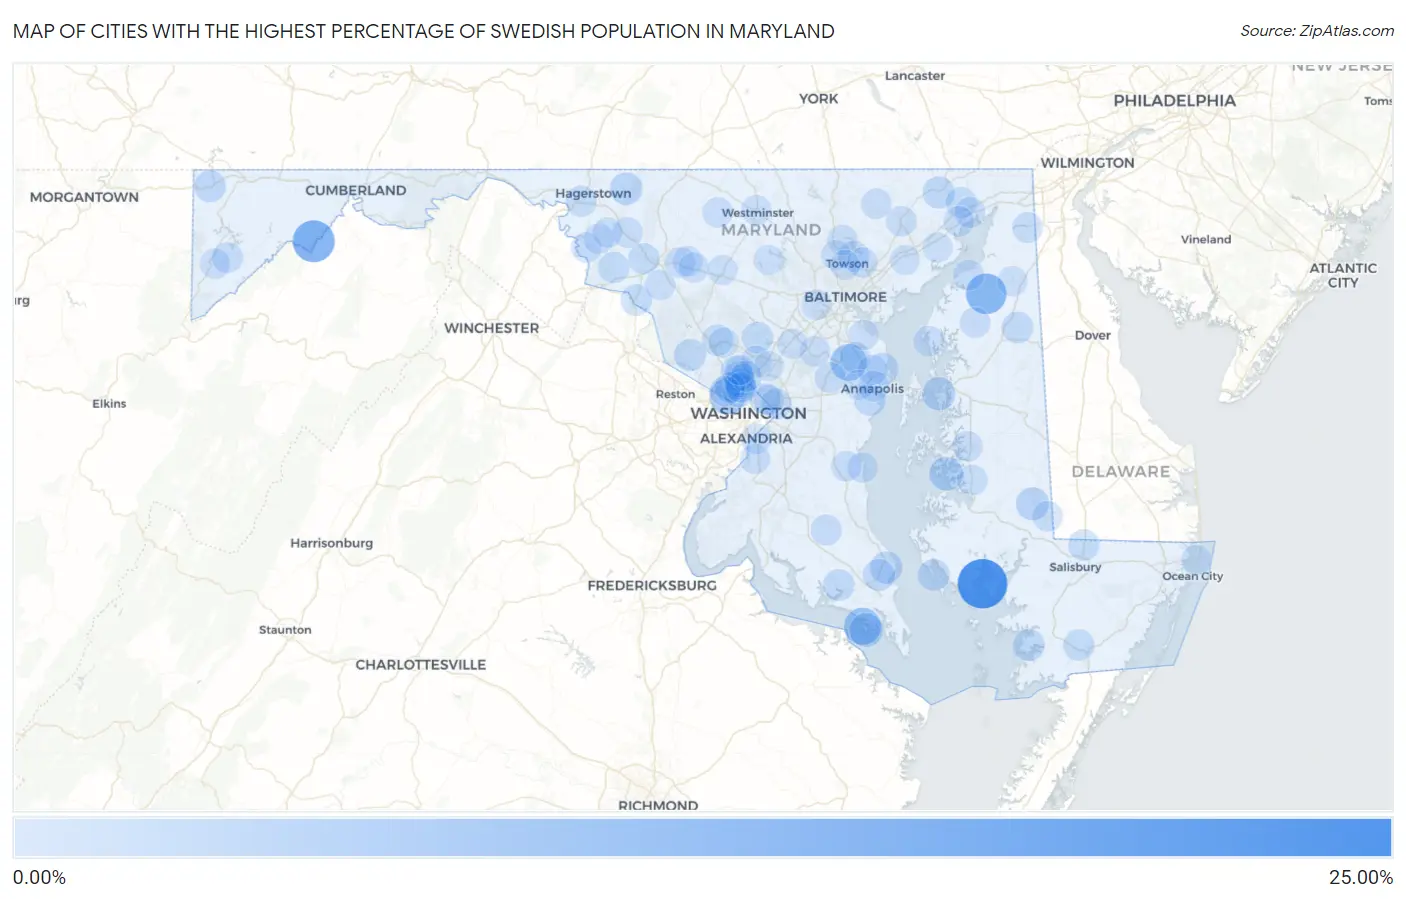
Map of Cities with the Highest Percentage of Swedish Population in Maryland
0.00%
25.00%
Cities with the Highest Percentage of Swedish Population in Maryland
| City | Swedish | vs State | vs National | |
| 1. | Elliott | 23.81% | 0.49%(+23.3)#1 | 1.05%(+22.8)#111 |
| 2. | Dawson | 14.52% | 0.49%(+14.0)#2 | 1.05%(+13.5)#292 |
| 3. | Kennedyville | 12.72% | 0.49%(+12.2)#3 | 1.05%(+11.7)#390 |
| 4. | Tall Timbers | 8.75% | 0.49%(+8.26)#4 | 1.05%(+7.70)#794 |
| 5. | Arden On The Severn | 8.36% | 0.49%(+7.87)#5 | 1.05%(+7.32)#871 |
| 6. | Brookmont | 7.66% | 0.49%(+7.17)#6 | 1.05%(+6.62)#1,027 |
| 7. | Oxford | 5.02% | 0.49%(+4.53)#7 | 1.05%(+3.97)#1,979 |
| 8. | Piney Point | 4.94% | 0.49%(+4.44)#8 | 1.05%(+3.89)#2,031 |
| 9. | Grasonville | 4.23% | 0.49%(+3.74)#9 | 1.05%(+3.18)#2,486 |
| 10. | Eldorado | 4.00% | 0.49%(+3.51)#10 | 1.05%(+2.95)#2,655 |
| 11. | Smithsburg | 3.47% | 0.49%(+2.98)#11 | 1.05%(+2.42)#3,199 |
| 12. | Callaway | 3.12% | 0.49%(+2.63)#12 | 1.05%(+2.08)#3,622 |
| 13. | Lusby | 3.11% | 0.49%(+2.61)#13 | 1.05%(+2.06)#3,652 |
| 14. | Darlington | 2.93% | 0.49%(+2.44)#14 | 1.05%(+1.88)#3,908 |
| 15. | Chevy Chase Village | 2.92% | 0.49%(+2.43)#15 | 1.05%(+1.87)#3,928 |
| 16. | Lewistown | 2.75% | 0.49%(+2.26)#16 | 1.05%(+1.70)#4,199 |
| 17. | Fairmount | 2.68% | 0.49%(+2.19)#17 | 1.05%(+1.63)#4,315 |
| 18. | Friendsville | 2.68% | 0.49%(+2.18)#18 | 1.05%(+1.63)#4,332 |
| 19. | Solomons | 2.68% | 0.49%(+2.18)#19 | 1.05%(+1.63)#4,333 |
| 20. | Cape St Claire | 2.67% | 0.49%(+2.18)#20 | 1.05%(+1.62)#4,339 |
| 21. | Darnestown | 2.67% | 0.49%(+2.18)#21 | 1.05%(+1.62)#4,342 |
| 22. | Fishing Creek | 2.55% | 0.49%(+2.06)#22 | 1.05%(+1.50)#4,545 |
| 23. | Annapolis Neck | 2.39% | 0.49%(+1.90)#23 | 1.05%(+1.34)#4,887 |
| 24. | Chevy Chase Section Five | 2.39% | 0.49%(+1.89)#24 | 1.05%(+1.34)#4,890 |
| 25. | Leonardtown | 2.38% | 0.49%(+1.88)#25 | 1.05%(+1.33)#4,907 |
| 26. | Sudlersville | 2.37% | 0.49%(+1.88)#26 | 1.05%(+1.33)#4,909 |
| 27. | Ashton Sandy Spring | 2.26% | 0.49%(+1.77)#27 | 1.05%(+1.21)#5,150 |
| 28. | Washington Grove | 2.15% | 0.49%(+1.66)#28 | 1.05%(+1.10)#5,396 |
| 29. | Burkittsville | 2.10% | 0.49%(+1.61)#29 | 1.05%(+1.05)#5,516 |
| 30. | Point Of Rocks | 2.08% | 0.49%(+1.58)#30 | 1.05%(+1.03)#5,567 |
| 31. | North Chevy Chase | 2.06% | 0.49%(+1.56)#31 | 1.05%(+1.01)#5,617 |
| 32. | Delmar | 2.05% | 0.49%(+1.56)#32 | 1.05%(+1.00)#5,627 |
| 33. | Braddock Heights | 2.03% | 0.49%(+1.54)#33 | 1.05%(+0.982)#5,701 |
| 34. | Chevy Chase | 2.02% | 0.49%(+1.53)#34 | 1.05%(+0.974)#5,719 |
| 35. | Mount Rainier | 1.98% | 0.49%(+1.49)#35 | 1.05%(+0.937)#5,837 |
| 36. | Port Deposit | 1.87% | 0.49%(+1.38)#36 | 1.05%(+0.826)#6,185 |
| 37. | West Pocomoke | 1.87% | 0.49%(+1.38)#37 | 1.05%(+0.824)#6,190 |
| 38. | Garrett Park | 1.84% | 0.49%(+1.35)#38 | 1.05%(+0.790)#6,286 |
| 39. | Golden Beach | 1.78% | 0.49%(+1.29)#39 | 1.05%(+0.731)#6,459 |
| 40. | Hampton | 1.77% | 0.49%(+1.28)#40 | 1.05%(+0.723)#6,483 |
| 41. | Halfway | 1.77% | 0.49%(+1.28)#41 | 1.05%(+0.722)#6,485 |
| 42. | Romancoke | 1.76% | 0.49%(+1.27)#42 | 1.05%(+0.712)#6,516 |
| 43. | Colesville | 1.75% | 0.49%(+1.26)#43 | 1.05%(+0.703)#6,546 |
| 44. | Crofton | 1.71% | 0.49%(+1.22)#44 | 1.05%(+0.662)#6,660 |
| 45. | Chevy Chase View | 1.69% | 0.49%(+1.20)#45 | 1.05%(+0.643)#6,719 |
| 46. | Cheverly | 1.66% | 0.49%(+1.17)#46 | 1.05%(+0.615)#6,825 |
| 47. | Betterton | 1.65% | 0.49%(+1.16)#47 | 1.05%(+0.604)#6,850 |
| 48. | Naval Academy | 1.64% | 0.49%(+1.14)#48 | 1.05%(+0.589)#6,906 |
| 49. | Martin S Additions | 1.61% | 0.49%(+1.12)#49 | 1.05%(+0.563)#6,999 |
| 50. | Burnt Mills | 1.56% | 0.49%(+1.07)#50 | 1.05%(+0.511)#7,176 |
| 51. | Bethesda | 1.54% | 0.49%(+1.05)#51 | 1.05%(+0.493)#7,234 |
| 52. | Chesapeake City | 1.50% | 0.49%(+1.01)#52 | 1.05%(+0.450)#7,416 |
| 53. | Deer Park | 1.48% | 0.49%(+0.991)#53 | 1.05%(+0.435)#7,471 |
| 54. | Severna Park | 1.44% | 0.49%(+0.951)#54 | 1.05%(+0.395)#7,618 |
| 55. | Forest Glen | 1.40% | 0.49%(+0.907)#55 | 1.05%(+0.351)#7,796 |
| 56. | Perryville | 1.36% | 0.49%(+0.872)#56 | 1.05%(+0.316)#7,961 |
| 57. | Rock Hall | 1.30% | 0.49%(+0.813)#57 | 1.05%(+0.257)#8,221 |
| 58. | Havre De Grace | 1.30% | 0.49%(+0.810)#58 | 1.05%(+0.254)#8,232 |
| 59. | Spring Ridge | 1.30% | 0.49%(+0.808)#59 | 1.05%(+0.252)#8,242 |
| 60. | Easton | 1.30% | 0.49%(+0.805)#60 | 1.05%(+0.248)#8,269 |
| 61. | Carney | 1.29% | 0.49%(+0.799)#61 | 1.05%(+0.243)#8,295 |
| 62. | Myersville | 1.28% | 0.49%(+0.791)#62 | 1.05%(+0.235)#8,335 |
| 63. | Keedysville | 1.28% | 0.49%(+0.787)#63 | 1.05%(+0.231)#8,358 |
| 64. | Sharpsburg | 1.25% | 0.49%(+0.754)#64 | 1.05%(+0.198)#8,497 |
| 65. | Jarrettsville | 1.23% | 0.49%(+0.740)#65 | 1.05%(+0.184)#8,554 |
| 66. | Mountain Lake Park | 1.23% | 0.49%(+0.736)#66 | 1.05%(+0.180)#8,575 |
| 67. | Trappe | 1.18% | 0.49%(+0.685)#67 | 1.05%(+0.129)#8,802 |
| 68. | Cottage City | 1.17% | 0.49%(+0.674)#68 | 1.05%(+0.118)#8,852 |
| 69. | Bel Air North | 1.16% | 0.49%(+0.670)#69 | 1.05%(+0.114)#8,870 |
| 70. | Owings | 1.14% | 0.49%(+0.644)#70 | 1.05%(+0.088)#9,004 |
| 71. | Fort Meade | 1.13% | 0.49%(+0.636)#71 | 1.05%(+0.080)#9,053 |
| 72. | Kingstown | 1.12% | 0.49%(+0.628)#72 | 1.05%(+0.072)#9,097 |
| 73. | Union Bridge | 1.06% | 0.49%(+0.573)#73 | 1.05%(+0.017)#9,395 |
| 74. | Glen Echo | 1.06% | 0.49%(+0.571)#74 | 1.05%(+0.015)#9,400 |
| 75. | Linganore | 1.06% | 0.49%(+0.569)#75 | 1.05%(+0.013)#9,413 |
| 76. | Sharptown | 1.06% | 0.49%(+0.569)#76 | 1.05%(+0.013)#9,418 |
| 77. | North Beach | 1.06% | 0.49%(+0.566)#77 | 1.05%(+0.010)#9,433 |
| 78. | Forest Heights | 1.02% | 0.49%(+0.530)#78 | 1.05%(-0.026)#9,636 |
| 79. | Fort Washington | 1.02% | 0.49%(+0.530)#79 | 1.05%(-0.026)#9,638 |
| 80. | Galena | 1.00% | 0.49%(+0.512)#80 | 1.05%(-0.044)#9,732 |
| 81. | Boonsboro | 1.00% | 0.49%(+0.512)#81 | 1.05%(-0.044)#9,736 |
| 82. | Ocean City | 1.00% | 0.49%(+0.511)#82 | 1.05%(-0.045)#9,740 |
| 83. | Joppatowne | 1.00% | 0.49%(+0.508)#83 | 1.05%(-0.048)#9,753 |
| 84. | New Market | 0.98% | 0.49%(+0.485)#84 | 1.05%(-0.071)#9,893 |
| 85. | Parole | 0.98% | 0.49%(+0.485)#85 | 1.05%(-0.071)#9,901 |
| 86. | Eldersburg | 0.95% | 0.49%(+0.460)#86 | 1.05%(-0.096)#10,024 |
| 87. | Cockeysville | 0.94% | 0.49%(+0.450)#87 | 1.05%(-0.106)#10,086 |
| 88. | Calverton | 0.94% | 0.49%(+0.446)#88 | 1.05%(-0.110)#10,112 |
| 89. | Mount Airy | 0.92% | 0.49%(+0.428)#89 | 1.05%(-0.128)#10,193 |
| 90. | Mays Chapel | 0.92% | 0.49%(+0.428)#90 | 1.05%(-0.128)#10,194 |
| 91. | Buckeystown | 0.89% | 0.49%(+0.398)#91 | 1.05%(-0.158)#10,360 |
| 92. | Arnold | 0.89% | 0.49%(+0.394)#92 | 1.05%(-0.162)#10,386 |
| 93. | North Laurel | 0.88% | 0.49%(+0.392)#93 | 1.05%(-0.164)#10,401 |
| 94. | Westminster | 0.86% | 0.49%(+0.363)#94 | 1.05%(-0.193)#10,574 |
| 95. | Redland | 0.83% | 0.49%(+0.342)#95 | 1.05%(-0.214)#10,735 |
| 96. | Perryman | 0.83% | 0.49%(+0.340)#96 | 1.05%(-0.216)#10,748 |
| 97. | Catonsville | 0.83% | 0.49%(+0.338)#97 | 1.05%(-0.218)#10,764 |
| 98. | North Kensington | 0.83% | 0.49%(+0.334)#98 | 1.05%(-0.222)#10,789 |
| 99. | Towson | 0.83% | 0.49%(+0.334)#99 | 1.05%(-0.222)#10,790 |
| 100. | Riviera Beach | 0.83% | 0.49%(+0.333)#100 | 1.05%(-0.223)#10,793 |
Common Questions
What are the Top 10 Cities with the Highest Percentage of Swedish Population in Maryland?
Top 10 Cities with the Highest Percentage of Swedish Population in Maryland are:
#1
23.81%
#2
14.52%
#3
12.72%
#4
8.75%
#5
8.36%
#6
7.66%
#7
5.02%
#8
4.94%
#9
4.23%
#10
4.00%
What city has the Highest Percentage of Swedish Population in Maryland?
Elliott has the Highest Percentage of Swedish Population in Maryland with 23.81%.
What is the Percentage of Swedish Population in the State of Maryland?
Percentage of Swedish Population in Maryland is 0.49%.
What is the Percentage of Swedish Population in the United States?
Percentage of Swedish Population in the United States is 1.05%.