Elkton, MD Map & Demographics
Elkton Map
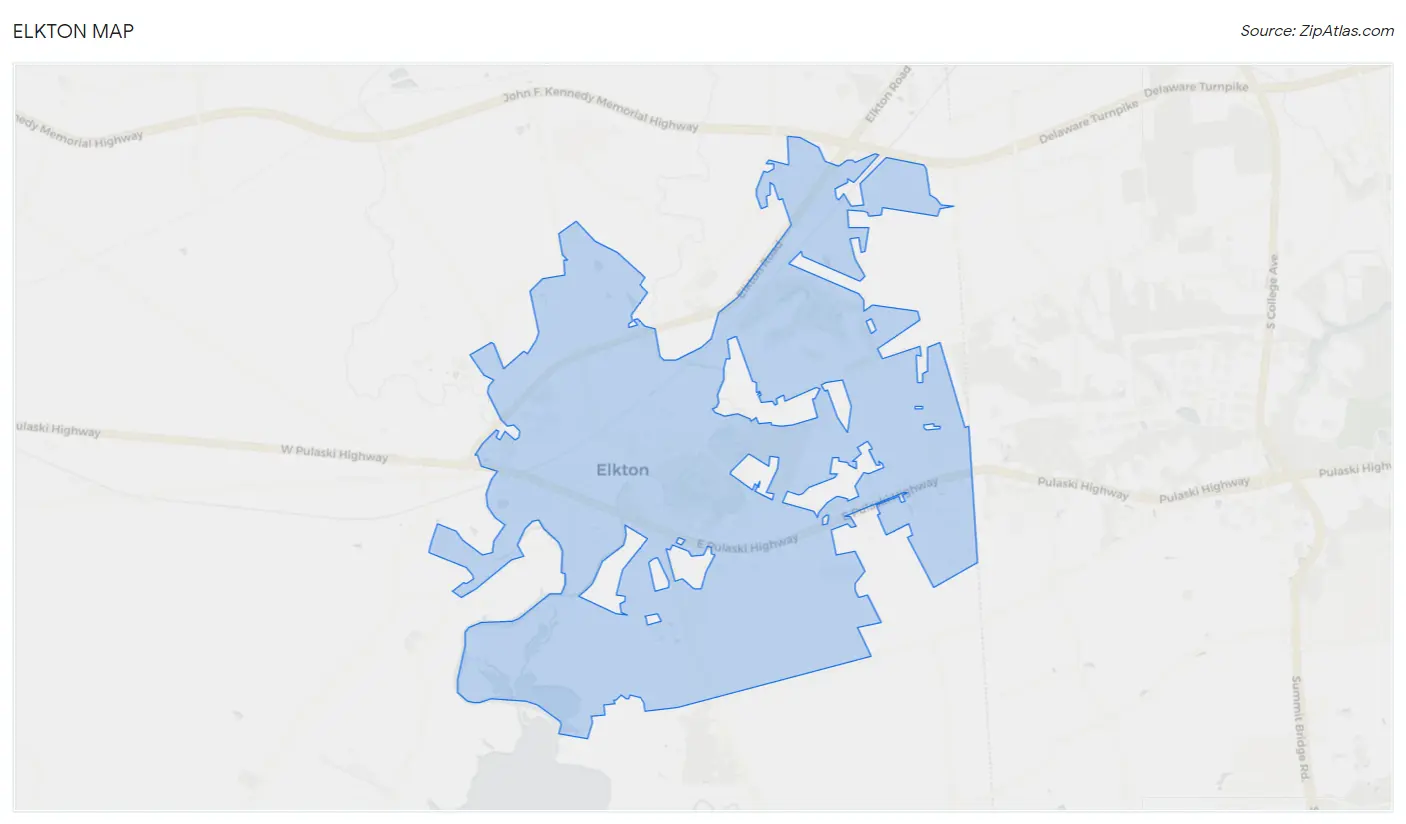
Elkton Overview
$32,283
PER CAPITA INCOME
$72,177
AVG FAMILY INCOME
$58,593
AVG HOUSEHOLD INCOME
20.9%
WAGE / INCOME GAP [ % ]
79.1¢/ $1
WAGE / INCOME GAP [ $ ]
0.45
INEQUALITY / GINI INDEX
15,830
TOTAL POPULATION
7,950
MALE POPULATION
7,880
FEMALE POPULATION
100.89
MALES / 100 FEMALES
99.12
FEMALES / 100 MALES
38.1
MEDIAN AGE
2.9
AVG FAMILY SIZE
2.4
AVG HOUSEHOLD SIZE
7,645
LABOR FORCE [ PEOPLE ]
58.3%
PERCENT IN LABOR FORCE
4.9%
UNEMPLOYMENT RATE
Elkton Zip Codes
Income in Elkton
Income Overview in Elkton
Per Capita Income in Elkton is $32,283, while median incomes of families and households are $72,177 and $58,593 respectively.
| Characteristic | Number | Measure |
| Per Capita Income | 15,830 | $32,283 |
| Median Family Income | 4,016 | $72,177 |
| Mean Family Income | 4,016 | $94,931 |
| Median Household Income | 6,136 | $58,593 |
| Mean Household Income | 6,136 | $82,974 |
| Income Deficit | 4,016 | $0 |
| Wage / Income Gap (%) | 15,830 | 20.89% |
| Wage / Income Gap ($) | 15,830 | 79.11¢ per $1 |
| Gini / Inequality Index | 15,830 | 0.45 |
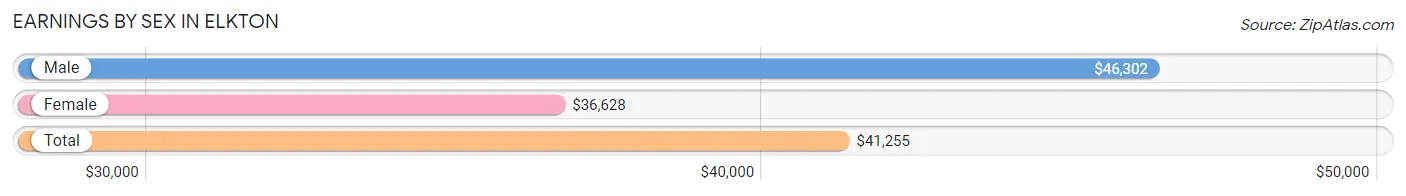
Earnings by Sex in Elkton
Average Earnings in Elkton are $41,255, $46,302 for men and $36,628 for women, a difference of 20.9%.
| Sex | Number | Average Earnings |
| Male | 4,290 (52.5%) | $46,302 |
| Female | 3,874 (47.4%) | $36,628 |
| Total | 8,164 (100.0%) | $41,255 |
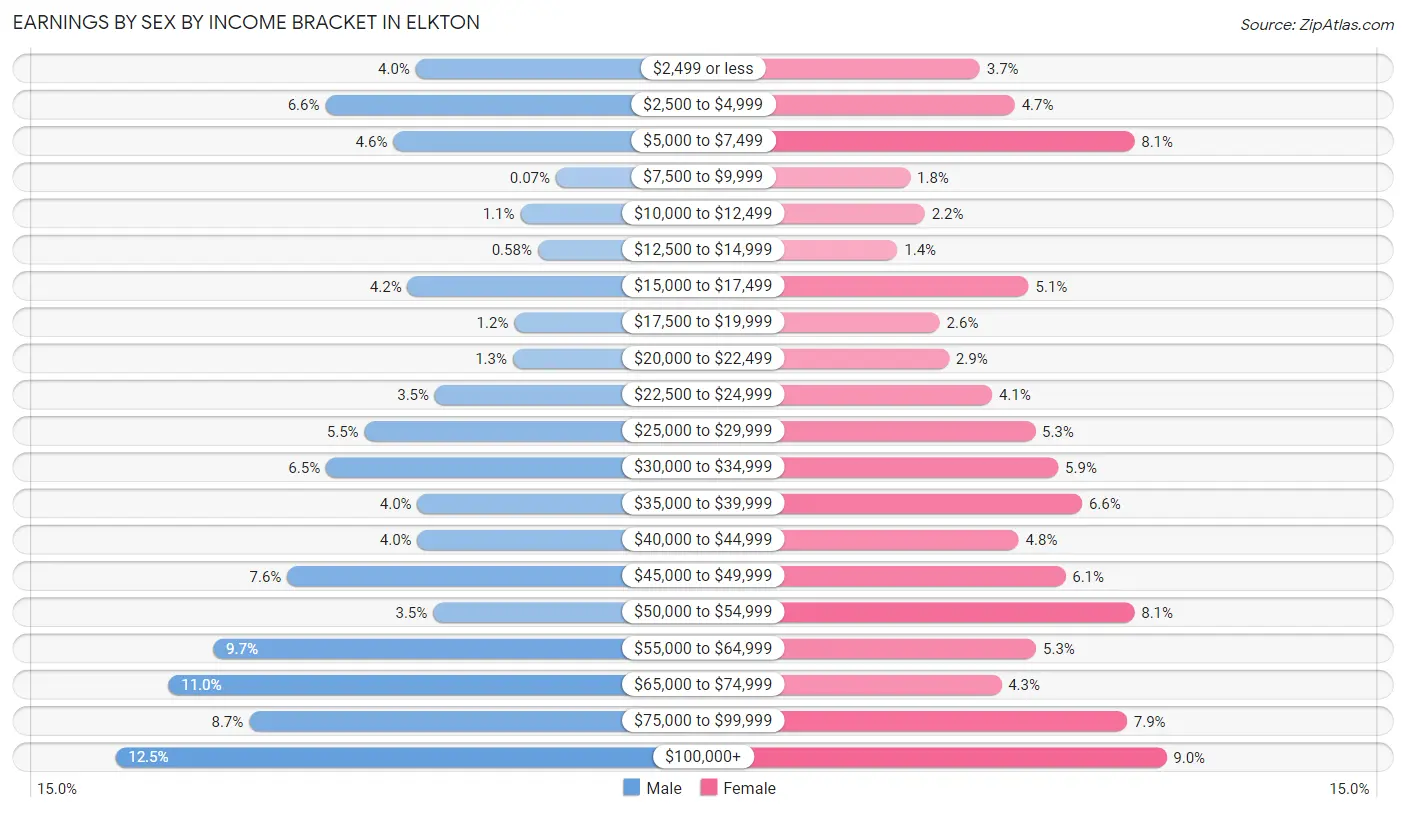
Earnings by Sex by Income Bracket in Elkton
The most common earnings brackets in Elkton are $100,000+ for men (534 | 12.4%) and $100,000+ for women (348 | 9.0%).
| Income | Male | Female |
| $2,499 or less | 172 (4.0%) | 145 (3.7%) |
| $2,500 to $4,999 | 281 (6.6%) | 183 (4.7%) |
| $5,000 to $7,499 | 199 (4.6%) | 313 (8.1%) |
| $7,500 to $9,999 | 3 (0.1%) | 69 (1.8%) |
| $10,000 to $12,499 | 46 (1.1%) | 85 (2.2%) |
| $12,500 to $14,999 | 25 (0.6%) | 55 (1.4%) |
| $15,000 to $17,499 | 182 (4.2%) | 198 (5.1%) |
| $17,500 to $19,999 | 53 (1.2%) | 101 (2.6%) |
| $20,000 to $22,499 | 55 (1.3%) | 111 (2.9%) |
| $22,500 to $24,999 | 149 (3.5%) | 158 (4.1%) |
| $25,000 to $29,999 | 234 (5.4%) | 205 (5.3%) |
| $30,000 to $34,999 | 280 (6.5%) | 230 (5.9%) |
| $35,000 to $39,999 | 170 (4.0%) | 256 (6.6%) |
| $40,000 to $44,999 | 170 (4.0%) | 187 (4.8%) |
| $45,000 to $49,999 | 327 (7.6%) | 238 (6.1%) |
| $50,000 to $54,999 | 151 (3.5%) | 313 (8.1%) |
| $55,000 to $64,999 | 416 (9.7%) | 206 (5.3%) |
| $65,000 to $74,999 | 470 (11.0%) | 168 (4.3%) |
| $75,000 to $99,999 | 373 (8.7%) | 305 (7.9%) |
| $100,000+ | 534 (12.4%) | 348 (9.0%) |
| Total | 4,290 (100.0%) | 3,874 (100.0%) |
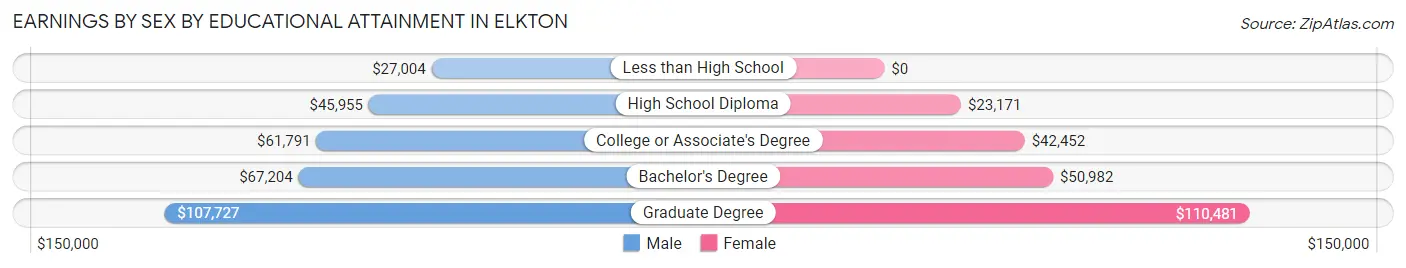
Earnings by Sex by Educational Attainment in Elkton
Average earnings in Elkton are $58,780 for men and $40,658 for women, a difference of 30.8%. Men with an educational attainment of graduate degree enjoy the highest average annual earnings of $107,727, while those with less than high school education earn the least with $27,004. Women with an educational attainment of graduate degree earn the most with the average annual earnings of $110,481, while those with high school diploma education have the smallest earnings of $23,171.
| Educational Attainment | Male Income | Female Income |
| Less than High School | $27,004 | $0 |
| High School Diploma | $45,955 | $23,171 |
| College or Associate's Degree | $61,791 | $42,452 |
| Bachelor's Degree | $67,204 | $50,982 |
| Graduate Degree | $107,727 | $110,481 |
| Total | $58,780 | $40,658 |
Family Income in Elkton
Family Income Brackets in Elkton
According to the Elkton family income data, there are 787 families falling into the $100,000 to $149,999 income range, which is the most common income bracket and makes up 19.6% of all families. Conversely, the $10,000 to $14,999 income bracket is the least frequent group with only 28 families (0.7%) belonging to this category.
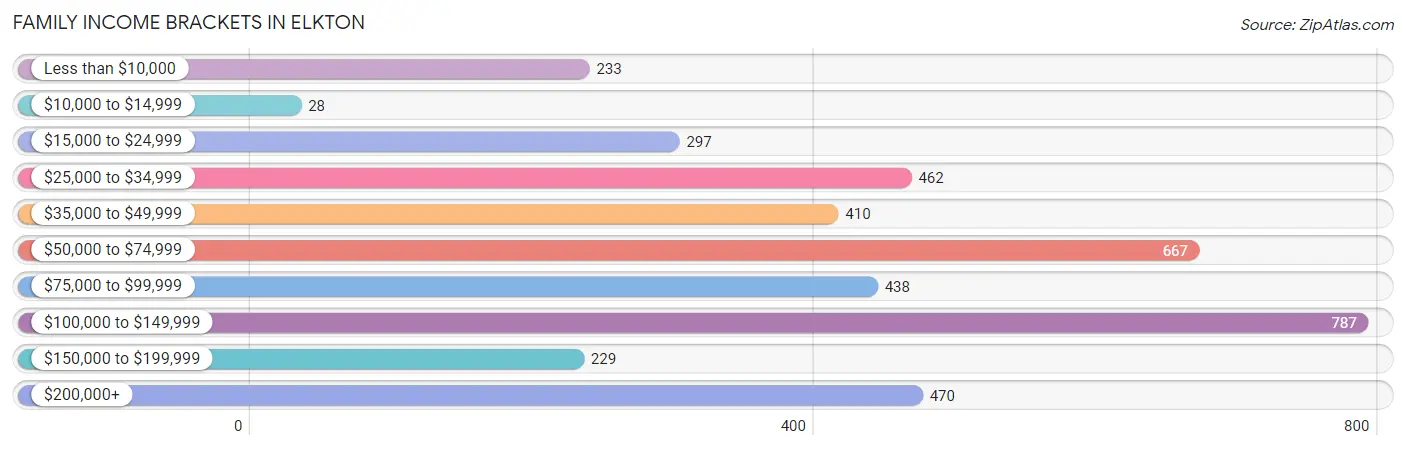
| Income Bracket | # Families | % Families |
| Less than $10,000 | 233 | 5.8% |
| $10,000 to $14,999 | 28 | 0.7% |
| $15,000 to $24,999 | 297 | 7.4% |
| $25,000 to $34,999 | 462 | 11.5% |
| $35,000 to $49,999 | 410 | 10.2% |
| $50,000 to $74,999 | 667 | 16.6% |
| $75,000 to $99,999 | 438 | 10.9% |
| $100,000 to $149,999 | 787 | 19.6% |
| $150,000 to $199,999 | 229 | 5.7% |
| $200,000+ | 470 | 11.7% |
Family Income by Famaliy Size in Elkton
4-person families (549 | 13.7%) account for the highest median family income in Elkton with $131,361 per family, while 2-person families (1,880 | 46.8%) have the highest median income of $35,710 per family member.
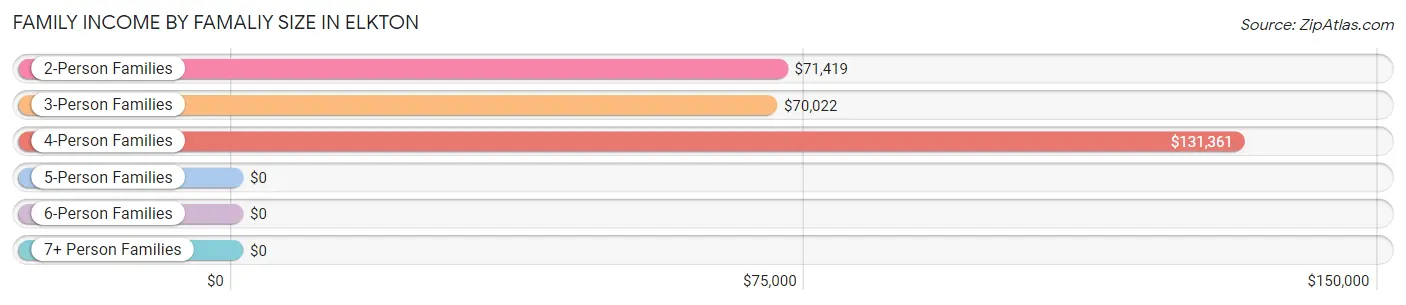
| Income Bracket | # Families | Median Income |
| 2-Person Families | 1,880 (46.8%) | $71,419 |
| 3-Person Families | 1,087 (27.1%) | $70,022 |
| 4-Person Families | 549 (13.7%) | $131,361 |
| 5-Person Families | 408 (10.2%) | $0 |
| 6-Person Families | 52 (1.3%) | $0 |
| 7+ Person Families | 40 (1.0%) | $0 |
| Total | 4,016 (100.0%) | $72,177 |
Family Income by Number of Earners in Elkton
The median family income in Elkton is $72,177, with families comprising 3+ earners (462) having the highest median family income of $128,750, while families with no earners (583) have the lowest median family income of $24,359, accounting for 11.5% and 14.5% of families, respectively.
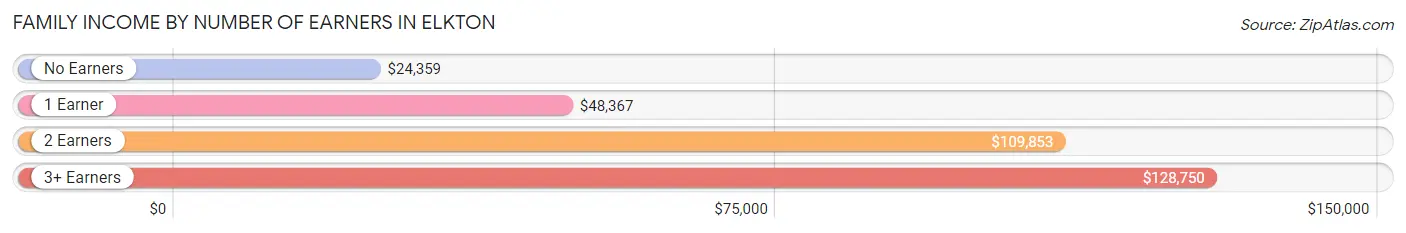
| Number of Earners | # Families | Median Income |
| No Earners | 583 (14.5%) | $24,359 |
| 1 Earner | 1,415 (35.2%) | $48,367 |
| 2 Earners | 1,556 (38.8%) | $109,853 |
| 3+ Earners | 462 (11.5%) | $128,750 |
| Total | 4,016 (100.0%) | $72,177 |
Household Income in Elkton
Household Income Brackets in Elkton
With 945 households falling in the category, the $100,000 to $149,999 income range is the most frequent in Elkton, accounting for 15.4% of all households. In contrast, only 160 households (2.6%) fall into the $10,000 to $14,999 income bracket, making it the least populous group.
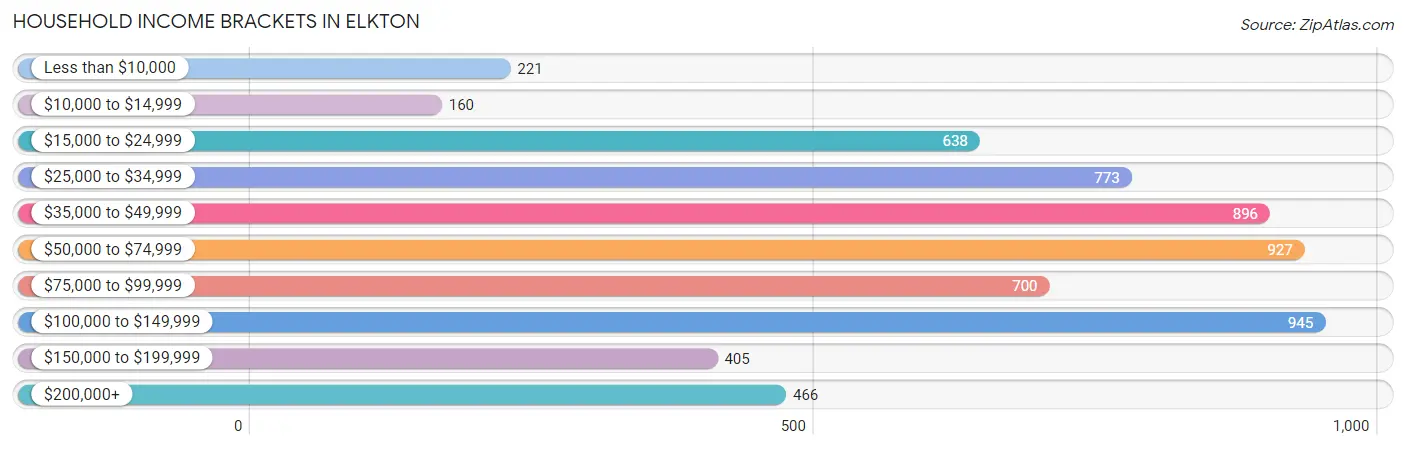
| Income Bracket | # Households | % Households |
| Less than $10,000 | 221 | 3.6% |
| $10,000 to $14,999 | 160 | 2.6% |
| $15,000 to $24,999 | 638 | 10.4% |
| $25,000 to $34,999 | 773 | 12.6% |
| $35,000 to $49,999 | 896 | 14.6% |
| $50,000 to $74,999 | 927 | 15.1% |
| $75,000 to $99,999 | 700 | 11.4% |
| $100,000 to $149,999 | 945 | 15.4% |
| $150,000 to $199,999 | 405 | 6.6% |
| $200,000+ | 466 | 7.6% |
Household Income by Householder Age in Elkton
The median household income in Elkton is $58,593, with the highest median household income of $73,601 found in the 45 to 64 years age bracket for the primary householder. A total of 2,235 households (36.4%) fall into this category. Meanwhile, the 65+ years age bracket for the primary householder has the lowest median household income of $40,692, with 1,557 households (25.4%) in this group.
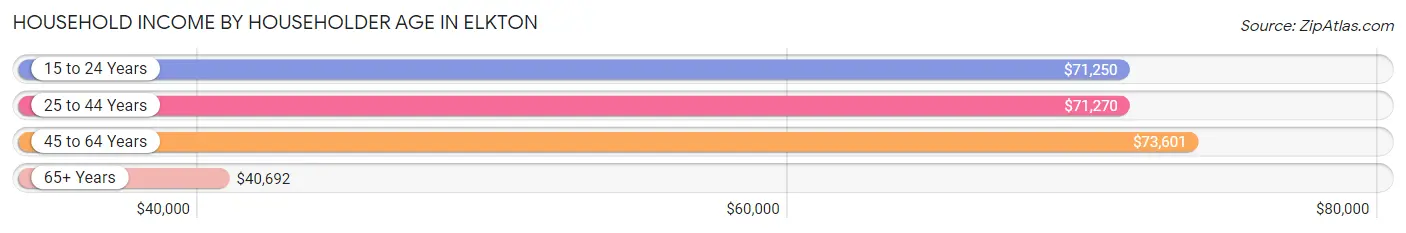
| Income Bracket | # Households | Median Income |
| 15 to 24 Years | 308 (5.0%) | $71,250 |
| 25 to 44 Years | 2,036 (33.2%) | $71,270 |
| 45 to 64 Years | 2,235 (36.4%) | $73,601 |
| 65+ Years | 1,557 (25.4%) | $40,692 |
| Total | 6,136 (100.0%) | $58,593 |
Poverty in Elkton
Income Below Poverty by Sex and Age in Elkton
With 16.6% poverty level for males and 16.5% for females among the residents of Elkton, under 5 year old males and under 5 year old females are the most vulnerable to poverty, with 239 males (52.1%) and 168 females (59.2%) in their respective age groups living below the poverty level.
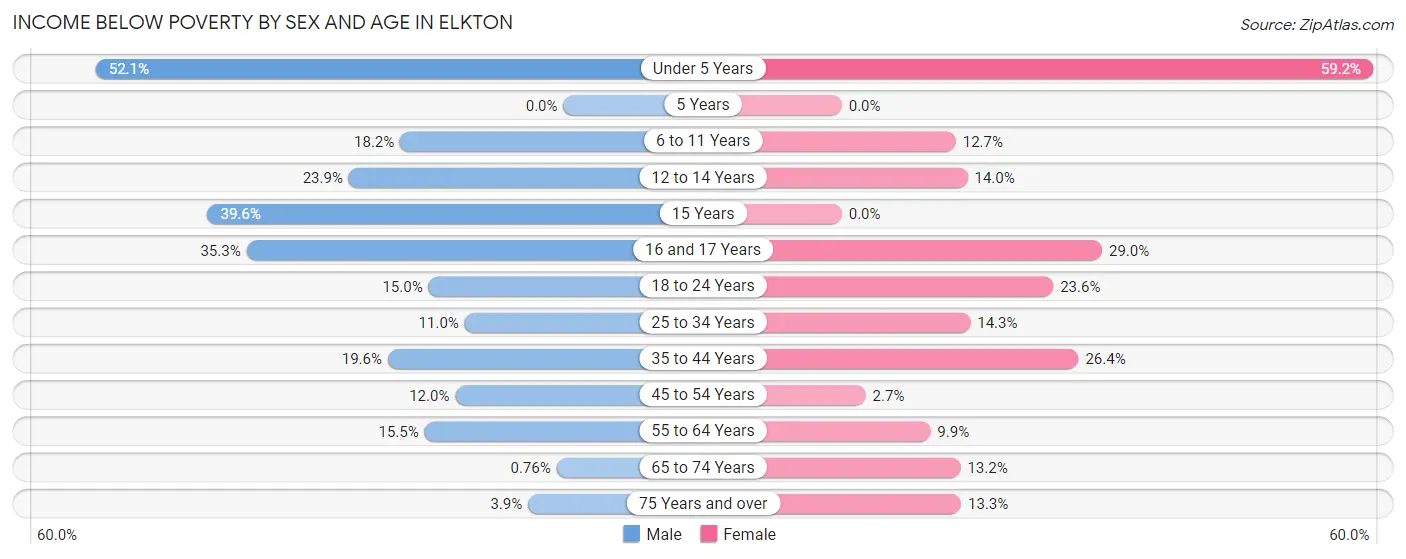
| Age Bracket | Male | Female |
| Under 5 Years | 239 (52.1%) | 168 (59.2%) |
| 5 Years | 0 (0.0%) | 0 (0.0%) |
| 6 to 11 Years | 114 (18.2%) | 73 (12.7%) |
| 12 to 14 Years | 49 (23.9%) | 21 (14.0%) |
| 15 Years | 21 (39.6%) | 0 (0.0%) |
| 16 and 17 Years | 90 (35.3%) | 82 (29.0%) |
| 18 to 24 Years | 147 (15.0%) | 154 (23.5%) |
| 25 to 34 Years | 107 (11.0%) | 175 (14.3%) |
| 35 to 44 Years | 155 (19.6%) | 306 (26.4%) |
| 45 to 54 Years | 164 (12.0%) | 26 (2.7%) |
| 55 to 64 Years | 107 (15.5%) | 89 (9.9%) |
| 65 to 74 Years | 4 (0.8%) | 122 (13.2%) |
| 75 Years and over | 13 (3.9%) | 46 (13.3%) |
| Total | 1,210 (16.6%) | 1,262 (16.5%) |
Income Above Poverty by Sex and Age in Elkton
According to the poverty statistics in Elkton, males aged 5 years and females aged 5 years are the age groups that are most secure financially, with 100.0% of males and 100.0% of females in these age groups living above the poverty line.
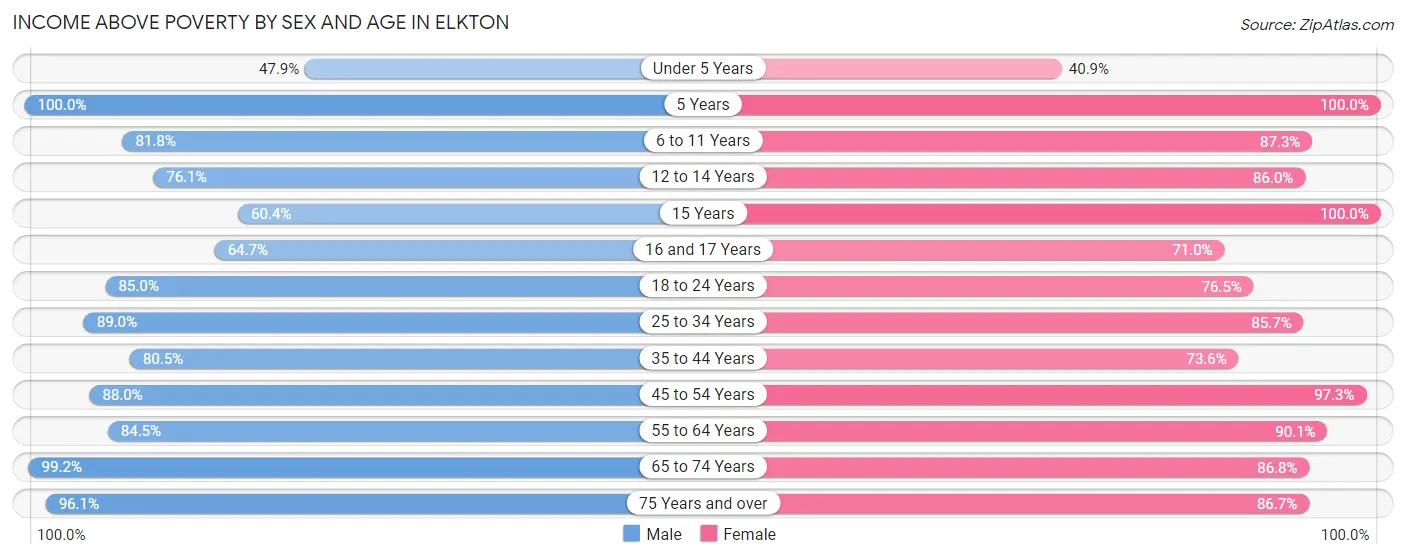
| Age Bracket | Male | Female |
| Under 5 Years | 220 (47.9%) | 116 (40.8%) |
| 5 Years | 47 (100.0%) | 20 (100.0%) |
| 6 to 11 Years | 513 (81.8%) | 502 (87.3%) |
| 12 to 14 Years | 156 (76.1%) | 129 (86.0%) |
| 15 Years | 32 (60.4%) | 132 (100.0%) |
| 16 and 17 Years | 165 (64.7%) | 201 (71.0%) |
| 18 to 24 Years | 832 (85.0%) | 500 (76.4%) |
| 25 to 34 Years | 867 (89.0%) | 1,048 (85.7%) |
| 35 to 44 Years | 638 (80.4%) | 855 (73.6%) |
| 45 to 54 Years | 1,198 (88.0%) | 950 (97.3%) |
| 55 to 64 Years | 585 (84.5%) | 813 (90.1%) |
| 65 to 74 Years | 525 (99.2%) | 801 (86.8%) |
| 75 Years and over | 318 (96.1%) | 300 (86.7%) |
| Total | 6,096 (83.4%) | 6,367 (83.5%) |
Income Below Poverty Among Married-Couple Families in Elkton
The poverty statistics for married-couple families in Elkton show that 4.9% or 121 of the total 2,469 families live below the poverty line. Families with 3 or 4 children have the highest poverty rate of 50.0%, comprising of 27 families. On the other hand, families with no children have the lowest poverty rate of 0.8%, which includes 13 families.
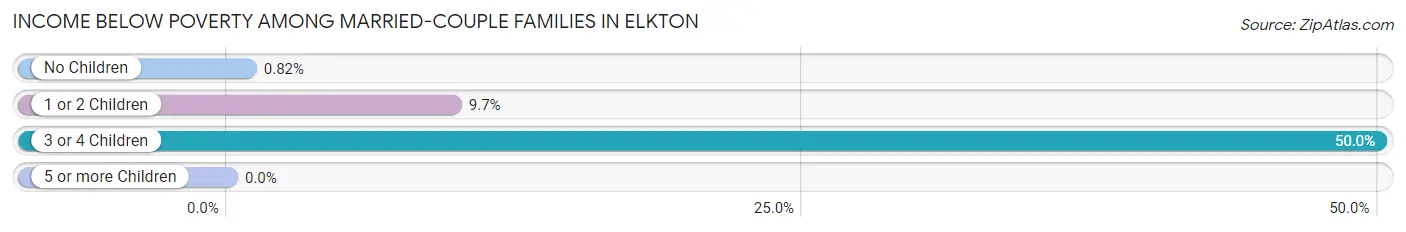
| Children | Above Poverty | Below Poverty |
| No Children | 1,570 (99.2%) | 13 (0.8%) |
| 1 or 2 Children | 751 (90.3%) | 81 (9.7%) |
| 3 or 4 Children | 27 (50.0%) | 27 (50.0%) |
| 5 or more Children | 0 (0.0%) | 0 (0.0%) |
| Total | 2,348 (95.1%) | 121 (4.9%) |
Income Below Poverty Among Single-Parent Households in Elkton
According to the poverty data in Elkton, 10.2% or 38 single-father households and 30.9% or 364 single-mother households are living below the poverty line. Among single-father households, those with 1 or 2 children have the highest poverty rate, with 38 households (29.9%) experiencing poverty. Likewise, among single-mother households, those with 3 or 4 children have the highest poverty rate, with 180 households (85.7%) falling below the poverty line.
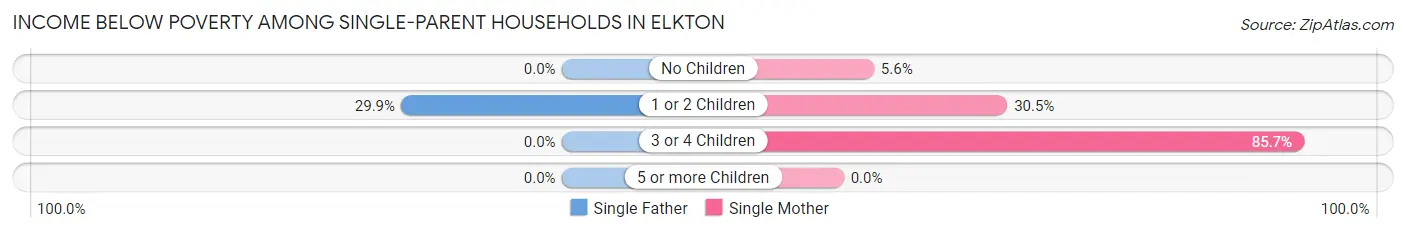
| Children | Single Father | Single Mother |
| No Children | 0 (0.0%) | 25 (5.6%) |
| 1 or 2 Children | 38 (29.9%) | 159 (30.5%) |
| 3 or 4 Children | 0 (0.0%) | 180 (85.7%) |
| 5 or more Children | 0 (0.0%) | 0 (0.0%) |
| Total | 38 (10.2%) | 364 (30.9%) |
Income Below Poverty Among Married-Couple vs Single-Parent Households in Elkton
The poverty data for Elkton shows that 121 of the married-couple family households (4.9%) and 402 of the single-parent households (26.0%) are living below the poverty level. Within the married-couple family households, those with 3 or 4 children have the highest poverty rate, with 27 households (50.0%) falling below the poverty line. Among the single-parent households, those with 3 or 4 children have the highest poverty rate, with 180 household (73.2%) living below poverty.
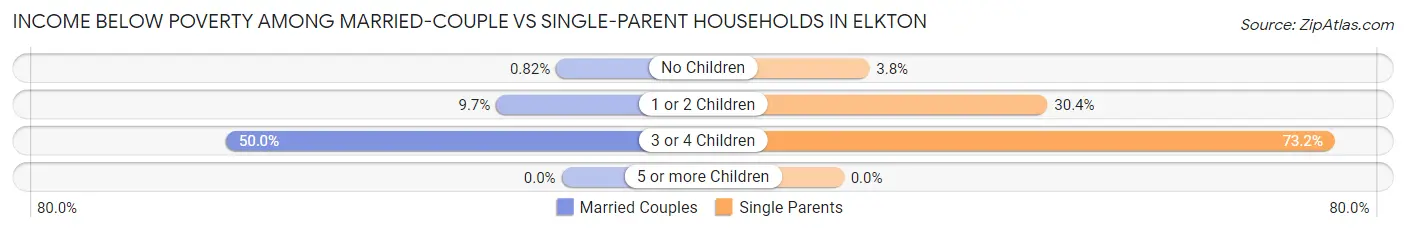
| Children | Married-Couple Families | Single-Parent Households |
| No Children | 13 (0.8%) | 25 (3.8%) |
| 1 or 2 Children | 81 (9.7%) | 197 (30.3%) |
| 3 or 4 Children | 27 (50.0%) | 180 (73.2%) |
| 5 or more Children | 0 (0.0%) | 0 (0.0%) |
| Total | 121 (4.9%) | 402 (26.0%) |
Race in Elkton
The most populous races in Elkton are White / Caucasian (10,696 | 67.6%), Black / African American (2,508 | 15.8%), and Two or more Races (1,664 | 10.5%).
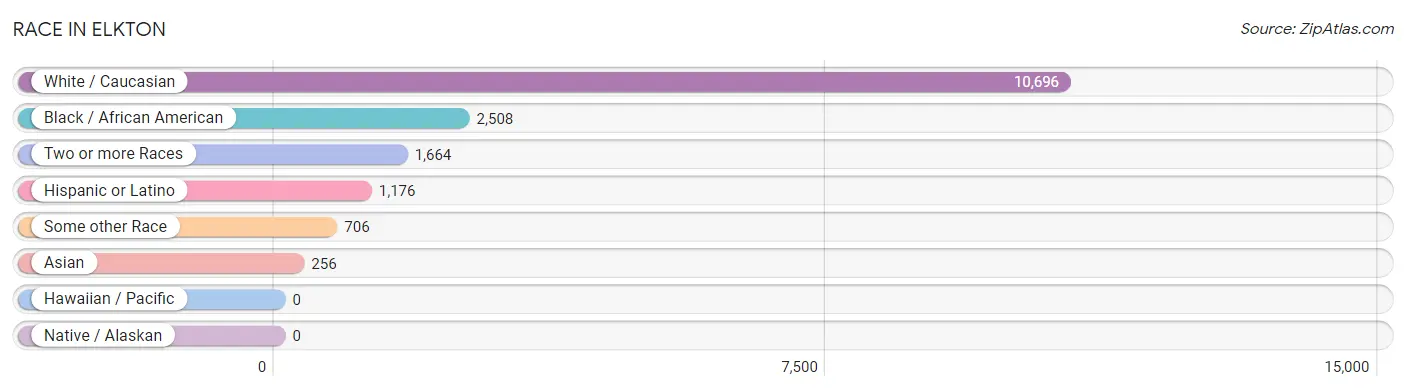
| Race | # Population | % Population |
| Asian | 256 | 1.6% |
| Black / African American | 2,508 | 15.8% |
| Hawaiian / Pacific | 0 | 0.0% |
| Hispanic or Latino | 1,176 | 7.4% |
| Native / Alaskan | 0 | 0.0% |
| White / Caucasian | 10,696 | 67.6% |
| Two or more Races | 1,664 | 10.5% |
| Some other Race | 706 | 4.5% |
| Total | 15,830 | 100.0% |
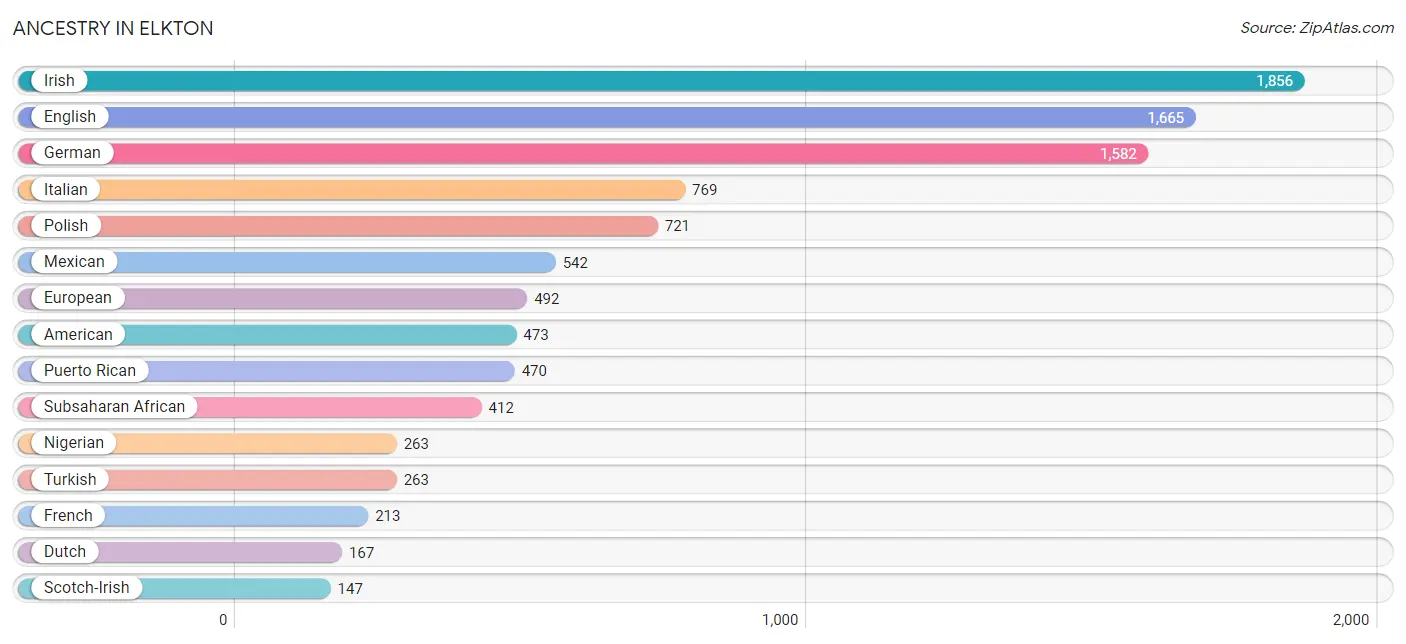
Ancestry in Elkton
The most populous ancestries reported in Elkton are Irish (1,856 | 11.7%), English (1,665 | 10.5%), German (1,582 | 10.0%), Italian (769 | 4.9%), and Polish (721 | 4.5%), together accounting for 41.6% of all Elkton residents.
| Ancestry | # Population | % Population |
| African | 81 | 0.5% |
| American | 473 | 3.0% |
| Bhutanese | 7 | 0.0% |
| British | 15 | 0.1% |
| Burmese | 58 | 0.4% |
| Central American | 78 | 0.5% |
| Cherokee | 8 | 0.1% |
| Costa Rican | 21 | 0.1% |
| Croatian | 13 | 0.1% |
| Czech | 43 | 0.3% |
| Danish | 24 | 0.2% |
| Dominican | 32 | 0.2% |
| Dutch | 167 | 1.1% |
| Eastern European | 15 | 0.1% |
| English | 1,665 | 10.5% |
| European | 492 | 3.1% |
| French | 213 | 1.3% |
| French Canadian | 30 | 0.2% |
| German | 1,582 | 10.0% |
| Haitian | 16 | 0.1% |
| Honduran | 12 | 0.1% |
| Hungarian | 48 | 0.3% |
| Indian (Asian) | 25 | 0.2% |
| Irish | 1,856 | 11.7% |
| Italian | 769 | 4.9% |
| Kenyan | 65 | 0.4% |
| Korean | 63 | 0.4% |
| Lithuanian | 142 | 0.9% |
| Mexican | 542 | 3.4% |
| Nigerian | 263 | 1.7% |
| Northern European | 21 | 0.1% |
| Norwegian | 35 | 0.2% |
| Pennsylvania German | 34 | 0.2% |
| Peruvian | 37 | 0.2% |
| Polish | 721 | 4.5% |
| Puerto Rican | 470 | 3.0% |
| Russian | 32 | 0.2% |
| Salvadoran | 45 | 0.3% |
| Scandinavian | 16 | 0.1% |
| Scotch-Irish | 147 | 0.9% |
| Scottish | 53 | 0.3% |
| Sierra Leonean | 3 | 0.0% |
| Slovak | 16 | 0.1% |
| South American | 37 | 0.2% |
| Spanish | 10 | 0.1% |
| Subsaharan African | 412 | 2.6% |
| Swedish | 100 | 0.6% |
| Swiss | 63 | 0.4% |
| Thai | 125 | 0.8% |
| Trinidadian and Tobagonian | 13 | 0.1% |
| Turkish | 263 | 1.7% |
| Ukrainian | 7 | 0.0% |
| Welsh | 50 | 0.3% |
| Yugoslavian | 61 | 0.4% | View All 54 Rows |
Immigrants in Elkton
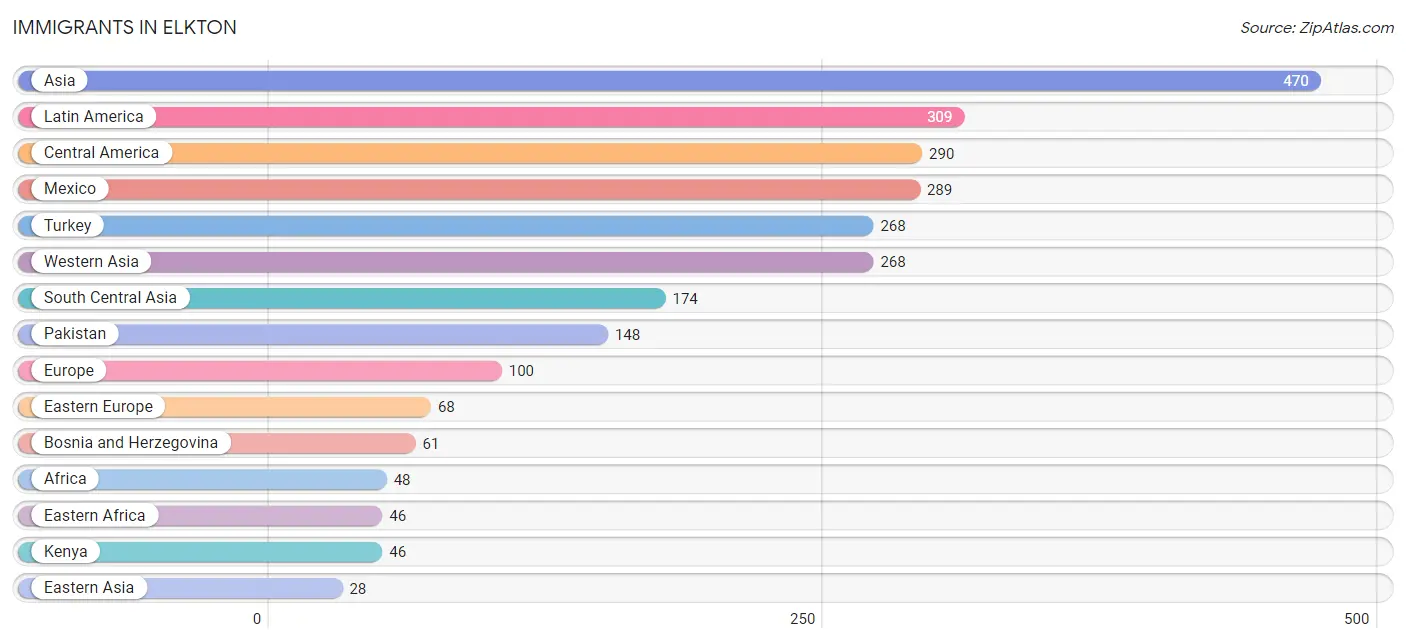
The most numerous immigrant groups reported in Elkton came from Asia (470 | 3.0%), Latin America (309 | 1.9%), Central America (290 | 1.8%), Mexico (289 | 1.8%), and Turkey (268 | 1.7%), together accounting for 10.3% of all Elkton residents.
| Immigration Origin | # Population | % Population |
| Africa | 48 | 0.3% |
| Asia | 470 | 3.0% |
| Bosnia and Herzegovina | 61 | 0.4% |
| Canada | 13 | 0.1% |
| Caribbean | 19 | 0.1% |
| Central America | 290 | 1.8% |
| Dominican Republic | 6 | 0.0% |
| Eastern Africa | 46 | 0.3% |
| Eastern Asia | 28 | 0.2% |
| Eastern Europe | 68 | 0.4% |
| El Salvador | 1 | 0.0% |
| Europe | 100 | 0.6% |
| Germany | 22 | 0.1% |
| India | 26 | 0.2% |
| Kenya | 46 | 0.3% |
| Korea | 28 | 0.2% |
| Latin America | 309 | 1.9% |
| Mexico | 289 | 1.8% |
| Pakistan | 148 | 0.9% |
| Russia | 7 | 0.0% |
| Sierra Leone | 2 | 0.0% |
| South Central Asia | 174 | 1.1% |
| Southern Europe | 10 | 0.1% |
| Spain | 10 | 0.1% |
| Trinidad and Tobago | 13 | 0.1% |
| Turkey | 268 | 1.7% |
| Western Africa | 2 | 0.0% |
| Western Asia | 268 | 1.7% |
| Western Europe | 22 | 0.1% | View All 29 Rows |
Sex and Age in Elkton
Sex and Age in Elkton
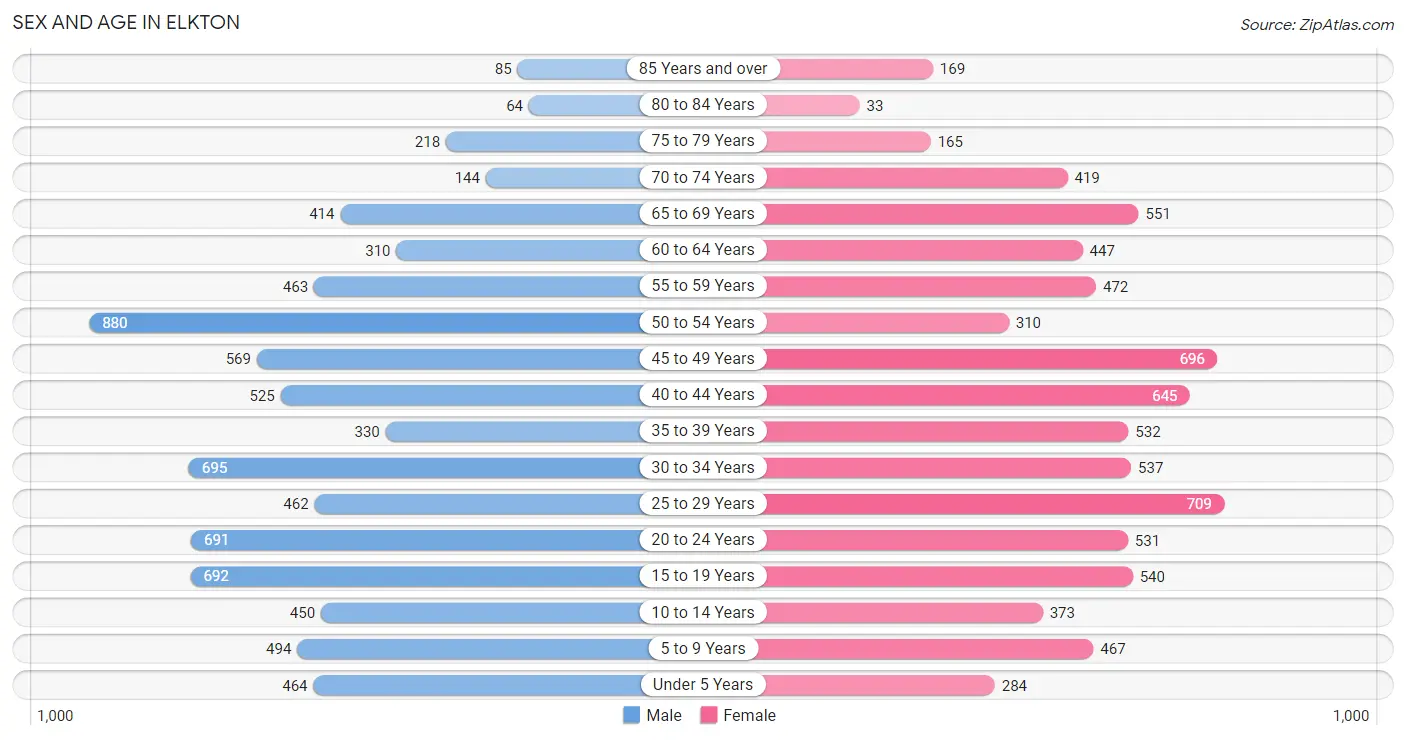
The most populous age groups in Elkton are 50 to 54 Years (880 | 11.1%) for men and 25 to 29 Years (709 | 9.0%) for women.
| Age Bracket | Male | Female |
| Under 5 Years | 464 (5.8%) | 284 (3.6%) |
| 5 to 9 Years | 494 (6.2%) | 467 (5.9%) |
| 10 to 14 Years | 450 (5.7%) | 373 (4.7%) |
| 15 to 19 Years | 692 (8.7%) | 540 (6.9%) |
| 20 to 24 Years | 691 (8.7%) | 531 (6.7%) |
| 25 to 29 Years | 462 (5.8%) | 709 (9.0%) |
| 30 to 34 Years | 695 (8.7%) | 537 (6.8%) |
| 35 to 39 Years | 330 (4.2%) | 532 (6.8%) |
| 40 to 44 Years | 525 (6.6%) | 645 (8.2%) |
| 45 to 49 Years | 569 (7.2%) | 696 (8.8%) |
| 50 to 54 Years | 880 (11.1%) | 310 (3.9%) |
| 55 to 59 Years | 463 (5.8%) | 472 (6.0%) |
| 60 to 64 Years | 310 (3.9%) | 447 (5.7%) |
| 65 to 69 Years | 414 (5.2%) | 551 (7.0%) |
| 70 to 74 Years | 144 (1.8%) | 419 (5.3%) |
| 75 to 79 Years | 218 (2.7%) | 165 (2.1%) |
| 80 to 84 Years | 64 (0.8%) | 33 (0.4%) |
| 85 Years and over | 85 (1.1%) | 169 (2.1%) |
| Total | 7,950 (100.0%) | 7,880 (100.0%) |
Families and Households in Elkton
Median Family Size in Elkton
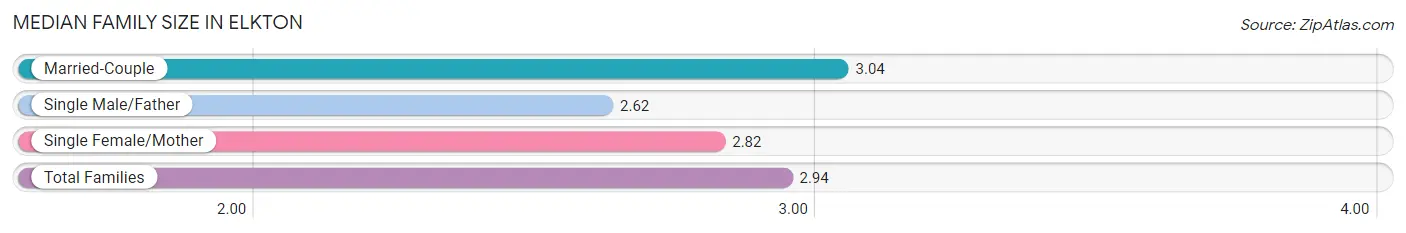
The median family size in Elkton is 2.94 persons per family, with married-couple families (2,469 | 61.5%) accounting for the largest median family size of 3.04 persons per family. On the other hand, single male/father families (371 | 9.2%) represent the smallest median family size with 2.62 persons per family.
| Family Type | # Families | Family Size |
| Married-Couple | 2,469 (61.5%) | 3.04 |
| Single Male/Father | 371 (9.2%) | 2.62 |
| Single Female/Mother | 1,176 (29.3%) | 2.82 |
| Total Families | 4,016 (100.0%) | 2.94 |
Median Household Size in Elkton
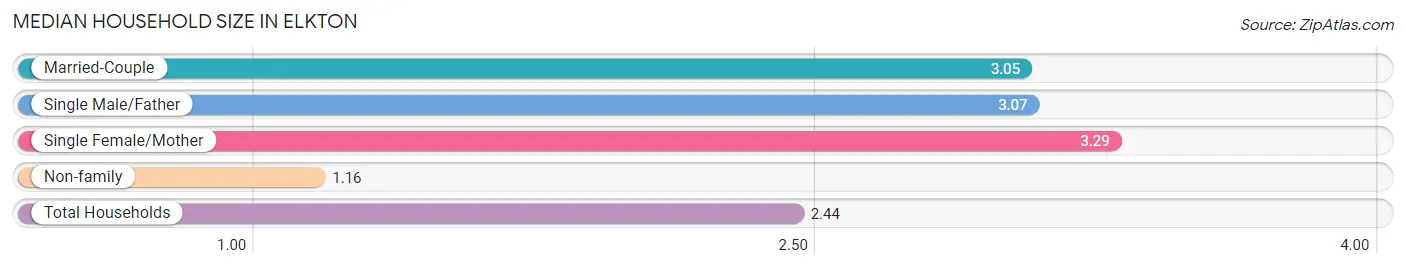
The median household size in Elkton is 2.44 persons per household, with single female/mother households (1,176 | 19.2%) accounting for the largest median household size of 3.29 persons per household. non-family households (2,120 | 34.5%) represent the smallest median household size with 1.16 persons per household.
| Household Type | # Households | Household Size |
| Married-Couple | 2,469 (40.2%) | 3.05 |
| Single Male/Father | 371 (6.0%) | 3.07 |
| Single Female/Mother | 1,176 (19.2%) | 3.29 |
| Non-family | 2,120 (34.5%) | 1.16 |
| Total Households | 6,136 (100.0%) | 2.44 |
Household Size by Marriage Status in Elkton
Out of a total of 6,136 households in Elkton, 4,016 (65.4%) are family households, while 2,120 (34.5%) are nonfamily households. The most numerous type of family households are 2-person households, comprising 1,764, and the most common type of nonfamily households are 1-person households, comprising 1,840.
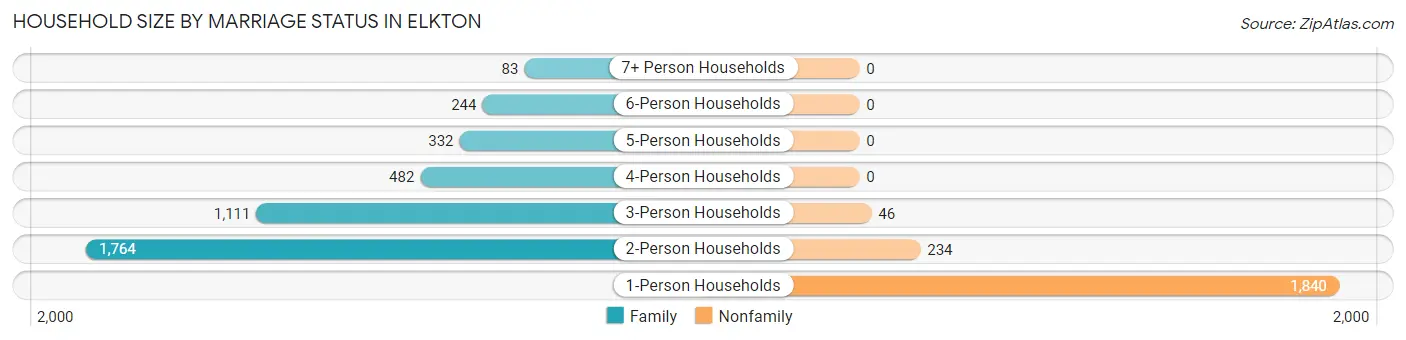
| Household Size | Family Households | Nonfamily Households |
| 1-Person Households | - | 1,840 (30.0%) |
| 2-Person Households | 1,764 (28.7%) | 234 (3.8%) |
| 3-Person Households | 1,111 (18.1%) | 46 (0.7%) |
| 4-Person Households | 482 (7.9%) | 0 (0.0%) |
| 5-Person Households | 332 (5.4%) | 0 (0.0%) |
| 6-Person Households | 244 (4.0%) | 0 (0.0%) |
| 7+ Person Households | 83 (1.3%) | 0 (0.0%) |
| Total | 4,016 (65.4%) | 2,120 (34.5%) |
Female Fertility in Elkton
Fertility by Age in Elkton
Average fertility rate in Elkton is 63.0 births per 1,000 women. Women in the age bracket of 35 to 50 years have the highest fertility rate with 81.0 births per 1,000 women. Women in the age bracket of 35 to 50 years acount for 59.0% of all women with births.
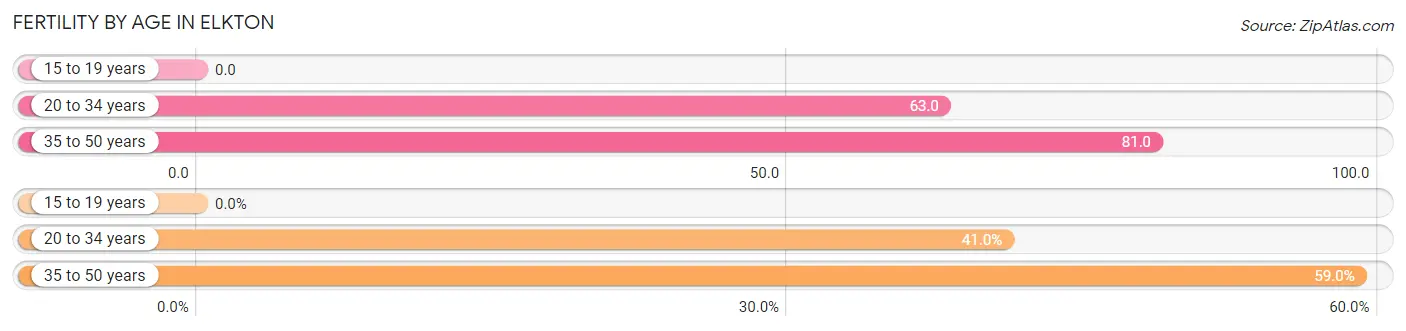
| Age Bracket | Women with Births | Births / 1,000 Women |
| 15 to 19 years | 0 (0.0%) | 0.0 |
| 20 to 34 years | 112 (41.0%) | 63.0 |
| 35 to 50 years | 161 (59.0%) | 81.0 |
| Total | 273 (100.0%) | 63.0 |
Fertility by Age by Marriage Status in Elkton
57.9% of women with births (273) in Elkton are married. The highest percentage of unmarried women with births falls into 20 to 34 years age bracket with 64.3% of them unmarried at the time of birth, while the lowest percentage of unmarried women with births belong to 35 to 50 years age bracket with 26.7% of them unmarried.
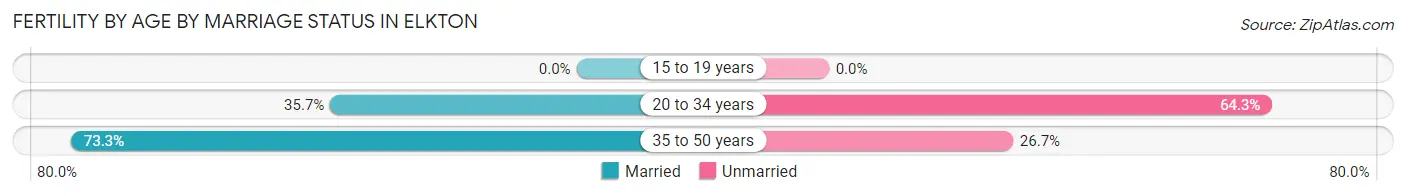
| Age Bracket | Married | Unmarried |
| 15 to 19 years | 0 (0.0%) | 0 (0.0%) |
| 20 to 34 years | 40 (35.7%) | 72 (64.3%) |
| 35 to 50 years | 118 (73.3%) | 43 (26.7%) |
| Total | 158 (57.9%) | 115 (42.1%) |
Fertility by Education in Elkton
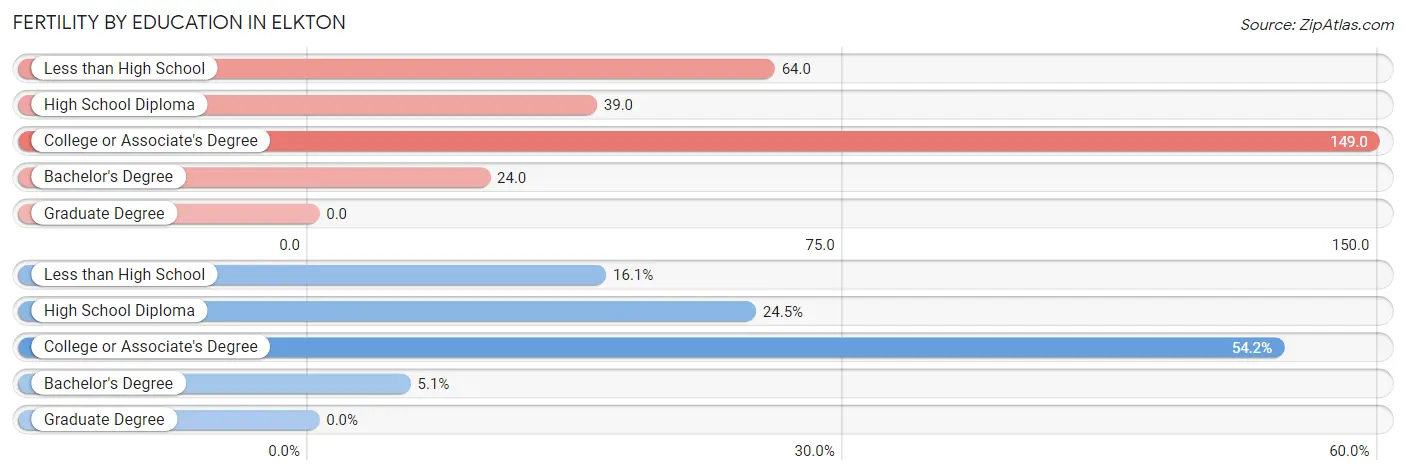
| Educational Attainment | Women with Births | Births / 1,000 Women |
| Less than High School | 44 (16.1%) | 64.0 |
| High School Diploma | 67 (24.5%) | 39.0 |
| College or Associate's Degree | 148 (54.2%) | 149.0 |
| Bachelor's Degree | 14 (5.1%) | 24.0 |
| Graduate Degree | 0 (0.0%) | 0.0 |
| Total | 273 (100.0%) | 63.0 |
Fertility by Education by Marriage Status in Elkton
42.1% of women with births in Elkton are unmarried. Women with the educational attainment of less than high school are most likely to be married with 100.0% of them married at childbirth, while women with the educational attainment of high school diploma are least likely to be married with 65.7% of them unmarried at childbirth.
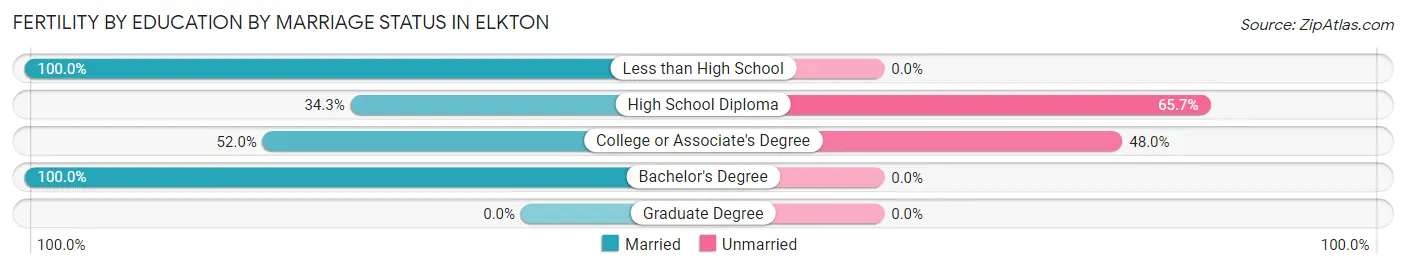
| Educational Attainment | Married | Unmarried |
| Less than High School | 44 (100.0%) | 0 (0.0%) |
| High School Diploma | 23 (34.3%) | 44 (65.7%) |
| College or Associate's Degree | 77 (52.0%) | 71 (48.0%) |
| Bachelor's Degree | 14 (100.0%) | 0 (0.0%) |
| Graduate Degree | 0 (0.0%) | 0 (0.0%) |
| Total | 158 (57.9%) | 115 (42.1%) |
Employment Characteristics in Elkton
Employment by Class of Employer in Elkton
Among the 7,059 employed individuals in Elkton, private company employees (5,238 | 74.2%), not-for-profit organizations (505 | 7.1%), and state government employees (471 | 6.7%) make up the most common classes of employment.
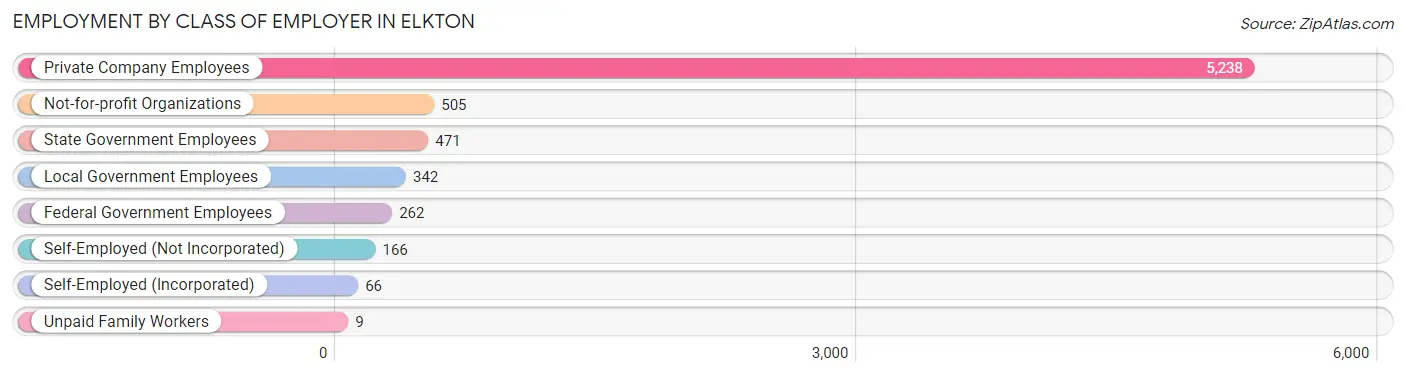
| Employer Class | # Employees | % Employees |
| Private Company Employees | 5,238 | 74.2% |
| Self-Employed (Incorporated) | 66 | 0.9% |
| Self-Employed (Not Incorporated) | 166 | 2.4% |
| Not-for-profit Organizations | 505 | 7.1% |
| Local Government Employees | 342 | 4.8% |
| State Government Employees | 471 | 6.7% |
| Federal Government Employees | 262 | 3.7% |
| Unpaid Family Workers | 9 | 0.1% |
| Total | 7,059 | 100.0% |
Employment Status by Age in Elkton
According to the labor force statistics for Elkton, out of the total population over 16 years of age (13,113), 58.3% or 7,645 individuals are in the labor force, with 4.9% or 375 of them unemployed. The age group with the highest labor force participation rate is 25 to 29 years, with 84.5% or 989 individuals in the labor force. Within the labor force, the 60 to 64 years age range has the highest percentage of unemployed individuals, with 11.6% or 37 of them being unemployed.
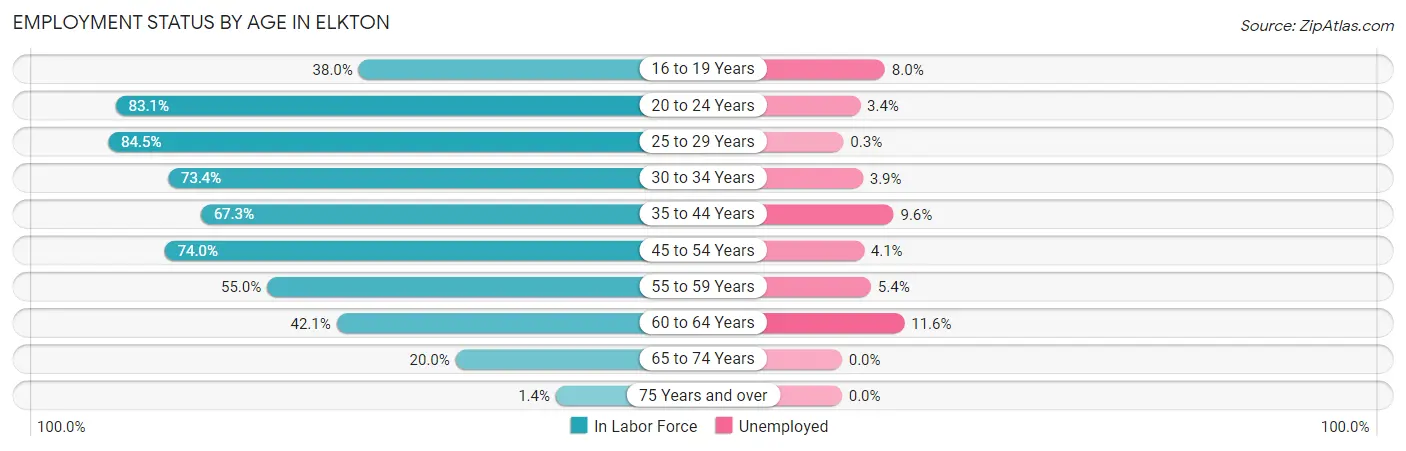
| Age Bracket | In Labor Force | Unemployed |
| 16 to 19 Years | 398 (38.0%) | 32 (8.0%) |
| 20 to 24 Years | 1,015 (83.1%) | 35 (3.4%) |
| 25 to 29 Years | 989 (84.5%) | 3 (0.3%) |
| 30 to 34 Years | 904 (73.4%) | 35 (3.9%) |
| 35 to 44 Years | 1,368 (67.3%) | 131 (9.6%) |
| 45 to 54 Years | 1,817 (74.0%) | 74 (4.1%) |
| 55 to 59 Years | 514 (55.0%) | 28 (5.4%) |
| 60 to 64 Years | 319 (42.1%) | 37 (11.6%) |
| 65 to 74 Years | 306 (20.0%) | 0 (0.0%) |
| 75 Years and over | 10 (1.4%) | 0 (0.0%) |
| Total | 7,645 (58.3%) | 375 (4.9%) |
Employment Status by Educational Attainment in Elkton
According to labor force statistics for Elkton, 68.9% of individuals (5,913) out of the total population between 25 and 64 years of age (8,582) are in the labor force, with 5.2% or 307 of them being unemployed. The group with the highest labor force participation rate are those with the educational attainment of bachelor's degree or higher, with 84.5% or 1,567 individuals in the labor force. Within the labor force, individuals with less than high school education have the highest percentage of unemployment, with 8.2% or 27 of them being unemployed.
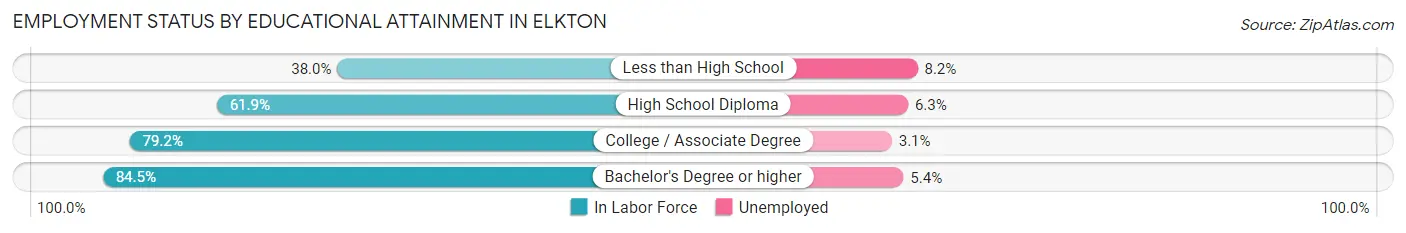
| Educational Attainment | In Labor Force | Unemployed |
| Less than High School | 331 (38.0%) | 72 (8.2%) |
| High School Diploma | 2,247 (61.9%) | 229 (6.3%) |
| College / Associate Degree | 1,762 (79.2%) | 69 (3.1%) |
| Bachelor's Degree or higher | 1,567 (84.5%) | 100 (5.4%) |
| Total | 5,913 (68.9%) | 446 (5.2%) |
Employment Occupations by Sex in Elkton
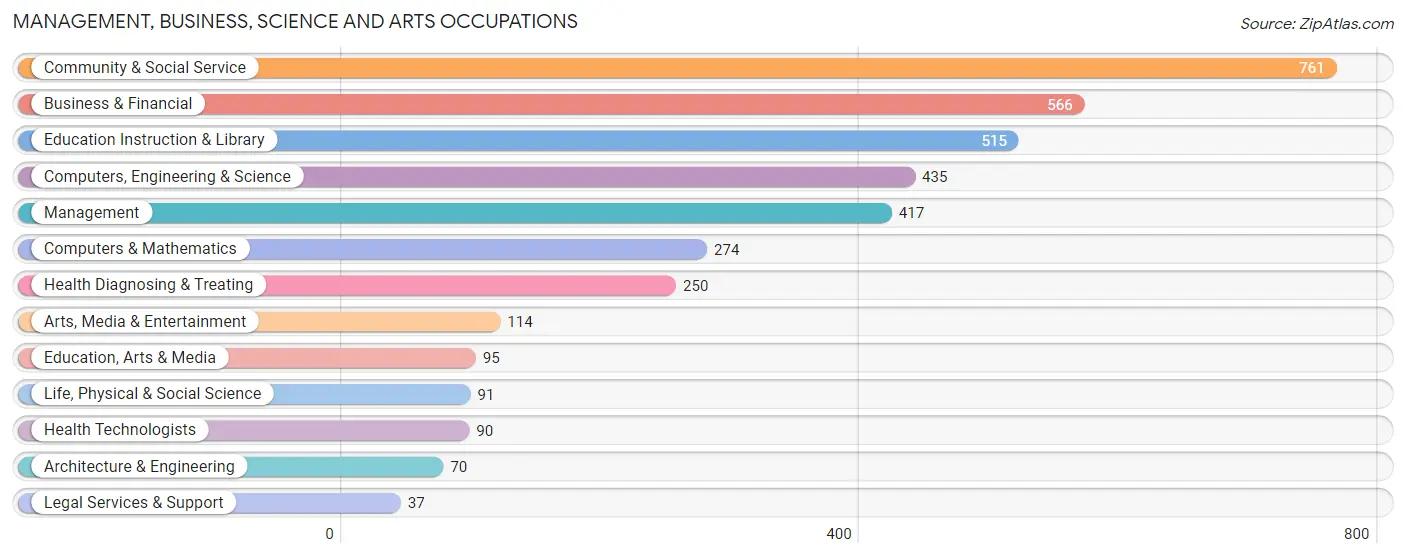
Management, Business, Science and Arts Occupations
The most common Management, Business, Science and Arts occupations in Elkton are Community & Social Service (761 | 10.5%), Business & Financial (566 | 7.8%), Education Instruction & Library (515 | 7.1%), Computers, Engineering & Science (435 | 6.0%), and Management (417 | 5.8%).
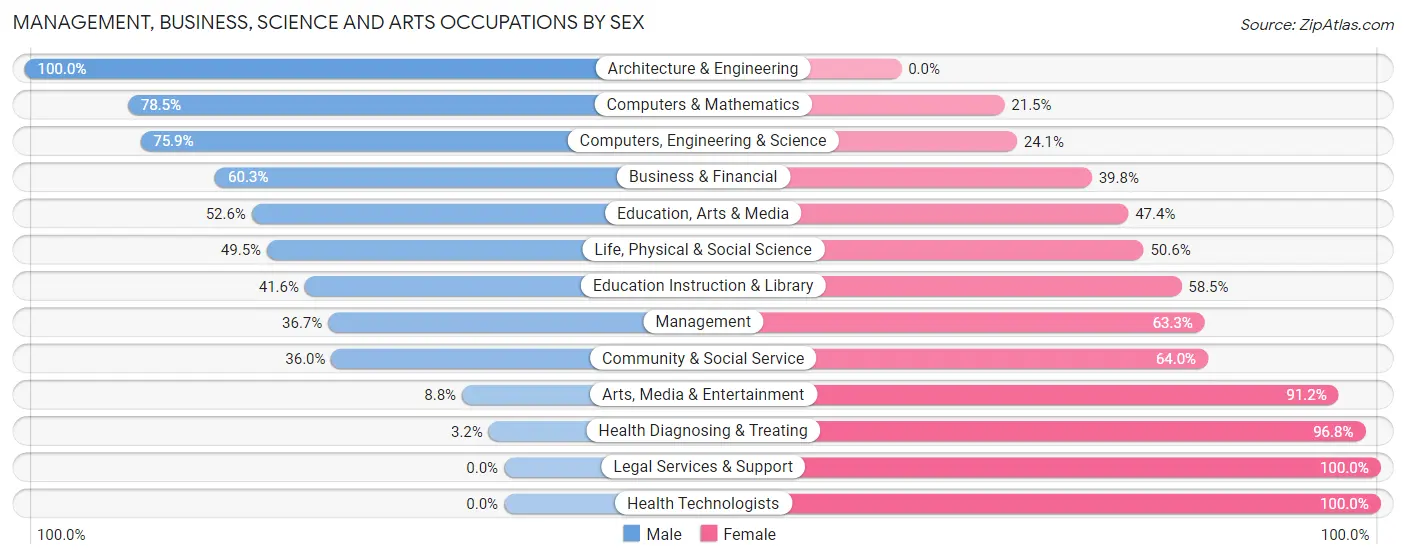
Management, Business, Science and Arts Occupations by Sex
Within the Management, Business, Science and Arts occupations in Elkton, the most male-oriented occupations are Architecture & Engineering (100.0%), Computers & Mathematics (78.5%), and Computers, Engineering & Science (75.9%), while the most female-oriented occupations are Legal Services & Support (100.0%), Health Technologists (100.0%), and Health Diagnosing & Treating (96.8%).
| Occupation | Male | Female |
| Management | 153 (36.7%) | 264 (63.3%) |
| Business & Financial | 341 (60.3%) | 225 (39.8%) |
| Computers, Engineering & Science | 330 (75.9%) | 105 (24.1%) |
| Computers & Mathematics | 215 (78.5%) | 59 (21.5%) |
| Architecture & Engineering | 70 (100.0%) | 0 (0.0%) |
| Life, Physical & Social Science | 45 (49.4%) | 46 (50.5%) |
| Community & Social Service | 274 (36.0%) | 487 (64.0%) |
| Education, Arts & Media | 50 (52.6%) | 45 (47.4%) |
| Legal Services & Support | 0 (0.0%) | 37 (100.0%) |
| Education Instruction & Library | 214 (41.5%) | 301 (58.5%) |
| Arts, Media & Entertainment | 10 (8.8%) | 104 (91.2%) |
| Health Diagnosing & Treating | 8 (3.2%) | 242 (96.8%) |
| Health Technologists | 0 (0.0%) | 90 (100.0%) |
| Total (Category) | 1,106 (45.5%) | 1,323 (54.5%) |
| Total (Overall) | 3,761 (51.9%) | 3,478 (48.0%) |
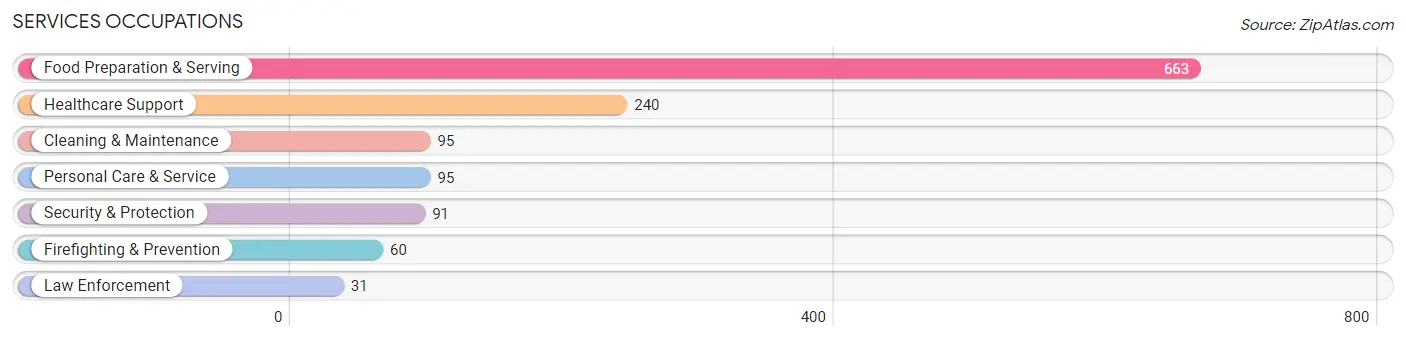
Services Occupations
The most common Services occupations in Elkton are Food Preparation & Serving (663 | 9.2%), Healthcare Support (240 | 3.3%), Cleaning & Maintenance (95 | 1.3%), Personal Care & Service (95 | 1.3%), and Security & Protection (91 | 1.3%).
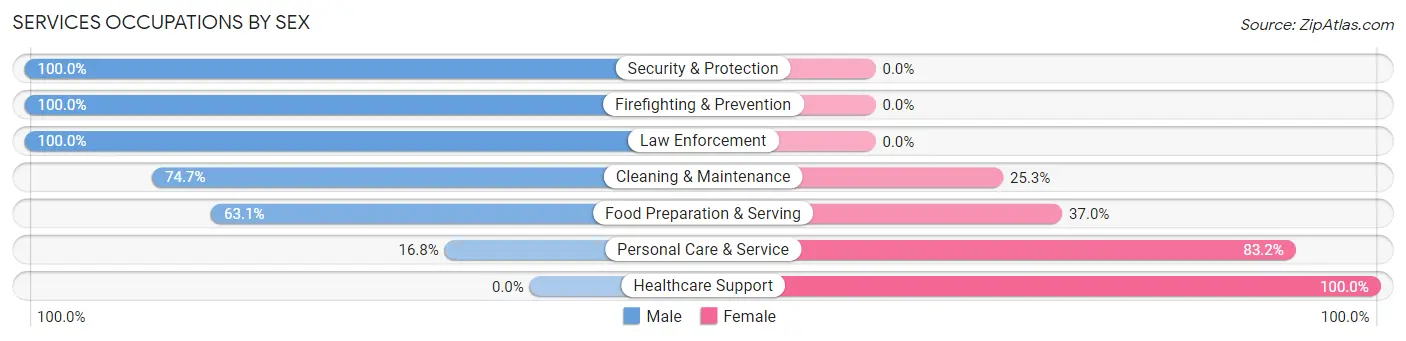
Services Occupations by Sex
Within the Services occupations in Elkton, the most male-oriented occupations are Security & Protection (100.0%), Firefighting & Prevention (100.0%), and Law Enforcement (100.0%), while the most female-oriented occupations are Healthcare Support (100.0%), Personal Care & Service (83.2%), and Food Preparation & Serving (36.9%).
| Occupation | Male | Female |
| Healthcare Support | 0 (0.0%) | 240 (100.0%) |
| Security & Protection | 91 (100.0%) | 0 (0.0%) |
| Firefighting & Prevention | 60 (100.0%) | 0 (0.0%) |
| Law Enforcement | 31 (100.0%) | 0 (0.0%) |
| Food Preparation & Serving | 418 (63.0%) | 245 (36.9%) |
| Cleaning & Maintenance | 71 (74.7%) | 24 (25.3%) |
| Personal Care & Service | 16 (16.8%) | 79 (83.2%) |
| Total (Category) | 596 (50.3%) | 588 (49.7%) |
| Total (Overall) | 3,761 (51.9%) | 3,478 (48.0%) |
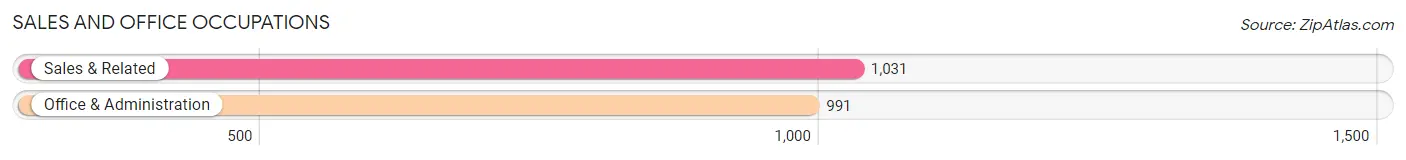
Sales and Office Occupations
The most common Sales and Office occupations in Elkton are Sales & Related (1,031 | 14.2%), and Office & Administration (991 | 13.7%).
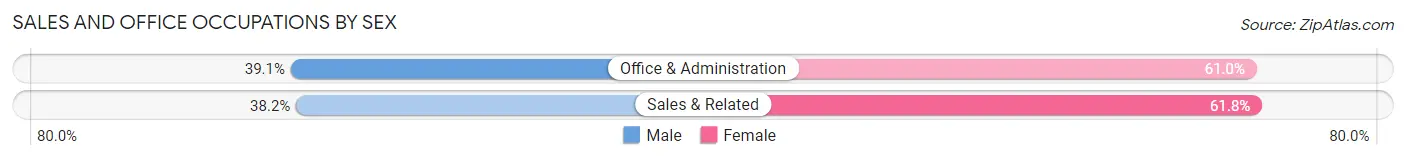
Sales and Office Occupations by Sex
| Occupation | Male | Female |
| Sales & Related | 394 (38.2%) | 637 (61.8%) |
| Office & Administration | 387 (39.1%) | 604 (61.0%) |
| Total (Category) | 781 (38.6%) | 1,241 (61.4%) |
| Total (Overall) | 3,761 (51.9%) | 3,478 (48.0%) |
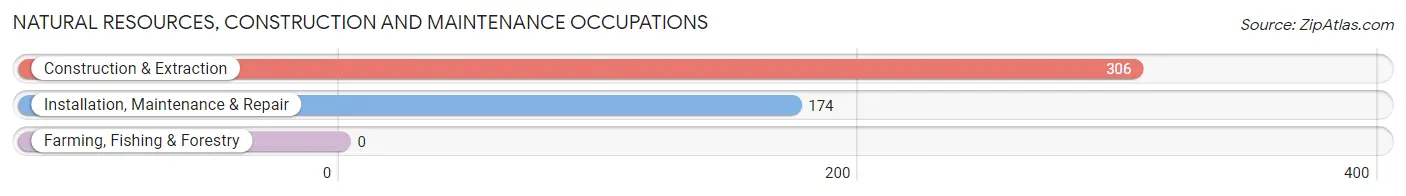
Natural Resources, Construction and Maintenance Occupations
The most common Natural Resources, Construction and Maintenance occupations in Elkton are Construction & Extraction (306 | 4.2%), and Installation, Maintenance & Repair (174 | 2.4%).
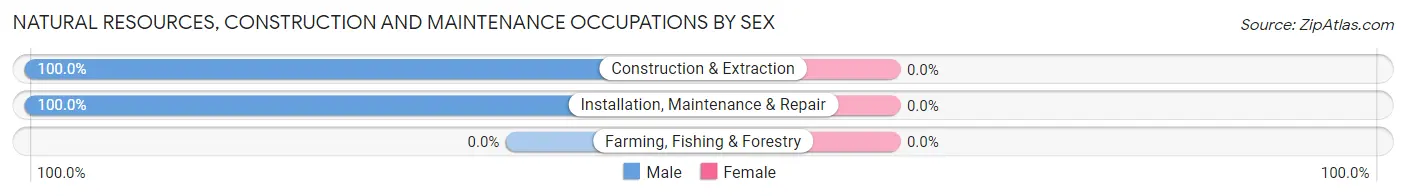
Natural Resources, Construction and Maintenance Occupations by Sex
| Occupation | Male | Female |
| Farming, Fishing & Forestry | 0 (0.0%) | 0 (0.0%) |
| Construction & Extraction | 306 (100.0%) | 0 (0.0%) |
| Installation, Maintenance & Repair | 174 (100.0%) | 0 (0.0%) |
| Total (Category) | 480 (100.0%) | 0 (0.0%) |
| Total (Overall) | 3,761 (51.9%) | 3,478 (48.0%) |
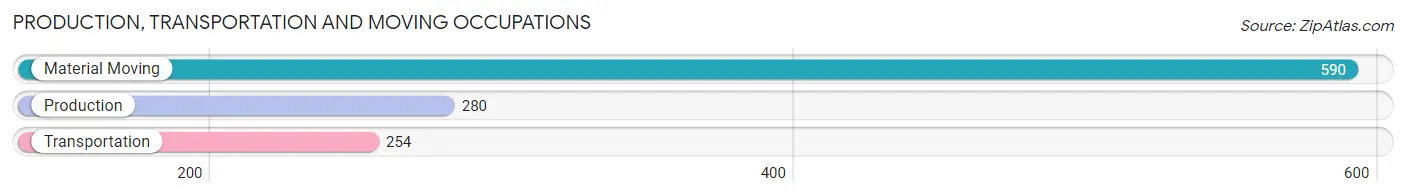
Production, Transportation and Moving Occupations
The most common Production, Transportation and Moving occupations in Elkton are Material Moving (590 | 8.2%), Production (280 | 3.9%), and Transportation (254 | 3.5%).
Production, Transportation and Moving Occupations by Sex
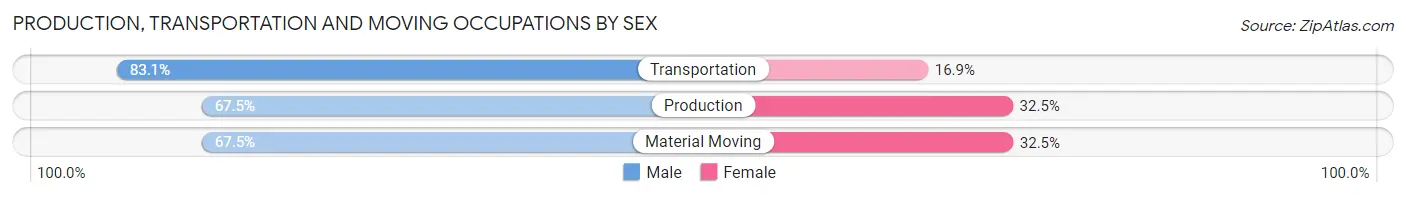
| Occupation | Male | Female |
| Production | 189 (67.5%) | 91 (32.5%) |
| Transportation | 211 (83.1%) | 43 (16.9%) |
| Material Moving | 398 (67.5%) | 192 (32.5%) |
| Total (Category) | 798 (71.0%) | 326 (29.0%) |
| Total (Overall) | 3,761 (51.9%) | 3,478 (48.0%) |
Employment Industries by Sex in Elkton
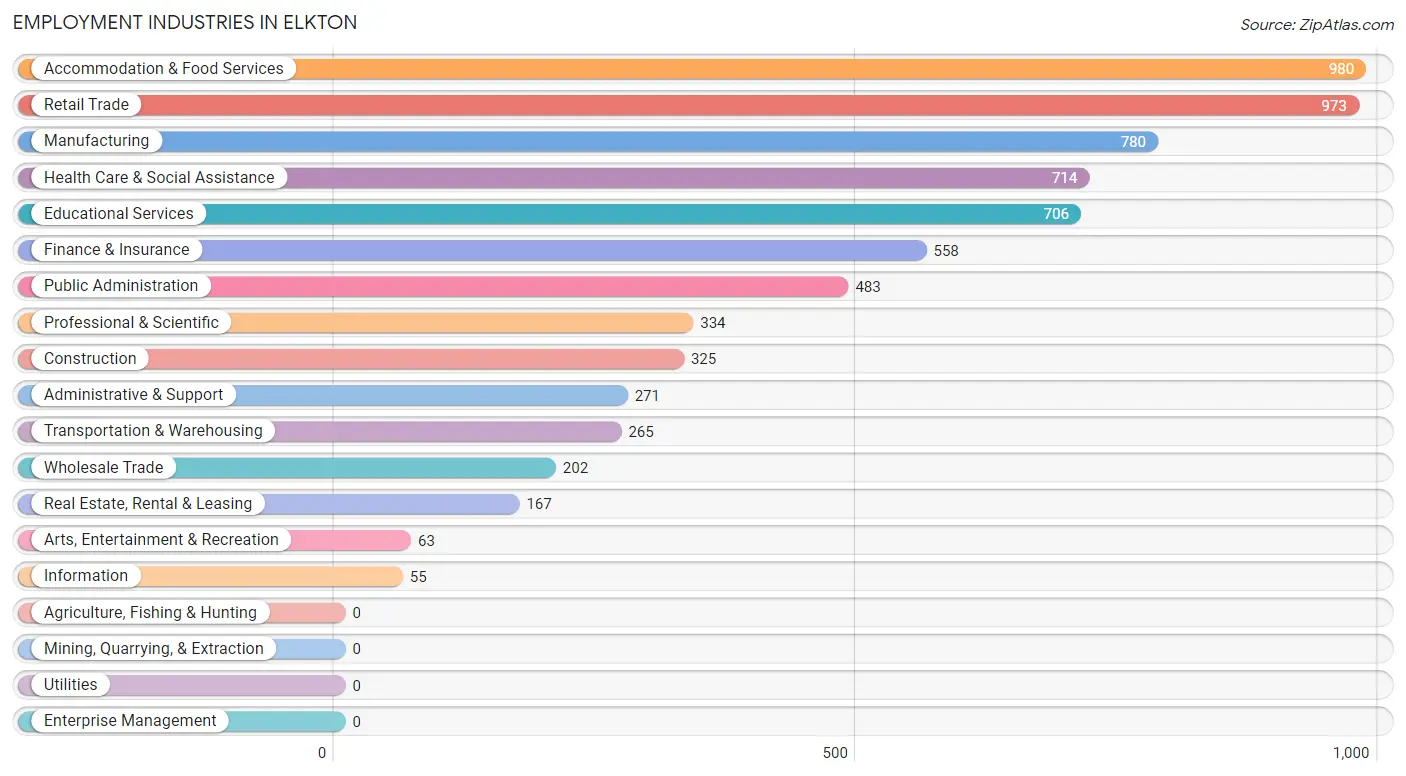
Employment Industries in Elkton
The major employment industries in Elkton include Accommodation & Food Services (980 | 13.5%), Retail Trade (973 | 13.4%), Manufacturing (780 | 10.8%), Health Care & Social Assistance (714 | 9.9%), and Educational Services (706 | 9.8%).
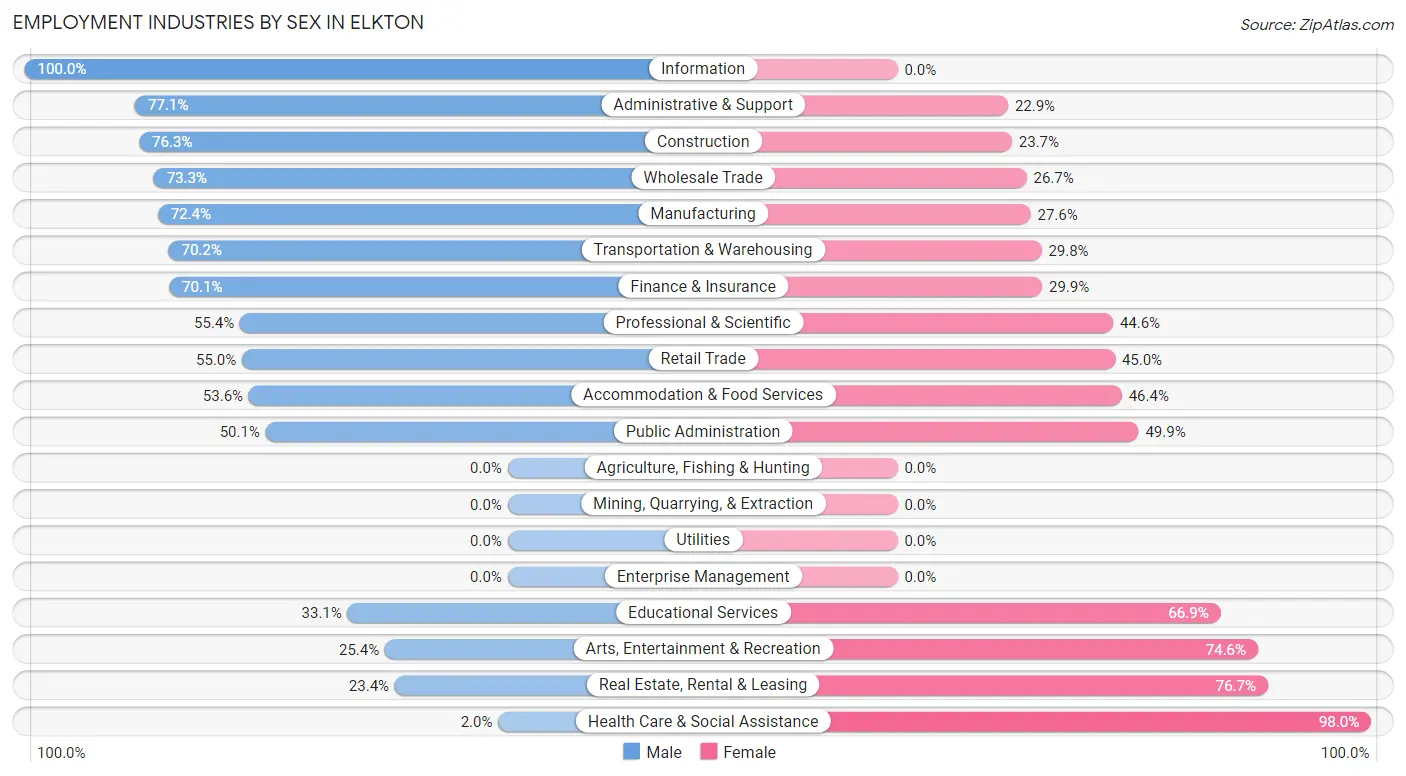
Employment Industries by Sex in Elkton
The Elkton industries that see more men than women are Information (100.0%), Administrative & Support (77.1%), and Construction (76.3%), whereas the industries that tend to have a higher number of women are Health Care & Social Assistance (98.0%), Real Estate, Rental & Leasing (76.6%), and Arts, Entertainment & Recreation (74.6%).
| Industry | Male | Female |
| Agriculture, Fishing & Hunting | 0 (0.0%) | 0 (0.0%) |
| Mining, Quarrying, & Extraction | 0 (0.0%) | 0 (0.0%) |
| Construction | 248 (76.3%) | 77 (23.7%) |
| Manufacturing | 565 (72.4%) | 215 (27.6%) |
| Wholesale Trade | 148 (73.3%) | 54 (26.7%) |
| Retail Trade | 535 (55.0%) | 438 (45.0%) |
| Transportation & Warehousing | 186 (70.2%) | 79 (29.8%) |
| Utilities | 0 (0.0%) | 0 (0.0%) |
| Information | 55 (100.0%) | 0 (0.0%) |
| Finance & Insurance | 391 (70.1%) | 167 (29.9%) |
| Real Estate, Rental & Leasing | 39 (23.4%) | 128 (76.6%) |
| Professional & Scientific | 185 (55.4%) | 149 (44.6%) |
| Enterprise Management | 0 (0.0%) | 0 (0.0%) |
| Administrative & Support | 209 (77.1%) | 62 (22.9%) |
| Educational Services | 234 (33.1%) | 472 (66.9%) |
| Health Care & Social Assistance | 14 (2.0%) | 700 (98.0%) |
| Arts, Entertainment & Recreation | 16 (25.4%) | 47 (74.6%) |
| Accommodation & Food Services | 525 (53.6%) | 455 (46.4%) |
| Public Administration | 242 (50.1%) | 241 (49.9%) |
| Total | 3,761 (51.9%) | 3,478 (48.0%) |
Education in Elkton
School Enrollment in Elkton
The most common levels of schooling among the 3,487 students in Elkton are high school (1,011 | 29.0%), elementary school (897 | 25.7%), and college / undergraduate (631 | 18.1%).
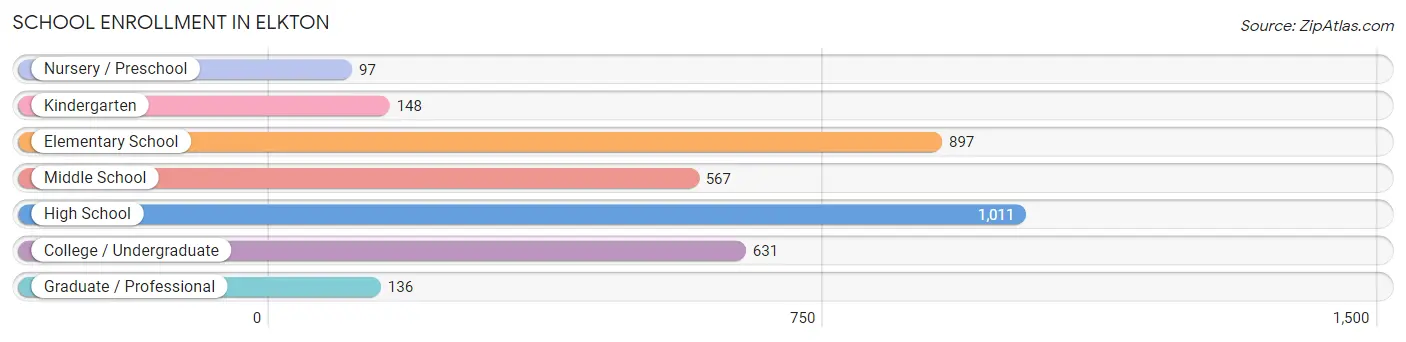
| School Level | # Students | % Students |
| Nursery / Preschool | 97 | 2.8% |
| Kindergarten | 148 | 4.2% |
| Elementary School | 897 | 25.7% |
| Middle School | 567 | 16.3% |
| High School | 1,011 | 29.0% |
| College / Undergraduate | 631 | 18.1% |
| Graduate / Professional | 136 | 3.9% |
| Total | 3,487 | 100.0% |
School Enrollment by Age by Funding Source in Elkton
Out of a total of 3,487 students who are enrolled in schools in Elkton, 418 (12.0%) attend a private institution, while the remaining 3,069 (88.0%) are enrolled in public schools. The age group of 15 to 17 year olds has the highest likelihood of being enrolled in private schools, with 140 (20.6% in the age bracket) enrolled. Conversely, the age group of 20 to 24 year olds has the lowest likelihood of being enrolled in a private school, with 351 (99.7% in the age bracket) attending a public institution.
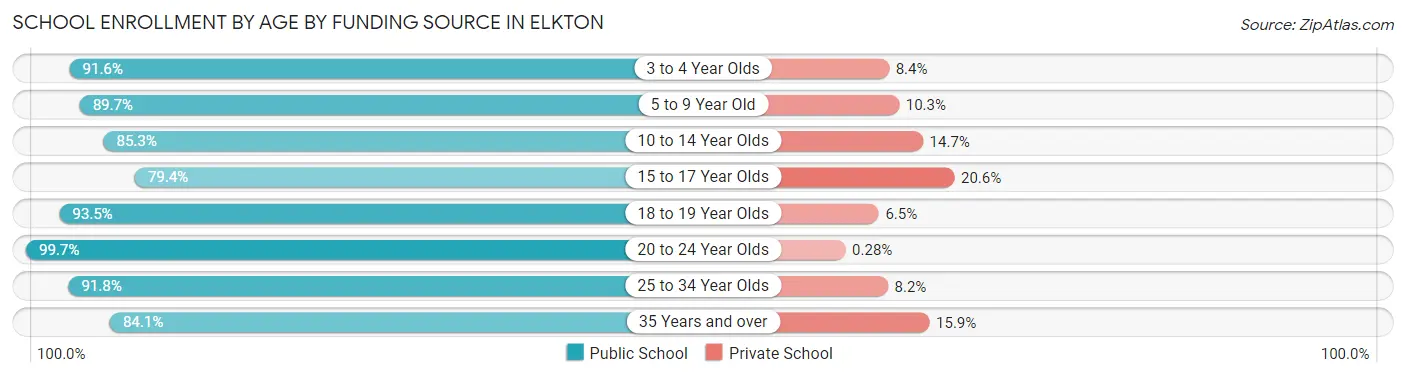
| Age Bracket | Public School | Private School |
| 3 to 4 Year Olds | 131 (91.6%) | 12 (8.4%) |
| 5 to 9 Year Old | 830 (89.7%) | 95 (10.3%) |
| 10 to 14 Year Olds | 696 (85.3%) | 120 (14.7%) |
| 15 to 17 Year Olds | 541 (79.4%) | 140 (20.6%) |
| 18 to 19 Year Olds | 245 (93.5%) | 17 (6.5%) |
| 20 to 24 Year Olds | 351 (99.7%) | 1 (0.3%) |
| 25 to 34 Year Olds | 202 (91.8%) | 18 (8.2%) |
| 35 Years and over | 74 (84.1%) | 14 (15.9%) |
| Total | 3,069 (88.0%) | 418 (12.0%) |
Educational Attainment by Field of Study in Elkton
Business (542 | 24.8%), education (309 | 14.2%), social sciences (188 | 8.6%), bio, nature & agricultural (187 | 8.6%), and computers & mathematics (183 | 8.4%) are the most common fields of study among 2,181 individuals in Elkton who have obtained a bachelor's degree or higher.
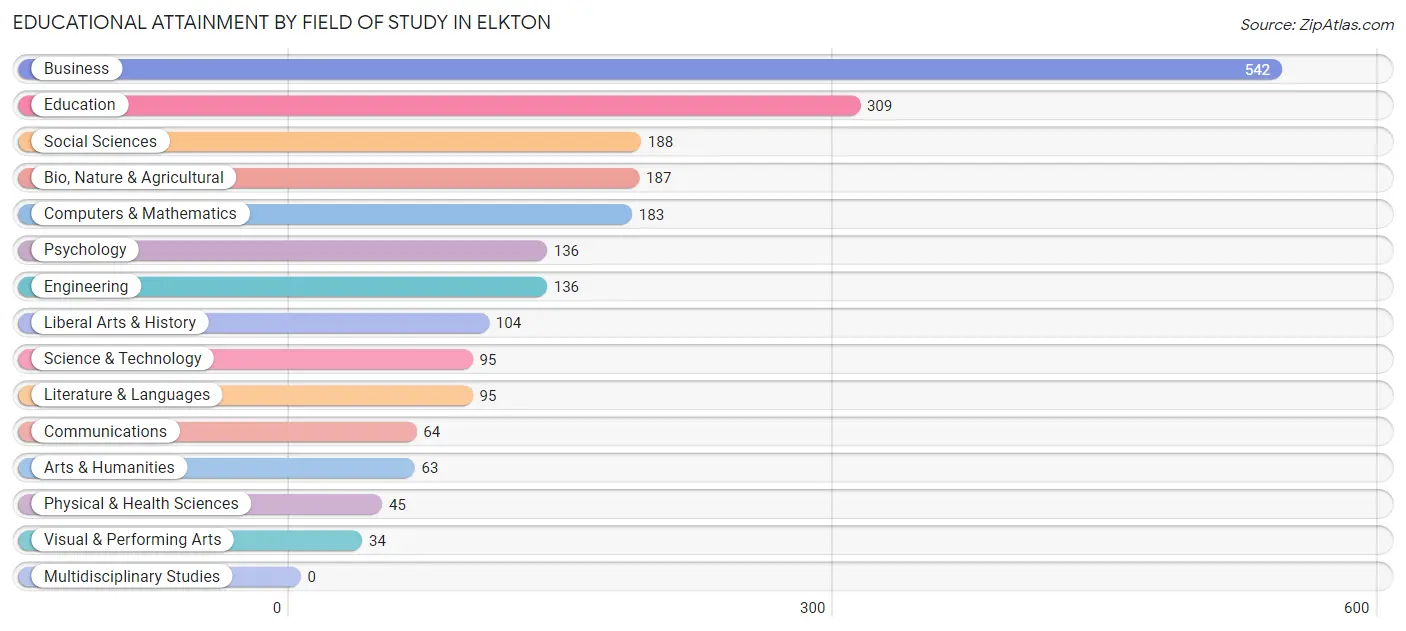
| Field of Study | # Graduates | % Graduates |
| Computers & Mathematics | 183 | 8.4% |
| Bio, Nature & Agricultural | 187 | 8.6% |
| Physical & Health Sciences | 45 | 2.1% |
| Psychology | 136 | 6.2% |
| Social Sciences | 188 | 8.6% |
| Engineering | 136 | 6.2% |
| Multidisciplinary Studies | 0 | 0.0% |
| Science & Technology | 95 | 4.4% |
| Business | 542 | 24.8% |
| Education | 309 | 14.2% |
| Literature & Languages | 95 | 4.4% |
| Liberal Arts & History | 104 | 4.8% |
| Visual & Performing Arts | 34 | 1.6% |
| Communications | 64 | 2.9% |
| Arts & Humanities | 63 | 2.9% |
| Total | 2,181 | 100.0% |
Transportation & Commute in Elkton
Vehicle Availability by Sex in Elkton
The most prevalent vehicle ownership categories in Elkton are males with 2 vehicles (1,736, accounting for 46.6%) and females with 2 vehicles (1,268, making up 52.2%).
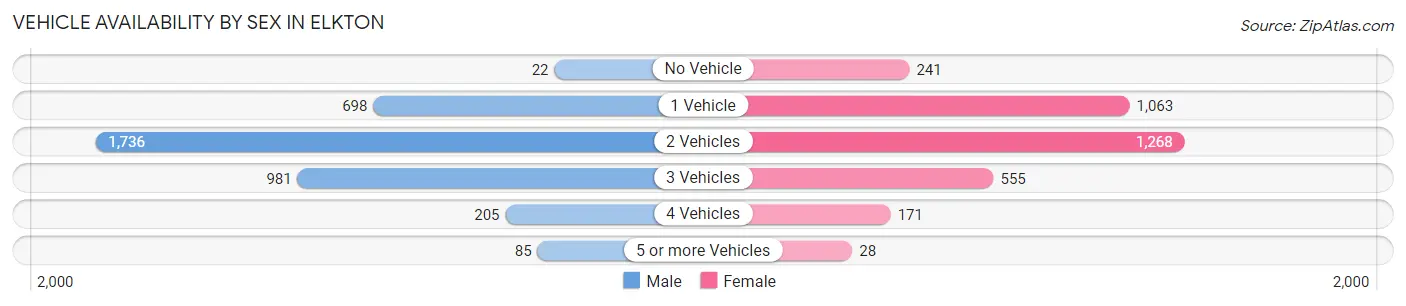
| Vehicles Available | Male | Female |
| No Vehicle | 22 (0.6%) | 241 (7.2%) |
| 1 Vehicle | 698 (18.7%) | 1,063 (32.0%) |
| 2 Vehicles | 1,736 (46.6%) | 1,268 (38.1%) |
| 3 Vehicles | 981 (26.3%) | 555 (16.7%) |
| 4 Vehicles | 205 (5.5%) | 171 (5.1%) |
| 5 or more Vehicles | 85 (2.3%) | 28 (0.8%) |
| Total | 3,727 (100.0%) | 3,326 (100.0%) |
Commute Time in Elkton
The most frequently occuring commute durations in Elkton are 10 to 14 minutes (1,201 commuters, 18.2%), 15 to 19 minutes (900 commuters, 13.7%), and 30 to 34 minutes (884 commuters, 13.4%).
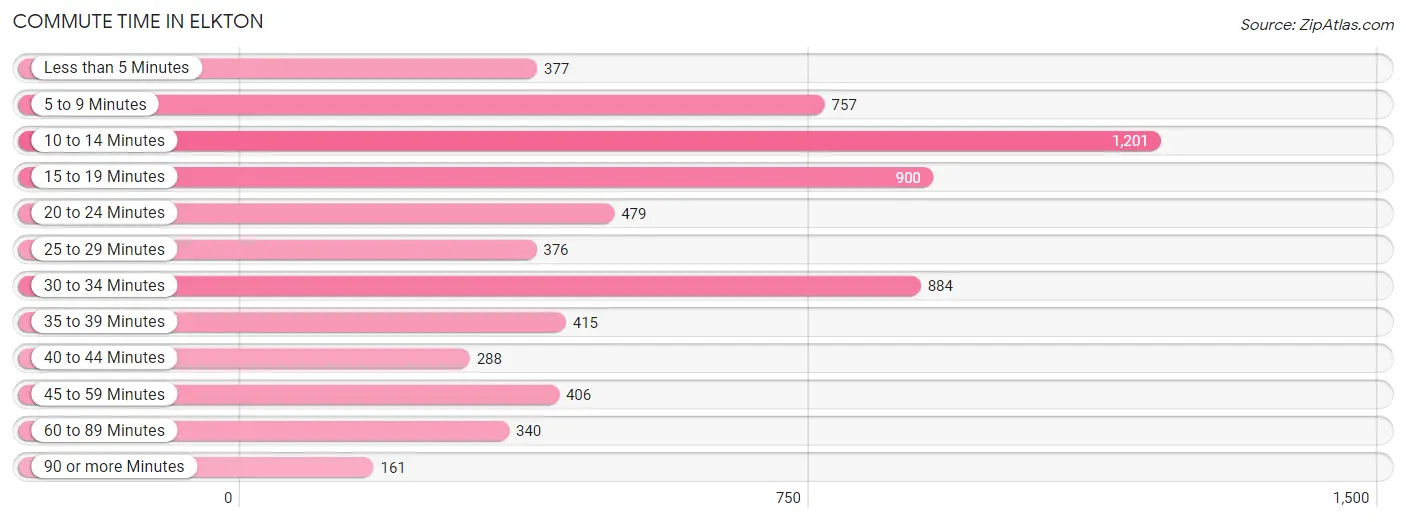
| Commute Time | # Commuters | % Commuters |
| Less than 5 Minutes | 377 | 5.7% |
| 5 to 9 Minutes | 757 | 11.5% |
| 10 to 14 Minutes | 1,201 | 18.2% |
| 15 to 19 Minutes | 900 | 13.7% |
| 20 to 24 Minutes | 479 | 7.3% |
| 25 to 29 Minutes | 376 | 5.7% |
| 30 to 34 Minutes | 884 | 13.4% |
| 35 to 39 Minutes | 415 | 6.3% |
| 40 to 44 Minutes | 288 | 4.4% |
| 45 to 59 Minutes | 406 | 6.2% |
| 60 to 89 Minutes | 340 | 5.2% |
| 90 or more Minutes | 161 | 2.5% |
Commute Time by Sex in Elkton
The most common commute times in Elkton are 10 to 14 minutes (598 commuters, 17.4%) for males and 10 to 14 minutes (603 commuters, 19.2%) for females.
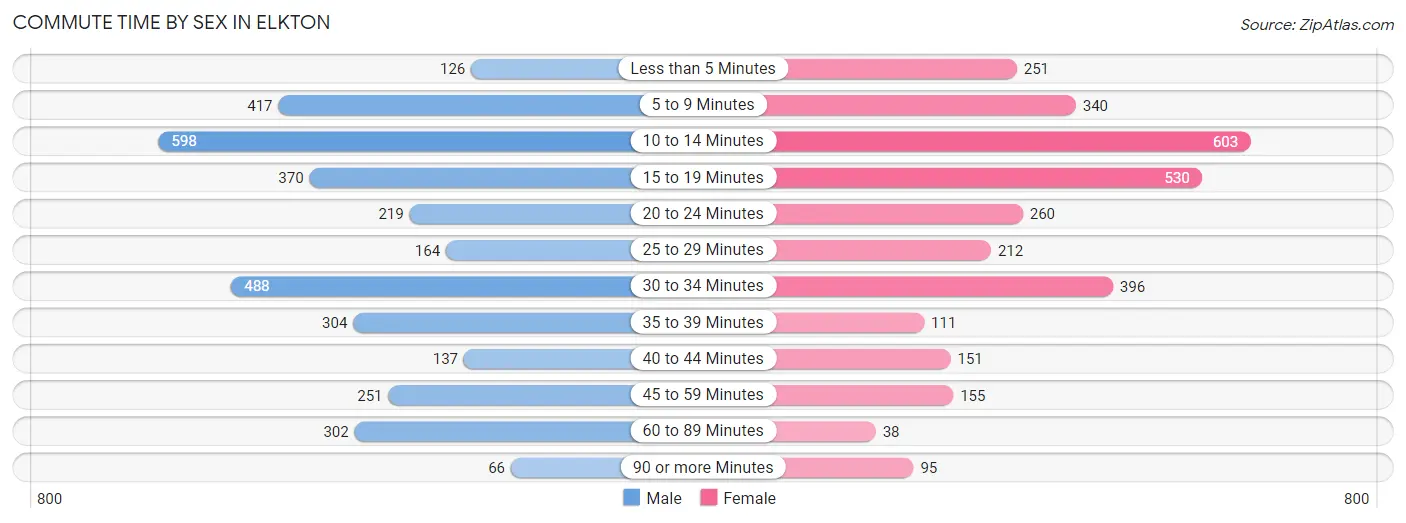
| Commute Time | Male | Female |
| Less than 5 Minutes | 126 (3.7%) | 251 (8.0%) |
| 5 to 9 Minutes | 417 (12.1%) | 340 (10.8%) |
| 10 to 14 Minutes | 598 (17.4%) | 603 (19.2%) |
| 15 to 19 Minutes | 370 (10.7%) | 530 (16.9%) |
| 20 to 24 Minutes | 219 (6.4%) | 260 (8.3%) |
| 25 to 29 Minutes | 164 (4.8%) | 212 (6.8%) |
| 30 to 34 Minutes | 488 (14.2%) | 396 (12.6%) |
| 35 to 39 Minutes | 304 (8.8%) | 111 (3.5%) |
| 40 to 44 Minutes | 137 (4.0%) | 151 (4.8%) |
| 45 to 59 Minutes | 251 (7.3%) | 155 (4.9%) |
| 60 to 89 Minutes | 302 (8.8%) | 38 (1.2%) |
| 90 or more Minutes | 66 (1.9%) | 95 (3.0%) |
Time of Departure to Work by Sex in Elkton
The most frequent times of departure to work in Elkton are 7:00 AM to 7:29 AM (439, 12.8%) for males and 8:00 AM to 8:29 AM (494, 15.7%) for females.
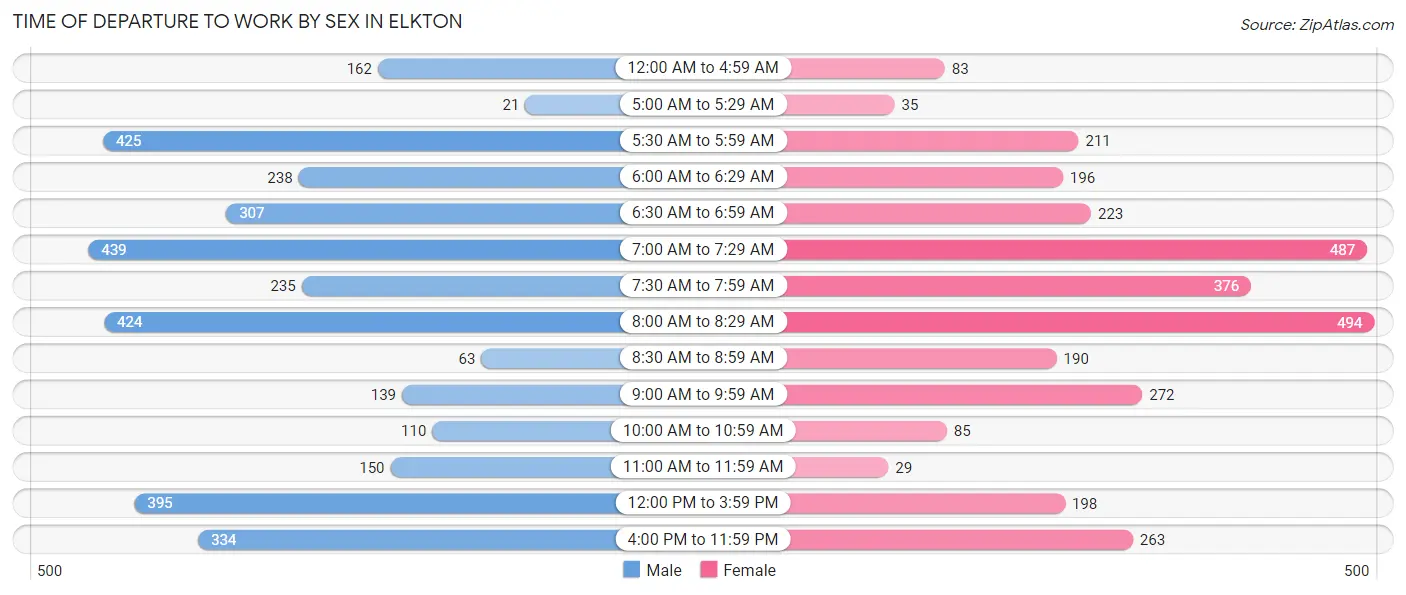
| Time of Departure | Male | Female |
| 12:00 AM to 4:59 AM | 162 (4.7%) | 83 (2.6%) |
| 5:00 AM to 5:29 AM | 21 (0.6%) | 35 (1.1%) |
| 5:30 AM to 5:59 AM | 425 (12.3%) | 211 (6.7%) |
| 6:00 AM to 6:29 AM | 238 (6.9%) | 196 (6.2%) |
| 6:30 AM to 6:59 AM | 307 (8.9%) | 223 (7.1%) |
| 7:00 AM to 7:29 AM | 439 (12.8%) | 487 (15.5%) |
| 7:30 AM to 7:59 AM | 235 (6.8%) | 376 (12.0%) |
| 8:00 AM to 8:29 AM | 424 (12.3%) | 494 (15.7%) |
| 8:30 AM to 8:59 AM | 63 (1.8%) | 190 (6.0%) |
| 9:00 AM to 9:59 AM | 139 (4.0%) | 272 (8.7%) |
| 10:00 AM to 10:59 AM | 110 (3.2%) | 85 (2.7%) |
| 11:00 AM to 11:59 AM | 150 (4.4%) | 29 (0.9%) |
| 12:00 PM to 3:59 PM | 395 (11.5%) | 198 (6.3%) |
| 4:00 PM to 11:59 PM | 334 (9.7%) | 263 (8.4%) |
| Total | 3,442 (100.0%) | 3,142 (100.0%) |
Housing Occupancy in Elkton
Occupancy by Ownership in Elkton
Of the total 6,136 dwellings in Elkton, owner-occupied units account for 2,958 (48.2%), while renter-occupied units make up 3,178 (51.8%).
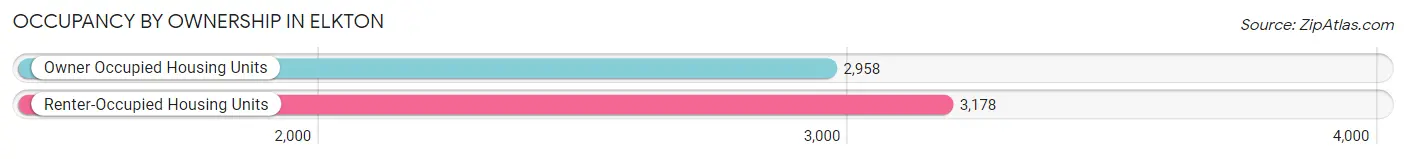
| Occupancy | # Housing Units | % Housing Units |
| Owner Occupied Housing Units | 2,958 | 48.2% |
| Renter-Occupied Housing Units | 3,178 | 51.8% |
| Total Occupied Housing Units | 6,136 | 100.0% |
Occupancy by Household Size in Elkton
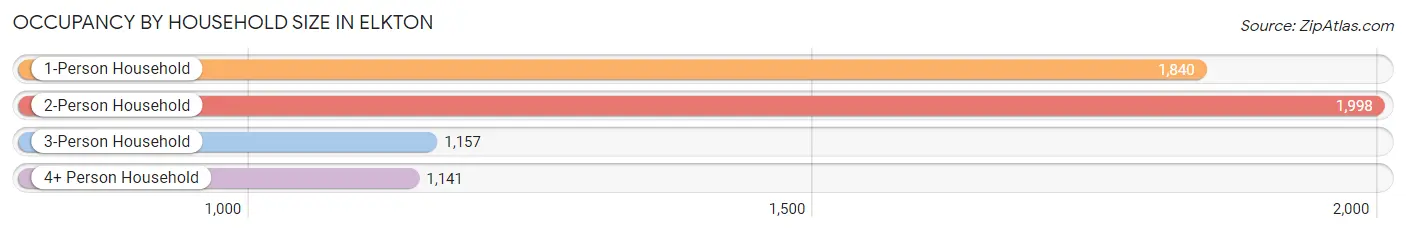
| Household Size | # Housing Units | % Housing Units |
| 1-Person Household | 1,840 | 30.0% |
| 2-Person Household | 1,998 | 32.6% |
| 3-Person Household | 1,157 | 18.9% |
| 4+ Person Household | 1,141 | 18.6% |
| Total Housing Units | 6,136 | 100.0% |
Occupancy by Ownership by Household Size in Elkton
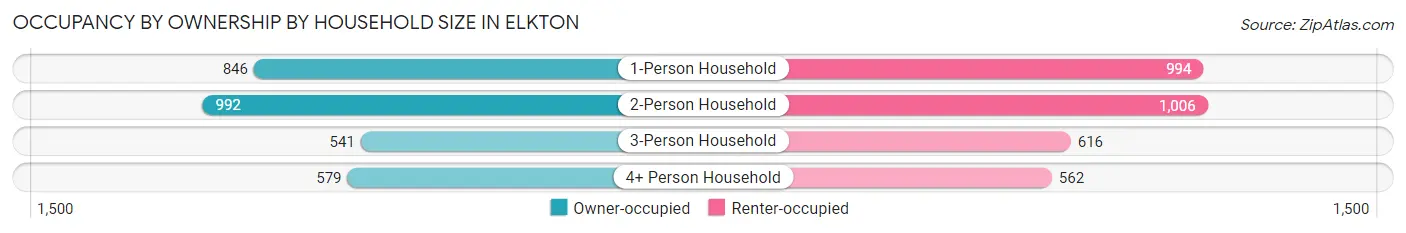
| Household Size | Owner-occupied | Renter-occupied |
| 1-Person Household | 846 (46.0%) | 994 (54.0%) |
| 2-Person Household | 992 (49.6%) | 1,006 (50.3%) |
| 3-Person Household | 541 (46.8%) | 616 (53.2%) |
| 4+ Person Household | 579 (50.7%) | 562 (49.3%) |
| Total Housing Units | 2,958 (48.2%) | 3,178 (51.8%) |
Occupancy by Educational Attainment in Elkton
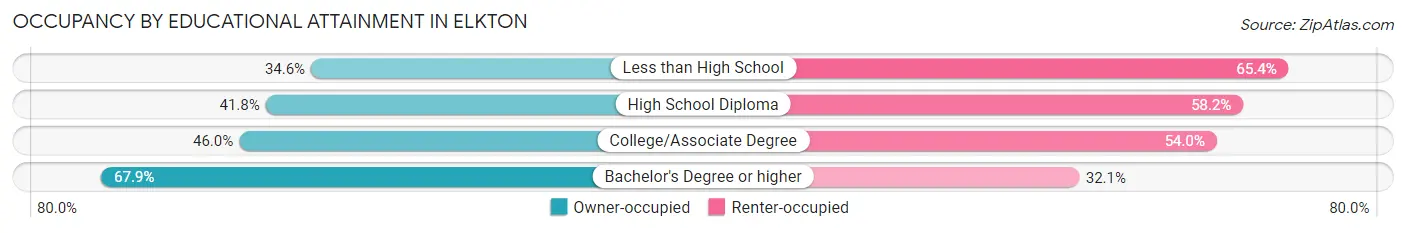
| Household Size | Owner-occupied | Renter-occupied |
| Less than High School | 222 (34.6%) | 420 (65.4%) |
| High School Diploma | 952 (41.8%) | 1,326 (58.2%) |
| College/Associate Degree | 838 (46.0%) | 984 (54.0%) |
| Bachelor's Degree or higher | 946 (67.9%) | 448 (32.1%) |
Occupancy by Age of Householder in Elkton
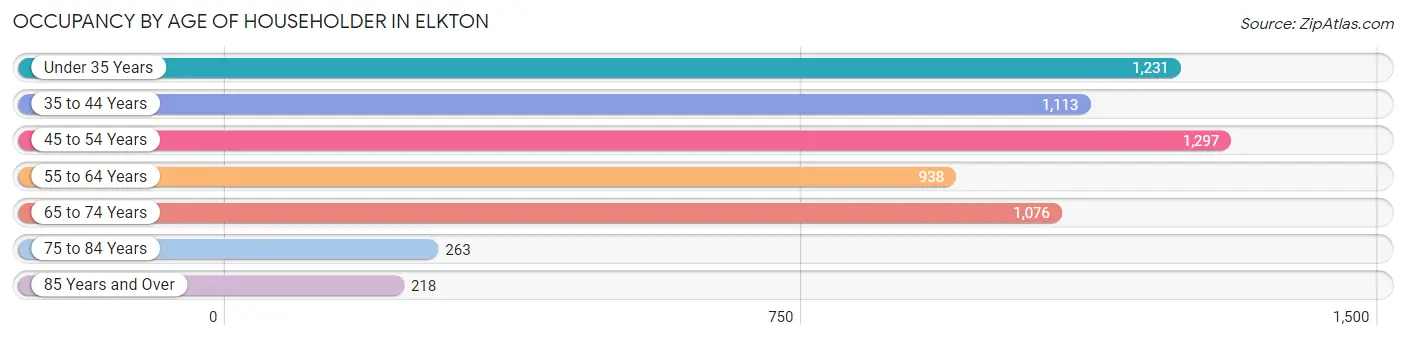
| Age Bracket | # Households | % Households |
| Under 35 Years | 1,231 | 20.1% |
| 35 to 44 Years | 1,113 | 18.1% |
| 45 to 54 Years | 1,297 | 21.1% |
| 55 to 64 Years | 938 | 15.3% |
| 65 to 74 Years | 1,076 | 17.5% |
| 75 to 84 Years | 263 | 4.3% |
| 85 Years and Over | 218 | 3.5% |
| Total | 6,136 | 100.0% |
Housing Finances in Elkton
Median Income by Occupancy in Elkton
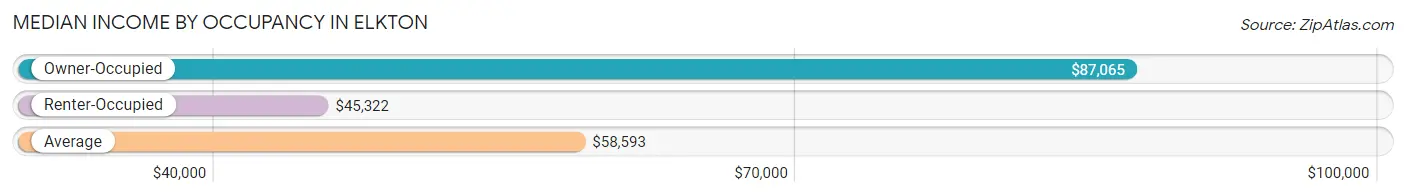
| Occupancy Type | # Households | Median Income |
| Owner-Occupied | 2,958 (48.2%) | $87,065 |
| Renter-Occupied | 3,178 (51.8%) | $45,322 |
| Average | 6,136 (100.0%) | $58,593 |
Occupancy by Householder Income Bracket in Elkton
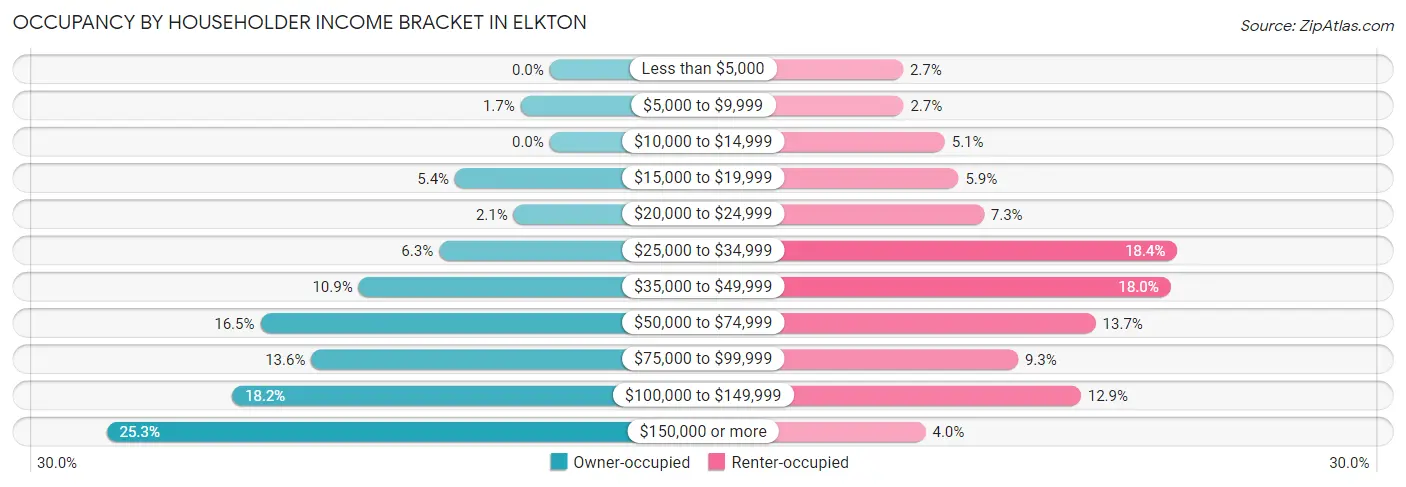
| Income Bracket | Owner-occupied | Renter-occupied |
| Less than $5,000 | 0 (0.0%) | 86 (2.7%) |
| $5,000 to $9,999 | 49 (1.7%) | 87 (2.7%) |
| $10,000 to $14,999 | 0 (0.0%) | 162 (5.1%) |
| $15,000 to $19,999 | 160 (5.4%) | 187 (5.9%) |
| $20,000 to $24,999 | 61 (2.1%) | 233 (7.3%) |
| $25,000 to $34,999 | 187 (6.3%) | 584 (18.4%) |
| $35,000 to $49,999 | 323 (10.9%) | 572 (18.0%) |
| $50,000 to $74,999 | 489 (16.5%) | 436 (13.7%) |
| $75,000 to $99,999 | 403 (13.6%) | 295 (9.3%) |
| $100,000 to $149,999 | 537 (18.1%) | 409 (12.9%) |
| $150,000 or more | 749 (25.3%) | 127 (4.0%) |
| Total | 2,958 (100.0%) | 3,178 (100.0%) |
Monthly Housing Cost Tiers in Elkton
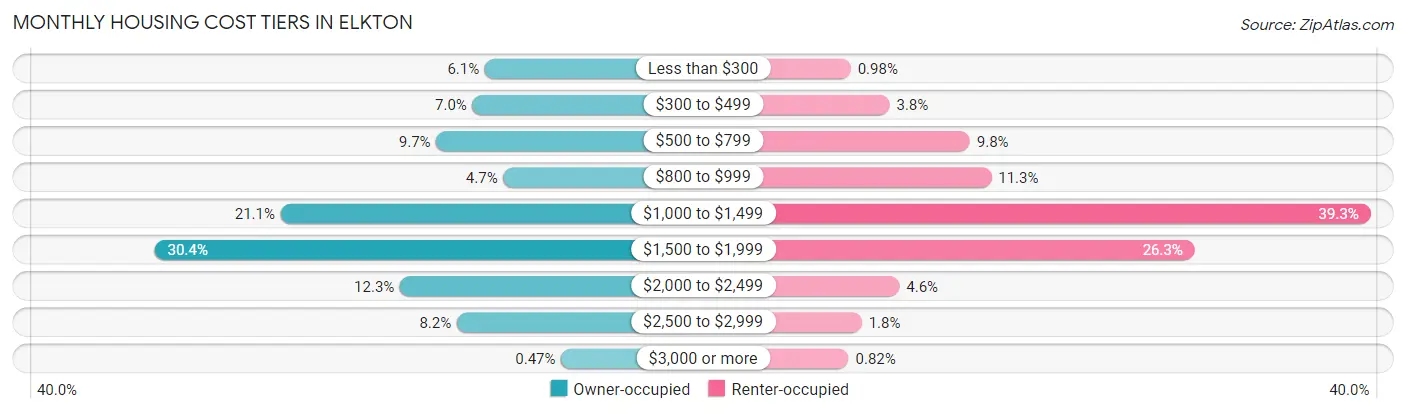
| Monthly Cost | Owner-occupied | Renter-occupied |
| Less than $300 | 180 (6.1%) | 31 (1.0%) |
| $300 to $499 | 207 (7.0%) | 122 (3.8%) |
| $500 to $799 | 286 (9.7%) | 310 (9.8%) |
| $800 to $999 | 140 (4.7%) | 360 (11.3%) |
| $1,000 to $1,499 | 625 (21.1%) | 1,248 (39.3%) |
| $1,500 to $1,999 | 900 (30.4%) | 836 (26.3%) |
| $2,000 to $2,499 | 365 (12.3%) | 145 (4.6%) |
| $2,500 to $2,999 | 241 (8.2%) | 57 (1.8%) |
| $3,000 or more | 14 (0.5%) | 26 (0.8%) |
| Total | 2,958 (100.0%) | 3,178 (100.0%) |
Physical Housing Characteristics in Elkton
Housing Structures in Elkton
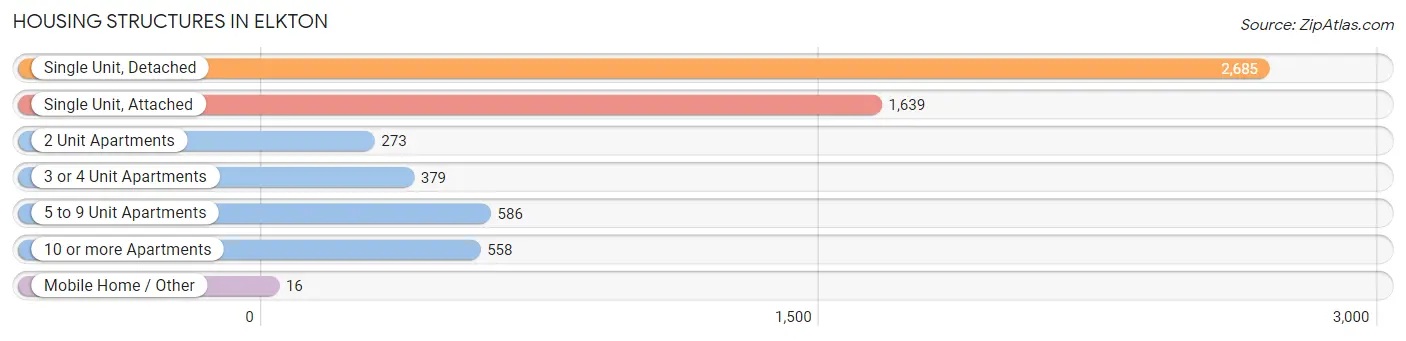
| Structure Type | # Housing Units | % Housing Units |
| Single Unit, Detached | 2,685 | 43.8% |
| Single Unit, Attached | 1,639 | 26.7% |
| 2 Unit Apartments | 273 | 4.4% |
| 3 or 4 Unit Apartments | 379 | 6.2% |
| 5 to 9 Unit Apartments | 586 | 9.6% |
| 10 or more Apartments | 558 | 9.1% |
| Mobile Home / Other | 16 | 0.3% |
| Total | 6,136 | 100.0% |
Housing Structures by Occupancy in Elkton
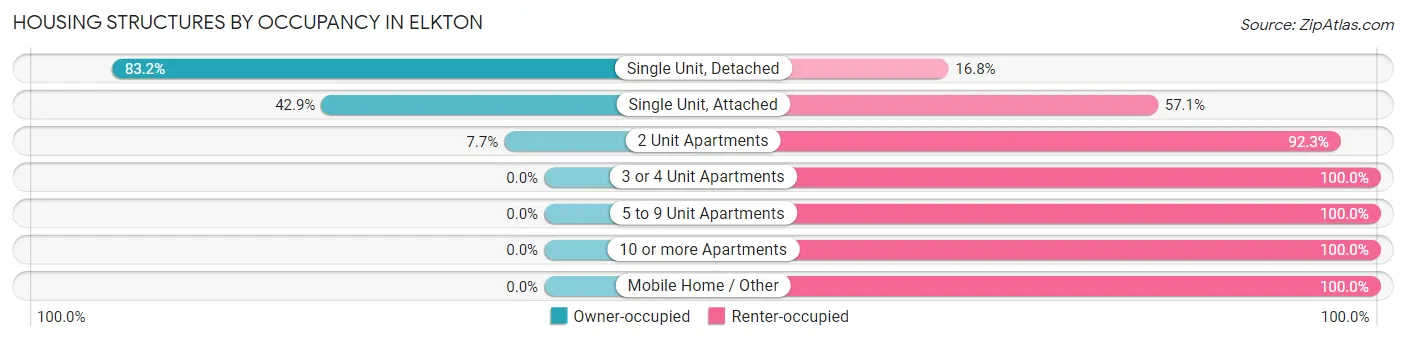
| Structure Type | Owner-occupied | Renter-occupied |
| Single Unit, Detached | 2,234 (83.2%) | 451 (16.8%) |
| Single Unit, Attached | 703 (42.9%) | 936 (57.1%) |
| 2 Unit Apartments | 21 (7.7%) | 252 (92.3%) |
| 3 or 4 Unit Apartments | 0 (0.0%) | 379 (100.0%) |
| 5 to 9 Unit Apartments | 0 (0.0%) | 586 (100.0%) |
| 10 or more Apartments | 0 (0.0%) | 558 (100.0%) |
| Mobile Home / Other | 0 (0.0%) | 16 (100.0%) |
| Total | 2,958 (48.2%) | 3,178 (51.8%) |
Housing Structures by Number of Rooms in Elkton
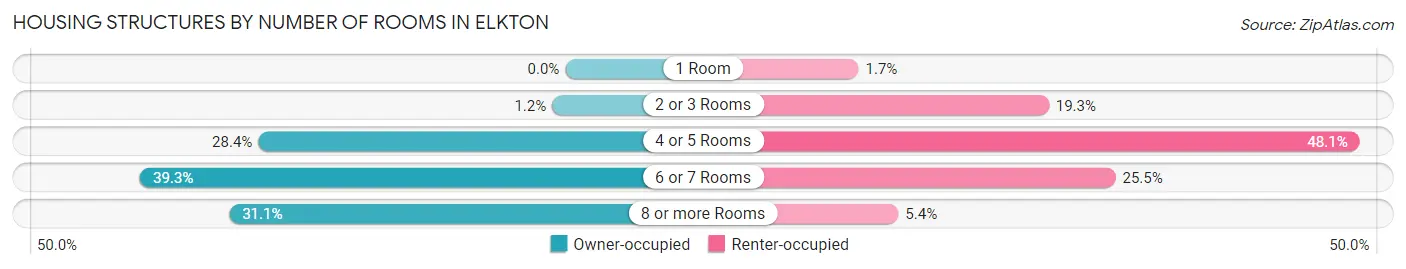
| Number of Rooms | Owner-occupied | Renter-occupied |
| 1 Room | 0 (0.0%) | 55 (1.7%) |
| 2 or 3 Rooms | 36 (1.2%) | 614 (19.3%) |
| 4 or 5 Rooms | 840 (28.4%) | 1,527 (48.0%) |
| 6 or 7 Rooms | 1,163 (39.3%) | 810 (25.5%) |
| 8 or more Rooms | 919 (31.1%) | 172 (5.4%) |
| Total | 2,958 (100.0%) | 3,178 (100.0%) |
Housing Structure by Heating Type in Elkton
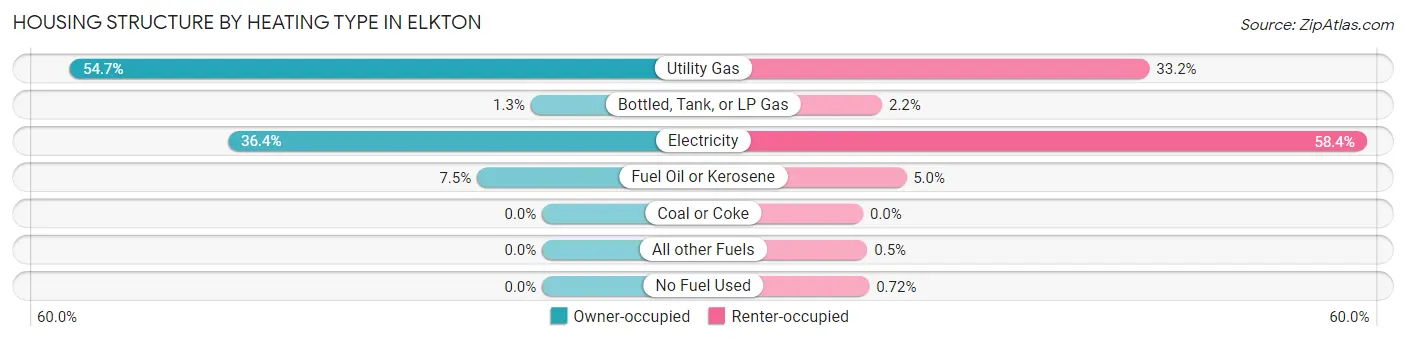
| Heating Type | Owner-occupied | Renter-occupied |
| Utility Gas | 1,619 (54.7%) | 1,055 (33.2%) |
| Bottled, Tank, or LP Gas | 39 (1.3%) | 70 (2.2%) |
| Electricity | 1,077 (36.4%) | 1,855 (58.4%) |
| Fuel Oil or Kerosene | 223 (7.5%) | 159 (5.0%) |
| Coal or Coke | 0 (0.0%) | 0 (0.0%) |
| All other Fuels | 0 (0.0%) | 16 (0.5%) |
| No Fuel Used | 0 (0.0%) | 23 (0.7%) |
| Total | 2,958 (100.0%) | 3,178 (100.0%) |
Household Vehicle Usage in Elkton
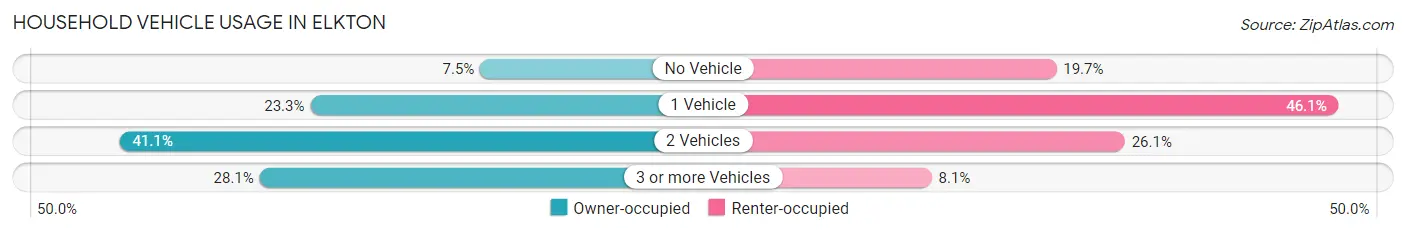
| Vehicles per Household | Owner-occupied | Renter-occupied |
| No Vehicle | 221 (7.5%) | 627 (19.7%) |
| 1 Vehicle | 690 (23.3%) | 1,464 (46.1%) |
| 2 Vehicles | 1,217 (41.1%) | 830 (26.1%) |
| 3 or more Vehicles | 830 (28.1%) | 257 (8.1%) |
| Total | 2,958 (100.0%) | 3,178 (100.0%) |
Real Estate & Mortgages in Elkton
Real Estate and Mortgage Overview in Elkton
| Characteristic | Without Mortgage | With Mortgage |
| Housing Units | 659 | 2,299 |
| Median Property Value | $235,400 | $231,600 |
| Median Household Income | $47,270 | $665 |
| Monthly Housing Costs | $508 | $14 |
| Real Estate Taxes | $2,595 | $58 |
Property Value by Mortgage Status in Elkton
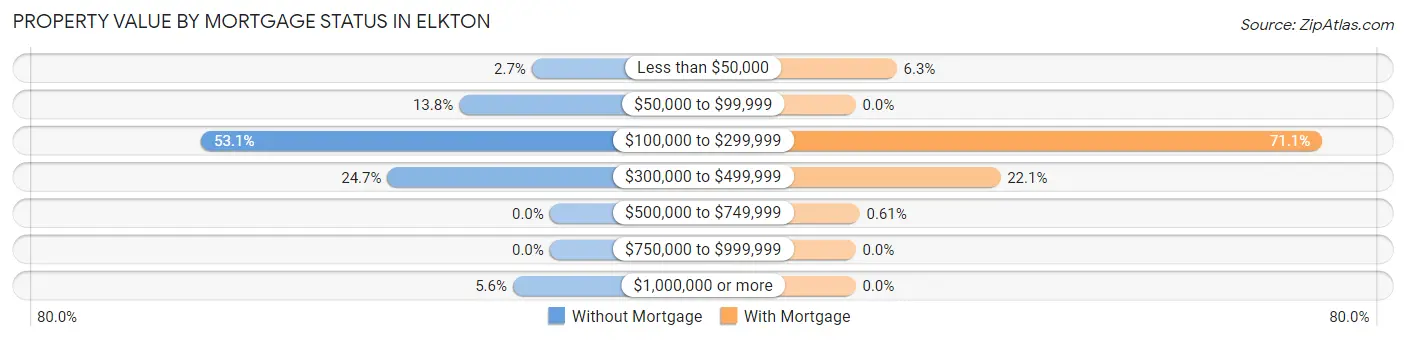
| Property Value | Without Mortgage | With Mortgage |
| Less than $50,000 | 18 (2.7%) | 144 (6.3%) |
| $50,000 to $99,999 | 91 (13.8%) | 0 (0.0%) |
| $100,000 to $299,999 | 350 (53.1%) | 1,634 (71.1%) |
| $300,000 to $499,999 | 163 (24.7%) | 507 (22.1%) |
| $500,000 to $749,999 | 0 (0.0%) | 14 (0.6%) |
| $750,000 to $999,999 | 0 (0.0%) | 0 (0.0%) |
| $1,000,000 or more | 37 (5.6%) | 0 (0.0%) |
| Total | 659 (100.0%) | 2,299 (100.0%) |
Household Income by Mortgage Status in Elkton
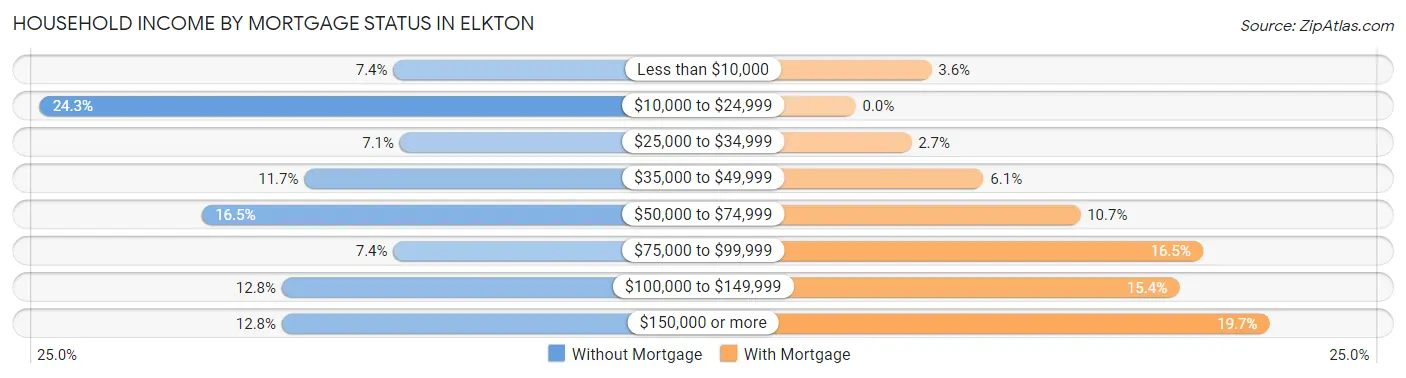
| Household Income | Without Mortgage | With Mortgage |
| Less than $10,000 | 49 (7.4%) | 83 (3.6%) |
| $10,000 to $24,999 | 160 (24.3%) | 0 (0.0%) |
| $25,000 to $34,999 | 47 (7.1%) | 61 (2.6%) |
| $35,000 to $49,999 | 77 (11.7%) | 140 (6.1%) |
| $50,000 to $74,999 | 109 (16.5%) | 246 (10.7%) |
| $75,000 to $99,999 | 49 (7.4%) | 380 (16.5%) |
| $100,000 to $149,999 | 84 (12.8%) | 354 (15.4%) |
| $150,000 or more | 84 (12.8%) | 453 (19.7%) |
| Total | 659 (100.0%) | 2,299 (100.0%) |
Property Value to Household Income Ratio in Elkton
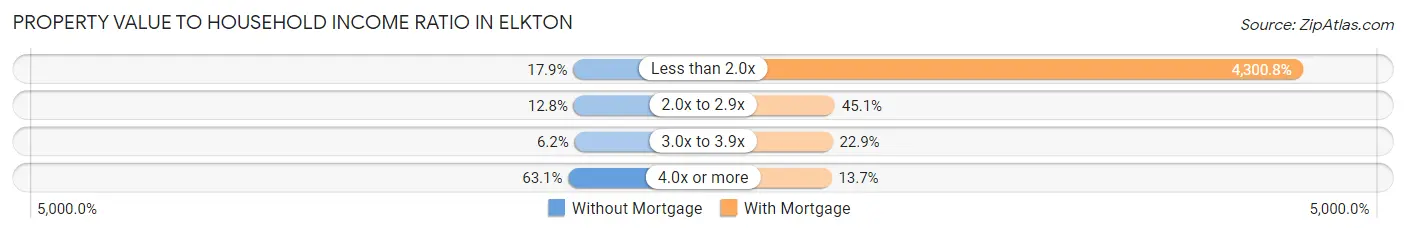
| Value-to-Income Ratio | Without Mortgage | With Mortgage |
| Less than 2.0x | 118 (17.9%) | 98,875 (4,300.8%) |
| 2.0x to 2.9x | 84 (12.8%) | 1,036 (45.1%) |
| 3.0x to 3.9x | 41 (6.2%) | 527 (22.9%) |
| 4.0x or more | 416 (63.1%) | 314 (13.7%) |
| Total | 659 (100.0%) | 2,299 (100.0%) |
Real Estate Taxes by Mortgage Status in Elkton
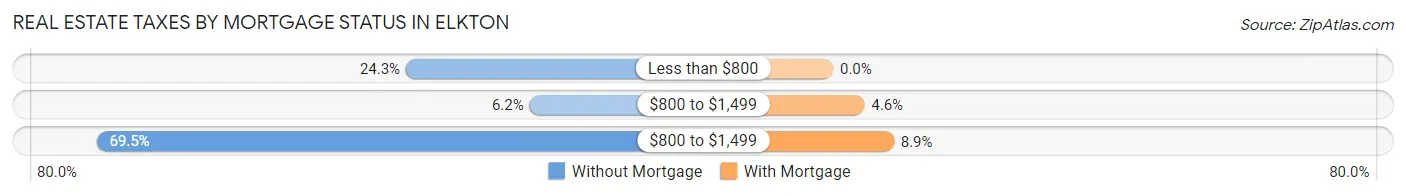
| Property Taxes | Without Mortgage | With Mortgage |
| Less than $800 | 160 (24.3%) | 0 (0.0%) |
| $800 to $1,499 | 41 (6.2%) | 105 (4.6%) |
| $800 to $1,499 | 458 (69.5%) | 204 (8.9%) |
| Total | 659 (100.0%) | 2,299 (100.0%) |
Health & Disability in Elkton
Health Insurance Coverage by Age in Elkton
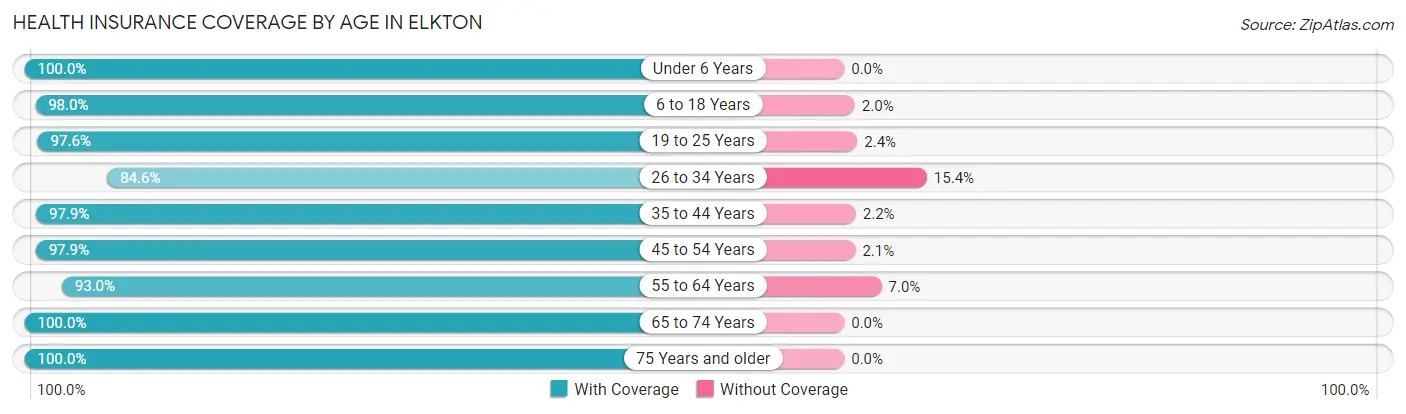
| Age Bracket | With Coverage | Without Coverage |
| Under 6 Years | 815 (100.0%) | 0 (0.0%) |
| 6 to 18 Years | 2,677 (98.0%) | 54 (2.0%) |
| 19 to 25 Years | 1,398 (97.6%) | 35 (2.4%) |
| 26 to 34 Years | 1,779 (84.6%) | 324 (15.4%) |
| 35 to 44 Years | 1,912 (97.9%) | 42 (2.1%) |
| 45 to 54 Years | 2,265 (97.9%) | 48 (2.1%) |
| 55 to 64 Years | 1,483 (93.0%) | 111 (7.0%) |
| 65 to 74 Years | 1,452 (100.0%) | 0 (0.0%) |
| 75 Years and older | 677 (100.0%) | 0 (0.0%) |
| Total | 14,458 (95.9%) | 614 (4.1%) |
Health Insurance Coverage by Citizenship Status in Elkton
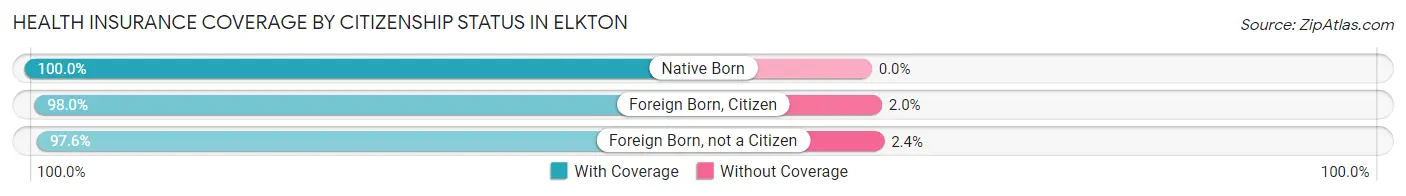
| Citizenship Status | With Coverage | Without Coverage |
| Native Born | 815 (100.0%) | 0 (0.0%) |
| Foreign Born, Citizen | 2,677 (98.0%) | 54 (2.0%) |
| Foreign Born, not a Citizen | 1,398 (97.6%) | 35 (2.4%) |
Health Insurance Coverage by Household Income in Elkton
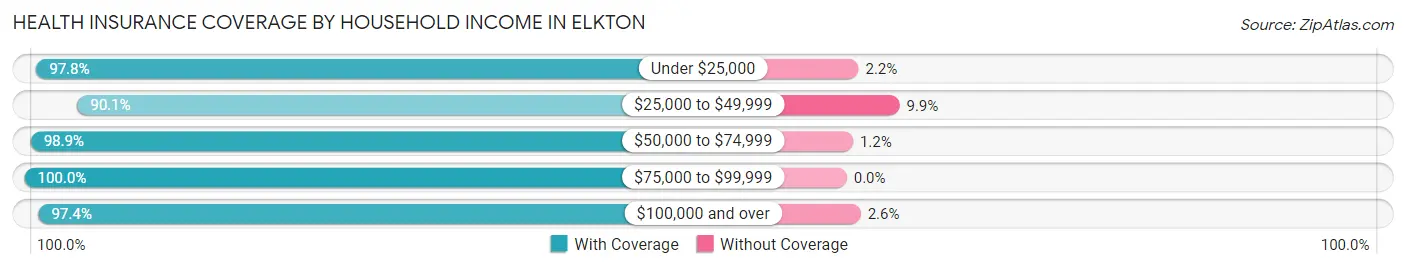
| Household Income | With Coverage | Without Coverage |
| Under $25,000 | 1,422 (97.8%) | 32 (2.2%) |
| $25,000 to $49,999 | 3,821 (90.1%) | 419 (9.9%) |
| $50,000 to $74,999 | 1,897 (98.9%) | 22 (1.1%) |
| $75,000 to $99,999 | 1,948 (100.0%) | 0 (0.0%) |
| $100,000 and over | 5,260 (97.4%) | 141 (2.6%) |
Public vs Private Health Insurance Coverage by Age in Elkton
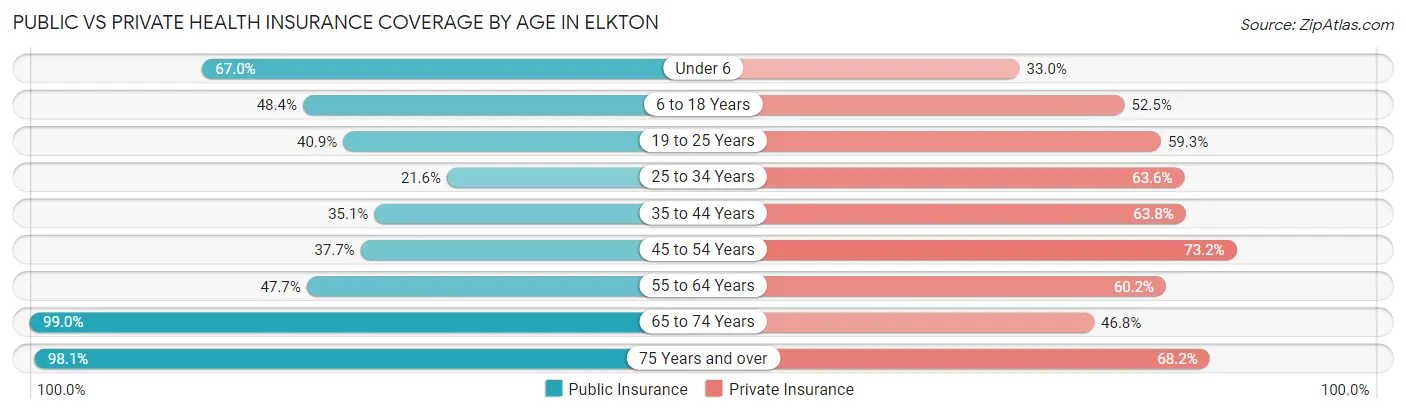
| Age Bracket | Public Insurance | Private Insurance |
| Under 6 | 546 (67.0%) | 269 (33.0%) |
| 6 to 18 Years | 1,321 (48.4%) | 1,433 (52.5%) |
| 19 to 25 Years | 586 (40.9%) | 849 (59.3%) |
| 25 to 34 Years | 455 (21.6%) | 1,337 (63.6%) |
| 35 to 44 Years | 686 (35.1%) | 1,247 (63.8%) |
| 45 to 54 Years | 871 (37.7%) | 1,694 (73.2%) |
| 55 to 64 Years | 760 (47.7%) | 959 (60.2%) |
| 65 to 74 Years | 1,437 (99.0%) | 680 (46.8%) |
| 75 Years and over | 664 (98.1%) | 462 (68.2%) |
| Total | 7,326 (48.6%) | 8,930 (59.3%) |
Disability Status by Sex by Age in Elkton
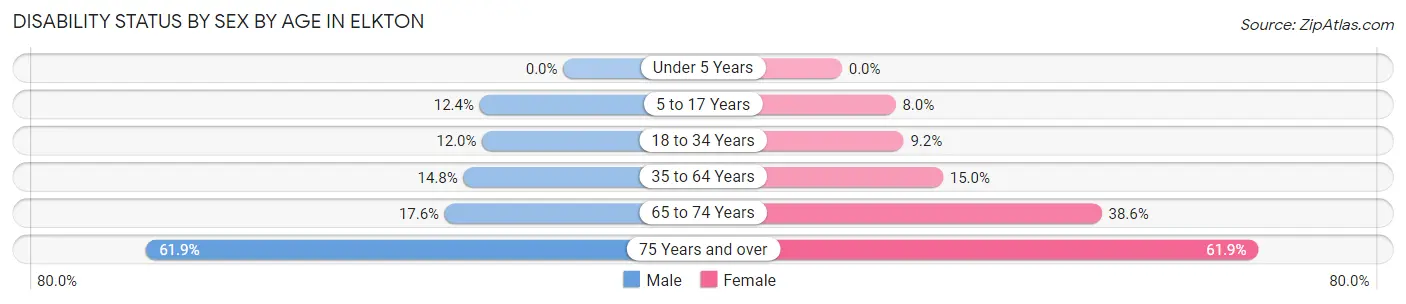
| Age Bracket | Male | Female |
| Under 5 Years | 0 (0.0%) | 0 (0.0%) |
| 5 to 17 Years | 155 (12.4%) | 100 (8.0%) |
| 18 to 34 Years | 235 (12.0%) | 172 (9.2%) |
| 35 to 64 Years | 418 (14.8%) | 456 (15.0%) |
| 65 to 74 Years | 93 (17.6%) | 356 (38.6%) |
| 75 Years and over | 205 (61.9%) | 214 (61.9%) |
Disability Class by Sex by Age in Elkton
Disability Class: Hearing Difficulty
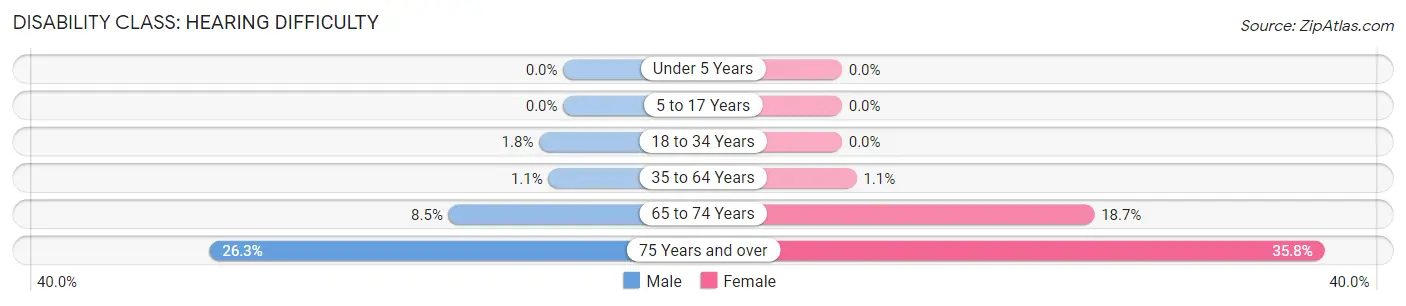
| Age Bracket | Male | Female |
| Under 5 Years | 0 (0.0%) | 0 (0.0%) |
| 5 to 17 Years | 0 (0.0%) | 0 (0.0%) |
| 18 to 34 Years | 35 (1.8%) | 0 (0.0%) |
| 35 to 64 Years | 31 (1.1%) | 33 (1.1%) |
| 65 to 74 Years | 45 (8.5%) | 173 (18.7%) |
| 75 Years and over | 87 (26.3%) | 124 (35.8%) |
Disability Class: Vision Difficulty
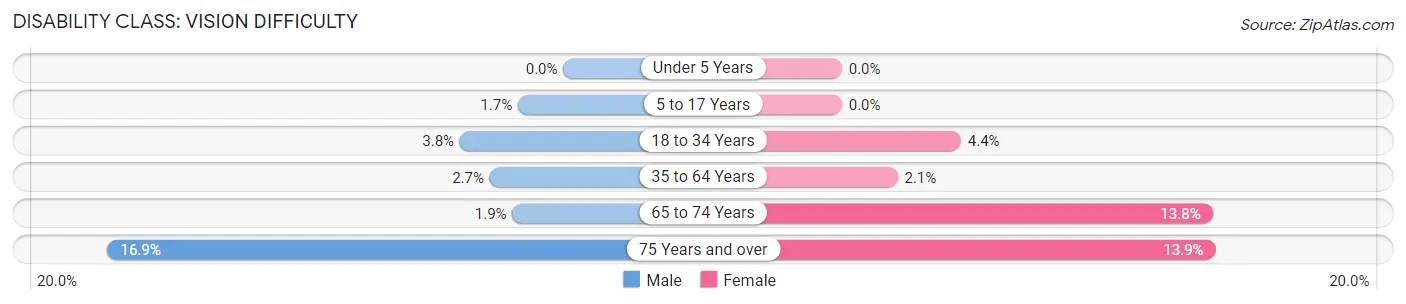
| Age Bracket | Male | Female |
| Under 5 Years | 0 (0.0%) | 0 (0.0%) |
| 5 to 17 Years | 21 (1.7%) | 0 (0.0%) |
| 18 to 34 Years | 75 (3.8%) | 83 (4.4%) |
| 35 to 64 Years | 77 (2.7%) | 63 (2.1%) |
| 65 to 74 Years | 10 (1.9%) | 127 (13.8%) |
| 75 Years and over | 56 (16.9%) | 48 (13.9%) |
Disability Class: Cognitive Difficulty
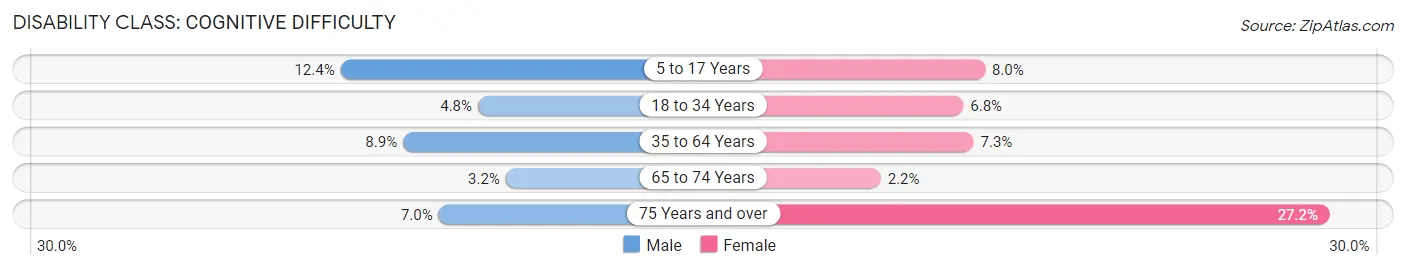
| Age Bracket | Male | Female |
| 5 to 17 Years | 155 (12.4%) | 100 (8.0%) |
| 18 to 34 Years | 93 (4.8%) | 127 (6.8%) |
| 35 to 64 Years | 252 (8.9%) | 223 (7.3%) |
| 65 to 74 Years | 17 (3.2%) | 20 (2.2%) |
| 75 Years and over | 23 (7.0%) | 94 (27.2%) |
Disability Class: Ambulatory Difficulty
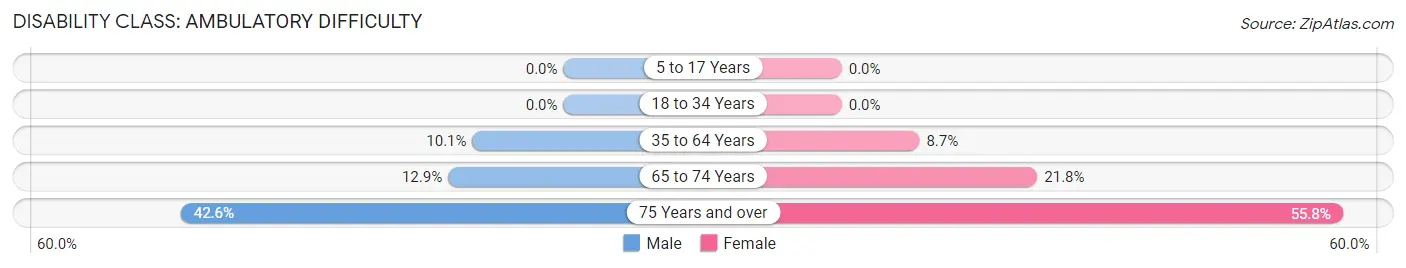
| Age Bracket | Male | Female |
| 5 to 17 Years | 0 (0.0%) | 0 (0.0%) |
| 18 to 34 Years | 0 (0.0%) | 0 (0.0%) |
| 35 to 64 Years | 286 (10.1%) | 263 (8.6%) |
| 65 to 74 Years | 68 (12.9%) | 201 (21.8%) |
| 75 Years and over | 141 (42.6%) | 193 (55.8%) |
Disability Class: Self-Care Difficulty
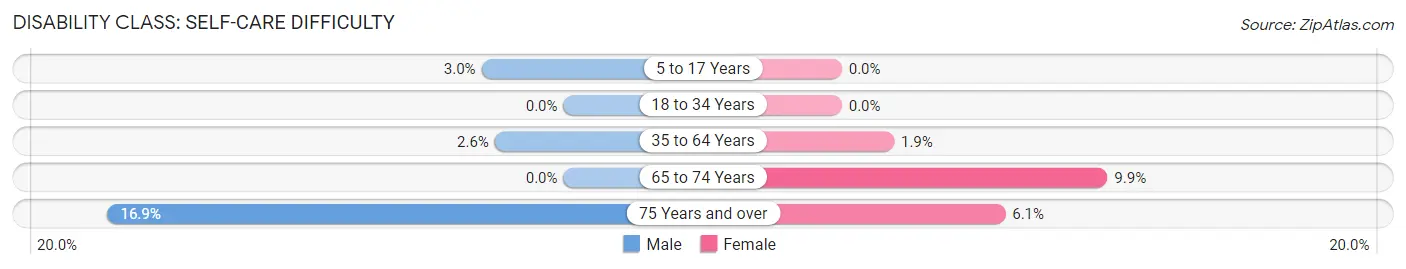
| Age Bracket | Male | Female |
| 5 to 17 Years | 38 (3.0%) | 0 (0.0%) |
| 18 to 34 Years | 0 (0.0%) | 0 (0.0%) |
| 35 to 64 Years | 72 (2.5%) | 59 (1.9%) |
| 65 to 74 Years | 0 (0.0%) | 91 (9.9%) |
| 75 Years and over | 56 (16.9%) | 21 (6.1%) |
Technology Access in Elkton
Computing Device Access in Elkton
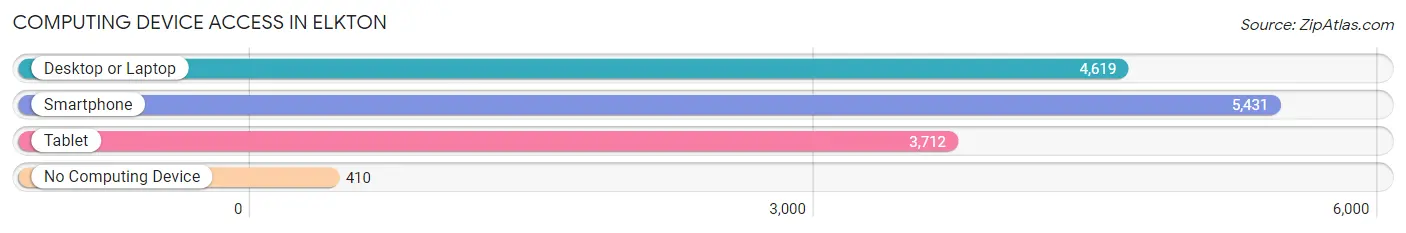
| Device Type | # Households | % Households |
| Desktop or Laptop | 4,619 | 75.3% |
| Smartphone | 5,431 | 88.5% |
| Tablet | 3,712 | 60.5% |
| No Computing Device | 410 | 6.7% |
| Total | 6,136 | 100.0% |
Internet Access in Elkton
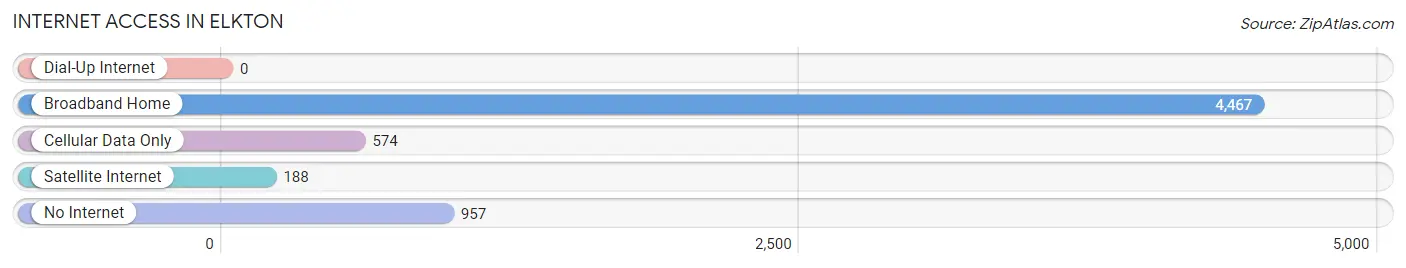
| Internet Type | # Households | % Households |
| Dial-Up Internet | 0 | 0.0% |
| Broadband Home | 4,467 | 72.8% |
| Cellular Data Only | 574 | 9.3% |
| Satellite Internet | 188 | 3.1% |
| No Internet | 957 | 15.6% |
| Total | 6,136 | 100.0% |
Elkton Summary
Elkton, Maryland is a small town located in Cecil County, Maryland. It is situated on the banks of the Elk River, which is a tributary of the Chesapeake Bay. The town is located about 25 miles northeast of Baltimore and about 75 miles southwest of Philadelphia. The town has a population of 15,443 as of the 2010 census.
History
Elkton was founded in 1787 by a group of German and Dutch settlers. The town was named after the Elk River, which was named after the elk that were once plentiful in the area. The town was incorporated in 1803 and was the first county seat of Cecil County.
In the early 19th century, Elkton was a major port for the export of tobacco and grain. The town was also a major stop on the Underground Railroad, with many slaves escaping to freedom in the north.
In the late 19th century, Elkton became a major center for the production of silk. The town was also home to several large brickyards and a large paper mill.
Geography
Elkton is located in the northern part of Cecil County, Maryland. The town is situated on the banks of the Elk River, which is a tributary of the Chesapeake Bay. The town is located about 25 miles northeast of Baltimore and about 75 miles southwest of Philadelphia.
The town has a total area of 4.2 square miles, all of which is land. The town is located in a humid subtropical climate zone, with hot, humid summers and mild winters.
Economy
Elkton’s economy is largely based on manufacturing and services. The town is home to several large manufacturing companies, including a paper mill, a brickyard, and a silk mill. The town is also home to several large service companies, including a hospital, a bank, and a law firm.
The town is also home to several small businesses, including restaurants, retail stores, and professional services. The town is also home to several tourist attractions, including the Elkton Historic District, the Elkton Town Hall, and the Elkton Museum.
Demographics
As of the 2010 census, Elkton had a population of 15,443. The racial makeup of the town was 79.3% White, 14.2% African American, 0.4% Native American, 1.2% Asian, 0.1% Pacific Islander, 2.2% from other races, and 2.7% from two or more races. Hispanic or Latino of any race were 5.2% of the population.
The median income for a household in the town was $45,945, and the median income for a family was $54,945. The per capita income for the town was $22,945. About 11.2% of families and 14.2% of the population were below the poverty line, including 19.2% of those under age 18 and 8.2% of those age 65 or over.
Common Questions
What is Per Capita Income in Elkton?
Per Capita income in Elkton is $32,283.
What is the Median Family Income in Elkton?
Median Family Income in Elkton is $72,177.
What is the Median Household income in Elkton?
Median Household Income in Elkton is $58,593.
What is Income or Wage Gap in Elkton?
Income or Wage Gap in Elkton is 20.9%.
Women in Elkton earn 79.1 cents for every dollar earned by a man.
What is Inequality or Gini Index in Elkton?
Inequality or Gini Index in Elkton is 0.45.
What is the Total Population of Elkton?
Total Population of Elkton is 15,830.
What is the Total Male Population of Elkton?
Total Male Population of Elkton is 7,950.
What is the Total Female Population of Elkton?
Total Female Population of Elkton is 7,880.
What is the Ratio of Males per 100 Females in Elkton?
There are 100.89 Males per 100 Females in Elkton.
What is the Ratio of Females per 100 Males in Elkton?
There are 99.12 Females per 100 Males in Elkton.
What is the Median Population Age in Elkton?
Median Population Age in Elkton is 38.1 Years.
What is the Average Family Size in Elkton
Average Family Size in Elkton is 2.9 People.
What is the Average Household Size in Elkton
Average Household Size in Elkton is 2.4 People.
How Large is the Labor Force in Elkton?
There are 7,645 People in the Labor Forcein in Elkton.
What is the Percentage of People in the Labor Force in Elkton?
58.3% of People are in the Labor Force in Elkton.
What is the Unemployment Rate in Elkton?
Unemployment Rate in Elkton is 4.9%.