Ocean City, MD Map & Demographics
Ocean City Map
Ocean City Overview
$59,876
PER CAPITA INCOME
$88,333
AVG FAMILY INCOME
$62,401
AVG HOUSEHOLD INCOME
26.9%
WAGE / INCOME GAP [ % ]
73.1¢/ $1
WAGE / INCOME GAP [ $ ]
0.55
INEQUALITY / GINI INDEX
6,879
TOTAL POPULATION
3,123
MALE POPULATION
3,756
FEMALE POPULATION
83.15
MALES / 100 FEMALES
120.27
FEMALES / 100 MALES
55.5
MEDIAN AGE
2.4
AVG FAMILY SIZE
1.8
AVG HOUSEHOLD SIZE
3,911
LABOR FORCE [ PEOPLE ]
62.3%
PERCENT IN LABOR FORCE
3.6%
UNEMPLOYMENT RATE
Ocean City Zip Codes
Income in Ocean City
Income Overview in Ocean City
Per Capita Income in Ocean City is $59,876, while median incomes of families and households are $88,333 and $62,401 respectively.
| Characteristic | Number | Measure |
| Per Capita Income | 6,879 | $59,876 |
| Median Family Income | 1,860 | $88,333 |
| Mean Family Income | 1,860 | $154,524 |
| Median Household Income | 3,825 | $62,401 |
| Mean Household Income | 3,825 | $105,363 |
| Income Deficit | 1,860 | $0 |
| Wage / Income Gap (%) | 6,879 | 26.88% |
| Wage / Income Gap ($) | 6,879 | 73.12¢ per $1 |
| Gini / Inequality Index | 6,879 | 0.55 |
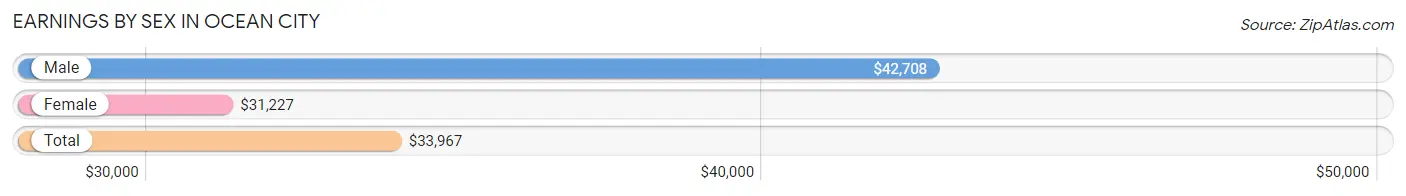
Earnings by Sex in Ocean City
Average Earnings in Ocean City are $33,967, $42,708 for men and $31,227 for women, a difference of 26.9%.
| Sex | Number | Average Earnings |
| Male | 1,811 (43.7%) | $42,708 |
| Female | 2,336 (56.3%) | $31,227 |
| Total | 4,147 (100.0%) | $33,967 |
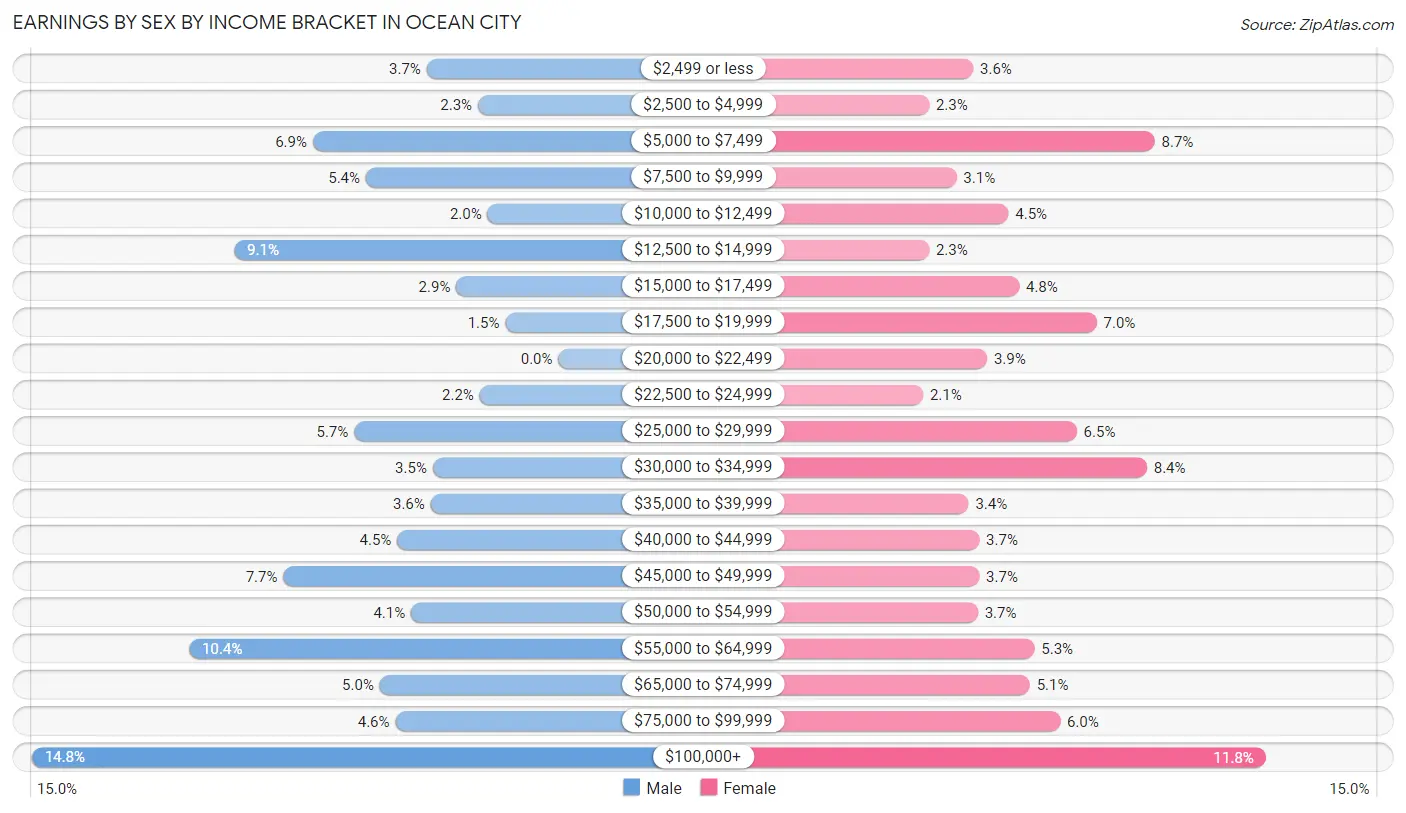
Earnings by Sex by Income Bracket in Ocean City
The most common earnings brackets in Ocean City are $100,000+ for men (268 | 14.8%) and $100,000+ for women (275 | 11.8%).
| Income | Male | Female |
| $2,499 or less | 67 (3.7%) | 83 (3.5%) |
| $2,500 to $4,999 | 41 (2.3%) | 54 (2.3%) |
| $5,000 to $7,499 | 125 (6.9%) | 202 (8.6%) |
| $7,500 to $9,999 | 98 (5.4%) | 72 (3.1%) |
| $10,000 to $12,499 | 36 (2.0%) | 106 (4.5%) |
| $12,500 to $14,999 | 165 (9.1%) | 54 (2.3%) |
| $15,000 to $17,499 | 52 (2.9%) | 113 (4.8%) |
| $17,500 to $19,999 | 27 (1.5%) | 164 (7.0%) |
| $20,000 to $22,499 | 0 (0.0%) | 92 (3.9%) |
| $22,500 to $24,999 | 40 (2.2%) | 50 (2.1%) |
| $25,000 to $29,999 | 104 (5.7%) | 151 (6.5%) |
| $30,000 to $34,999 | 64 (3.5%) | 197 (8.4%) |
| $35,000 to $39,999 | 65 (3.6%) | 80 (3.4%) |
| $40,000 to $44,999 | 82 (4.5%) | 87 (3.7%) |
| $45,000 to $49,999 | 140 (7.7%) | 87 (3.7%) |
| $50,000 to $54,999 | 75 (4.1%) | 86 (3.7%) |
| $55,000 to $64,999 | 188 (10.4%) | 123 (5.3%) |
| $65,000 to $74,999 | 91 (5.0%) | 120 (5.1%) |
| $75,000 to $99,999 | 83 (4.6%) | 140 (6.0%) |
| $100,000+ | 268 (14.8%) | 275 (11.8%) |
| Total | 1,811 (100.0%) | 2,336 (100.0%) |
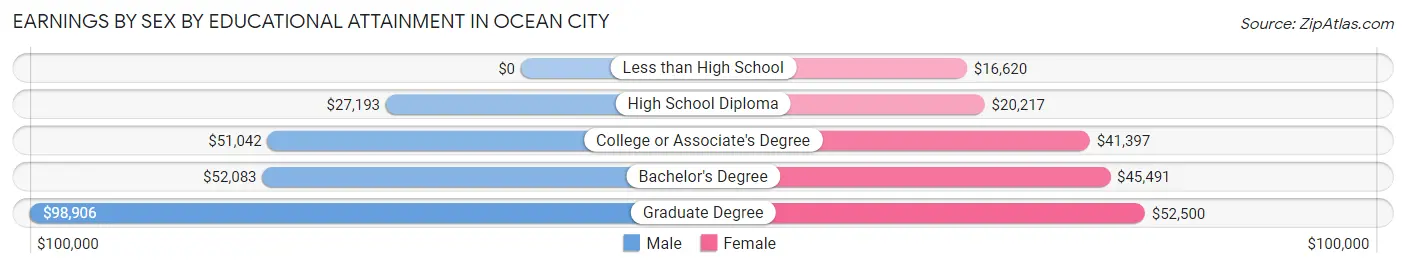
Earnings by Sex by Educational Attainment in Ocean City
Average earnings in Ocean City are $46,808 for men and $34,768 for women, a difference of 25.7%. Men with an educational attainment of graduate degree enjoy the highest average annual earnings of $98,906, while those with high school diploma education earn the least with $27,193. Women with an educational attainment of graduate degree earn the most with the average annual earnings of $52,500, while those with less than high school education have the smallest earnings of $16,620.
| Educational Attainment | Male Income | Female Income |
| Less than High School | - | - |
| High School Diploma | $27,193 | $20,217 |
| College or Associate's Degree | $51,042 | $41,397 |
| Bachelor's Degree | $52,083 | $45,491 |
| Graduate Degree | $98,906 | $52,500 |
| Total | $46,808 | $34,768 |
Family Income in Ocean City
Family Income Brackets in Ocean City
According to the Ocean City family income data, there are 361 families falling into the $50,000 to $74,999 income range, which is the most common income bracket and makes up 19.4% of all families. Conversely, the $10,000 to $14,999 income bracket is the least frequent group with only 9 families (0.5%) belonging to this category.
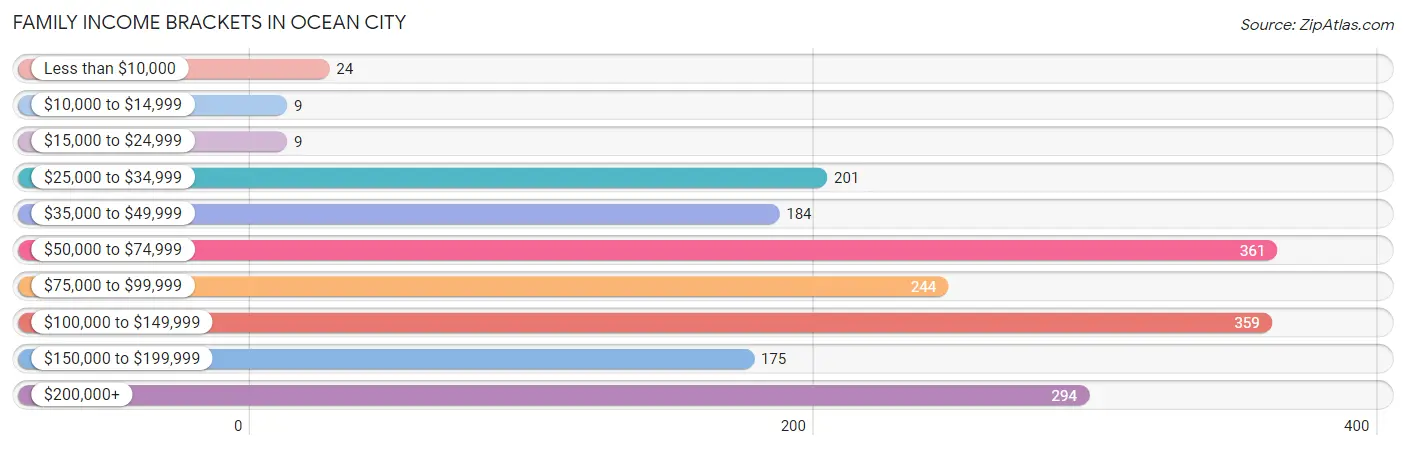
| Income Bracket | # Families | % Families |
| Less than $10,000 | 24 | 1.3% |
| $10,000 to $14,999 | 9 | 0.5% |
| $15,000 to $24,999 | 9 | 0.5% |
| $25,000 to $34,999 | 201 | 10.8% |
| $35,000 to $49,999 | 184 | 9.9% |
| $50,000 to $74,999 | 361 | 19.4% |
| $75,000 to $99,999 | 244 | 13.1% |
| $100,000 to $149,999 | 359 | 19.3% |
| $150,000 to $199,999 | 175 | 9.4% |
| $200,000+ | 294 | 15.8% |
Family Income by Famaliy Size in Ocean City
3-person families (302 | 16.2%) account for the highest median family income in Ocean City with $117,500 per family, while 2-person families (1,273 | 68.4%) have the highest median income of $41,426 per family member.
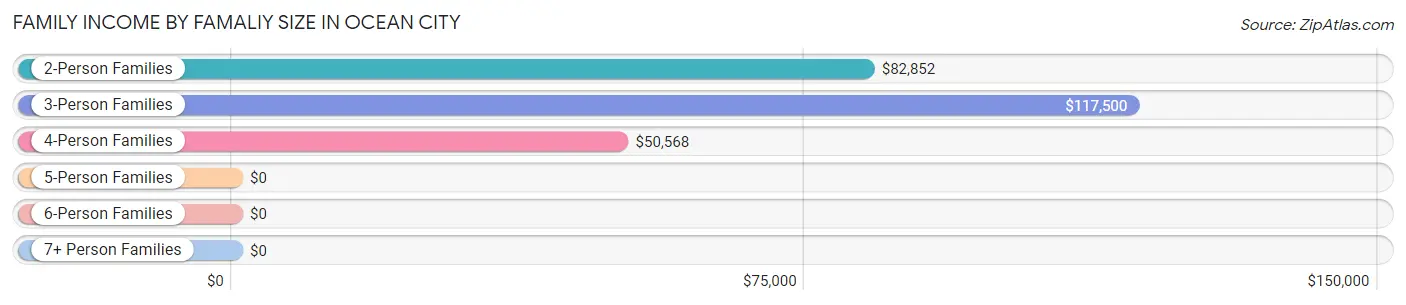
| Income Bracket | # Families | Median Income |
| 2-Person Families | 1,273 (68.4%) | $82,852 |
| 3-Person Families | 302 (16.2%) | $117,500 |
| 4-Person Families | 224 (12.0%) | $50,568 |
| 5-Person Families | 18 (1.0%) | $0 |
| 6-Person Families | 0 (0.0%) | $0 |
| 7+ Person Families | 43 (2.3%) | $0 |
| Total | 1,860 (100.0%) | $88,333 |
Family Income by Number of Earners in Ocean City
The median family income in Ocean City is $88,333, with families comprising 3+ earners (201) having the highest median family income of $125,875, while families with no earners (473) have the lowest median family income of $67,784, accounting for 10.8% and 25.4% of families, respectively.
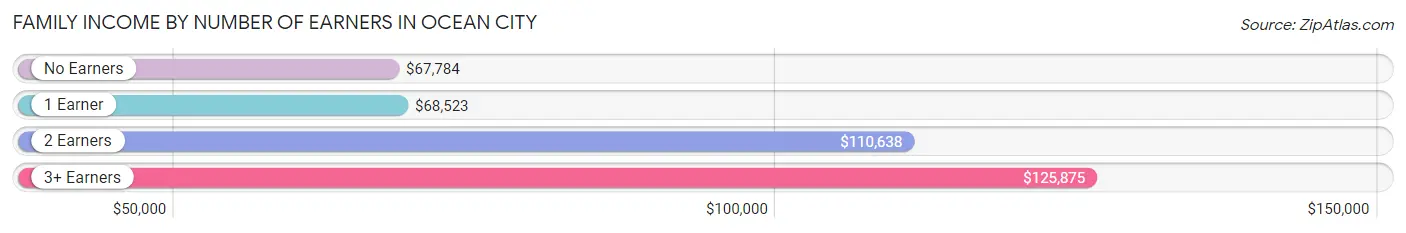
| Number of Earners | # Families | Median Income |
| No Earners | 473 (25.4%) | $67,784 |
| 1 Earner | 412 (22.2%) | $68,523 |
| 2 Earners | 774 (41.6%) | $110,638 |
| 3+ Earners | 201 (10.8%) | $125,875 |
| Total | 1,860 (100.0%) | $88,333 |
Household Income in Ocean City
Household Income Brackets in Ocean City
With 761 households falling in the category, the $50,000 to $74,999 income range is the most frequent in Ocean City, accounting for 19.9% of all households. In contrast, only 115 households (3.0%) fall into the $10,000 to $14,999 income bracket, making it the least populous group.
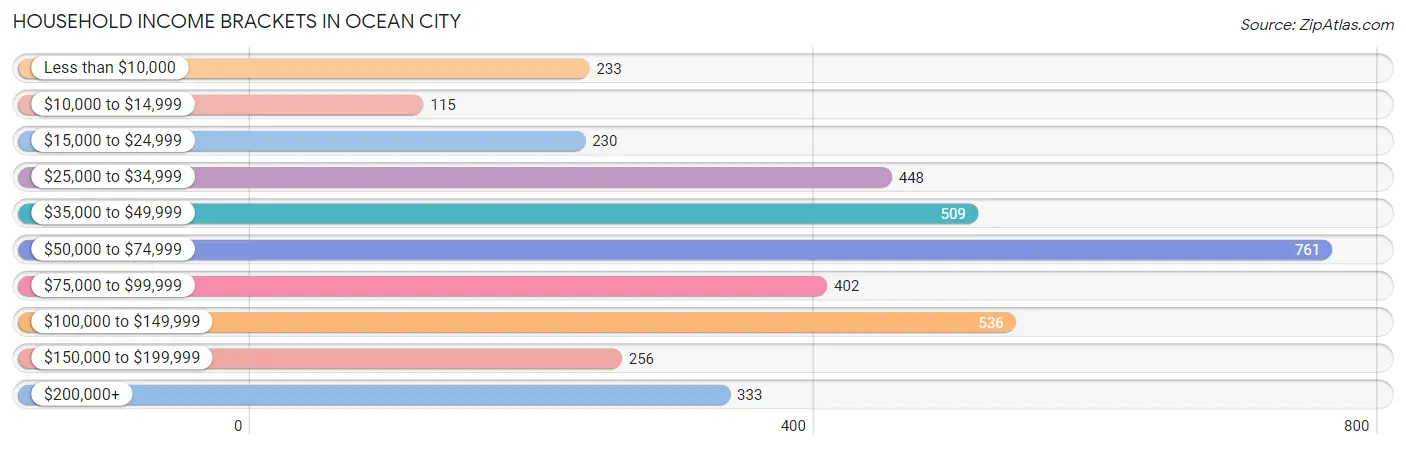
| Income Bracket | # Households | % Households |
| Less than $10,000 | 233 | 6.1% |
| $10,000 to $14,999 | 115 | 3.0% |
| $15,000 to $24,999 | 230 | 6.0% |
| $25,000 to $34,999 | 448 | 11.7% |
| $35,000 to $49,999 | 509 | 13.3% |
| $50,000 to $74,999 | 761 | 19.9% |
| $75,000 to $99,999 | 402 | 10.5% |
| $100,000 to $149,999 | 536 | 14.0% |
| $150,000 to $199,999 | 256 | 6.7% |
| $200,000+ | 333 | 8.7% |
Household Income by Householder Age in Ocean City
The median household income in Ocean City is $62,401, with the highest median household income of $83,750 found in the 45 to 64 years age bracket for the primary householder. A total of 1,174 households (30.7%) fall into this category. Meanwhile, the 15 to 24 years age bracket for the primary householder has the lowest median household income of $33,665, with 311 households (8.1%) in this group.
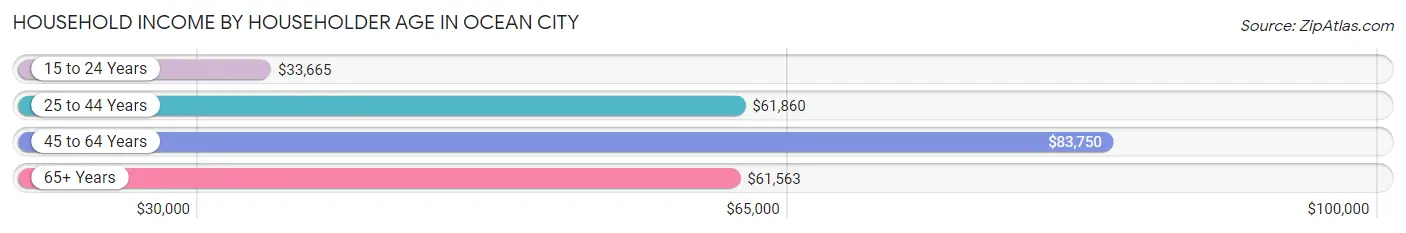
| Income Bracket | # Households | Median Income |
| 15 to 24 Years | 311 (8.1%) | $33,665 |
| 25 to 44 Years | 728 (19.0%) | $61,860 |
| 45 to 64 Years | 1,174 (30.7%) | $83,750 |
| 65+ Years | 1,612 (42.1%) | $61,563 |
| Total | 3,825 (100.0%) | $62,401 |
Poverty in Ocean City
Income Below Poverty by Sex and Age in Ocean City
With 10.1% poverty level for males and 7.7% for females among the residents of Ocean City, 12 to 14 year old males and 6 to 11 year old females are the most vulnerable to poverty, with 41 males (47.7%) and 14 females (25.9%) in their respective age groups living below the poverty level.
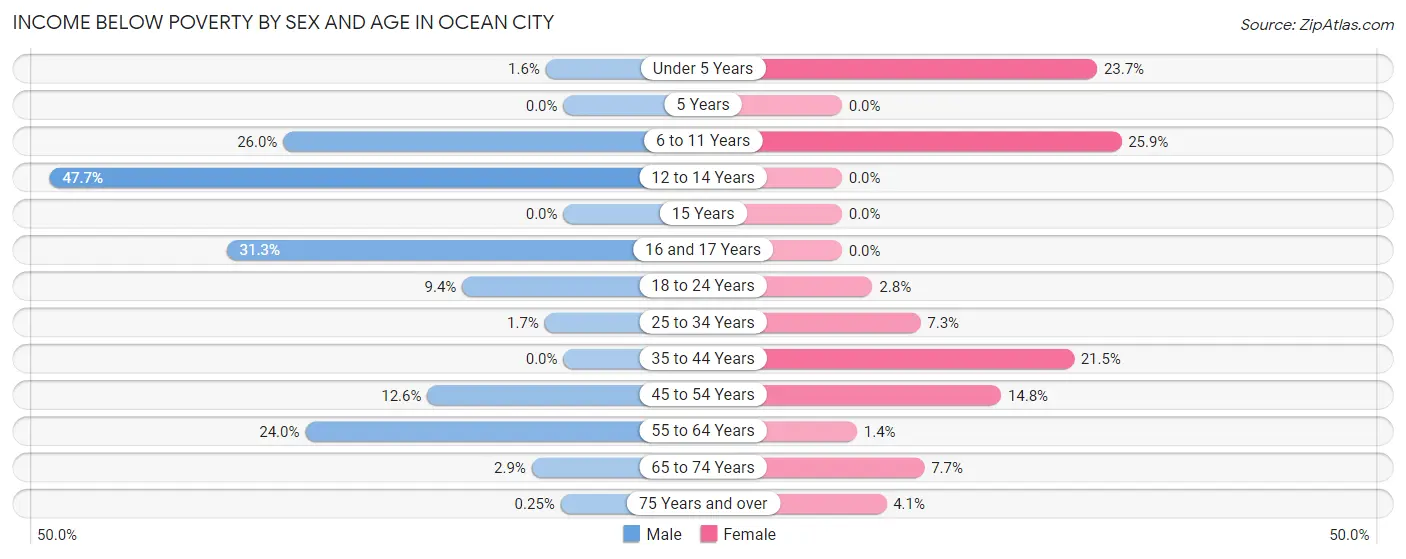
| Age Bracket | Male | Female |
| Under 5 Years | 3 (1.6%) | 18 (23.7%) |
| 5 Years | 0 (0.0%) | 0 (0.0%) |
| 6 to 11 Years | 26 (26.0%) | 14 (25.9%) |
| 12 to 14 Years | 41 (47.7%) | 0 (0.0%) |
| 15 Years | 0 (0.0%) | 0 (0.0%) |
| 16 and 17 Years | 20 (31.2%) | 0 (0.0%) |
| 18 to 24 Years | 29 (9.4%) | 13 (2.8%) |
| 25 to 34 Years | 5 (1.7%) | 36 (7.3%) |
| 35 to 44 Years | 0 (0.0%) | 48 (21.5%) |
| 45 to 54 Years | 24 (12.6%) | 65 (14.8%) |
| 55 to 64 Years | 148 (23.9%) | 8 (1.4%) |
| 65 to 74 Years | 18 (2.9%) | 65 (7.6%) |
| 75 Years and over | 1 (0.3%) | 20 (4.1%) |
| Total | 315 (10.1%) | 287 (7.7%) |
Income Above Poverty by Sex and Age in Ocean City
According to the poverty statistics in Ocean City, males aged 35 to 44 years and females aged 12 to 14 years are the age groups that are most secure financially, with 100.0% of males and 100.0% of females in these age groups living above the poverty line.
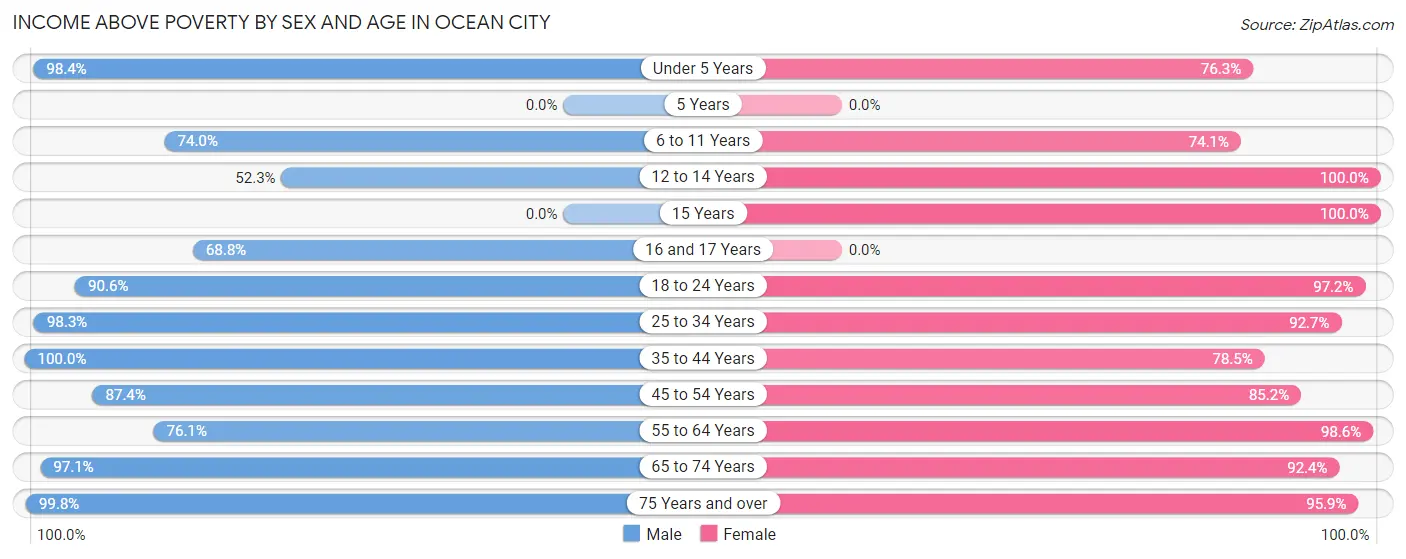
| Age Bracket | Male | Female |
| Under 5 Years | 180 (98.4%) | 58 (76.3%) |
| 5 Years | 0 (0.0%) | 0 (0.0%) |
| 6 to 11 Years | 74 (74.0%) | 40 (74.1%) |
| 12 to 14 Years | 45 (52.3%) | 61 (100.0%) |
| 15 Years | 0 (0.0%) | 28 (100.0%) |
| 16 and 17 Years | 44 (68.8%) | 0 (0.0%) |
| 18 to 24 Years | 280 (90.6%) | 445 (97.2%) |
| 25 to 34 Years | 284 (98.3%) | 458 (92.7%) |
| 35 to 44 Years | 265 (100.0%) | 175 (78.5%) |
| 45 to 54 Years | 166 (87.4%) | 375 (85.2%) |
| 55 to 64 Years | 470 (76.0%) | 564 (98.6%) |
| 65 to 74 Years | 595 (97.1%) | 785 (92.3%) |
| 75 Years and over | 392 (99.8%) | 465 (95.9%) |
| Total | 2,795 (89.9%) | 3,454 (92.3%) |
Income Below Poverty Among Married-Couple Families in Ocean City
The poverty statistics for married-couple families in Ocean City show that 2.1% or 30 of the total 1,399 families live below the poverty line. Families with no children have the highest poverty rate of 2.3%, comprising of 25 families. On the other hand, families with 3 or 4 children have the lowest poverty rate of 0.0%, which includes 0 families.
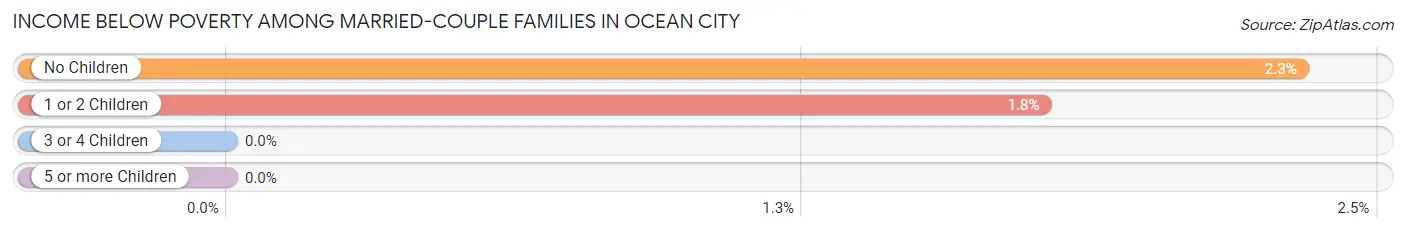
| Children | Above Poverty | Below Poverty |
| No Children | 1,048 (97.7%) | 25 (2.3%) |
| 1 or 2 Children | 278 (98.2%) | 5 (1.8%) |
| 3 or 4 Children | 43 (100.0%) | 0 (0.0%) |
| 5 or more Children | 0 (0.0%) | 0 (0.0%) |
| Total | 1,369 (97.9%) | 30 (2.1%) |
Income Below Poverty Among Single-Parent Households in Ocean City
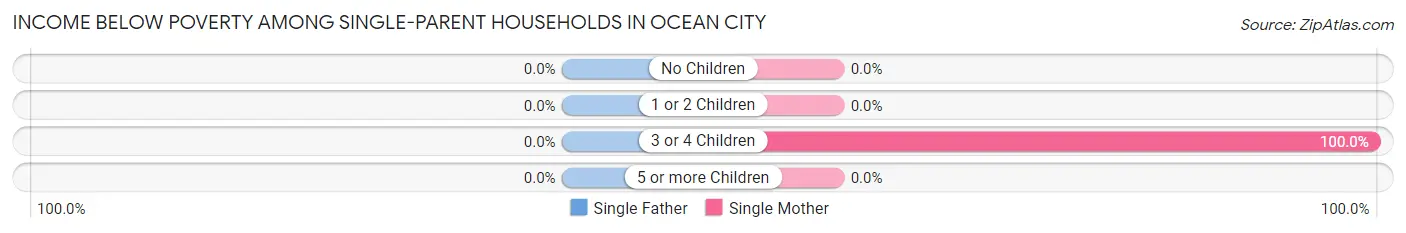
| Children | Single Father | Single Mother |
| No Children | 0 (0.0%) | 0 (0.0%) |
| 1 or 2 Children | 0 (0.0%) | 0 (0.0%) |
| 3 or 4 Children | 0 (0.0%) | 30 (100.0%) |
| 5 or more Children | 0 (0.0%) | 0 (0.0%) |
| Total | 0 (0.0%) | 30 (7.2%) |
Income Below Poverty Among Married-Couple vs Single-Parent Households in Ocean City
The poverty data for Ocean City shows that 30 of the married-couple family households (2.1%) and 30 of the single-parent households (6.5%) are living below the poverty level. Within the married-couple family households, those with no children have the highest poverty rate, with 25 households (2.3%) falling below the poverty line. Among the single-parent households, those with 3 or 4 children have the highest poverty rate, with 30 household (100.0%) living below poverty.
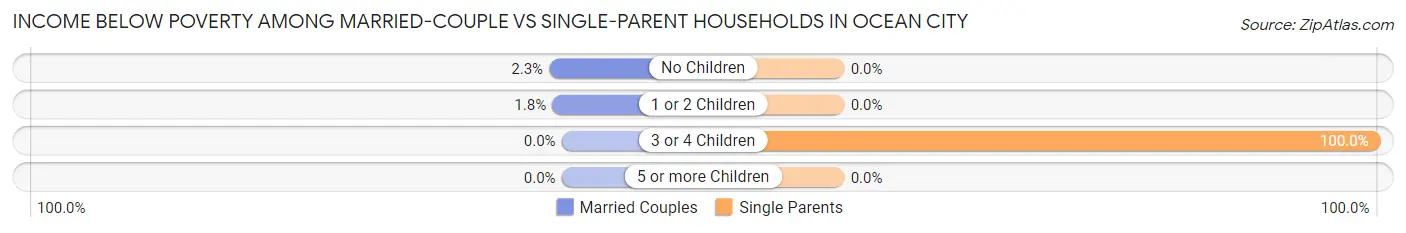
| Children | Married-Couple Families | Single-Parent Households |
| No Children | 25 (2.3%) | 0 (0.0%) |
| 1 or 2 Children | 5 (1.8%) | 0 (0.0%) |
| 3 or 4 Children | 0 (0.0%) | 30 (100.0%) |
| 5 or more Children | 0 (0.0%) | 0 (0.0%) |
| Total | 30 (2.1%) | 30 (6.5%) |
Race in Ocean City
The most populous races in Ocean City are White / Caucasian (6,253 | 90.9%), Hispanic or Latino (590 | 8.6%), and Some other Race (275 | 4.0%).
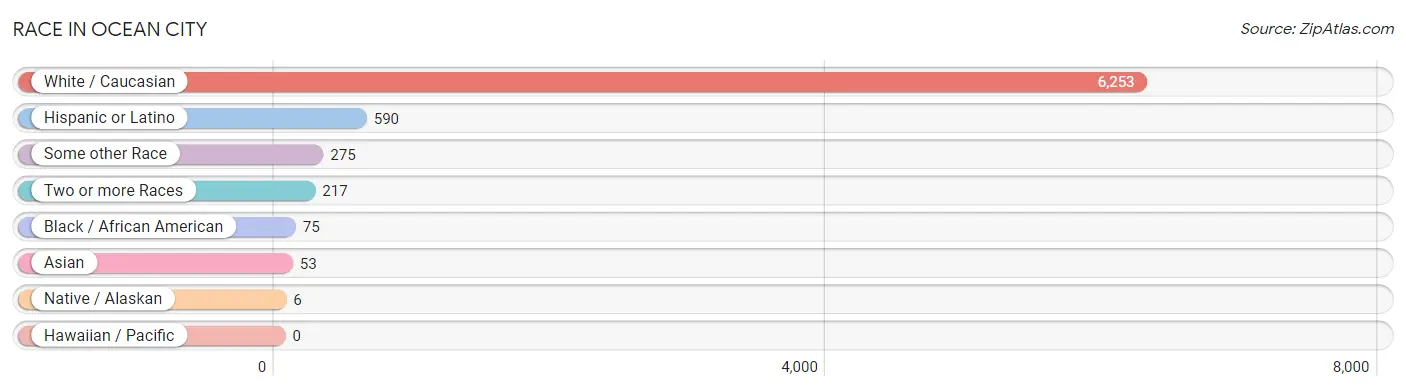
| Race | # Population | % Population |
| Asian | 53 | 0.8% |
| Black / African American | 75 | 1.1% |
| Hawaiian / Pacific | 0 | 0.0% |
| Hispanic or Latino | 590 | 8.6% |
| Native / Alaskan | 6 | 0.1% |
| White / Caucasian | 6,253 | 90.9% |
| Two or more Races | 217 | 3.2% |
| Some other Race | 275 | 4.0% |
| Total | 6,879 | 100.0% |
Ancestry in Ocean City
The most populous ancestries reported in Ocean City are German (1,543 | 22.4%), Irish (1,384 | 20.1%), English (882 | 12.8%), Italian (796 | 11.6%), and American (387 | 5.6%), together accounting for 72.6% of all Ocean City residents.
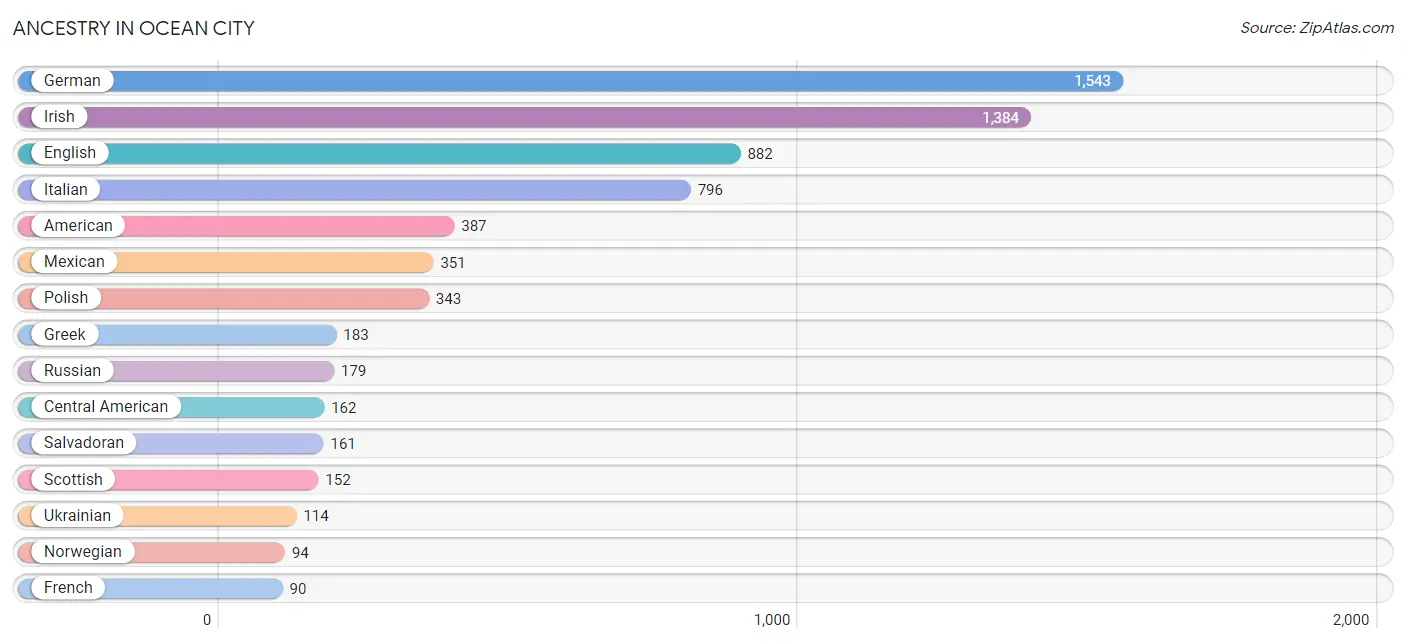
| Ancestry | # Population | % Population |
| African | 4 | 0.1% |
| American | 387 | 5.6% |
| Arab | 11 | 0.2% |
| Austrian | 64 | 0.9% |
| British | 83 | 1.2% |
| Bulgarian | 12 | 0.2% |
| Canadian | 8 | 0.1% |
| Central American | 162 | 2.4% |
| Cherokee | 6 | 0.1% |
| Croatian | 1 | 0.0% |
| Czech | 28 | 0.4% |
| Czechoslovakian | 9 | 0.1% |
| Dominican | 33 | 0.5% |
| Dutch | 51 | 0.7% |
| Eastern European | 12 | 0.2% |
| Ecuadorian | 15 | 0.2% |
| Egyptian | 1 | 0.0% |
| English | 882 | 12.8% |
| European | 63 | 0.9% |
| French | 90 | 1.3% |
| German | 1,543 | 22.4% |
| Greek | 183 | 2.7% |
| Guatemalan | 1 | 0.0% |
| Hungarian | 31 | 0.4% |
| Indian (Asian) | 74 | 1.1% |
| Irish | 1,384 | 20.1% |
| Italian | 796 | 11.6% |
| Korean | 11 | 0.2% |
| Lithuanian | 7 | 0.1% |
| Macedonian | 38 | 0.5% |
| Mexican | 351 | 5.1% |
| Mongolian | 18 | 0.3% |
| Norwegian | 94 | 1.4% |
| Peruvian | 9 | 0.1% |
| Polish | 343 | 5.0% |
| Puerto Rican | 11 | 0.2% |
| Russian | 179 | 2.6% |
| Salvadoran | 161 | 2.3% |
| Scandinavian | 68 | 1.0% |
| Scotch-Irish | 50 | 0.7% |
| Scottish | 152 | 2.2% |
| Serbian | 44 | 0.6% |
| Sioux | 5 | 0.1% |
| Slavic | 6 | 0.1% |
| Slovak | 42 | 0.6% |
| South American | 33 | 0.5% |
| Sri Lankan | 17 | 0.3% |
| Subsaharan African | 4 | 0.1% |
| Swedish | 69 | 1.0% |
| Syrian | 10 | 0.2% |
| Turkish | 16 | 0.2% |
| Ugandan | 4 | 0.1% |
| Ukrainian | 114 | 1.7% |
| Venezuelan | 9 | 0.1% |
| Welsh | 70 | 1.0% | View All 55 Rows |
Immigrants in Ocean City
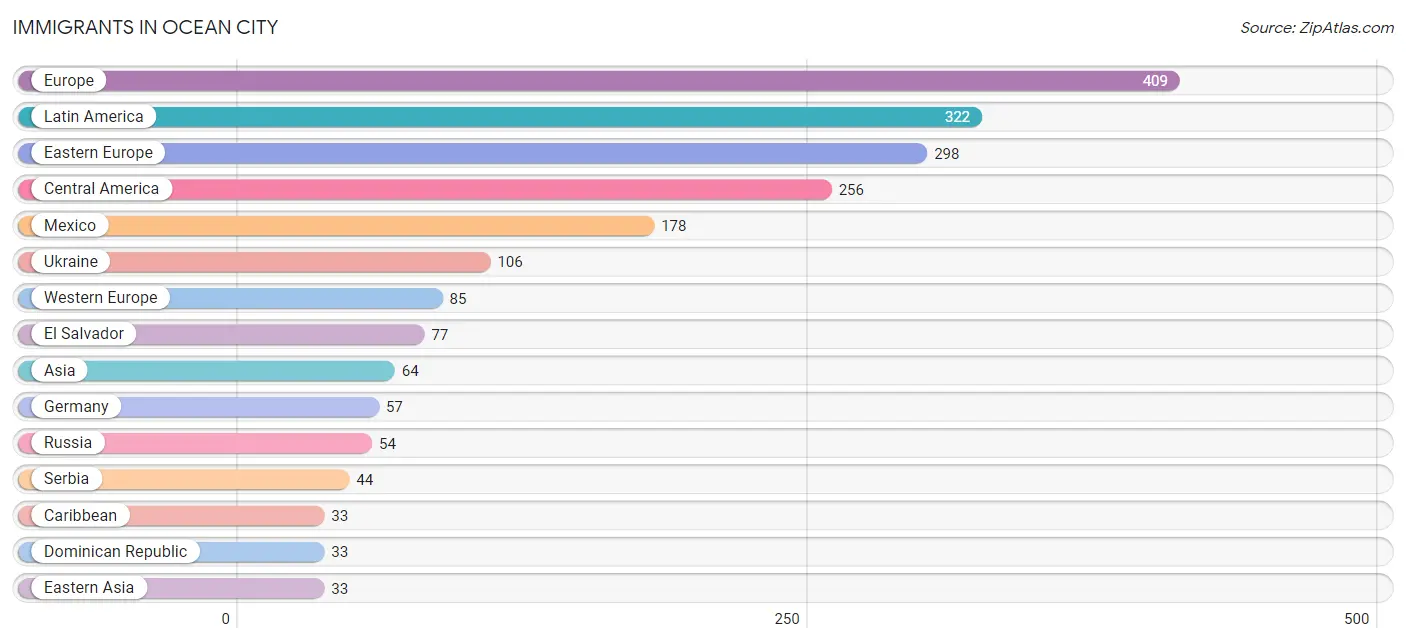
The most numerous immigrant groups reported in Ocean City came from Europe (409 | 5.9%), Latin America (322 | 4.7%), Eastern Europe (298 | 4.3%), Central America (256 | 3.7%), and Mexico (178 | 2.6%), together accounting for 21.3% of all Ocean City residents.
| Immigration Origin | # Population | % Population |
| Africa | 9 | 0.1% |
| Asia | 64 | 0.9% |
| Austria | 28 | 0.4% |
| Belarus | 21 | 0.3% |
| Bulgaria | 12 | 0.2% |
| Caribbean | 33 | 0.5% |
| Central America | 256 | 3.7% |
| China | 24 | 0.4% |
| Dominican Republic | 33 | 0.5% |
| Eastern Africa | 4 | 0.1% |
| Eastern Asia | 33 | 0.5% |
| Eastern Europe | 298 | 4.3% |
| Ecuador | 15 | 0.2% |
| El Salvador | 77 | 1.1% |
| Europe | 409 | 5.9% |
| Germany | 57 | 0.8% |
| Ghana | 5 | 0.1% |
| Greece | 16 | 0.2% |
| Guatemala | 1 | 0.0% |
| Italy | 10 | 0.2% |
| Japan | 9 | 0.1% |
| Kazakhstan | 15 | 0.2% |
| Latin America | 322 | 4.7% |
| Mexico | 178 | 2.6% |
| Peru | 9 | 0.1% |
| Poland | 23 | 0.3% |
| Russia | 54 | 0.8% |
| Serbia | 44 | 0.6% |
| South America | 33 | 0.5% |
| South Central Asia | 15 | 0.2% |
| Southern Europe | 26 | 0.4% |
| Turkey | 16 | 0.2% |
| Uganda | 4 | 0.1% |
| Ukraine | 106 | 1.5% |
| Venezuela | 9 | 0.1% |
| Western Africa | 5 | 0.1% |
| Western Asia | 16 | 0.2% |
| Western Europe | 85 | 1.2% | View All 38 Rows |
Sex and Age in Ocean City
Sex and Age in Ocean City
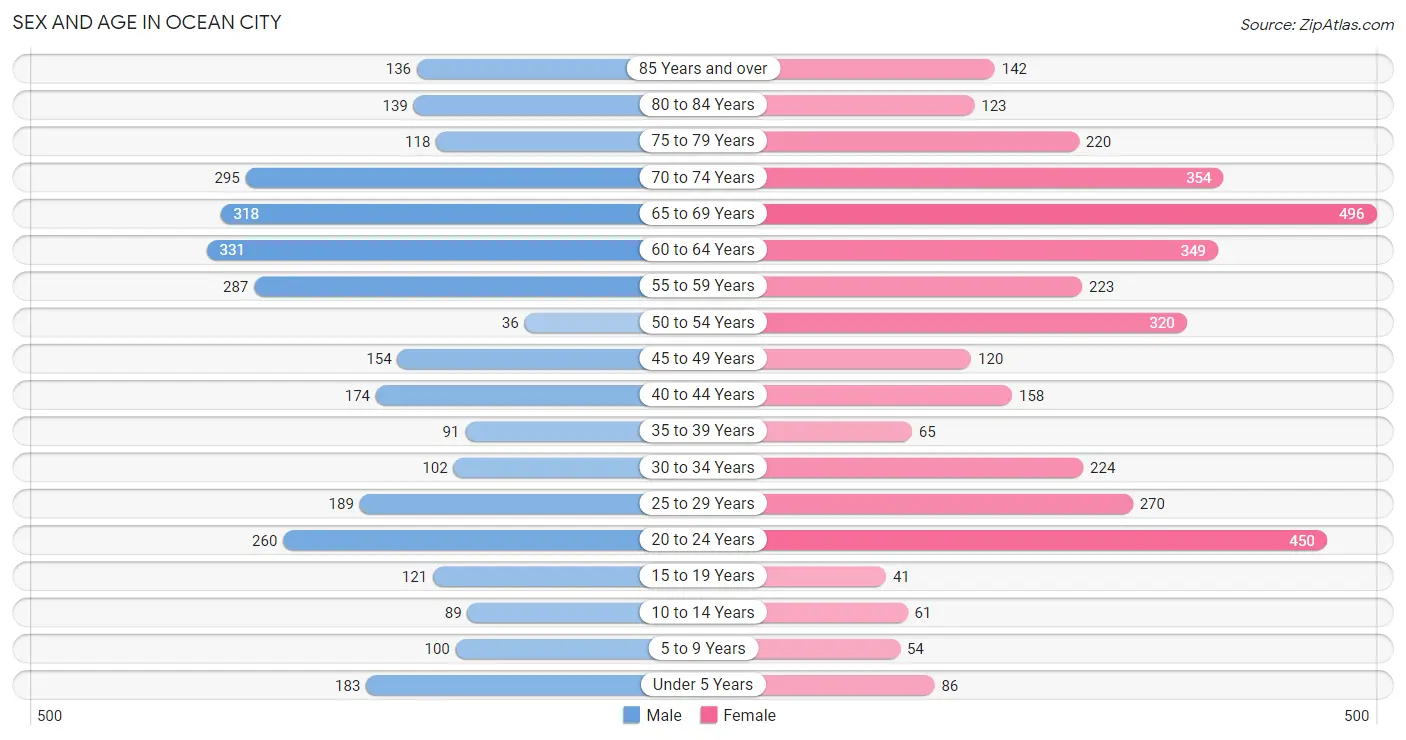
The most populous age groups in Ocean City are 60 to 64 Years (331 | 10.6%) for men and 65 to 69 Years (496 | 13.2%) for women.
| Age Bracket | Male | Female |
| Under 5 Years | 183 (5.9%) | 86 (2.3%) |
| 5 to 9 Years | 100 (3.2%) | 54 (1.4%) |
| 10 to 14 Years | 89 (2.9%) | 61 (1.6%) |
| 15 to 19 Years | 121 (3.9%) | 41 (1.1%) |
| 20 to 24 Years | 260 (8.3%) | 450 (12.0%) |
| 25 to 29 Years | 189 (6.0%) | 270 (7.2%) |
| 30 to 34 Years | 102 (3.3%) | 224 (6.0%) |
| 35 to 39 Years | 91 (2.9%) | 65 (1.7%) |
| 40 to 44 Years | 174 (5.6%) | 158 (4.2%) |
| 45 to 49 Years | 154 (4.9%) | 120 (3.2%) |
| 50 to 54 Years | 36 (1.1%) | 320 (8.5%) |
| 55 to 59 Years | 287 (9.2%) | 223 (5.9%) |
| 60 to 64 Years | 331 (10.6%) | 349 (9.3%) |
| 65 to 69 Years | 318 (10.2%) | 496 (13.2%) |
| 70 to 74 Years | 295 (9.5%) | 354 (9.4%) |
| 75 to 79 Years | 118 (3.8%) | 220 (5.9%) |
| 80 to 84 Years | 139 (4.4%) | 123 (3.3%) |
| 85 Years and over | 136 (4.3%) | 142 (3.8%) |
| Total | 3,123 (100.0%) | 3,756 (100.0%) |
Families and Households in Ocean City
Median Family Size in Ocean City
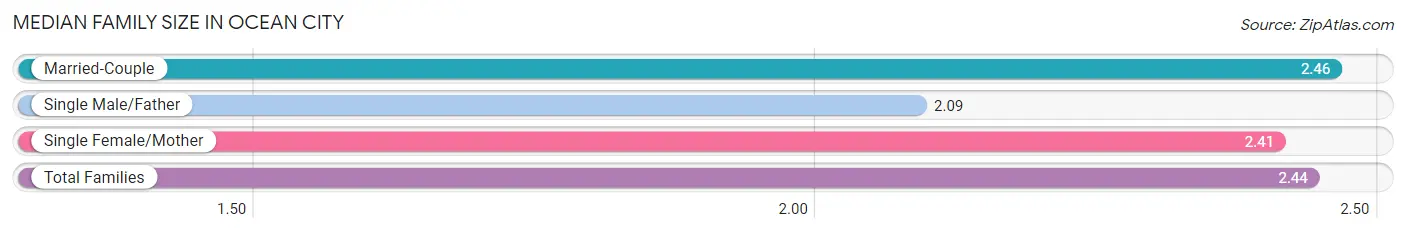
The median family size in Ocean City is 2.44 persons per family, with married-couple families (1,399 | 75.2%) accounting for the largest median family size of 2.46 persons per family. On the other hand, single male/father families (44 | 2.4%) represent the smallest median family size with 2.09 persons per family.
| Family Type | # Families | Family Size |
| Married-Couple | 1,399 (75.2%) | 2.46 |
| Single Male/Father | 44 (2.4%) | 2.09 |
| Single Female/Mother | 417 (22.4%) | 2.41 |
| Total Families | 1,860 (100.0%) | 2.44 |
Median Household Size in Ocean City
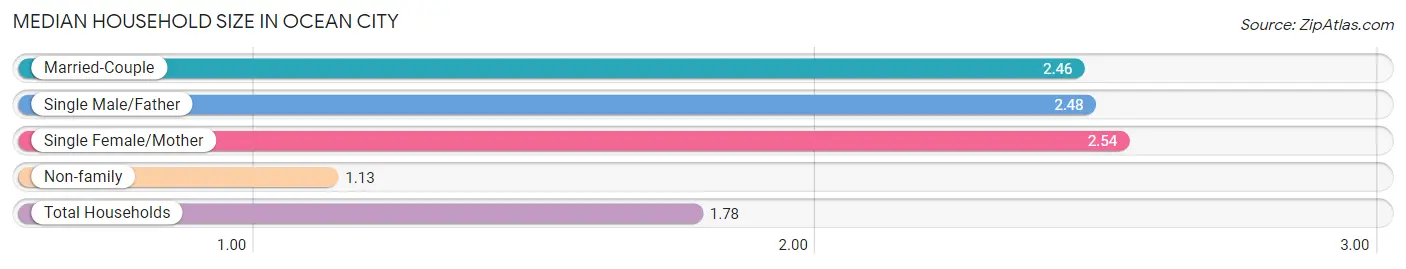
The median household size in Ocean City is 1.78 persons per household, with single female/mother households (417 | 10.9%) accounting for the largest median household size of 2.54 persons per household. non-family households (1,965 | 51.4%) represent the smallest median household size with 1.13 persons per household.
| Household Type | # Households | Household Size |
| Married-Couple | 1,399 (36.6%) | 2.46 |
| Single Male/Father | 44 (1.1%) | 2.48 |
| Single Female/Mother | 417 (10.9%) | 2.54 |
| Non-family | 1,965 (51.4%) | 1.13 |
| Total Households | 3,825 (100.0%) | 1.78 |
Household Size by Marriage Status in Ocean City
Out of a total of 3,825 households in Ocean City, 1,860 (48.6%) are family households, while 1,965 (51.4%) are nonfamily households. The most numerous type of family households are 2-person households, comprising 1,236, and the most common type of nonfamily households are 1-person households, comprising 1,722.
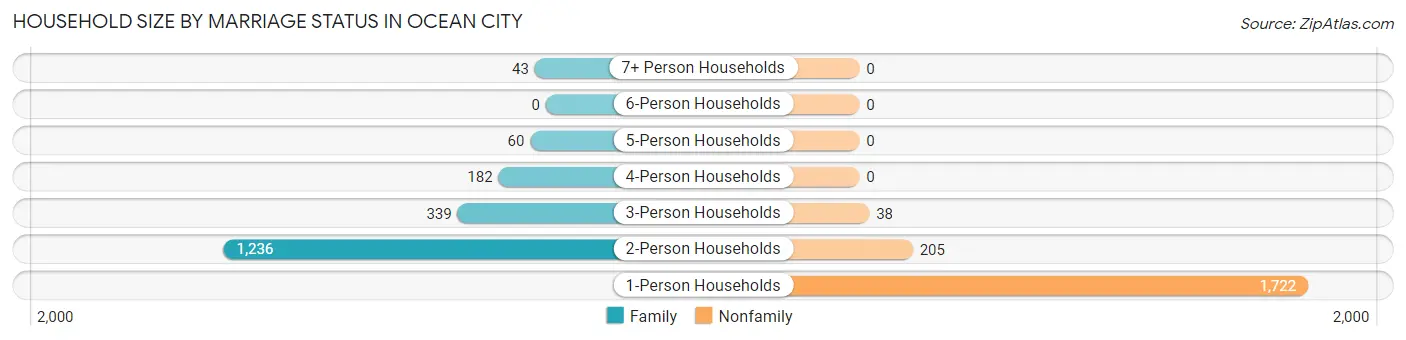
| Household Size | Family Households | Nonfamily Households |
| 1-Person Households | - | 1,722 (45.0%) |
| 2-Person Households | 1,236 (32.3%) | 205 (5.4%) |
| 3-Person Households | 339 (8.9%) | 38 (1.0%) |
| 4-Person Households | 182 (4.8%) | 0 (0.0%) |
| 5-Person Households | 60 (1.6%) | 0 (0.0%) |
| 6-Person Households | 0 (0.0%) | 0 (0.0%) |
| 7+ Person Households | 43 (1.1%) | 0 (0.0%) |
| Total | 1,860 (48.6%) | 1,965 (51.4%) |
Female Fertility in Ocean City
Fertility by Age in Ocean City
Average fertility rate in Ocean City is 74.0 births per 1,000 women. Women in the age bracket of 20 to 34 years have the highest fertility rate with 105.0 births per 1,000 women. Women in the age bracket of 20 to 34 years acount for 100.0% of all women with births.
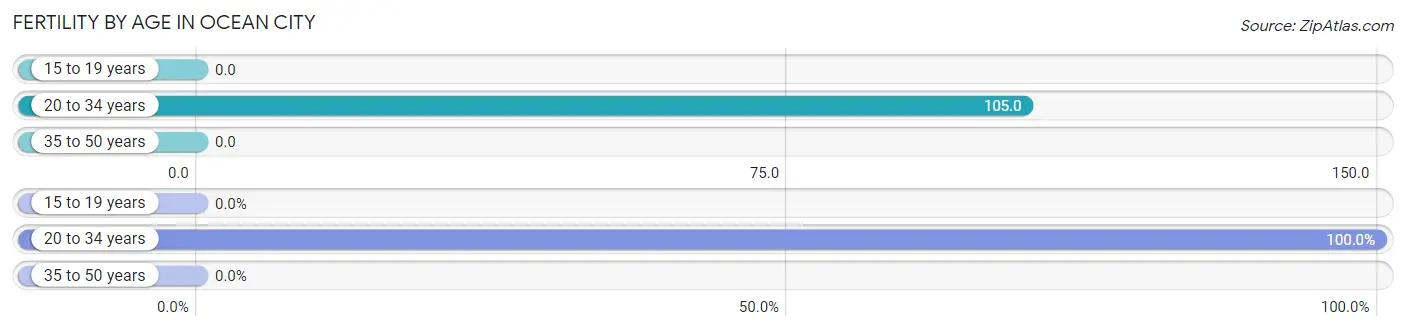
| Age Bracket | Women with Births | Births / 1,000 Women |
| 15 to 19 years | 0 (0.0%) | 0.0 |
| 20 to 34 years | 99 (100.0%) | 105.0 |
| 35 to 50 years | 0 (0.0%) | 0.0 |
| Total | 99 (100.0%) | 74.0 |
Fertility by Age by Marriage Status in Ocean City
97.0% of women with births (99) in Ocean City are married. The highest percentage of unmarried women with births falls into 20 to 34 years age bracket with 3.0% of them unmarried at the time of birth, while the lowest percentage of unmarried women with births belong to 20 to 34 years age bracket with 3.0% of them unmarried.
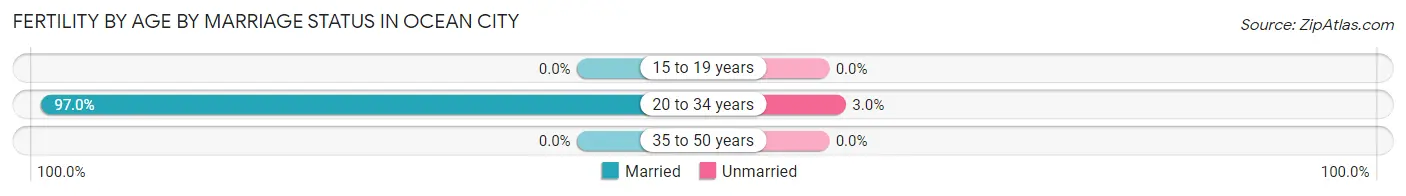
| Age Bracket | Married | Unmarried |
| 15 to 19 years | 0 (0.0%) | 0 (0.0%) |
| 20 to 34 years | 96 (97.0%) | 3 (3.0%) |
| 35 to 50 years | 0 (0.0%) | 0 (0.0%) |
| Total | 96 (97.0%) | 3 (3.0%) |
Fertility by Education in Ocean City
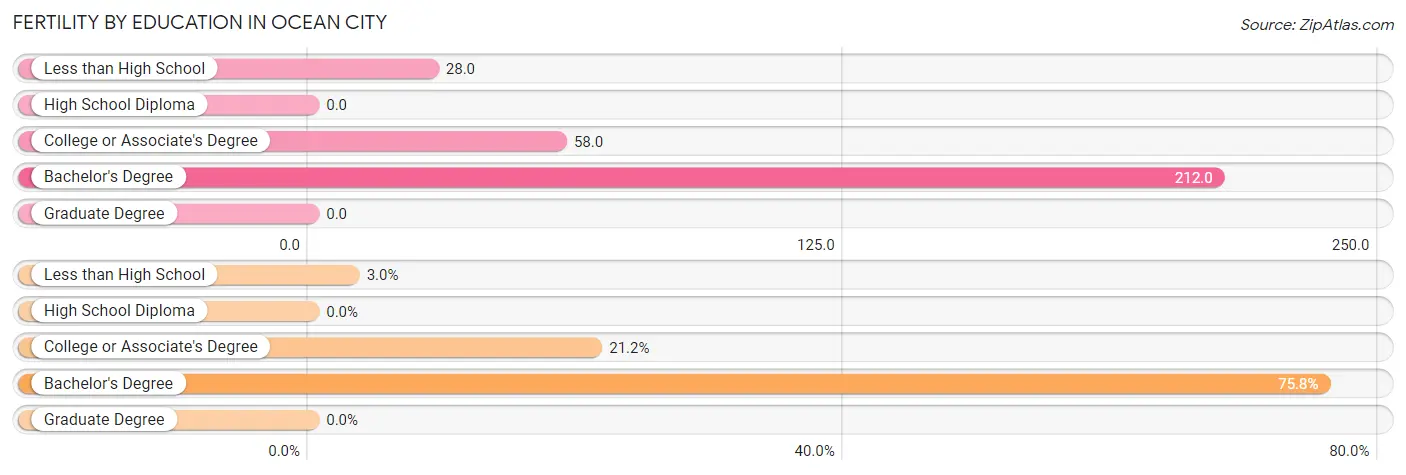
| Educational Attainment | Women with Births | Births / 1,000 Women |
| Less than High School | 3 (3.0%) | 28.0 |
| High School Diploma | 0 (0.0%) | 0.0 |
| College or Associate's Degree | 21 (21.2%) | 58.0 |
| Bachelor's Degree | 75 (75.8%) | 212.0 |
| Graduate Degree | 0 (0.0%) | 0.0 |
| Total | 99 (100.0%) | 74.0 |
Fertility by Education by Marriage Status in Ocean City
3.0% of women with births in Ocean City are unmarried. Women with the educational attainment of college or associate's degree are most likely to be married with 100.0% of them married at childbirth, while women with the educational attainment of less than high school are least likely to be married with 100.0% of them unmarried at childbirth.
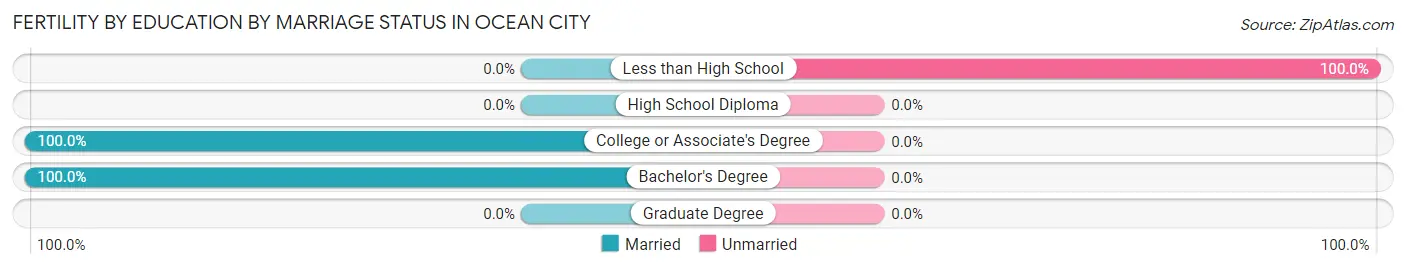
| Educational Attainment | Married | Unmarried |
| Less than High School | 0 (0.0%) | 3 (100.0%) |
| High School Diploma | 0 (0.0%) | 0 (0.0%) |
| College or Associate's Degree | 21 (100.0%) | 0 (0.0%) |
| Bachelor's Degree | 75 (100.0%) | 0 (0.0%) |
| Graduate Degree | 0 (0.0%) | 0 (0.0%) |
| Total | 96 (97.0%) | 3 (3.0%) |
Employment Characteristics in Ocean City
Employment by Class of Employer in Ocean City
Among the 3,681 employed individuals in Ocean City, private company employees (2,211 | 60.1%), self-employed (incorporated) (568 | 15.4%), and self-employed (not incorporated) (312 | 8.5%) make up the most common classes of employment.
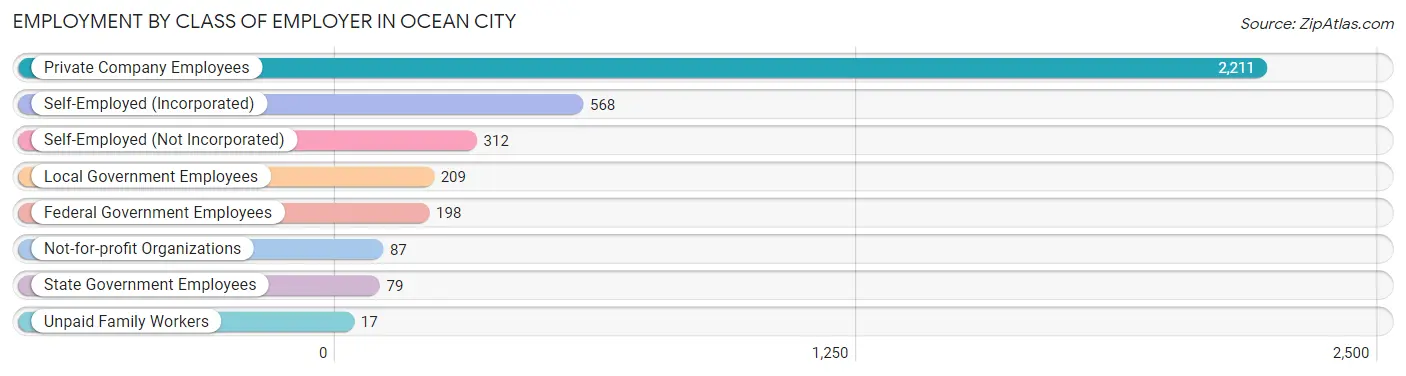
| Employer Class | # Employees | % Employees |
| Private Company Employees | 2,211 | 60.1% |
| Self-Employed (Incorporated) | 568 | 15.4% |
| Self-Employed (Not Incorporated) | 312 | 8.5% |
| Not-for-profit Organizations | 87 | 2.4% |
| Local Government Employees | 209 | 5.7% |
| State Government Employees | 79 | 2.1% |
| Federal Government Employees | 198 | 5.4% |
| Unpaid Family Workers | 17 | 0.5% |
| Total | 3,681 | 100.0% |
Employment Status by Age in Ocean City
According to the labor force statistics for Ocean City, out of the total population over 16 years of age (6,278), 62.3% or 3,911 individuals are in the labor force, with 3.6% or 141 of them unemployed. The age group with the highest labor force participation rate is 30 to 34 years, with 100.0% or 326 individuals in the labor force. Within the labor force, the 16 to 19 years age range has the highest percentage of unemployed individuals, with 18.3% or 11 of them being unemployed.
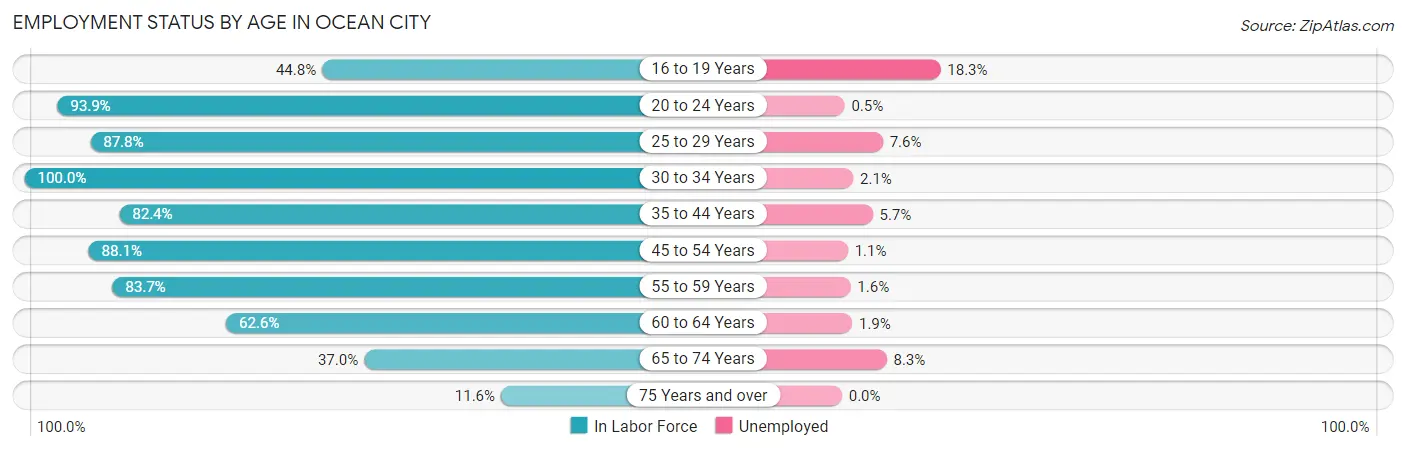
| Age Bracket | In Labor Force | Unemployed |
| 16 to 19 Years | 60 (44.8%) | 11 (18.3%) |
| 20 to 24 Years | 667 (93.9%) | 3 (0.5%) |
| 25 to 29 Years | 403 (87.8%) | 31 (7.6%) |
| 30 to 34 Years | 326 (100.0%) | 7 (2.1%) |
| 35 to 44 Years | 402 (82.4%) | 23 (5.7%) |
| 45 to 54 Years | 555 (88.1%) | 6 (1.1%) |
| 55 to 59 Years | 427 (83.7%) | 7 (1.6%) |
| 60 to 64 Years | 426 (62.6%) | 8 (1.9%) |
| 65 to 74 Years | 541 (37.0%) | 45 (8.3%) |
| 75 Years and over | 102 (11.6%) | 0 (0.0%) |
| Total | 3,911 (62.3%) | 141 (3.6%) |
Employment Status by Educational Attainment in Ocean City
According to labor force statistics for Ocean City, 82.1% of individuals (2,539) out of the total population between 25 and 64 years of age (3,093) are in the labor force, with 3.2% or 81 of them being unemployed. The group with the highest labor force participation rate are those with the educational attainment of high school diploma, with 84.8% or 623 individuals in the labor force. Within the labor force, individuals with less than high school education have the highest percentage of unemployment, with 14.3% or 9 of them being unemployed.
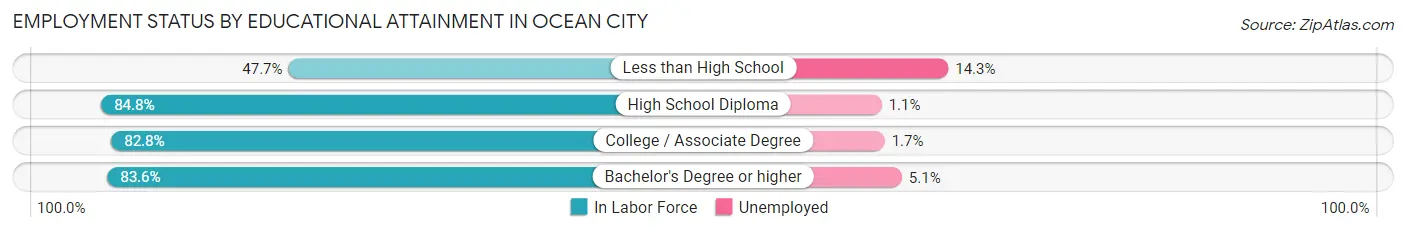
| Educational Attainment | In Labor Force | Unemployed |
| Less than High School | 63 (47.7%) | 19 (14.3%) |
| High School Diploma | 623 (84.8%) | 8 (1.1%) |
| College / Associate Degree | 847 (82.8%) | 17 (1.7%) |
| Bachelor's Degree or higher | 1,006 (83.6%) | 61 (5.1%) |
| Total | 2,539 (82.1%) | 99 (3.2%) |
Employment Occupations by Sex in Ocean City
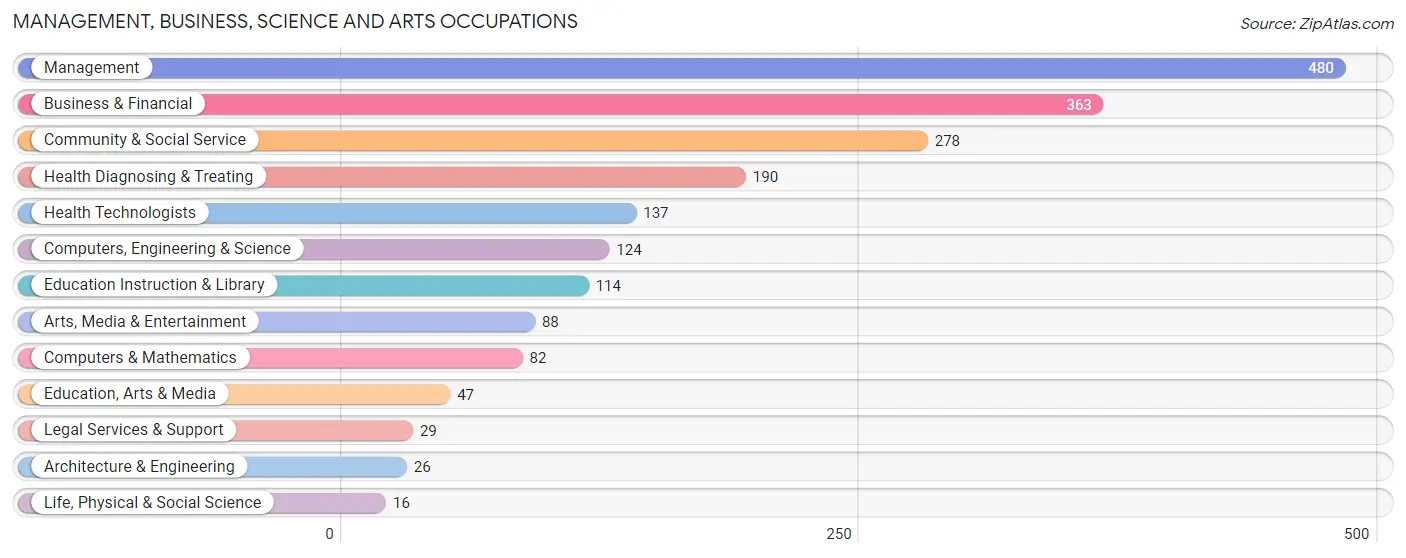
Management, Business, Science and Arts Occupations
The most common Management, Business, Science and Arts occupations in Ocean City are Management (480 | 12.8%), Business & Financial (363 | 9.7%), Community & Social Service (278 | 7.4%), Health Diagnosing & Treating (190 | 5.1%), and Health Technologists (137 | 3.7%).
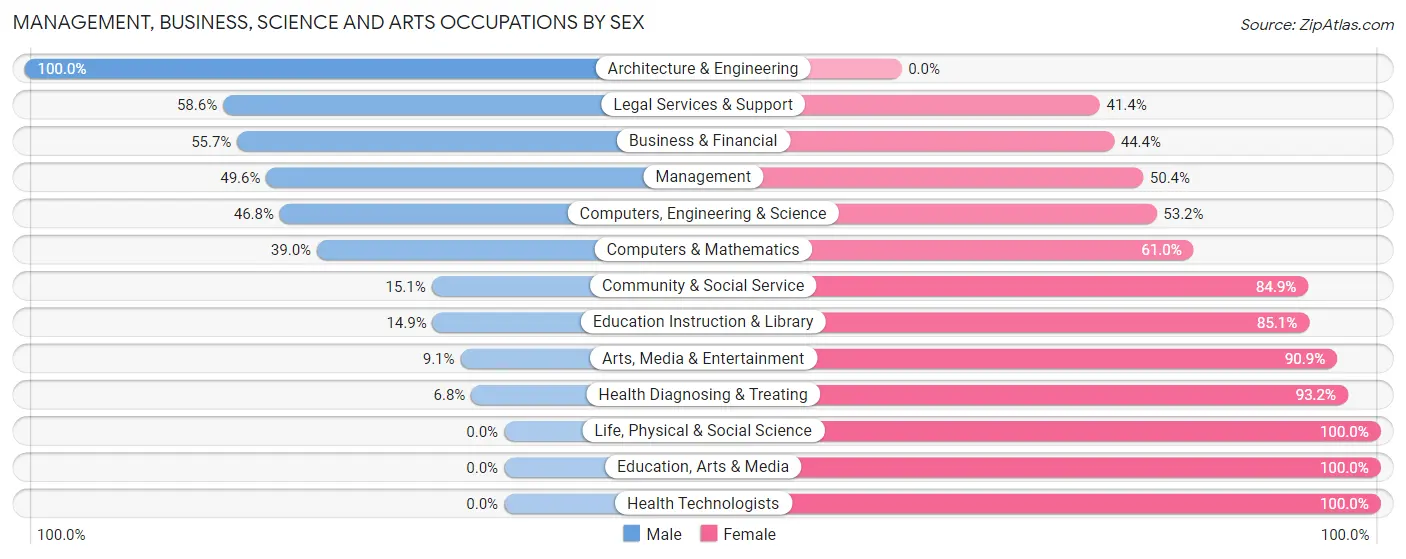
Management, Business, Science and Arts Occupations by Sex
Within the Management, Business, Science and Arts occupations in Ocean City, the most male-oriented occupations are Architecture & Engineering (100.0%), Legal Services & Support (58.6%), and Business & Financial (55.6%), while the most female-oriented occupations are Life, Physical & Social Science (100.0%), Education, Arts & Media (100.0%), and Health Technologists (100.0%).
| Occupation | Male | Female |
| Management | 238 (49.6%) | 242 (50.4%) |
| Business & Financial | 202 (55.6%) | 161 (44.4%) |
| Computers, Engineering & Science | 58 (46.8%) | 66 (53.2%) |
| Computers & Mathematics | 32 (39.0%) | 50 (61.0%) |
| Architecture & Engineering | 26 (100.0%) | 0 (0.0%) |
| Life, Physical & Social Science | 0 (0.0%) | 16 (100.0%) |
| Community & Social Service | 42 (15.1%) | 236 (84.9%) |
| Education, Arts & Media | 0 (0.0%) | 47 (100.0%) |
| Legal Services & Support | 17 (58.6%) | 12 (41.4%) |
| Education Instruction & Library | 17 (14.9%) | 97 (85.1%) |
| Arts, Media & Entertainment | 8 (9.1%) | 80 (90.9%) |
| Health Diagnosing & Treating | 13 (6.8%) | 177 (93.2%) |
| Health Technologists | 0 (0.0%) | 137 (100.0%) |
| Total (Category) | 553 (38.5%) | 882 (61.5%) |
| Total (Overall) | 1,612 (43.0%) | 2,134 (57.0%) |
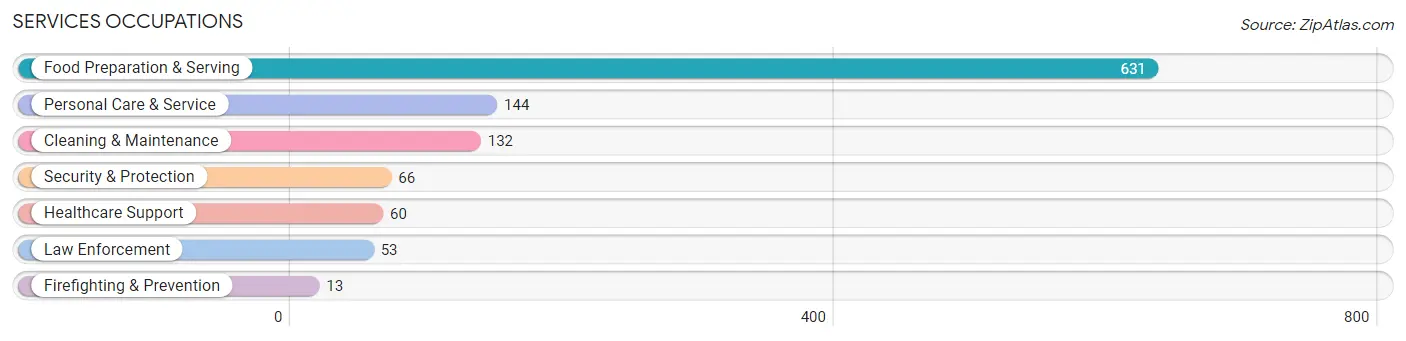
Services Occupations
The most common Services occupations in Ocean City are Food Preparation & Serving (631 | 16.8%), Personal Care & Service (144 | 3.8%), Cleaning & Maintenance (132 | 3.5%), Security & Protection (66 | 1.8%), and Healthcare Support (60 | 1.6%).
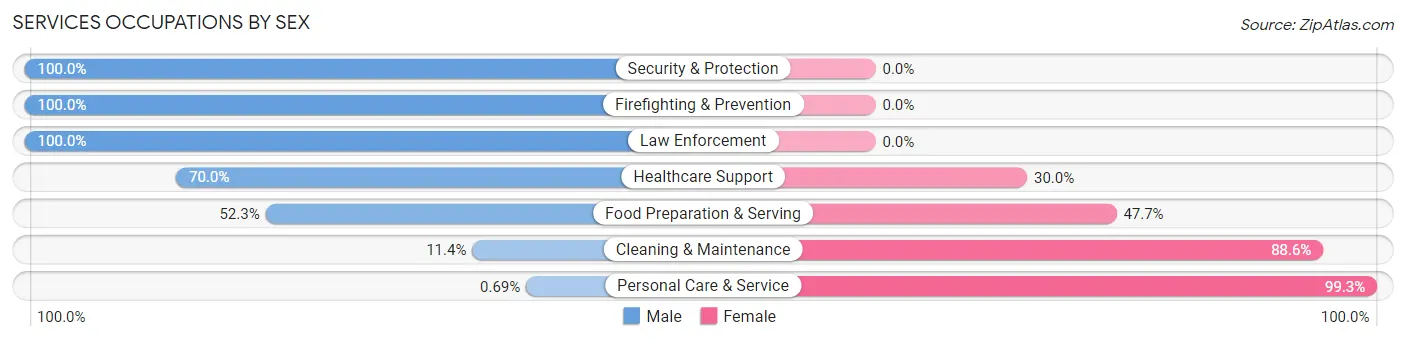
Services Occupations by Sex
Within the Services occupations in Ocean City, the most male-oriented occupations are Security & Protection (100.0%), Firefighting & Prevention (100.0%), and Law Enforcement (100.0%), while the most female-oriented occupations are Personal Care & Service (99.3%), Cleaning & Maintenance (88.6%), and Food Preparation & Serving (47.7%).
| Occupation | Male | Female |
| Healthcare Support | 42 (70.0%) | 18 (30.0%) |
| Security & Protection | 66 (100.0%) | 0 (0.0%) |
| Firefighting & Prevention | 13 (100.0%) | 0 (0.0%) |
| Law Enforcement | 53 (100.0%) | 0 (0.0%) |
| Food Preparation & Serving | 330 (52.3%) | 301 (47.7%) |
| Cleaning & Maintenance | 15 (11.4%) | 117 (88.6%) |
| Personal Care & Service | 1 (0.7%) | 143 (99.3%) |
| Total (Category) | 454 (44.0%) | 579 (56.0%) |
| Total (Overall) | 1,612 (43.0%) | 2,134 (57.0%) |
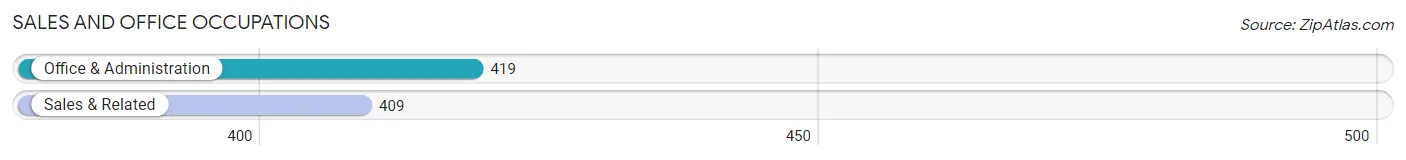
Sales and Office Occupations
The most common Sales and Office occupations in Ocean City are Office & Administration (419 | 11.2%), and Sales & Related (409 | 10.9%).
Sales and Office Occupations by Sex
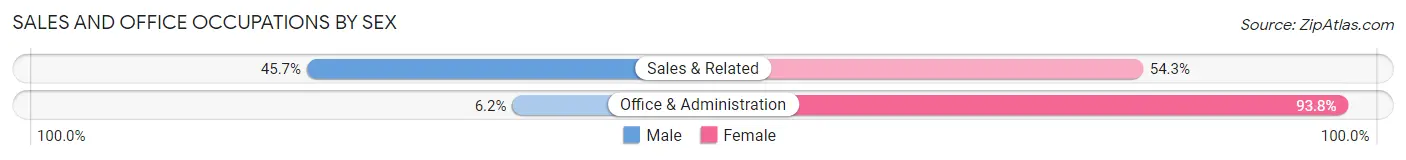
| Occupation | Male | Female |
| Sales & Related | 187 (45.7%) | 222 (54.3%) |
| Office & Administration | 26 (6.2%) | 393 (93.8%) |
| Total (Category) | 213 (25.7%) | 615 (74.3%) |
| Total (Overall) | 1,612 (43.0%) | 2,134 (57.0%) |
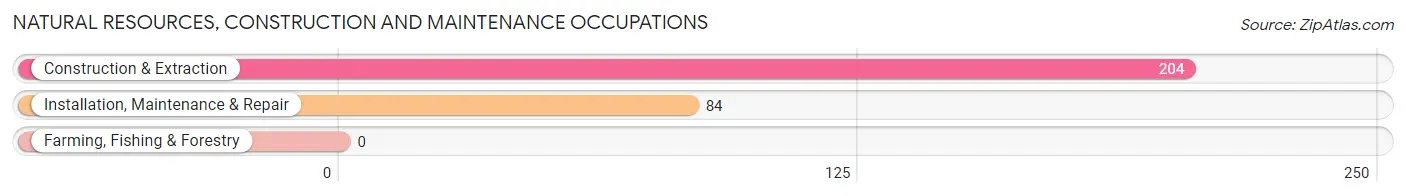
Natural Resources, Construction and Maintenance Occupations
The most common Natural Resources, Construction and Maintenance occupations in Ocean City are Construction & Extraction (204 | 5.4%), and Installation, Maintenance & Repair (84 | 2.2%).
Natural Resources, Construction and Maintenance Occupations by Sex
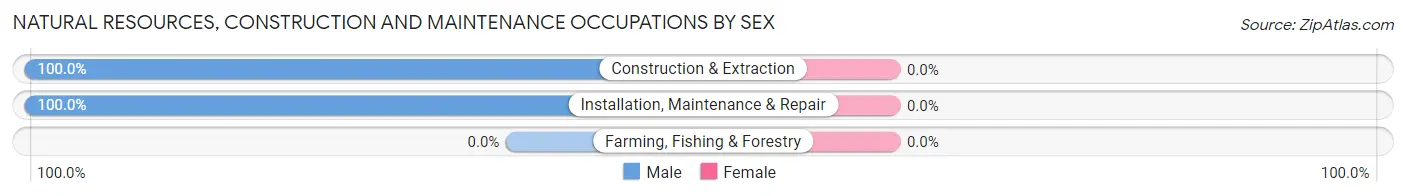
| Occupation | Male | Female |
| Farming, Fishing & Forestry | 0 (0.0%) | 0 (0.0%) |
| Construction & Extraction | 204 (100.0%) | 0 (0.0%) |
| Installation, Maintenance & Repair | 84 (100.0%) | 0 (0.0%) |
| Total (Category) | 288 (100.0%) | 0 (0.0%) |
| Total (Overall) | 1,612 (43.0%) | 2,134 (57.0%) |
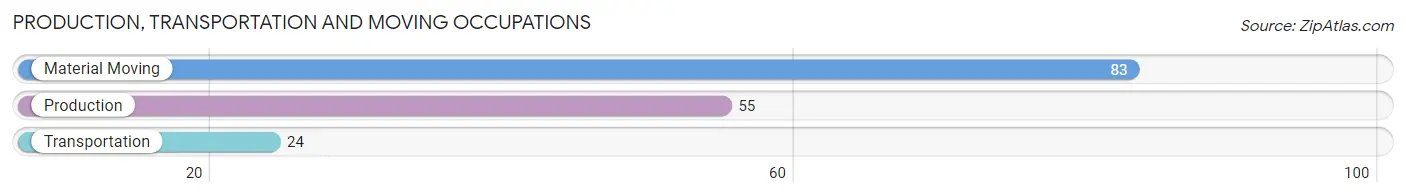
Production, Transportation and Moving Occupations
The most common Production, Transportation and Moving occupations in Ocean City are Material Moving (83 | 2.2%), Production (55 | 1.5%), and Transportation (24 | 0.6%).
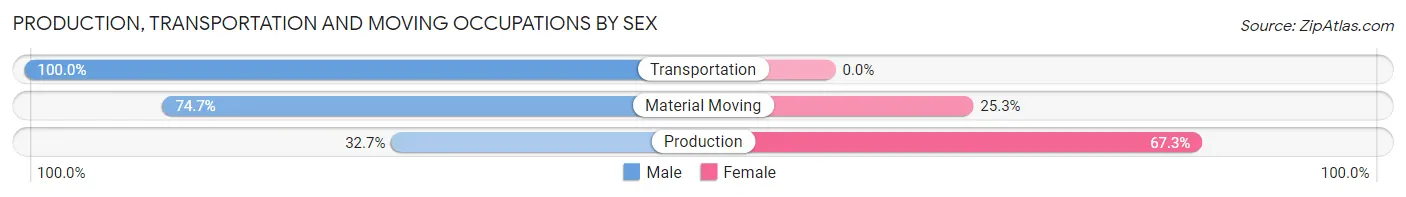
Production, Transportation and Moving Occupations by Sex
| Occupation | Male | Female |
| Production | 18 (32.7%) | 37 (67.3%) |
| Transportation | 24 (100.0%) | 0 (0.0%) |
| Material Moving | 62 (74.7%) | 21 (25.3%) |
| Total (Category) | 104 (64.2%) | 58 (35.8%) |
| Total (Overall) | 1,612 (43.0%) | 2,134 (57.0%) |
Employment Industries by Sex in Ocean City
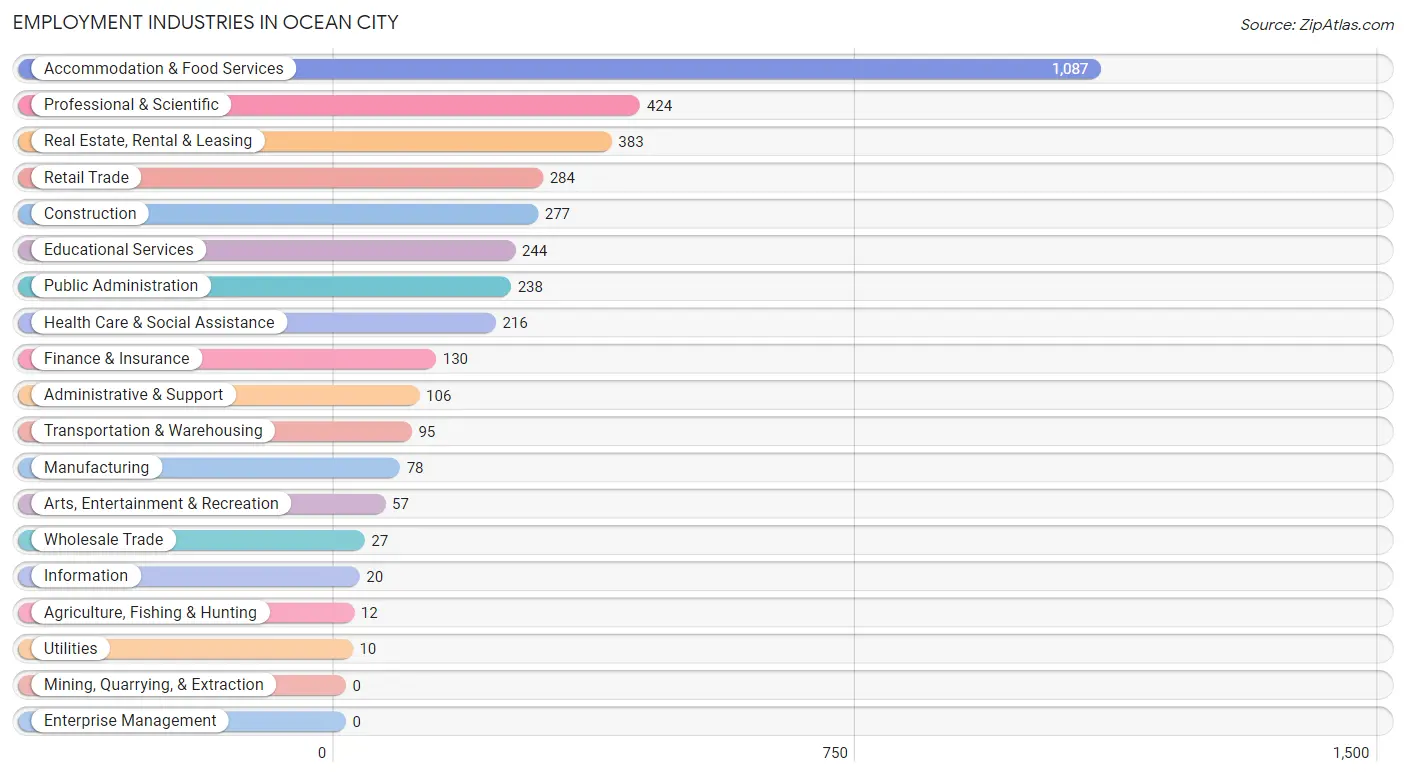
Employment Industries in Ocean City
The major employment industries in Ocean City include Accommodation & Food Services (1,087 | 29.0%), Professional & Scientific (424 | 11.3%), Real Estate, Rental & Leasing (383 | 10.2%), Retail Trade (284 | 7.6%), and Construction (277 | 7.4%).
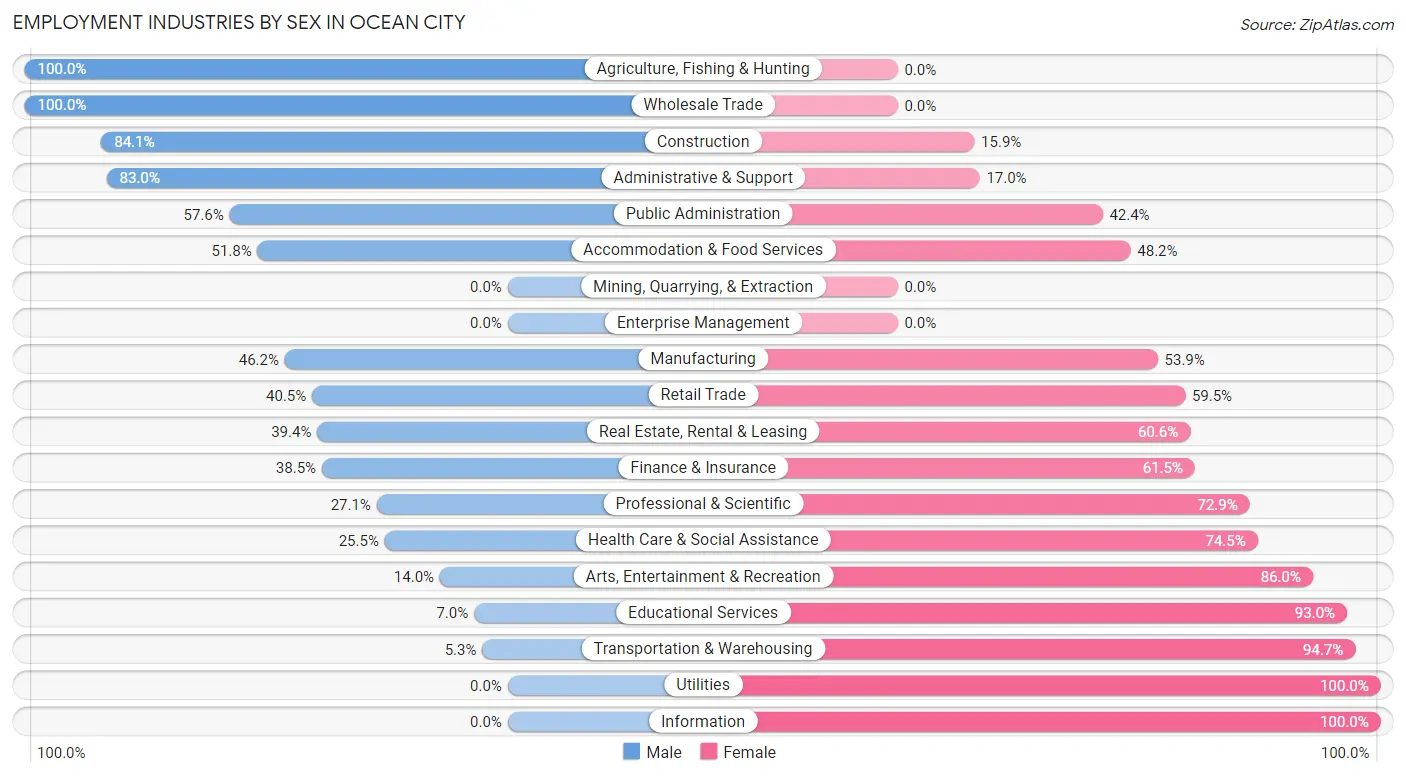
Employment Industries by Sex in Ocean City
The Ocean City industries that see more men than women are Agriculture, Fishing & Hunting (100.0%), Wholesale Trade (100.0%), and Construction (84.1%), whereas the industries that tend to have a higher number of women are Utilities (100.0%), Information (100.0%), and Transportation & Warehousing (94.7%).
| Industry | Male | Female |
| Agriculture, Fishing & Hunting | 12 (100.0%) | 0 (0.0%) |
| Mining, Quarrying, & Extraction | 0 (0.0%) | 0 (0.0%) |
| Construction | 233 (84.1%) | 44 (15.9%) |
| Manufacturing | 36 (46.2%) | 42 (53.8%) |
| Wholesale Trade | 27 (100.0%) | 0 (0.0%) |
| Retail Trade | 115 (40.5%) | 169 (59.5%) |
| Transportation & Warehousing | 5 (5.3%) | 90 (94.7%) |
| Utilities | 0 (0.0%) | 10 (100.0%) |
| Information | 0 (0.0%) | 20 (100.0%) |
| Finance & Insurance | 50 (38.5%) | 80 (61.5%) |
| Real Estate, Rental & Leasing | 151 (39.4%) | 232 (60.6%) |
| Professional & Scientific | 115 (27.1%) | 309 (72.9%) |
| Enterprise Management | 0 (0.0%) | 0 (0.0%) |
| Administrative & Support | 88 (83.0%) | 18 (17.0%) |
| Educational Services | 17 (7.0%) | 227 (93.0%) |
| Health Care & Social Assistance | 55 (25.5%) | 161 (74.5%) |
| Arts, Entertainment & Recreation | 8 (14.0%) | 49 (86.0%) |
| Accommodation & Food Services | 563 (51.8%) | 524 (48.2%) |
| Public Administration | 137 (57.6%) | 101 (42.4%) |
| Total | 1,612 (43.0%) | 2,134 (57.0%) |
Education in Ocean City
School Enrollment in Ocean City
The most common levels of schooling among the 957 students in Ocean City are college / undergraduate (458 | 47.9%), high school (162 | 16.9%), and elementary school (154 | 16.1%).
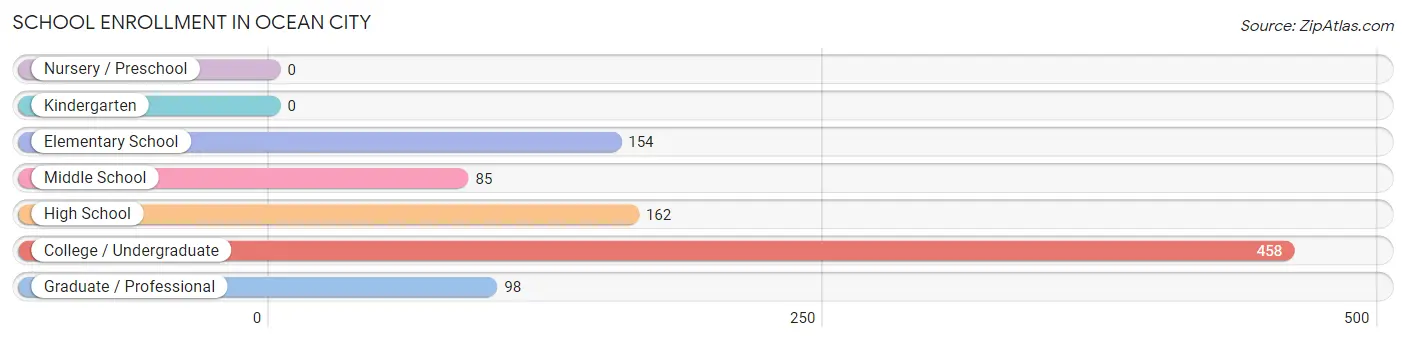
| School Level | # Students | % Students |
| Nursery / Preschool | 0 | 0.0% |
| Kindergarten | 0 | 0.0% |
| Elementary School | 154 | 16.1% |
| Middle School | 85 | 8.9% |
| High School | 162 | 16.9% |
| College / Undergraduate | 458 | 47.9% |
| Graduate / Professional | 98 | 10.2% |
| Total | 957 | 100.0% |
School Enrollment by Age by Funding Source in Ocean City
Out of a total of 957 students who are enrolled in schools in Ocean City, 121 (12.6%) attend a private institution, while the remaining 836 (87.4%) are enrolled in public schools. The age group of 35 years and over has the highest likelihood of being enrolled in private schools, with 24 (75.0% in the age bracket) enrolled. Conversely, the age group of 5 to 9 year old has the lowest likelihood of being enrolled in a private school, with 154 (100.0% in the age bracket) attending a public institution.
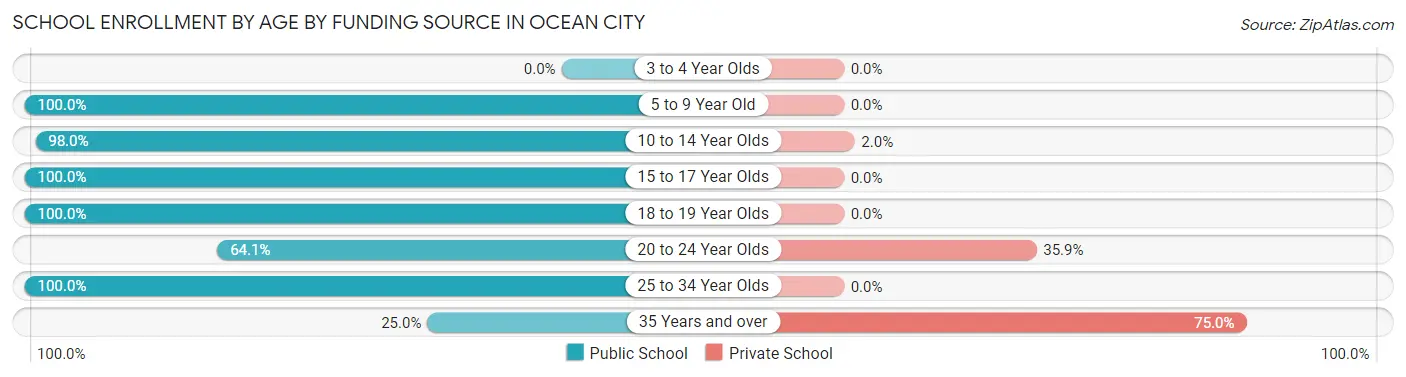
| Age Bracket | Public School | Private School |
| 3 to 4 Year Olds | 0 (0.0%) | 0 (0.0%) |
| 5 to 9 Year Old | 154 (100.0%) | 0 (0.0%) |
| 10 to 14 Year Olds | 147 (98.0%) | 3 (2.0%) |
| 15 to 17 Year Olds | 93 (100.0%) | 0 (0.0%) |
| 18 to 19 Year Olds | 40 (100.0%) | 0 (0.0%) |
| 20 to 24 Year Olds | 168 (64.1%) | 94 (35.9%) |
| 25 to 34 Year Olds | 226 (100.0%) | 0 (0.0%) |
| 35 Years and over | 8 (25.0%) | 24 (75.0%) |
| Total | 836 (87.4%) | 121 (12.6%) |
Educational Attainment by Field of Study in Ocean City
Education (434 | 18.8%), business (415 | 18.0%), science & technology (232 | 10.1%), social sciences (212 | 9.2%), and arts & humanities (170 | 7.4%) are the most common fields of study among 2,304 individuals in Ocean City who have obtained a bachelor's degree or higher.
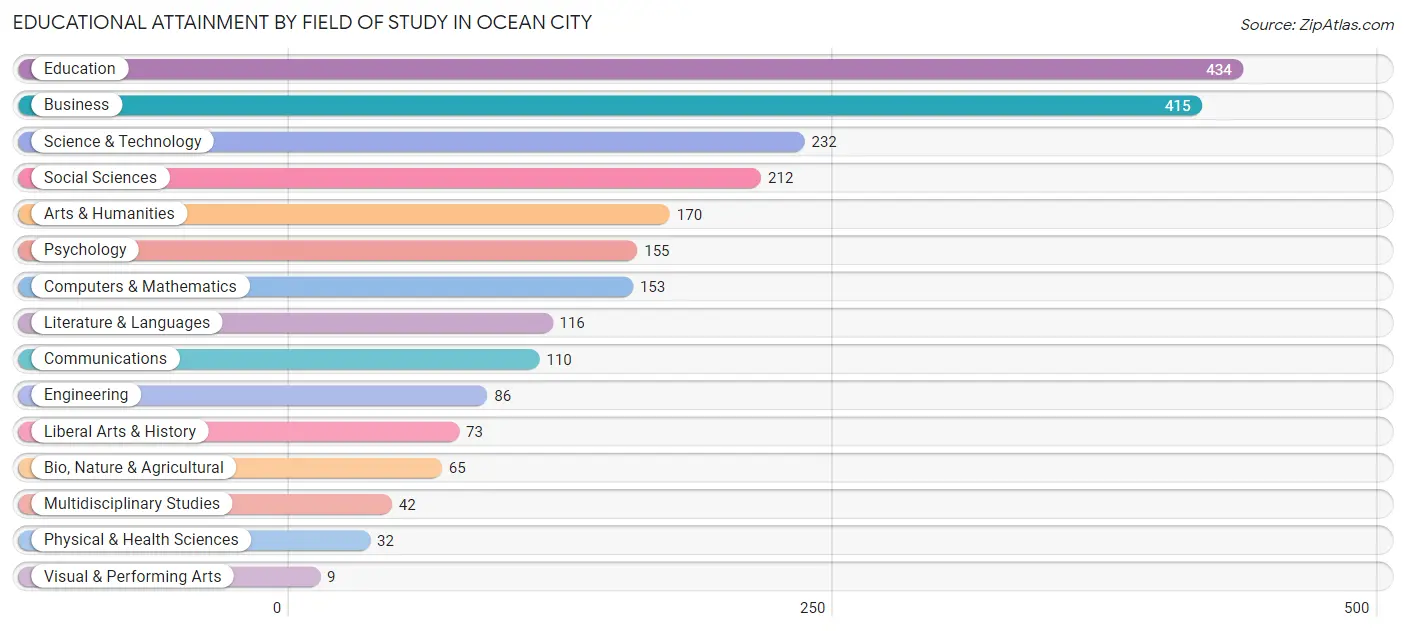
| Field of Study | # Graduates | % Graduates |
| Computers & Mathematics | 153 | 6.6% |
| Bio, Nature & Agricultural | 65 | 2.8% |
| Physical & Health Sciences | 32 | 1.4% |
| Psychology | 155 | 6.7% |
| Social Sciences | 212 | 9.2% |
| Engineering | 86 | 3.7% |
| Multidisciplinary Studies | 42 | 1.8% |
| Science & Technology | 232 | 10.1% |
| Business | 415 | 18.0% |
| Education | 434 | 18.8% |
| Literature & Languages | 116 | 5.0% |
| Liberal Arts & History | 73 | 3.2% |
| Visual & Performing Arts | 9 | 0.4% |
| Communications | 110 | 4.8% |
| Arts & Humanities | 170 | 7.4% |
| Total | 2,304 | 100.0% |
Transportation & Commute in Ocean City
Vehicle Availability by Sex in Ocean City
The most prevalent vehicle ownership categories in Ocean City are males with 2 vehicles (827, accounting for 50.6%) and females with 2 vehicles (950, making up 40.8%).
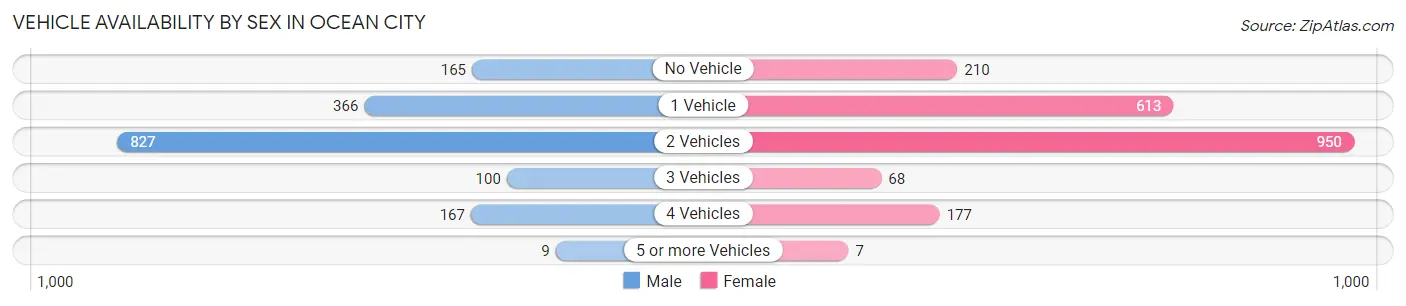
| Vehicles Available | Male | Female |
| No Vehicle | 165 (10.1%) | 210 (10.4%) |
| 1 Vehicle | 366 (22.4%) | 613 (30.3%) |
| 2 Vehicles | 827 (50.6%) | 950 (46.9%) |
| 3 Vehicles | 100 (6.1%) | 68 (3.4%) |
| 4 Vehicles | 167 (10.2%) | 177 (8.7%) |
| 5 or more Vehicles | 9 (0.5%) | 7 (0.4%) |
| Total | 1,634 (100.0%) | 2,025 (100.0%) |
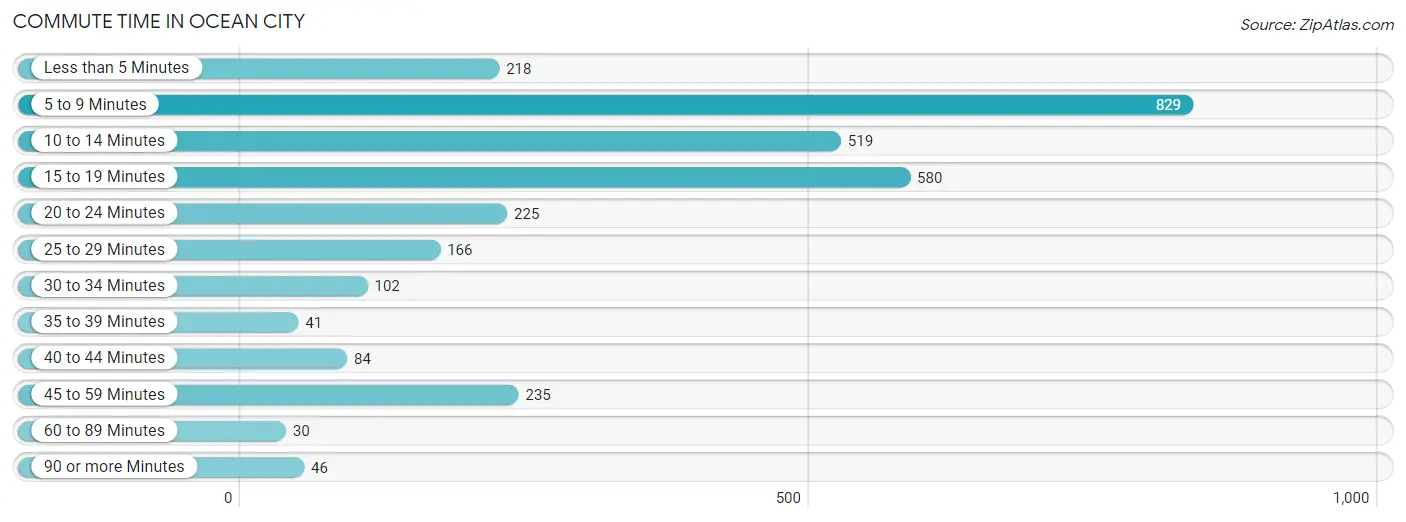
Commute Time in Ocean City
The most frequently occuring commute durations in Ocean City are 5 to 9 minutes (829 commuters, 27.0%), 15 to 19 minutes (580 commuters, 18.9%), and 10 to 14 minutes (519 commuters, 16.9%).
| Commute Time | # Commuters | % Commuters |
| Less than 5 Minutes | 218 | 7.1% |
| 5 to 9 Minutes | 829 | 27.0% |
| 10 to 14 Minutes | 519 | 16.9% |
| 15 to 19 Minutes | 580 | 18.9% |
| 20 to 24 Minutes | 225 | 7.3% |
| 25 to 29 Minutes | 166 | 5.4% |
| 30 to 34 Minutes | 102 | 3.3% |
| 35 to 39 Minutes | 41 | 1.3% |
| 40 to 44 Minutes | 84 | 2.7% |
| 45 to 59 Minutes | 235 | 7.6% |
| 60 to 89 Minutes | 30 | 1.0% |
| 90 or more Minutes | 46 | 1.5% |
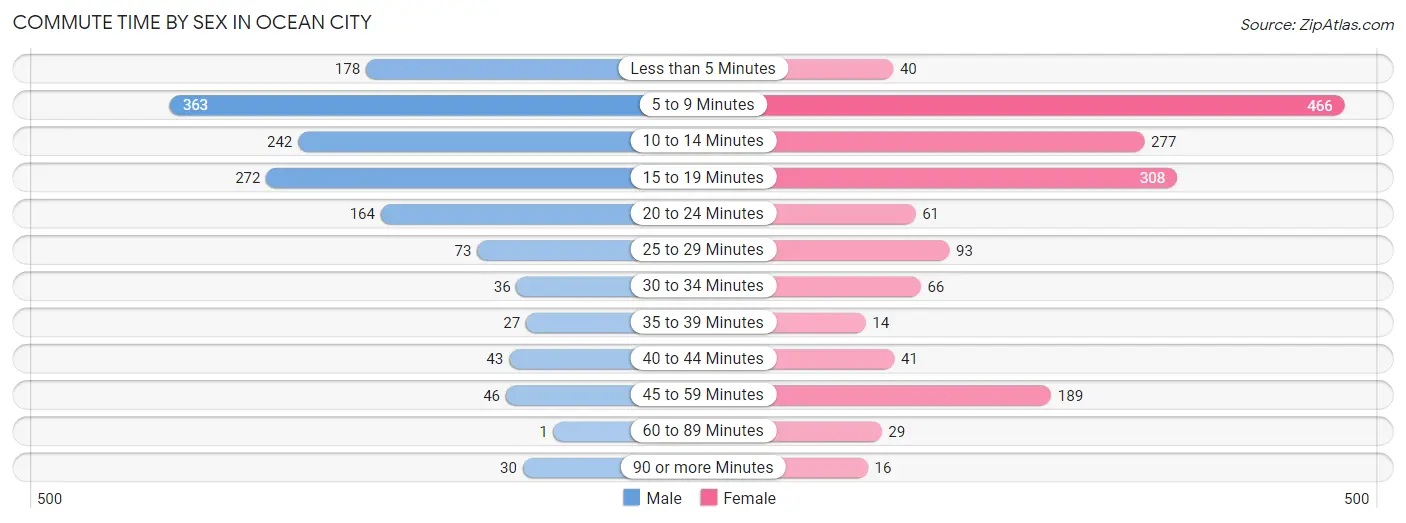
Commute Time by Sex in Ocean City
The most common commute times in Ocean City are 5 to 9 minutes (363 commuters, 24.6%) for males and 5 to 9 minutes (466 commuters, 29.1%) for females.
| Commute Time | Male | Female |
| Less than 5 Minutes | 178 (12.1%) | 40 (2.5%) |
| 5 to 9 Minutes | 363 (24.6%) | 466 (29.1%) |
| 10 to 14 Minutes | 242 (16.4%) | 277 (17.3%) |
| 15 to 19 Minutes | 272 (18.4%) | 308 (19.3%) |
| 20 to 24 Minutes | 164 (11.1%) | 61 (3.8%) |
| 25 to 29 Minutes | 73 (5.0%) | 93 (5.8%) |
| 30 to 34 Minutes | 36 (2.4%) | 66 (4.1%) |
| 35 to 39 Minutes | 27 (1.8%) | 14 (0.9%) |
| 40 to 44 Minutes | 43 (2.9%) | 41 (2.6%) |
| 45 to 59 Minutes | 46 (3.1%) | 189 (11.8%) |
| 60 to 89 Minutes | 1 (0.1%) | 29 (1.8%) |
| 90 or more Minutes | 30 (2.0%) | 16 (1.0%) |
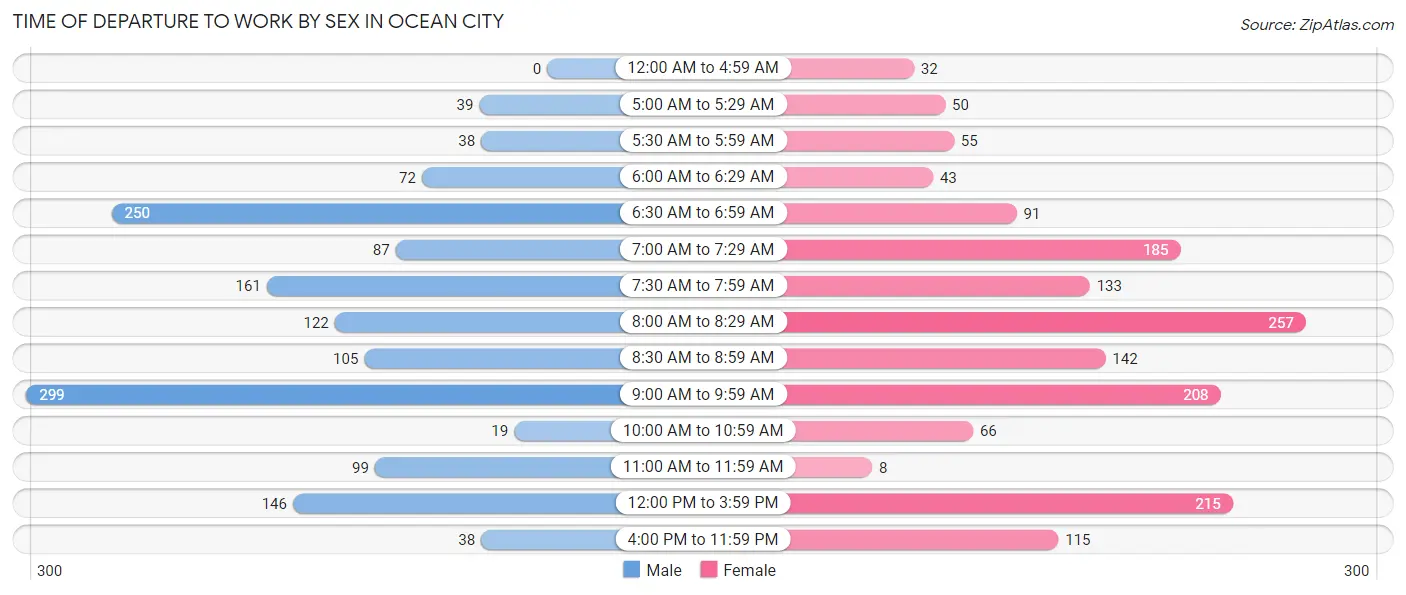
Time of Departure to Work by Sex in Ocean City
The most frequent times of departure to work in Ocean City are 9:00 AM to 9:59 AM (299, 20.3%) for males and 8:00 AM to 8:29 AM (257, 16.1%) for females.
| Time of Departure | Male | Female |
| 12:00 AM to 4:59 AM | 0 (0.0%) | 32 (2.0%) |
| 5:00 AM to 5:29 AM | 39 (2.6%) | 50 (3.1%) |
| 5:30 AM to 5:59 AM | 38 (2.6%) | 55 (3.4%) |
| 6:00 AM to 6:29 AM | 72 (4.9%) | 43 (2.7%) |
| 6:30 AM to 6:59 AM | 250 (17.0%) | 91 (5.7%) |
| 7:00 AM to 7:29 AM | 87 (5.9%) | 185 (11.6%) |
| 7:30 AM to 7:59 AM | 161 (10.9%) | 133 (8.3%) |
| 8:00 AM to 8:29 AM | 122 (8.3%) | 257 (16.1%) |
| 8:30 AM to 8:59 AM | 105 (7.1%) | 142 (8.9%) |
| 9:00 AM to 9:59 AM | 299 (20.3%) | 208 (13.0%) |
| 10:00 AM to 10:59 AM | 19 (1.3%) | 66 (4.1%) |
| 11:00 AM to 11:59 AM | 99 (6.7%) | 8 (0.5%) |
| 12:00 PM to 3:59 PM | 146 (9.9%) | 215 (13.4%) |
| 4:00 PM to 11:59 PM | 38 (2.6%) | 115 (7.2%) |
| Total | 1,475 (100.0%) | 1,600 (100.0%) |
Housing Occupancy in Ocean City
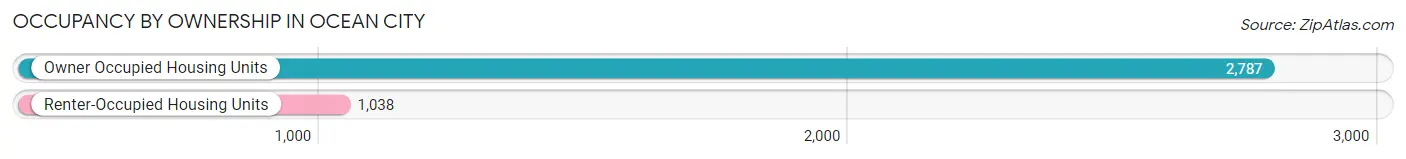
Occupancy by Ownership in Ocean City
Of the total 3,825 dwellings in Ocean City, owner-occupied units account for 2,787 (72.9%), while renter-occupied units make up 1,038 (27.1%).
| Occupancy | # Housing Units | % Housing Units |
| Owner Occupied Housing Units | 2,787 | 72.9% |
| Renter-Occupied Housing Units | 1,038 | 27.1% |
| Total Occupied Housing Units | 3,825 | 100.0% |
Occupancy by Household Size in Ocean City
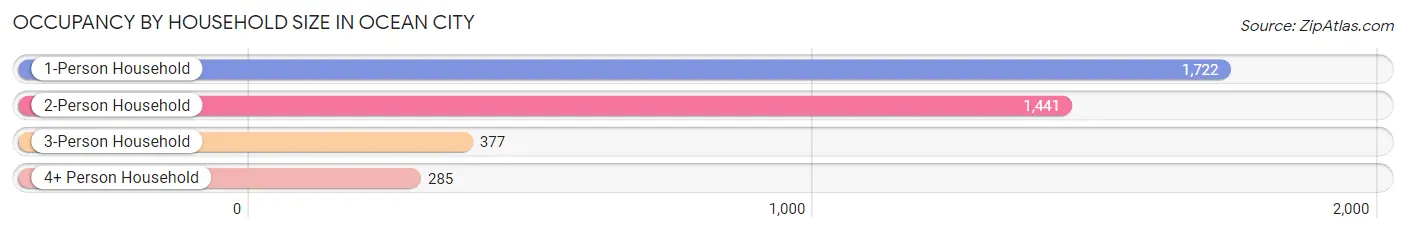
| Household Size | # Housing Units | % Housing Units |
| 1-Person Household | 1,722 | 45.0% |
| 2-Person Household | 1,441 | 37.7% |
| 3-Person Household | 377 | 9.9% |
| 4+ Person Household | 285 | 7.4% |
| Total Housing Units | 3,825 | 100.0% |
Occupancy by Ownership by Household Size in Ocean City
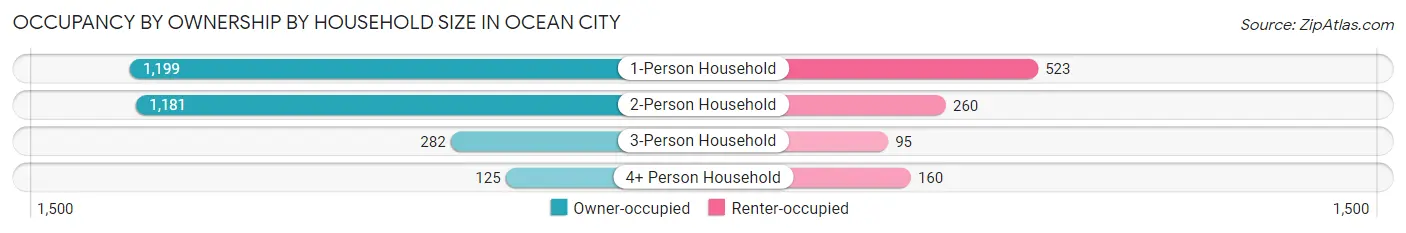
| Household Size | Owner-occupied | Renter-occupied |
| 1-Person Household | 1,199 (69.6%) | 523 (30.4%) |
| 2-Person Household | 1,181 (82.0%) | 260 (18.0%) |
| 3-Person Household | 282 (74.8%) | 95 (25.2%) |
| 4+ Person Household | 125 (43.9%) | 160 (56.1%) |
| Total Housing Units | 2,787 (72.9%) | 1,038 (27.1%) |
Occupancy by Educational Attainment in Ocean City
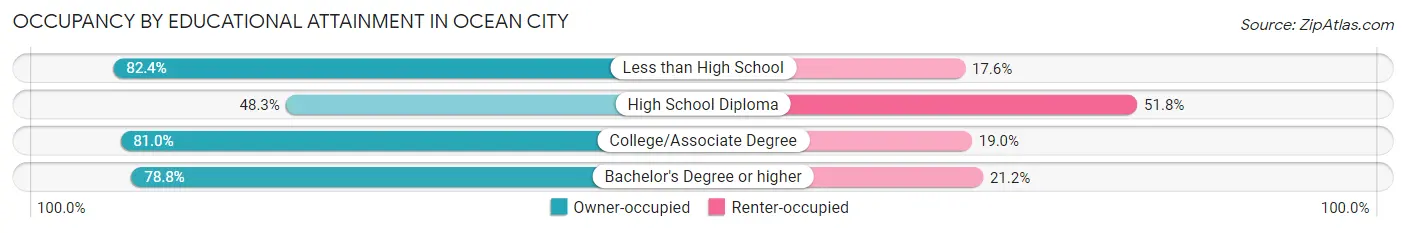
| Household Size | Owner-occupied | Renter-occupied |
| Less than High School | 131 (82.4%) | 28 (17.6%) |
| High School Diploma | 414 (48.2%) | 444 (51.7%) |
| College/Associate Degree | 1,055 (81.0%) | 247 (19.0%) |
| Bachelor's Degree or higher | 1,187 (78.8%) | 319 (21.2%) |
Occupancy by Age of Householder in Ocean City
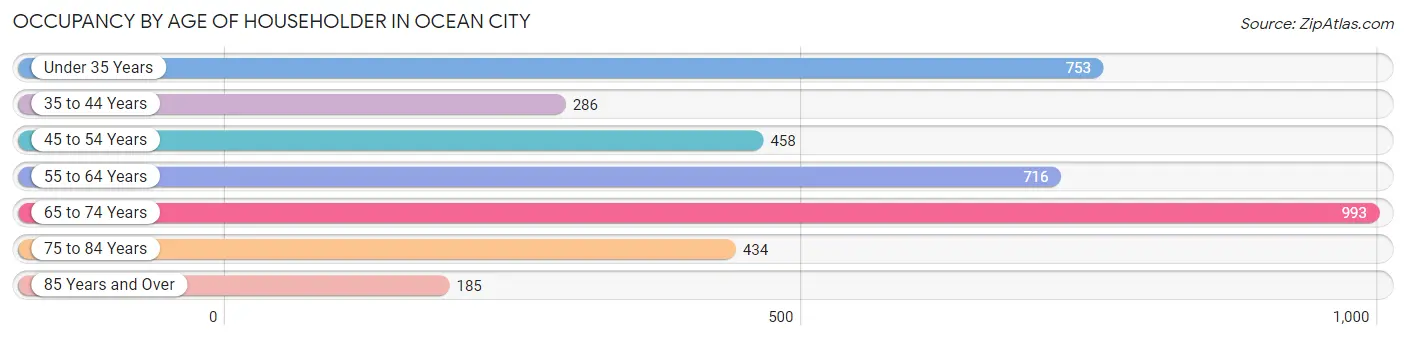
| Age Bracket | # Households | % Households |
| Under 35 Years | 753 | 19.7% |
| 35 to 44 Years | 286 | 7.5% |
| 45 to 54 Years | 458 | 12.0% |
| 55 to 64 Years | 716 | 18.7% |
| 65 to 74 Years | 993 | 26.0% |
| 75 to 84 Years | 434 | 11.4% |
| 85 Years and Over | 185 | 4.8% |
| Total | 3,825 | 100.0% |
Housing Finances in Ocean City
Median Income by Occupancy in Ocean City
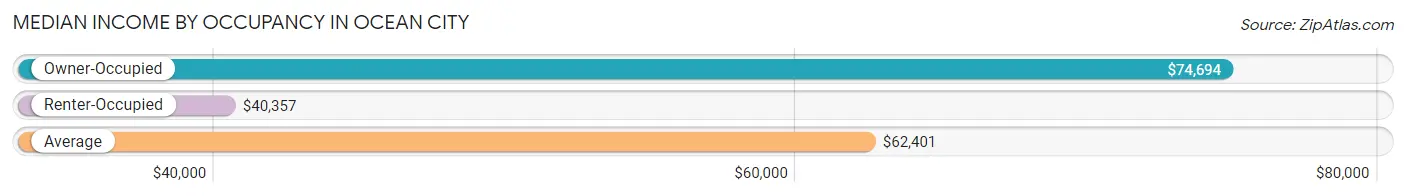
| Occupancy Type | # Households | Median Income |
| Owner-Occupied | 2,787 (72.9%) | $74,694 |
| Renter-Occupied | 1,038 (27.1%) | $40,357 |
| Average | 3,825 (100.0%) | $62,401 |
Occupancy by Householder Income Bracket in Ocean City
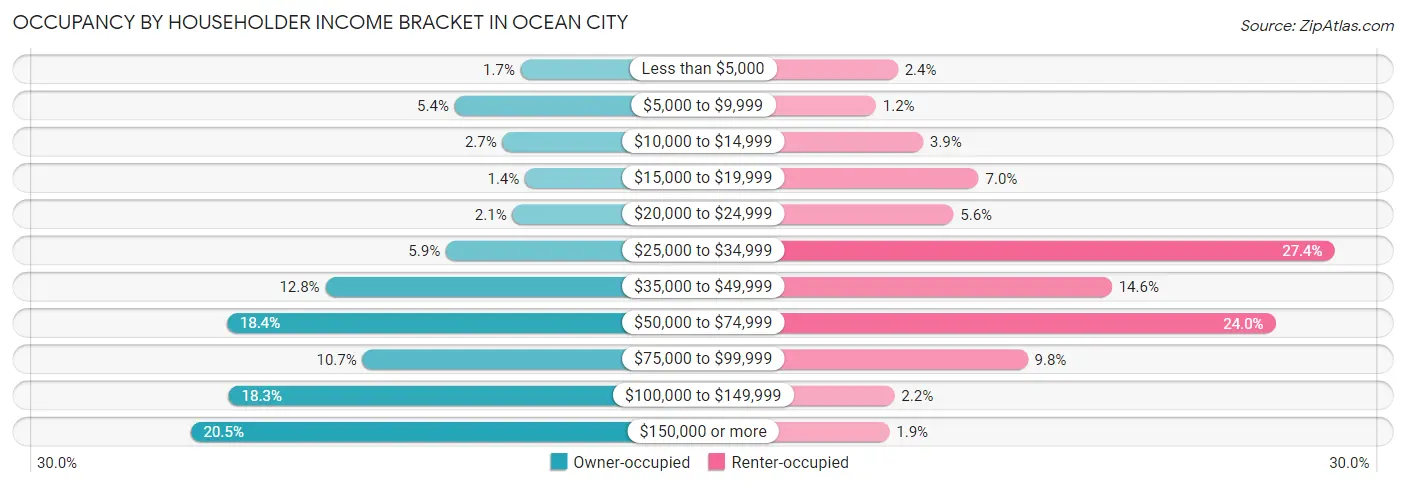
| Income Bracket | Owner-occupied | Renter-occupied |
| Less than $5,000 | 46 (1.7%) | 25 (2.4%) |
| $5,000 to $9,999 | 151 (5.4%) | 12 (1.2%) |
| $10,000 to $14,999 | 75 (2.7%) | 40 (3.8%) |
| $15,000 to $19,999 | 39 (1.4%) | 73 (7.0%) |
| $20,000 to $24,999 | 59 (2.1%) | 58 (5.6%) |
| $25,000 to $34,999 | 165 (5.9%) | 284 (27.4%) |
| $35,000 to $49,999 | 357 (12.8%) | 152 (14.6%) |
| $50,000 to $74,999 | 514 (18.4%) | 249 (24.0%) |
| $75,000 to $99,999 | 298 (10.7%) | 102 (9.8%) |
| $100,000 to $149,999 | 511 (18.3%) | 23 (2.2%) |
| $150,000 or more | 572 (20.5%) | 20 (1.9%) |
| Total | 2,787 (100.0%) | 1,038 (100.0%) |
Monthly Housing Cost Tiers in Ocean City
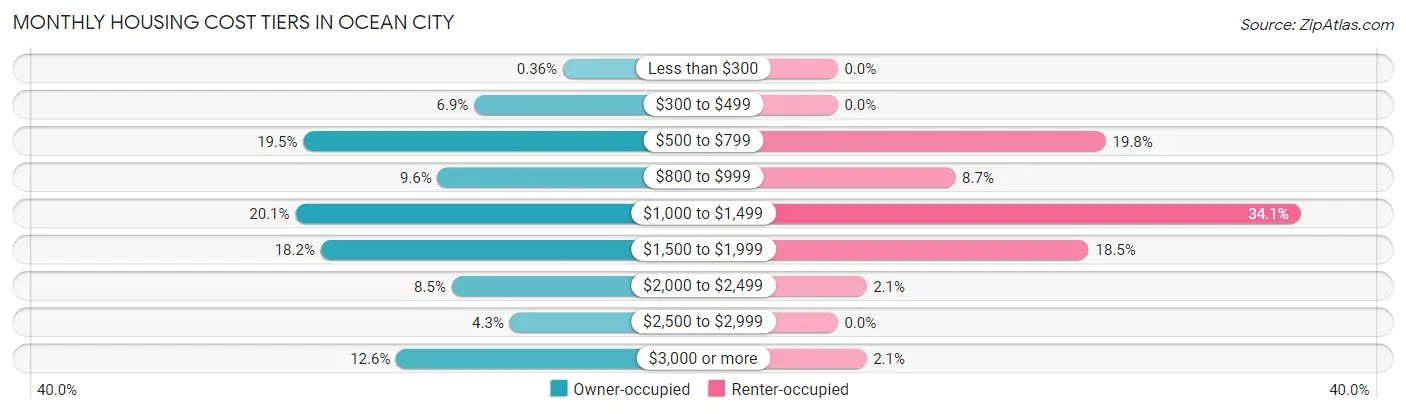
| Monthly Cost | Owner-occupied | Renter-occupied |
| Less than $300 | 10 (0.4%) | 0 (0.0%) |
| $300 to $499 | 192 (6.9%) | 0 (0.0%) |
| $500 to $799 | 543 (19.5%) | 205 (19.8%) |
| $800 to $999 | 267 (9.6%) | 90 (8.7%) |
| $1,000 to $1,499 | 559 (20.1%) | 354 (34.1%) |
| $1,500 to $1,999 | 507 (18.2%) | 192 (18.5%) |
| $2,000 to $2,499 | 238 (8.5%) | 22 (2.1%) |
| $2,500 to $2,999 | 119 (4.3%) | 0 (0.0%) |
| $3,000 or more | 352 (12.6%) | 22 (2.1%) |
| Total | 2,787 (100.0%) | 1,038 (100.0%) |
Physical Housing Characteristics in Ocean City
Housing Structures in Ocean City
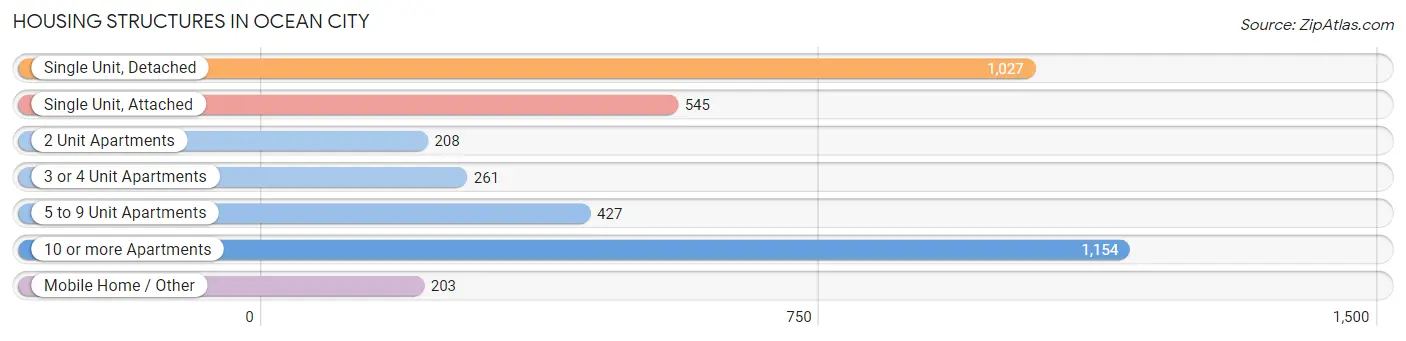
| Structure Type | # Housing Units | % Housing Units |
| Single Unit, Detached | 1,027 | 26.9% |
| Single Unit, Attached | 545 | 14.2% |
| 2 Unit Apartments | 208 | 5.4% |
| 3 or 4 Unit Apartments | 261 | 6.8% |
| 5 to 9 Unit Apartments | 427 | 11.2% |
| 10 or more Apartments | 1,154 | 30.2% |
| Mobile Home / Other | 203 | 5.3% |
| Total | 3,825 | 100.0% |
Housing Structures by Occupancy in Ocean City
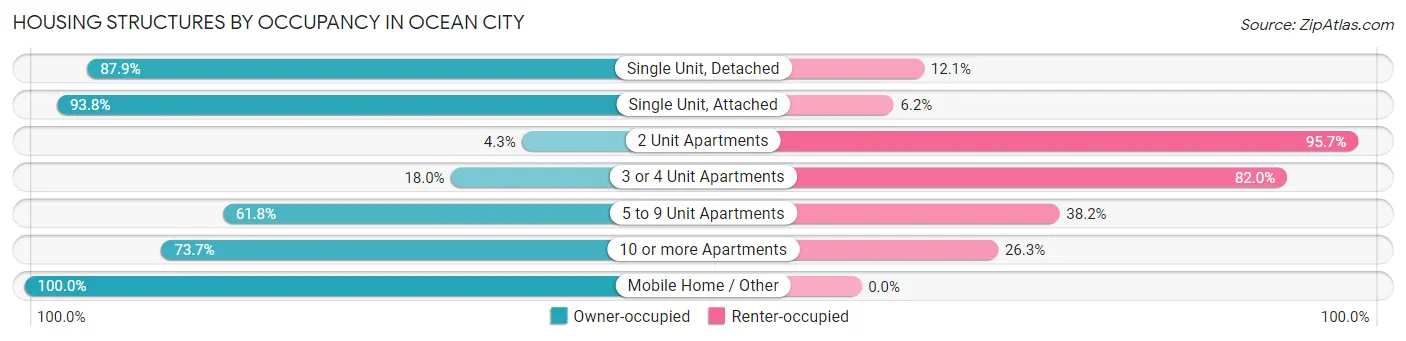
| Structure Type | Owner-occupied | Renter-occupied |
| Single Unit, Detached | 903 (87.9%) | 124 (12.1%) |
| Single Unit, Attached | 511 (93.8%) | 34 (6.2%) |
| 2 Unit Apartments | 9 (4.3%) | 199 (95.7%) |
| 3 or 4 Unit Apartments | 47 (18.0%) | 214 (82.0%) |
| 5 to 9 Unit Apartments | 264 (61.8%) | 163 (38.2%) |
| 10 or more Apartments | 850 (73.7%) | 304 (26.3%) |
| Mobile Home / Other | 203 (100.0%) | 0 (0.0%) |
| Total | 2,787 (72.9%) | 1,038 (27.1%) |
Housing Structures by Number of Rooms in Ocean City
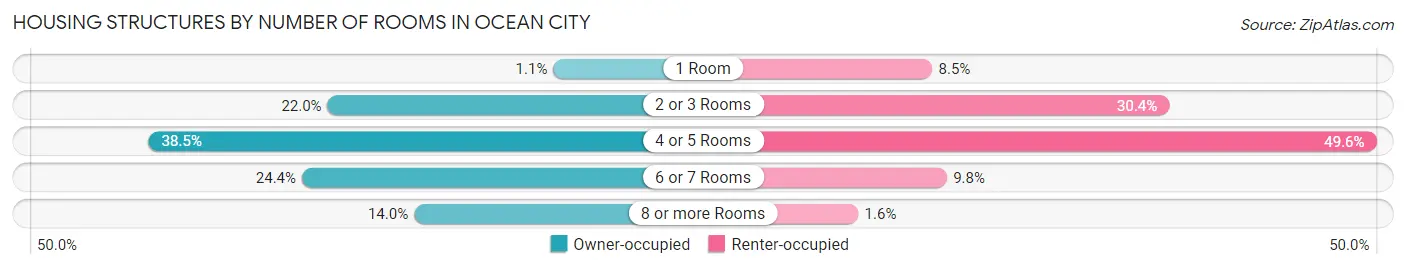
| Number of Rooms | Owner-occupied | Renter-occupied |
| 1 Room | 31 (1.1%) | 88 (8.5%) |
| 2 or 3 Rooms | 613 (22.0%) | 316 (30.4%) |
| 4 or 5 Rooms | 1,074 (38.5%) | 515 (49.6%) |
| 6 or 7 Rooms | 679 (24.4%) | 102 (9.8%) |
| 8 or more Rooms | 390 (14.0%) | 17 (1.6%) |
| Total | 2,787 (100.0%) | 1,038 (100.0%) |
Housing Structure by Heating Type in Ocean City
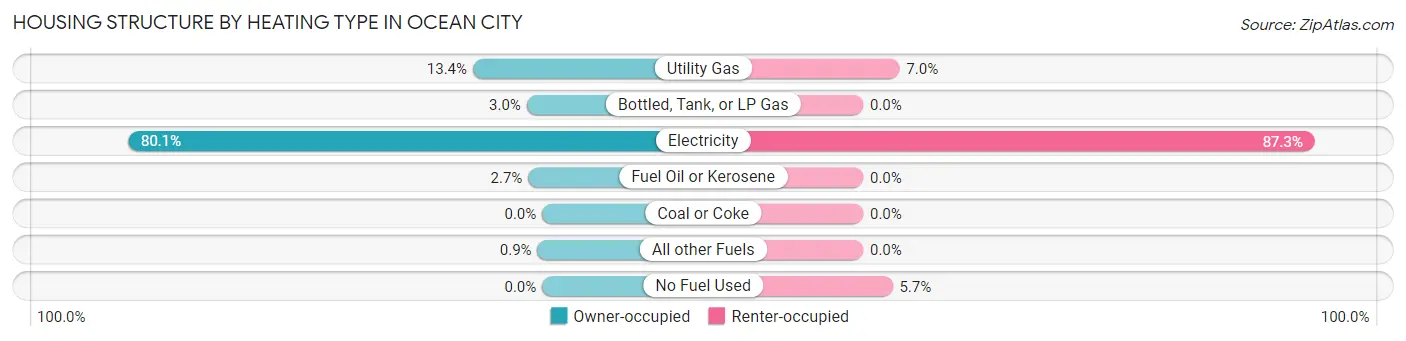
| Heating Type | Owner-occupied | Renter-occupied |
| Utility Gas | 373 (13.4%) | 73 (7.0%) |
| Bottled, Tank, or LP Gas | 83 (3.0%) | 0 (0.0%) |
| Electricity | 2,231 (80.0%) | 906 (87.3%) |
| Fuel Oil or Kerosene | 75 (2.7%) | 0 (0.0%) |
| Coal or Coke | 0 (0.0%) | 0 (0.0%) |
| All other Fuels | 25 (0.9%) | 0 (0.0%) |
| No Fuel Used | 0 (0.0%) | 59 (5.7%) |
| Total | 2,787 (100.0%) | 1,038 (100.0%) |
Household Vehicle Usage in Ocean City
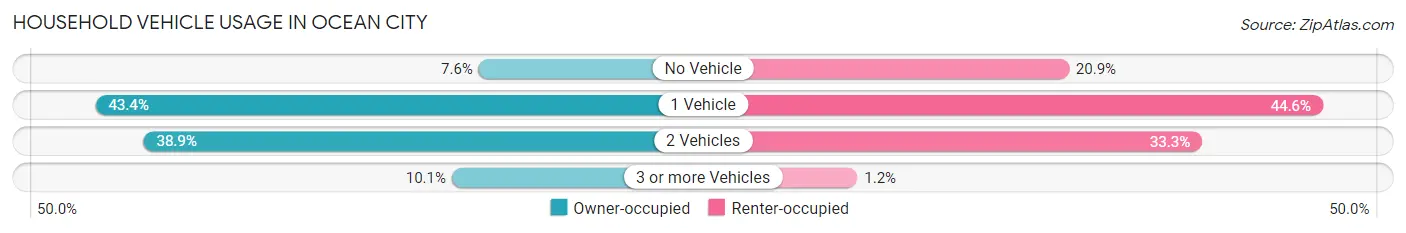
| Vehicles per Household | Owner-occupied | Renter-occupied |
| No Vehicle | 212 (7.6%) | 217 (20.9%) |
| 1 Vehicle | 1,209 (43.4%) | 463 (44.6%) |
| 2 Vehicles | 1,084 (38.9%) | 346 (33.3%) |
| 3 or more Vehicles | 282 (10.1%) | 12 (1.2%) |
| Total | 2,787 (100.0%) | 1,038 (100.0%) |
Real Estate & Mortgages in Ocean City
Real Estate and Mortgage Overview in Ocean City
| Characteristic | Without Mortgage | With Mortgage |
| Housing Units | 1,417 | 1,370 |
| Median Property Value | $335,400 | $331,400 |
| Median Household Income | $59,453 | $366 |
| Monthly Housing Costs | $791 | $297 |
| Real Estate Taxes | $3,857 | $9 |
Property Value by Mortgage Status in Ocean City
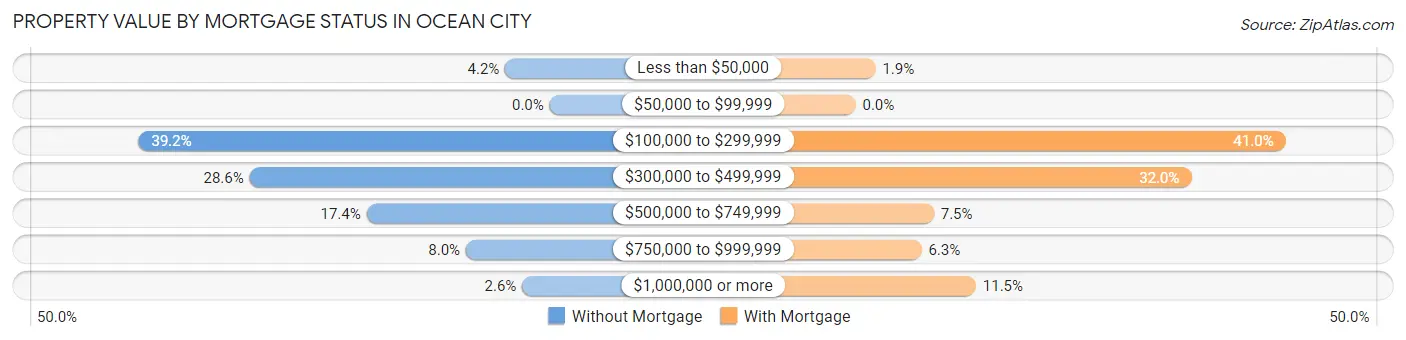
| Property Value | Without Mortgage | With Mortgage |
| Less than $50,000 | 60 (4.2%) | 26 (1.9%) |
| $50,000 to $99,999 | 0 (0.0%) | 0 (0.0%) |
| $100,000 to $299,999 | 555 (39.2%) | 561 (40.9%) |
| $300,000 to $499,999 | 405 (28.6%) | 438 (32.0%) |
| $500,000 to $749,999 | 247 (17.4%) | 102 (7.4%) |
| $750,000 to $999,999 | 113 (8.0%) | 86 (6.3%) |
| $1,000,000 or more | 37 (2.6%) | 157 (11.5%) |
| Total | 1,417 (100.0%) | 1,370 (100.0%) |
Household Income by Mortgage Status in Ocean City
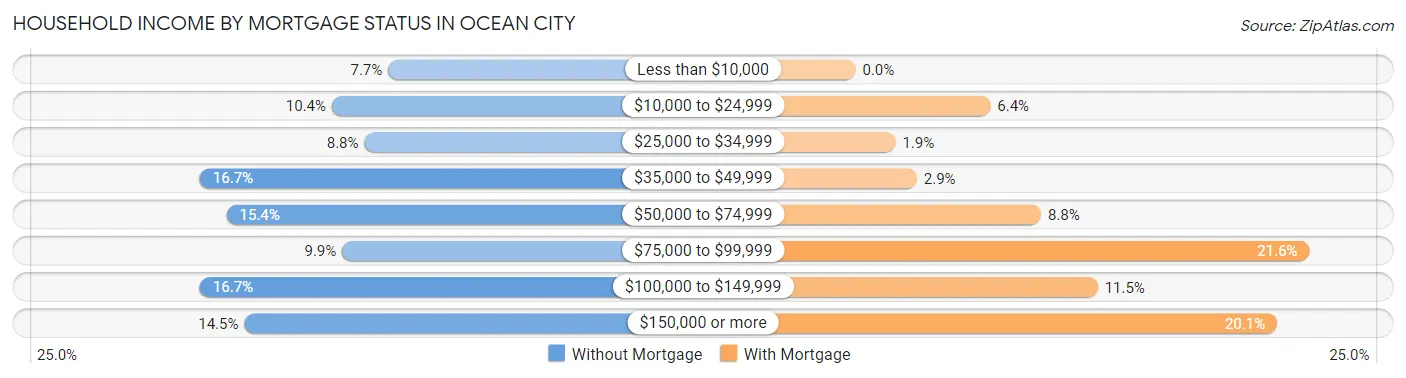
| Household Income | Without Mortgage | With Mortgage |
| Less than $10,000 | 109 (7.7%) | 0 (0.0%) |
| $10,000 to $24,999 | 147 (10.4%) | 88 (6.4%) |
| $25,000 to $34,999 | 125 (8.8%) | 26 (1.9%) |
| $35,000 to $49,999 | 236 (16.7%) | 40 (2.9%) |
| $50,000 to $74,999 | 218 (15.4%) | 121 (8.8%) |
| $75,000 to $99,999 | 140 (9.9%) | 296 (21.6%) |
| $100,000 to $149,999 | 236 (16.7%) | 158 (11.5%) |
| $150,000 or more | 206 (14.5%) | 275 (20.1%) |
| Total | 1,417 (100.0%) | 1,370 (100.0%) |
Property Value to Household Income Ratio in Ocean City
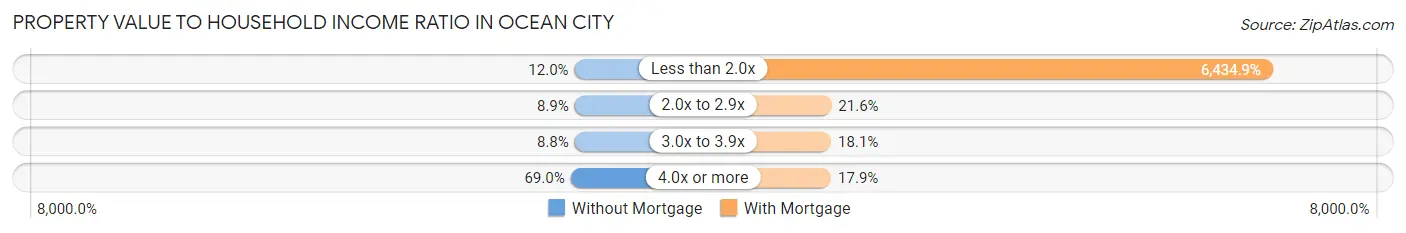
| Value-to-Income Ratio | Without Mortgage | With Mortgage |
| Less than 2.0x | 170 (12.0%) | 88,158 (6,434.9%) |
| 2.0x to 2.9x | 126 (8.9%) | 296 (21.6%) |
| 3.0x to 3.9x | 124 (8.7%) | 248 (18.1%) |
| 4.0x or more | 978 (69.0%) | 245 (17.9%) |
| Total | 1,417 (100.0%) | 1,370 (100.0%) |
Real Estate Taxes by Mortgage Status in Ocean City
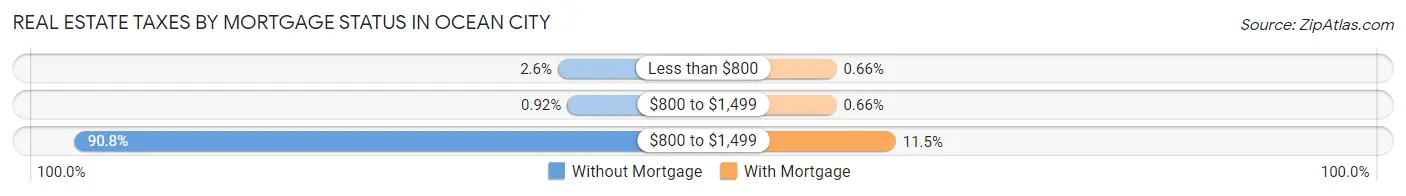
| Property Taxes | Without Mortgage | With Mortgage |
| Less than $800 | 37 (2.6%) | 9 (0.7%) |
| $800 to $1,499 | 13 (0.9%) | 9 (0.7%) |
| $800 to $1,499 | 1,287 (90.8%) | 157 (11.5%) |
| Total | 1,417 (100.0%) | 1,370 (100.0%) |
Health & Disability in Ocean City
Health Insurance Coverage by Age in Ocean City
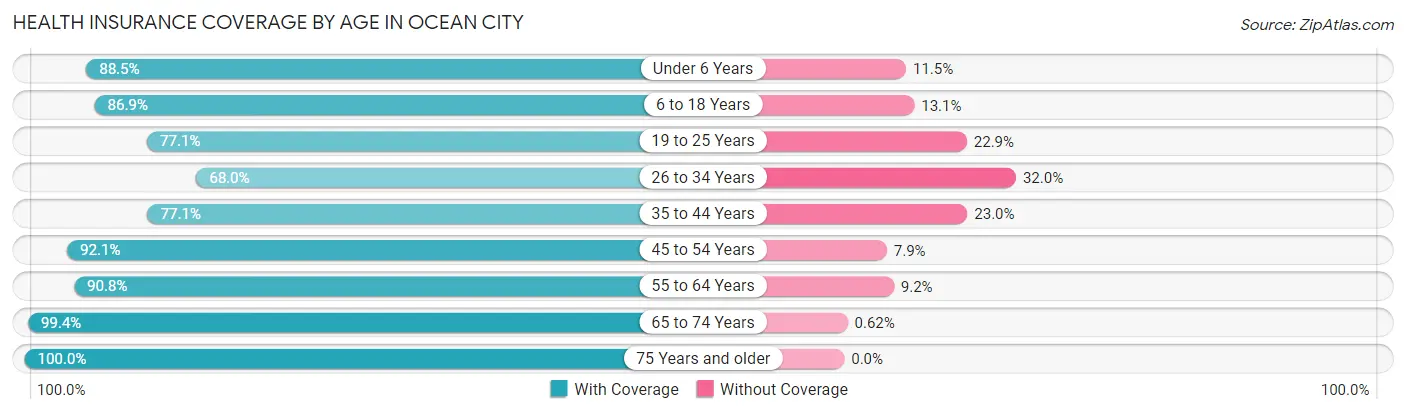
| Age Bracket | With Coverage | Without Coverage |
| Under 6 Years | 238 (88.5%) | 31 (11.5%) |
| 6 to 18 Years | 366 (86.9%) | 55 (13.1%) |
| 19 to 25 Years | 648 (77.1%) | 192 (22.9%) |
| 26 to 34 Years | 448 (68.0%) | 211 (32.0%) |
| 35 to 44 Years | 376 (77.0%) | 112 (23.0%) |
| 45 to 54 Years | 580 (92.1%) | 50 (7.9%) |
| 55 to 64 Years | 1,080 (90.8%) | 110 (9.2%) |
| 65 to 74 Years | 1,454 (99.4%) | 9 (0.6%) |
| 75 Years and older | 878 (100.0%) | 0 (0.0%) |
| Total | 6,068 (88.7%) | 770 (11.3%) |
Health Insurance Coverage by Citizenship Status in Ocean City
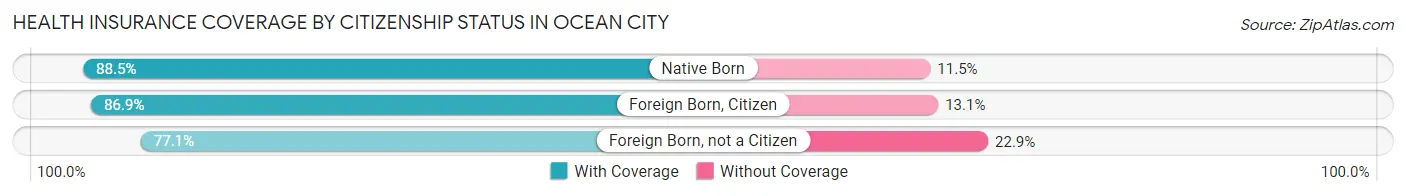
| Citizenship Status | With Coverage | Without Coverage |
| Native Born | 238 (88.5%) | 31 (11.5%) |
| Foreign Born, Citizen | 366 (86.9%) | 55 (13.1%) |
| Foreign Born, not a Citizen | 648 (77.1%) | 192 (22.9%) |
Health Insurance Coverage by Household Income in Ocean City
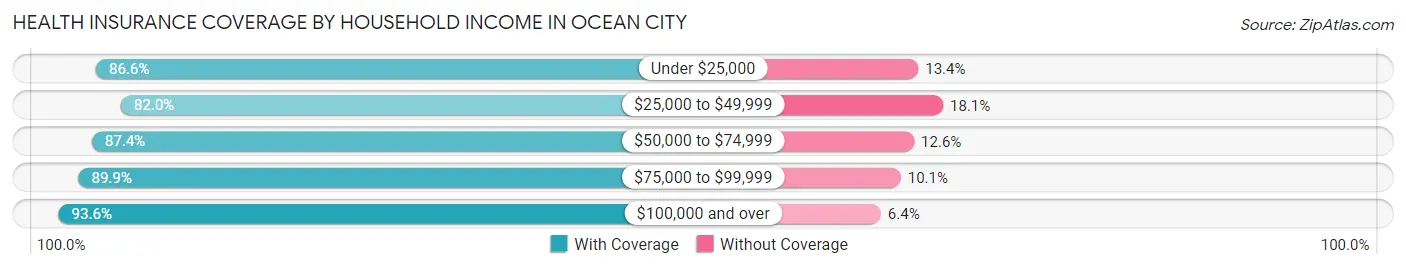
| Household Income | With Coverage | Without Coverage |
| Under $25,000 | 582 (86.6%) | 90 (13.4%) |
| $25,000 to $49,999 | 1,135 (82.0%) | 250 (18.0%) |
| $50,000 to $74,999 | 1,274 (87.4%) | 184 (12.6%) |
| $75,000 to $99,999 | 737 (89.9%) | 83 (10.1%) |
| $100,000 and over | 2,300 (93.6%) | 157 (6.4%) |
Public vs Private Health Insurance Coverage by Age in Ocean City
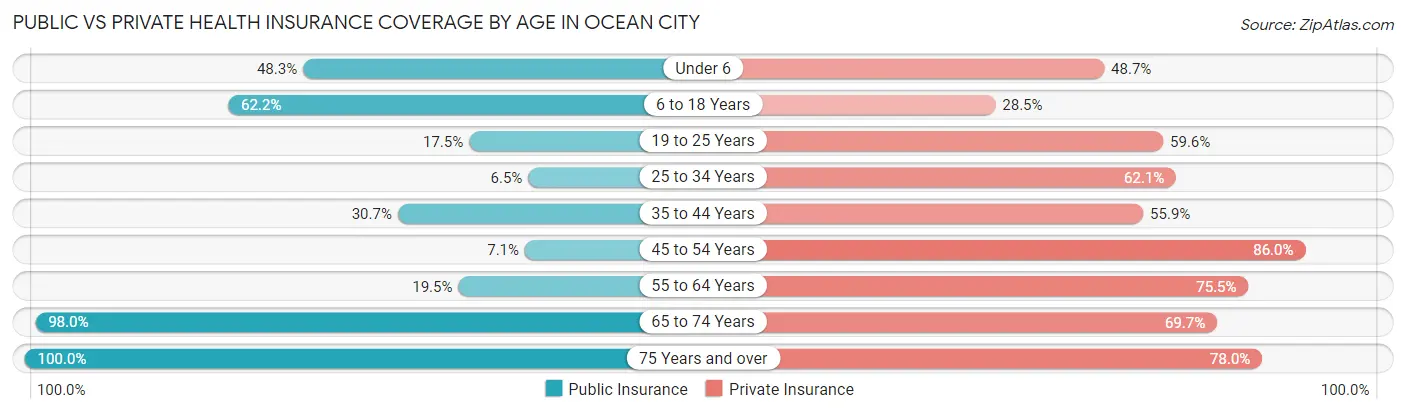
| Age Bracket | Public Insurance | Private Insurance |
| Under 6 | 130 (48.3%) | 131 (48.7%) |
| 6 to 18 Years | 262 (62.2%) | 120 (28.5%) |
| 19 to 25 Years | 147 (17.5%) | 501 (59.6%) |
| 25 to 34 Years | 43 (6.5%) | 409 (62.1%) |
| 35 to 44 Years | 150 (30.7%) | 273 (55.9%) |
| 45 to 54 Years | 45 (7.1%) | 542 (86.0%) |
| 55 to 64 Years | 232 (19.5%) | 898 (75.5%) |
| 65 to 74 Years | 1,434 (98.0%) | 1,019 (69.7%) |
| 75 Years and over | 878 (100.0%) | 685 (78.0%) |
| Total | 3,321 (48.6%) | 4,578 (66.9%) |
Disability Status by Sex by Age in Ocean City
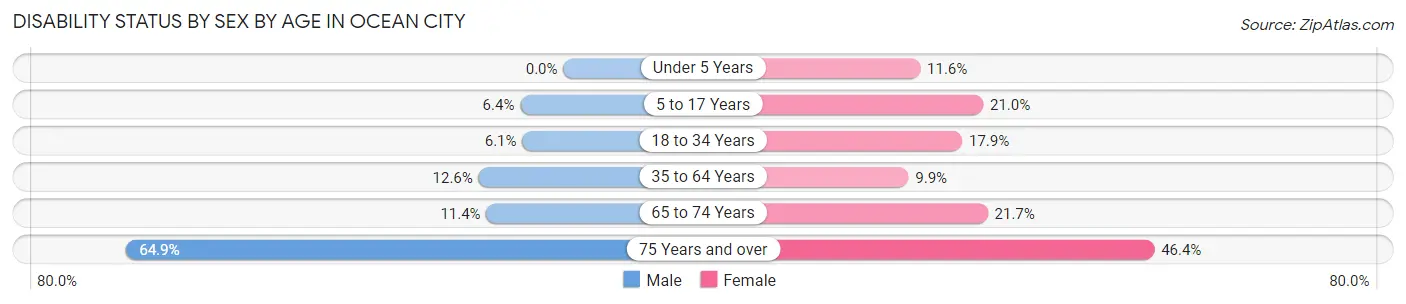
| Age Bracket | Male | Female |
| Under 5 Years | 0 (0.0%) | 10 (11.6%) |
| 5 to 17 Years | 16 (6.4%) | 30 (21.0%) |
| 18 to 34 Years | 35 (6.1%) | 170 (17.9%) |
| 35 to 64 Years | 135 (12.6%) | 122 (9.9%) |
| 65 to 74 Years | 70 (11.4%) | 184 (21.6%) |
| 75 Years and over | 255 (64.9%) | 225 (46.4%) |
Disability Class by Sex by Age in Ocean City
Disability Class: Hearing Difficulty
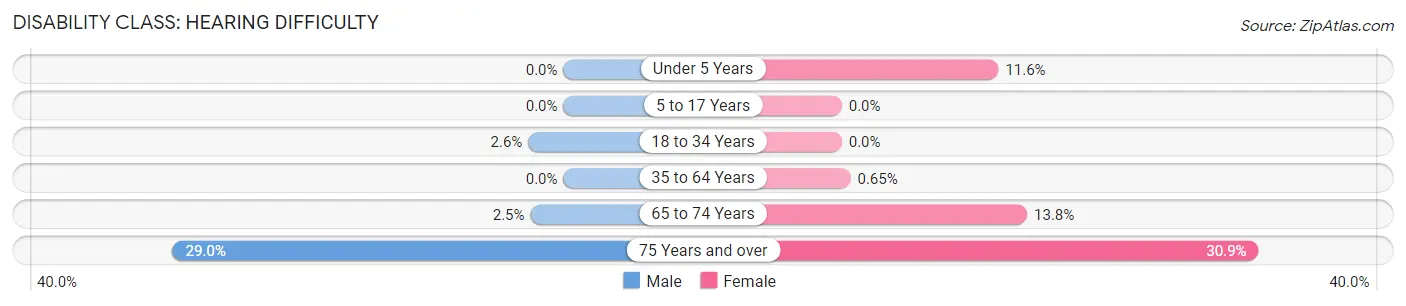
| Age Bracket | Male | Female |
| Under 5 Years | 0 (0.0%) | 10 (11.6%) |
| 5 to 17 Years | 0 (0.0%) | 0 (0.0%) |
| 18 to 34 Years | 15 (2.6%) | 0 (0.0%) |
| 35 to 64 Years | 0 (0.0%) | 8 (0.6%) |
| 65 to 74 Years | 15 (2.5%) | 117 (13.8%) |
| 75 Years and over | 114 (29.0%) | 150 (30.9%) |
Disability Class: Vision Difficulty
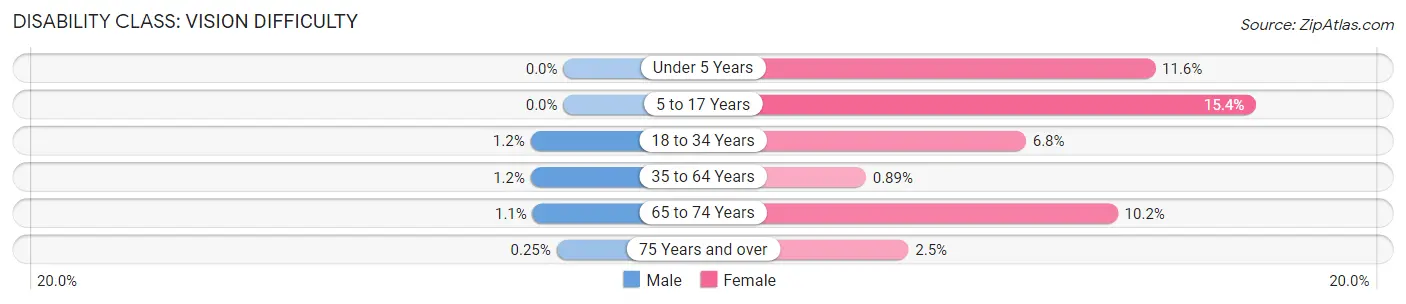
| Age Bracket | Male | Female |
| Under 5 Years | 0 (0.0%) | 10 (11.6%) |
| 5 to 17 Years | 0 (0.0%) | 22 (15.4%) |
| 18 to 34 Years | 7 (1.2%) | 65 (6.8%) |
| 35 to 64 Years | 13 (1.2%) | 11 (0.9%) |
| 65 to 74 Years | 7 (1.1%) | 87 (10.2%) |
| 75 Years and over | 1 (0.3%) | 12 (2.5%) |
Disability Class: Cognitive Difficulty
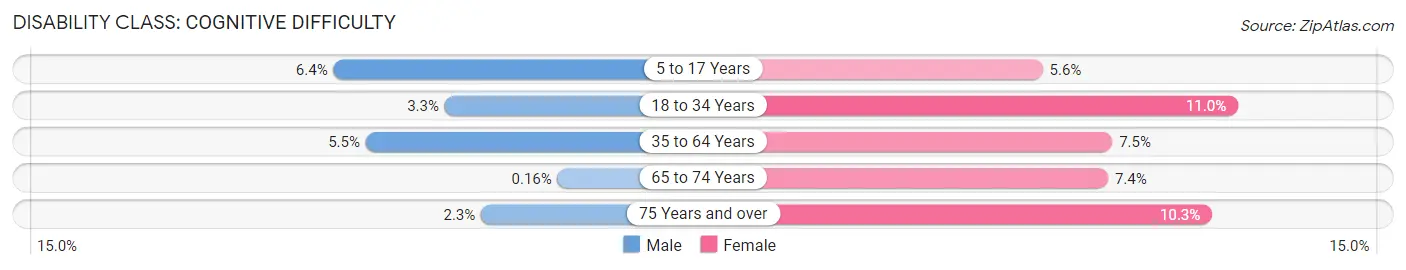
| Age Bracket | Male | Female |
| 5 to 17 Years | 16 (6.4%) | 8 (5.6%) |
| 18 to 34 Years | 19 (3.3%) | 105 (11.0%) |
| 35 to 64 Years | 59 (5.5%) | 93 (7.5%) |
| 65 to 74 Years | 1 (0.2%) | 63 (7.4%) |
| 75 Years and over | 9 (2.3%) | 50 (10.3%) |
Disability Class: Ambulatory Difficulty
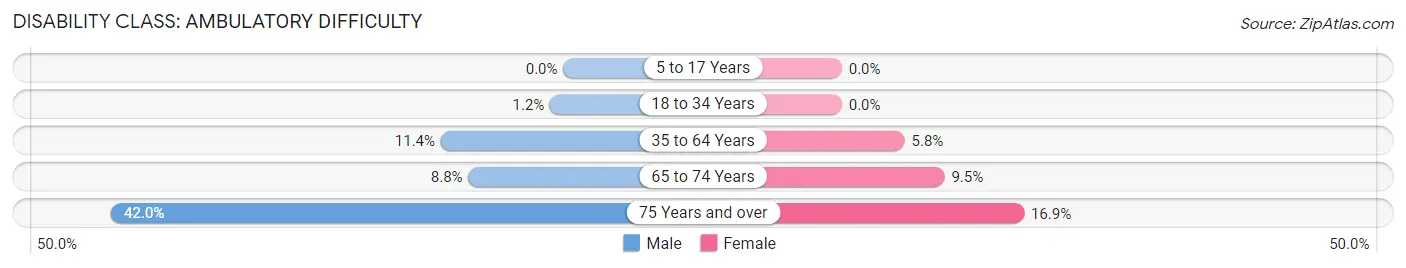
| Age Bracket | Male | Female |
| 5 to 17 Years | 0 (0.0%) | 0 (0.0%) |
| 18 to 34 Years | 7 (1.2%) | 0 (0.0%) |
| 35 to 64 Years | 122 (11.4%) | 72 (5.8%) |
| 65 to 74 Years | 54 (8.8%) | 81 (9.5%) |
| 75 Years and over | 165 (42.0%) | 82 (16.9%) |
Disability Class: Self-Care Difficulty
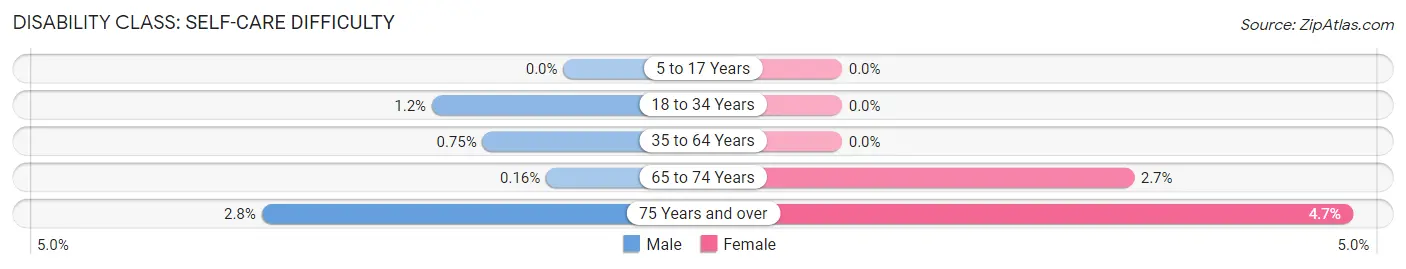
| Age Bracket | Male | Female |
| 5 to 17 Years | 0 (0.0%) | 0 (0.0%) |
| 18 to 34 Years | 7 (1.2%) | 0 (0.0%) |
| 35 to 64 Years | 8 (0.7%) | 0 (0.0%) |
| 65 to 74 Years | 1 (0.2%) | 23 (2.7%) |
| 75 Years and over | 11 (2.8%) | 23 (4.7%) |
Technology Access in Ocean City
Computing Device Access in Ocean City
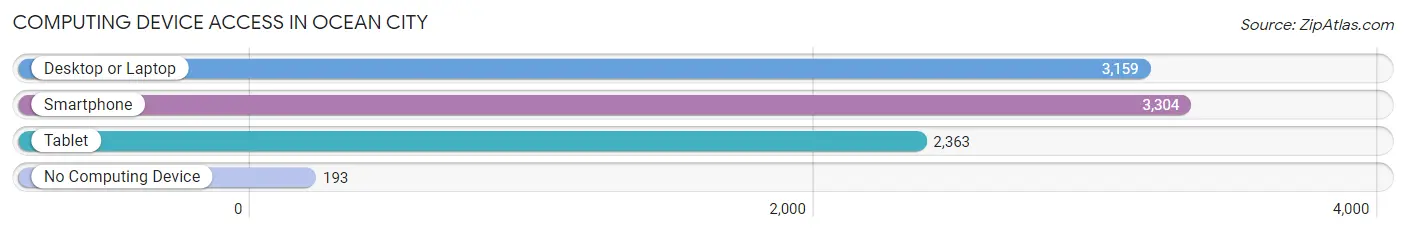
| Device Type | # Households | % Households |
| Desktop or Laptop | 3,159 | 82.6% |
| Smartphone | 3,304 | 86.4% |
| Tablet | 2,363 | 61.8% |
| No Computing Device | 193 | 5.1% |
| Total | 3,825 | 100.0% |
Internet Access in Ocean City
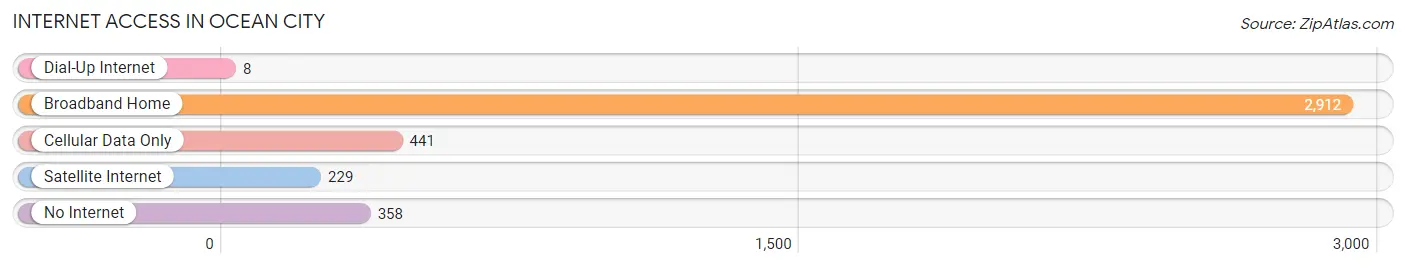
| Internet Type | # Households | % Households |
| Dial-Up Internet | 8 | 0.2% |
| Broadband Home | 2,912 | 76.1% |
| Cellular Data Only | 441 | 11.5% |
| Satellite Internet | 229 | 6.0% |
| No Internet | 358 | 9.4% |
| Total | 3,825 | 100.0% |
Ocean City Summary
Introduction
Ocean City, Maryland is a popular beach resort town located on the Atlantic Ocean in Worcester County, Maryland. It is a popular destination for vacationers and tourists from all over the United States and beyond. The town has a rich history, diverse geography, vibrant economy, and unique demographics. This paper will explore the history, geography, economy, and demographics of Ocean City, Maryland in 2000 words.
History
The history of Ocean City, Maryland dates back to the late 19th century. The town was founded in 1875 by Isaac Coffin, a wealthy businessman from Philadelphia. Coffin purchased a large tract of land on the Atlantic Ocean and began developing the area into a resort town. He named the town “Ocean City” after the nearby ocean.
In the early years, Ocean City was a popular destination for wealthy vacationers from the Northeast. The town was known for its luxurious hotels, fine dining, and beautiful beaches. In the late 19th century, the town was also a popular destination for fishing and hunting.
In the early 20th century, Ocean City began to attract more visitors from the mid-Atlantic region. The town was known for its boardwalk, amusement parks, and other attractions. In the 1950s, the town began to attract more visitors from the Midwest and other parts of the country.
Today, Ocean City is a popular destination for vacationers from all over the United States and beyond. The town is known for its beaches, boardwalk, amusement parks, and other attractions.
Geography
Ocean City, Maryland is located on the Atlantic Ocean in Worcester County, Maryland. The town is situated on a barrier island that is approximately 10 miles long and 1 mile wide. The town is bordered by the Assawoman Bay to the west and the Atlantic Ocean to the east.
The town has a total area of 10.2 square miles, of which 9.9 square miles is land and 0.3 square miles is water. The town has a humid subtropical climate, with hot, humid summers and mild winters.
Economy
The economy of Ocean City, Maryland is largely driven by tourism. The town is a popular destination for vacationers and tourists from all over the United States and beyond. The town is known for its beaches, boardwalk, amusement parks, and other attractions.
The town is also home to a variety of businesses, including restaurants, hotels, retail stores, and other businesses. The town is also home to a variety of fishing and boating businesses.
Demographics
As of the 2010 census, the population of Ocean City, Maryland was 7,102. The town has a population density of 697.3 people per square mile. The racial makeup of the town is 87.3% White, 8.2% African American, 0.7% Native American, 0.7% Asian, 0.1% Pacific Islander, 1.2% from other races, and 2.0% from two or more races.
The median household income in Ocean City, Maryland is $50,945. The median age of the town is 44.7 years. The town has a higher percentage of people over the age of 65 than the national average.
Conclusion
Ocean City, Maryland is a popular beach resort town located on the Atlantic Ocean in Worcester County, Maryland. The town has a rich history, diverse geography, vibrant economy, and unique demographics. The town is a popular destination for vacationers and tourists from all over the United States and beyond. The town is known for its beaches, boardwalk, amusement parks, and other attractions. The town has a population of 7,102 and a median household income of $50,945. The town has a higher percentage of people over the age of 65 than the national average.
Common Questions
What is Per Capita Income in Ocean City?
Per Capita income in Ocean City is $59,876.
What is the Median Family Income in Ocean City?
Median Family Income in Ocean City is $88,333.
What is the Median Household income in Ocean City?
Median Household Income in Ocean City is $62,401.
What is Income or Wage Gap in Ocean City?
Income or Wage Gap in Ocean City is 26.9%.
Women in Ocean City earn 73.1 cents for every dollar earned by a man.
What is Inequality or Gini Index in Ocean City?
Inequality or Gini Index in Ocean City is 0.55.
What is the Total Population of Ocean City?
Total Population of Ocean City is 6,879.
What is the Total Male Population of Ocean City?
Total Male Population of Ocean City is 3,123.
What is the Total Female Population of Ocean City?
Total Female Population of Ocean City is 3,756.
What is the Ratio of Males per 100 Females in Ocean City?
There are 83.15 Males per 100 Females in Ocean City.
What is the Ratio of Females per 100 Males in Ocean City?
There are 120.27 Females per 100 Males in Ocean City.
What is the Median Population Age in Ocean City?
Median Population Age in Ocean City is 55.5 Years.
What is the Average Family Size in Ocean City
Average Family Size in Ocean City is 2.4 People.
What is the Average Household Size in Ocean City
Average Household Size in Ocean City is 1.8 People.
How Large is the Labor Force in Ocean City?
There are 3,911 People in the Labor Forcein in Ocean City.
What is the Percentage of People in the Labor Force in Ocean City?
62.3% of People are in the Labor Force in Ocean City.
What is the Unemployment Rate in Ocean City?
Unemployment Rate in Ocean City is 3.6%.