Manchester, MD Map & Demographics
Manchester Map
Manchester Overview
$47,720
PER CAPITA INCOME
$141,042
AVG FAMILY INCOME
$103,629
AVG HOUSEHOLD INCOME
30.0%
WAGE / INCOME GAP [ % ]
70.0¢/ $1
WAGE / INCOME GAP [ $ ]
0.43
INEQUALITY / GINI INDEX
5,403
TOTAL POPULATION
2,696
MALE POPULATION
2,707
FEMALE POPULATION
99.59
MALES / 100 FEMALES
100.41
FEMALES / 100 MALES
42.8
MEDIAN AGE
3.3
AVG FAMILY SIZE
2.5
AVG HOUSEHOLD SIZE
3,027
LABOR FORCE [ PEOPLE ]
68.4%
PERCENT IN LABOR FORCE
0.9%
UNEMPLOYMENT RATE
Manchester Zip Codes
Income in Manchester
Income Overview in Manchester
Per Capita Income in Manchester is $47,720, while median incomes of families and households are $141,042 and $103,629 respectively.
| Characteristic | Number | Measure |
| Per Capita Income | 5,403 | $47,720 |
| Median Family Income | 1,339 | $141,042 |
| Mean Family Income | 1,339 | $153,262 |
| Median Household Income | 2,076 | $103,629 |
| Mean Household Income | 2,076 | $118,371 |
| Income Deficit | 1,339 | $0 |
| Wage / Income Gap (%) | 5,403 | 29.99% |
| Wage / Income Gap ($) | 5,403 | 70.01¢ per $1 |
| Gini / Inequality Index | 5,403 | 0.43 |
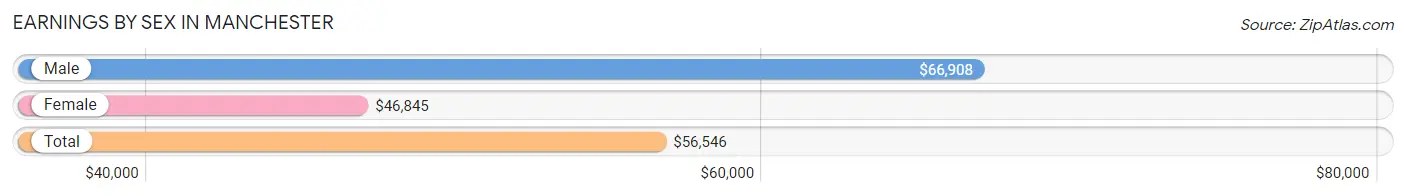
Earnings by Sex in Manchester
Average Earnings in Manchester are $56,546, $66,908 for men and $46,845 for women, a difference of 30.0%.
| Sex | Number | Average Earnings |
| Male | 1,672 (55.0%) | $66,908 |
| Female | 1,365 (45.0%) | $46,845 |
| Total | 3,037 (100.0%) | $56,546 |
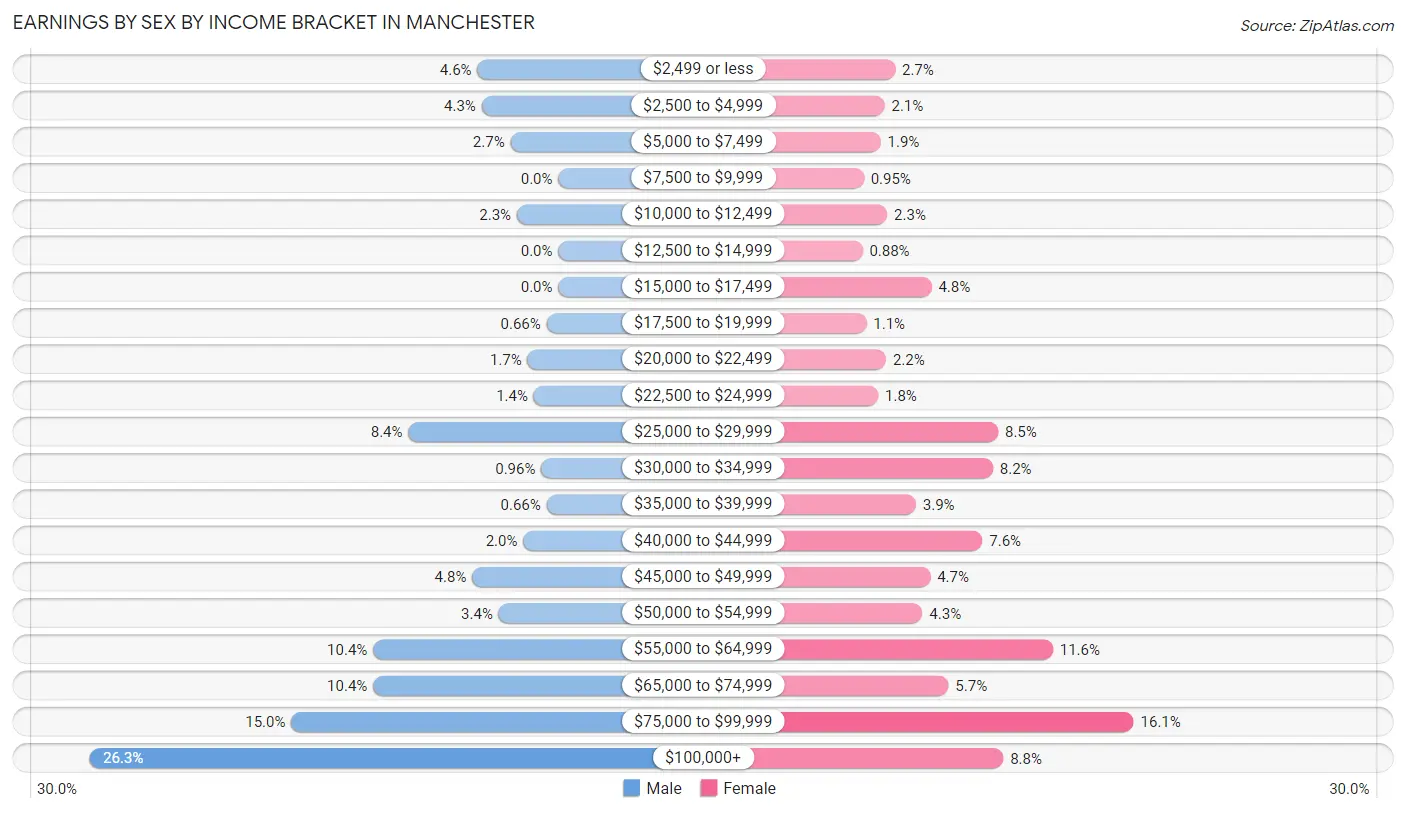
Earnings by Sex by Income Bracket in Manchester
The most common earnings brackets in Manchester are $100,000+ for men (440 | 26.3%) and $75,000 to $99,999 for women (220 | 16.1%).
| Income | Male | Female |
| $2,499 or less | 76 (4.5%) | 37 (2.7%) |
| $2,500 to $4,999 | 72 (4.3%) | 29 (2.1%) |
| $5,000 to $7,499 | 45 (2.7%) | 26 (1.9%) |
| $7,500 to $9,999 | 0 (0.0%) | 13 (0.9%) |
| $10,000 to $12,499 | 39 (2.3%) | 31 (2.3%) |
| $12,500 to $14,999 | 0 (0.0%) | 12 (0.9%) |
| $15,000 to $17,499 | 0 (0.0%) | 65 (4.8%) |
| $17,500 to $19,999 | 11 (0.7%) | 15 (1.1%) |
| $20,000 to $22,499 | 29 (1.7%) | 30 (2.2%) |
| $22,500 to $24,999 | 23 (1.4%) | 24 (1.8%) |
| $25,000 to $29,999 | 141 (8.4%) | 116 (8.5%) |
| $30,000 to $34,999 | 16 (1.0%) | 112 (8.2%) |
| $35,000 to $39,999 | 11 (0.7%) | 53 (3.9%) |
| $40,000 to $44,999 | 33 (2.0%) | 104 (7.6%) |
| $45,000 to $49,999 | 81 (4.8%) | 64 (4.7%) |
| $50,000 to $54,999 | 56 (3.4%) | 58 (4.3%) |
| $55,000 to $64,999 | 174 (10.4%) | 158 (11.6%) |
| $65,000 to $74,999 | 174 (10.4%) | 78 (5.7%) |
| $75,000 to $99,999 | 251 (15.0%) | 220 (16.1%) |
| $100,000+ | 440 (26.3%) | 120 (8.8%) |
| Total | 1,672 (100.0%) | 1,365 (100.0%) |
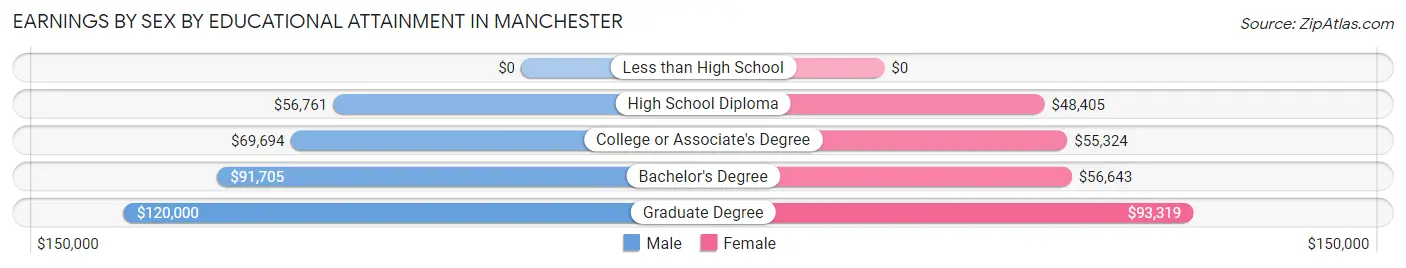
Earnings by Sex by Educational Attainment in Manchester
Average earnings in Manchester are $73,640 for men and $55,596 for women, a difference of 24.5%. Men with an educational attainment of graduate degree enjoy the highest average annual earnings of $120,000, while those with high school diploma education earn the least with $56,761. Women with an educational attainment of graduate degree earn the most with the average annual earnings of $93,319, while those with high school diploma education have the smallest earnings of $48,405.
| Educational Attainment | Male Income | Female Income |
| Less than High School | - | - |
| High School Diploma | $56,761 | $48,405 |
| College or Associate's Degree | $69,694 | $55,324 |
| Bachelor's Degree | $91,705 | $56,643 |
| Graduate Degree | $120,000 | $93,319 |
| Total | $73,640 | $55,596 |
Family Income in Manchester
Family Income Brackets in Manchester
According to the Manchester family income data, there are 404 families falling into the $100,000 to $149,999 income range, which is the most common income bracket and makes up 30.2% of all families. Conversely, the $25,000 to $34,999 income bracket is the least frequent group with only 9 families (0.7%) belonging to this category.
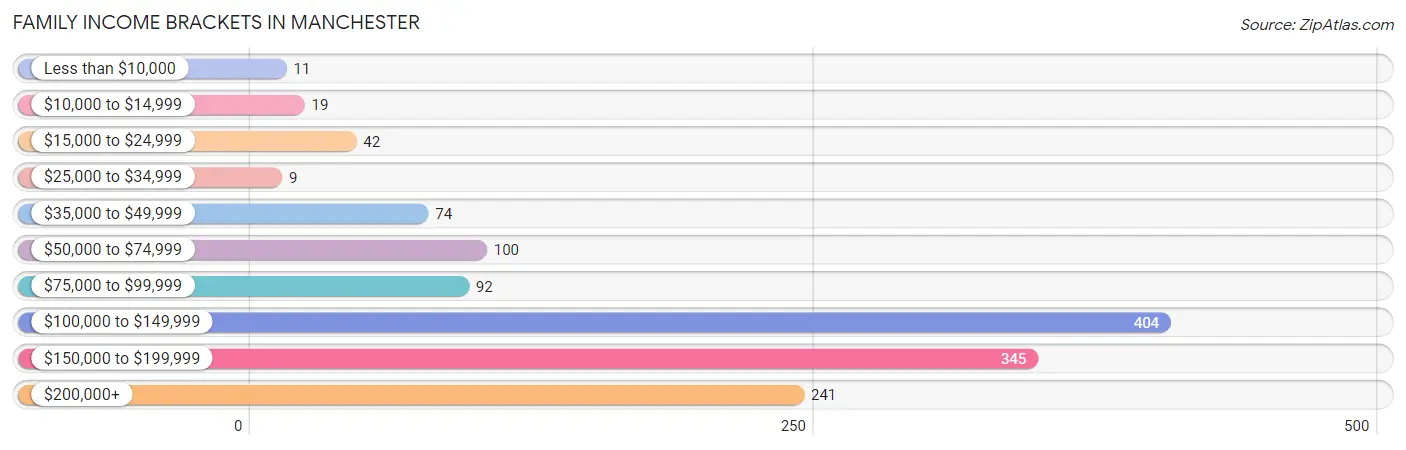
| Income Bracket | # Families | % Families |
| Less than $10,000 | 11 | 0.8% |
| $10,000 to $14,999 | 19 | 1.4% |
| $15,000 to $24,999 | 42 | 3.1% |
| $25,000 to $34,999 | 9 | 0.7% |
| $35,000 to $49,999 | 74 | 5.5% |
| $50,000 to $74,999 | 100 | 7.5% |
| $75,000 to $99,999 | 92 | 6.9% |
| $100,000 to $149,999 | 404 | 30.2% |
| $150,000 to $199,999 | 345 | 25.8% |
| $200,000+ | 241 | 18.0% |
Family Income by Famaliy Size in Manchester
5-person families (130 | 9.7%) account for the highest median family income in Manchester with $179,306 per family, while 2-person families (568 | 42.4%) have the highest median income of $52,989 per family member.
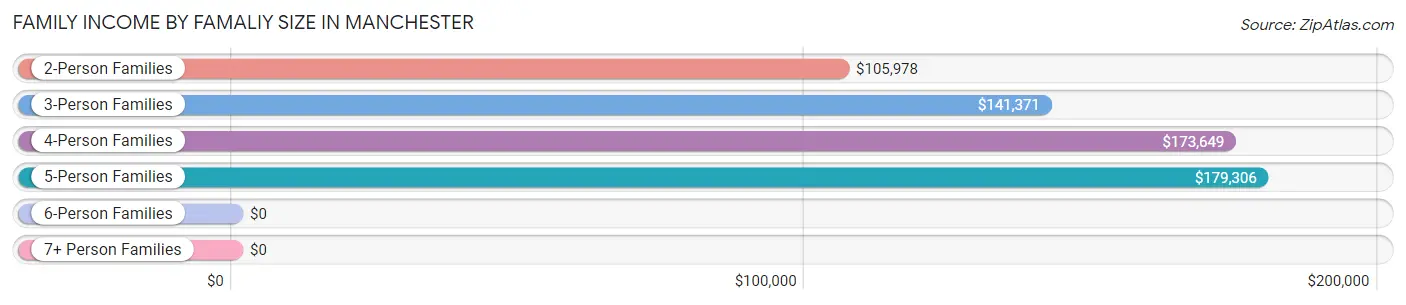
| Income Bracket | # Families | Median Income |
| 2-Person Families | 568 (42.4%) | $105,978 |
| 3-Person Families | 250 (18.7%) | $141,371 |
| 4-Person Families | 358 (26.7%) | $173,649 |
| 5-Person Families | 130 (9.7%) | $179,306 |
| 6-Person Families | 24 (1.8%) | $0 |
| 7+ Person Families | 9 (0.7%) | $0 |
| Total | 1,339 (100.0%) | $141,042 |
Family Income by Number of Earners in Manchester
The median family income in Manchester is $141,042, with families comprising 3+ earners (304) having the highest median family income of $178,667, while families with no earners (176) have the lowest median family income of $57,778, accounting for 22.7% and 13.1% of families, respectively.
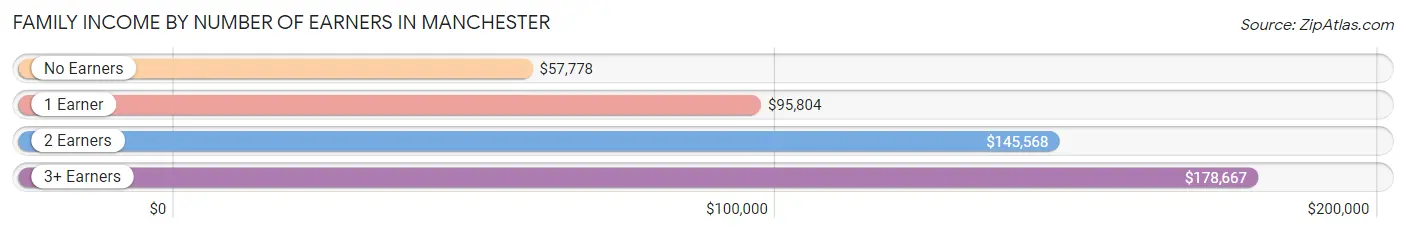
| Number of Earners | # Families | Median Income |
| No Earners | 176 (13.1%) | $57,778 |
| 1 Earner | 300 (22.4%) | $95,804 |
| 2 Earners | 559 (41.7%) | $145,568 |
| 3+ Earners | 304 (22.7%) | $178,667 |
| Total | 1,339 (100.0%) | $141,042 |
Household Income in Manchester
Household Income Brackets in Manchester
With 469 households falling in the category, the $100,000 to $149,999 income range is the most frequent in Manchester, accounting for 22.6% of all households. In contrast, only 42 households (2.0%) fall into the $15,000 to $24,999 income bracket, making it the least populous group.
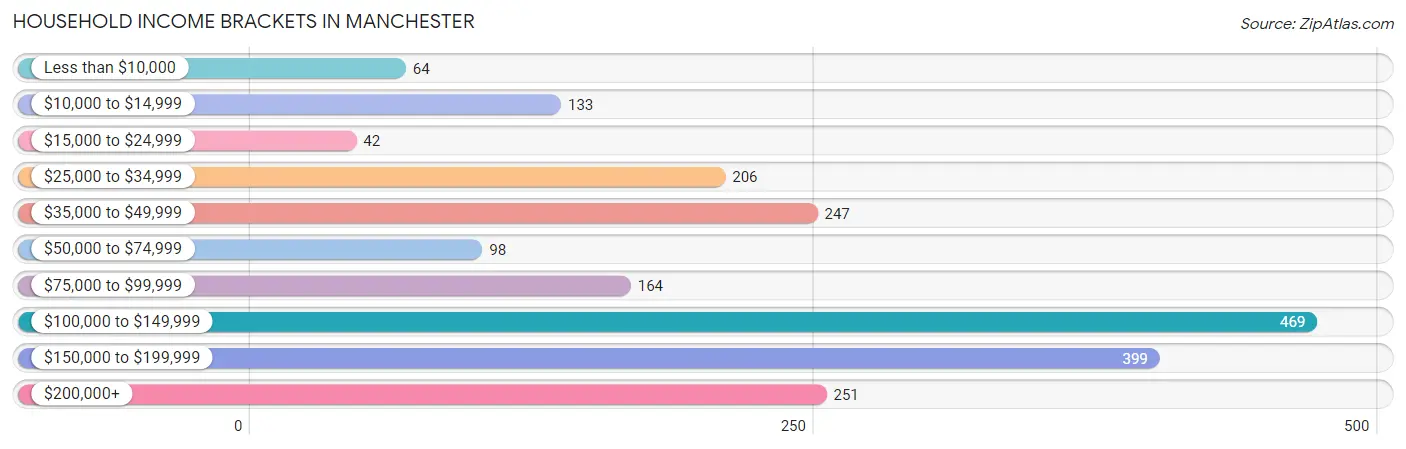
| Income Bracket | # Households | % Households |
| Less than $10,000 | 64 | 3.1% |
| $10,000 to $14,999 | 133 | 6.4% |
| $15,000 to $24,999 | 42 | 2.0% |
| $25,000 to $34,999 | 206 | 9.9% |
| $35,000 to $49,999 | 247 | 11.9% |
| $50,000 to $74,999 | 98 | 4.7% |
| $75,000 to $99,999 | 164 | 7.9% |
| $100,000 to $149,999 | 469 | 22.6% |
| $150,000 to $199,999 | 399 | 19.2% |
| $200,000+ | 251 | 12.1% |
Household Income by Householder Age in Manchester
The median household income in Manchester is $103,629, with the highest median household income of $142,260 found in the 45 to 64 years age bracket for the primary householder. A total of 836 households (40.3%) fall into this category. Meanwhile, the 15 to 24 years age bracket for the primary householder has the lowest median household income of $0, with 36 households (1.7%) in this group.
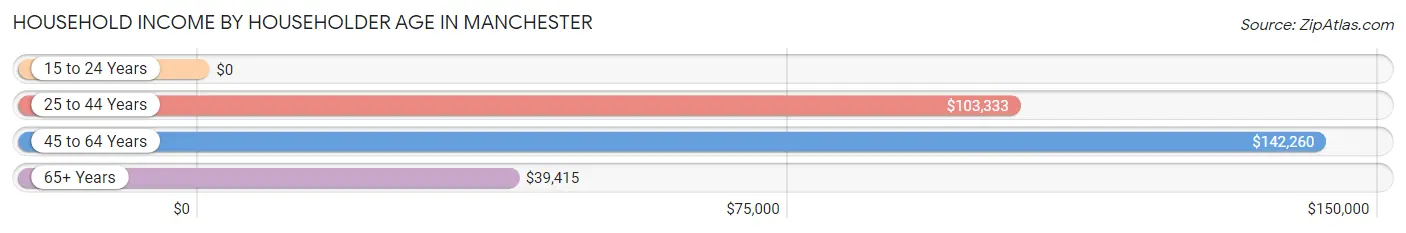
| Income Bracket | # Households | Median Income |
| 15 to 24 Years | 36 (1.7%) | $0 |
| 25 to 44 Years | 544 (26.2%) | $103,333 |
| 45 to 64 Years | 836 (40.3%) | $142,260 |
| 65+ Years | 660 (31.8%) | $39,415 |
| Total | 2,076 (100.0%) | $103,629 |
Poverty in Manchester
Income Below Poverty by Sex and Age in Manchester
With 6.6% poverty level for males and 6.0% for females among the residents of Manchester, 75 year old and over males and 75 year old and over females are the most vulnerable to poverty, with 52 males (34.9%) and 53 females (16.1%) in their respective age groups living below the poverty level.
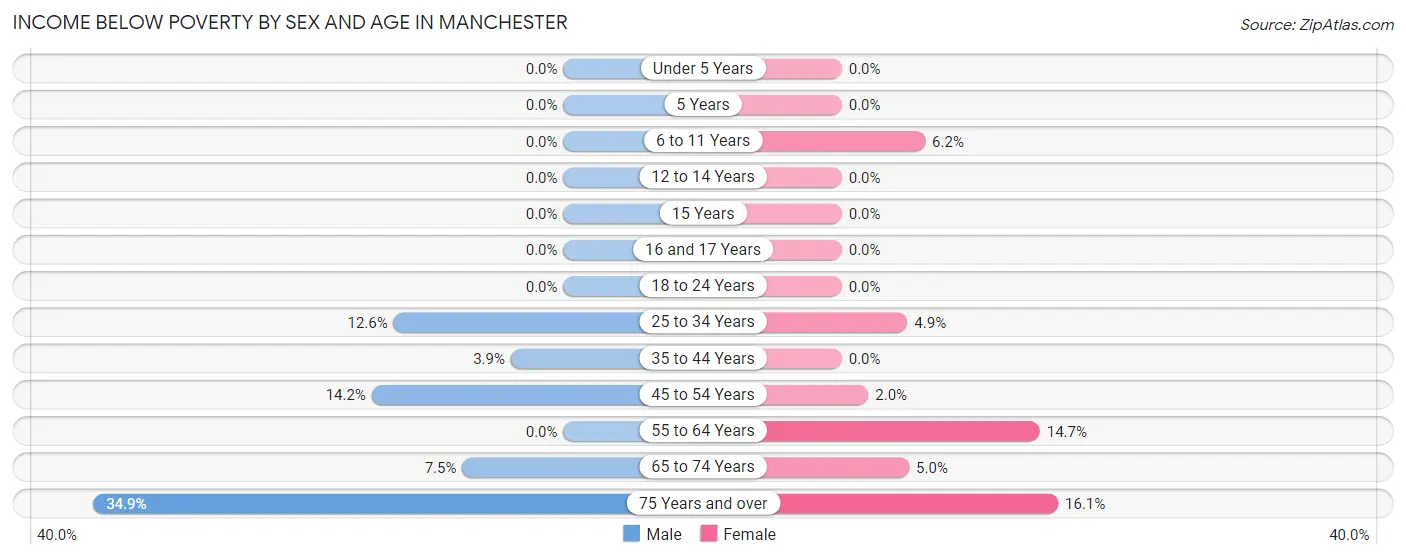
| Age Bracket | Male | Female |
| Under 5 Years | 0 (0.0%) | 0 (0.0%) |
| 5 Years | 0 (0.0%) | 0 (0.0%) |
| 6 to 11 Years | 0 (0.0%) | 12 (6.2%) |
| 12 to 14 Years | 0 (0.0%) | 0 (0.0%) |
| 15 Years | 0 (0.0%) | 0 (0.0%) |
| 16 and 17 Years | 0 (0.0%) | 0 (0.0%) |
| 18 to 24 Years | 0 (0.0%) | 0 (0.0%) |
| 25 to 34 Years | 56 (12.6%) | 11 (4.9%) |
| 35 to 44 Years | 11 (3.9%) | 0 (0.0%) |
| 45 to 54 Years | 36 (14.2%) | 7 (2.0%) |
| 55 to 64 Years | 0 (0.0%) | 66 (14.7%) |
| 65 to 74 Years | 18 (7.5%) | 12 (5.0%) |
| 75 Years and over | 52 (34.9%) | 53 (16.1%) |
| Total | 173 (6.6%) | 161 (6.0%) |
Income Above Poverty by Sex and Age in Manchester
According to the poverty statistics in Manchester, males aged under 5 years and females aged under 5 years are the age groups that are most secure financially, with 100.0% of males and 100.0% of females in these age groups living above the poverty line.
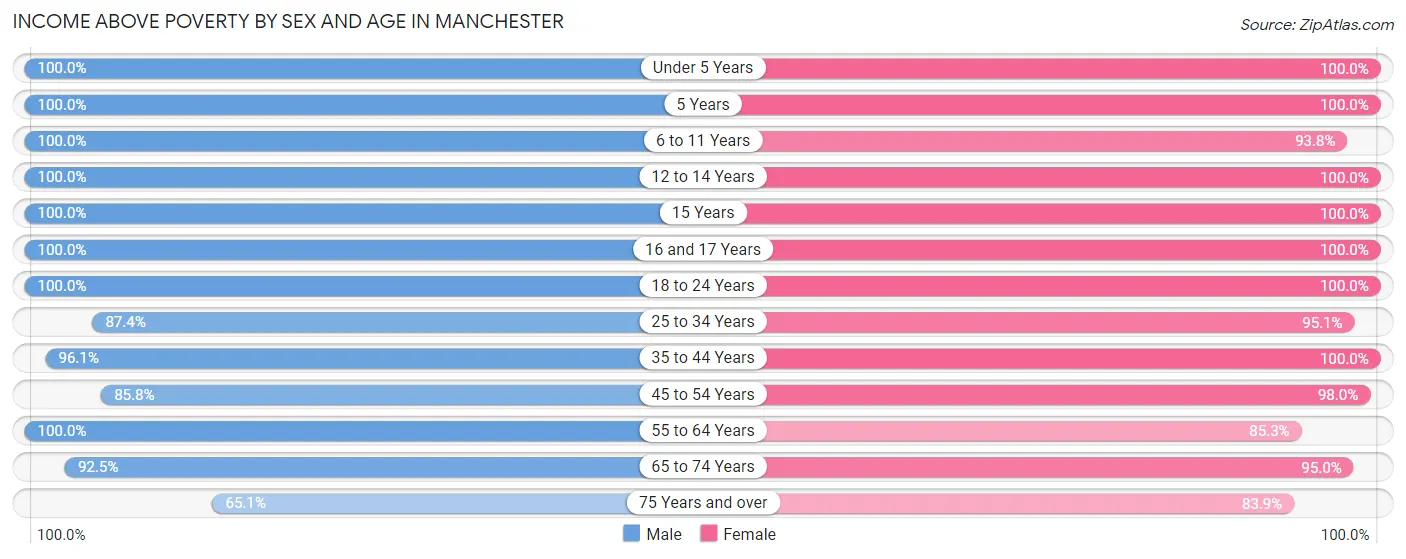
| Age Bracket | Male | Female |
| Under 5 Years | 252 (100.0%) | 31 (100.0%) |
| 5 Years | 47 (100.0%) | 29 (100.0%) |
| 6 to 11 Years | 79 (100.0%) | 182 (93.8%) |
| 12 to 14 Years | 97 (100.0%) | 131 (100.0%) |
| 15 Years | 34 (100.0%) | 83 (100.0%) |
| 16 and 17 Years | 104 (100.0%) | 47 (100.0%) |
| 18 to 24 Years | 189 (100.0%) | 274 (100.0%) |
| 25 to 34 Years | 388 (87.4%) | 215 (95.1%) |
| 35 to 44 Years | 271 (96.1%) | 277 (100.0%) |
| 45 to 54 Years | 217 (85.8%) | 348 (98.0%) |
| 55 to 64 Years | 465 (100.0%) | 383 (85.3%) |
| 65 to 74 Years | 222 (92.5%) | 228 (95.0%) |
| 75 Years and over | 97 (65.1%) | 277 (83.9%) |
| Total | 2,462 (93.4%) | 2,505 (94.0%) |
Income Below Poverty Among Married-Couple Families in Manchester
The poverty statistics for married-couple families in Manchester show that 3.6% or 41 of the total 1,150 families live below the poverty line. Families with no children have the highest poverty rate of 4.2%, comprising of 30 families. On the other hand, families with 3 or 4 children have the lowest poverty rate of 0.0%, which includes 0 families.
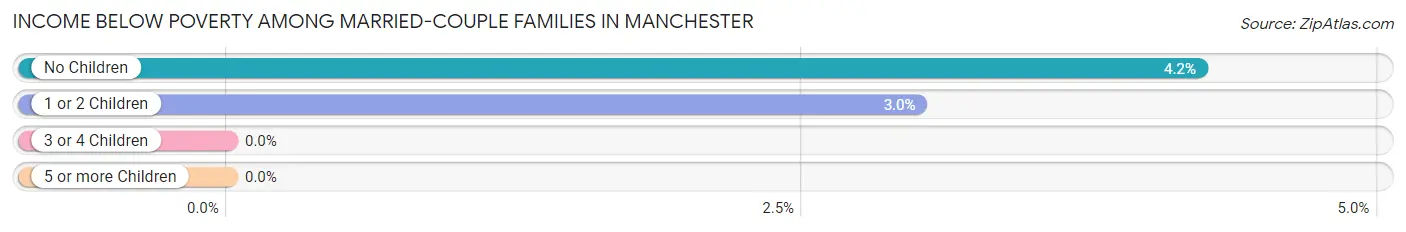
| Children | Above Poverty | Below Poverty |
| No Children | 681 (95.8%) | 30 (4.2%) |
| 1 or 2 Children | 356 (97.0%) | 11 (3.0%) |
| 3 or 4 Children | 72 (100.0%) | 0 (0.0%) |
| 5 or more Children | 0 (0.0%) | 0 (0.0%) |
| Total | 1,109 (96.4%) | 41 (3.6%) |
Income Below Poverty Among Single-Parent Households in Manchester
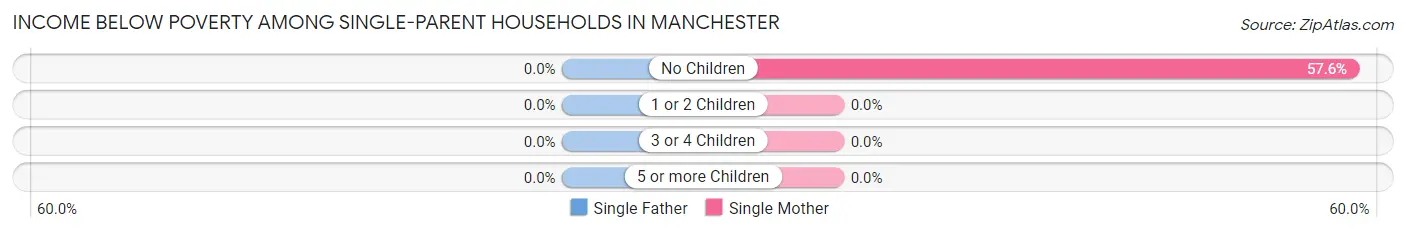
| Children | Single Father | Single Mother |
| No Children | 0 (0.0%) | 19 (57.6%) |
| 1 or 2 Children | 0 (0.0%) | 0 (0.0%) |
| 3 or 4 Children | 0 (0.0%) | 0 (0.0%) |
| 5 or more Children | 0 (0.0%) | 0 (0.0%) |
| Total | 0 (0.0%) | 19 (19.2%) |
Income Below Poverty Among Married-Couple vs Single-Parent Households in Manchester
The poverty data for Manchester shows that 41 of the married-couple family households (3.6%) and 19 of the single-parent households (10.1%) are living below the poverty level. Within the married-couple family households, those with no children have the highest poverty rate, with 30 households (4.2%) falling below the poverty line. Among the single-parent households, those with no children have the highest poverty rate, with 19 household (57.6%) living below poverty.
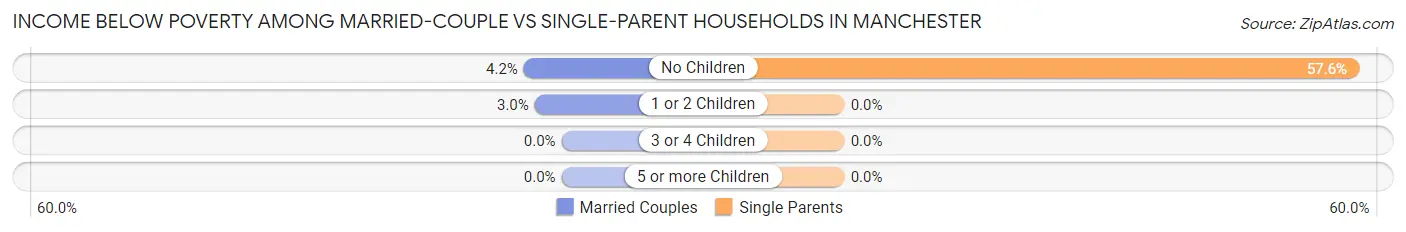
| Children | Married-Couple Families | Single-Parent Households |
| No Children | 30 (4.2%) | 19 (57.6%) |
| 1 or 2 Children | 11 (3.0%) | 0 (0.0%) |
| 3 or 4 Children | 0 (0.0%) | 0 (0.0%) |
| 5 or more Children | 0 (0.0%) | 0 (0.0%) |
| Total | 41 (3.6%) | 19 (10.1%) |
Race in Manchester
The most populous races in Manchester are White / Caucasian (4,942 | 91.5%), Two or more Races (296 | 5.5%), and Hispanic or Latino (157 | 2.9%).
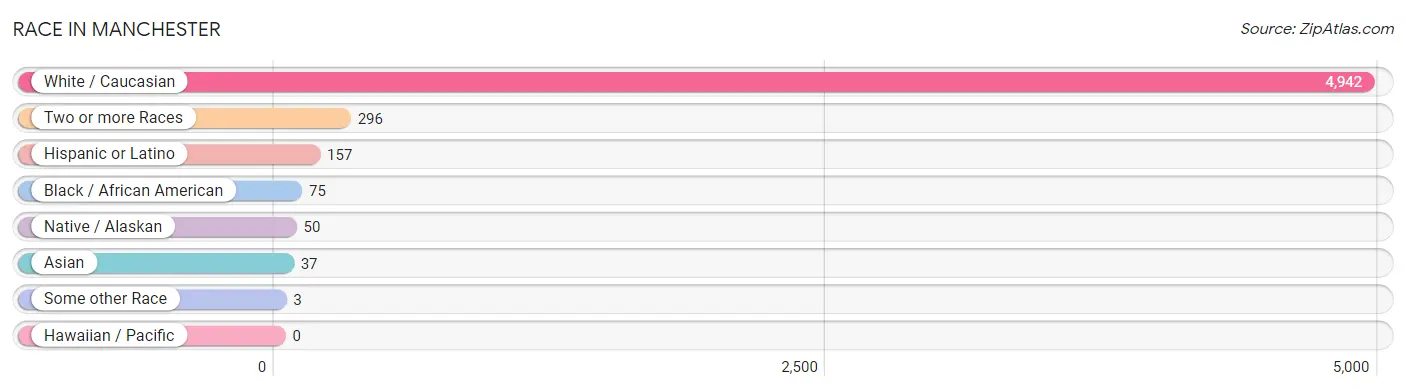
| Race | # Population | % Population |
| Asian | 37 | 0.7% |
| Black / African American | 75 | 1.4% |
| Hawaiian / Pacific | 0 | 0.0% |
| Hispanic or Latino | 157 | 2.9% |
| Native / Alaskan | 50 | 0.9% |
| White / Caucasian | 4,942 | 91.5% |
| Two or more Races | 296 | 5.5% |
| Some other Race | 3 | 0.1% |
| Total | 5,403 | 100.0% |
Ancestry in Manchester
The most populous ancestries reported in Manchester are German (1,675 | 31.0%), Irish (1,008 | 18.7%), English (847 | 15.7%), American (652 | 12.1%), and Italian (459 | 8.5%), together accounting for 85.9% of all Manchester residents.

| Ancestry | # Population | % Population |
| American | 652 | 12.1% |
| Arab | 60 | 1.1% |
| Bhutanese | 16 | 0.3% |
| Blackfeet | 1 | 0.0% |
| Brazilian | 12 | 0.2% |
| British | 111 | 2.1% |
| Cherokee | 42 | 0.8% |
| Creek | 37 | 0.7% |
| Czech | 20 | 0.4% |
| Danish | 9 | 0.2% |
| Dutch | 12 | 0.2% |
| Eastern European | 36 | 0.7% |
| English | 847 | 15.7% |
| European | 91 | 1.7% |
| French | 80 | 1.5% |
| French Canadian | 10 | 0.2% |
| German | 1,675 | 31.0% |
| Greek | 14 | 0.3% |
| Irish | 1,008 | 18.7% |
| Italian | 459 | 8.5% |
| Korean | 20 | 0.4% |
| Lebanese | 49 | 0.9% |
| Lithuanian | 32 | 0.6% |
| Mexican | 134 | 2.5% |
| Norwegian | 32 | 0.6% |
| Polish | 255 | 4.7% |
| Puerto Rican | 23 | 0.4% |
| Romanian | 58 | 1.1% |
| Russian | 50 | 0.9% |
| Scotch-Irish | 44 | 0.8% |
| Scottish | 76 | 1.4% |
| Sri Lankan | 68 | 1.3% |
| Swedish | 34 | 0.6% |
| Ukrainian | 30 | 0.6% | View All 34 Rows |
Immigrants in Manchester
The most numerous immigrant groups reported in Manchester came from Europe (146 | 2.7%), Eastern Europe (93 | 1.7%), Asia (62 | 1.1%), Romania (58 | 1.1%), and South Eastern Asia (37 | 0.7%), together accounting for 7.3% of all Manchester residents.
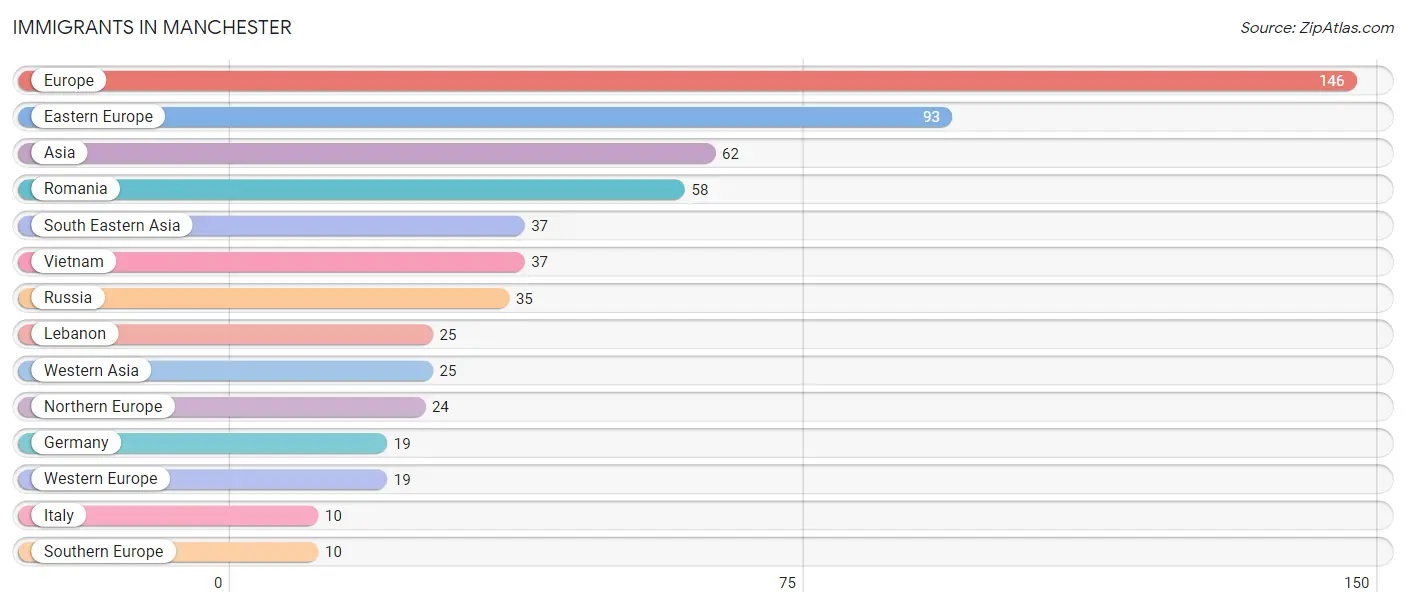
| Immigration Origin | # Population | % Population |
| Asia | 62 | 1.1% |
| Eastern Europe | 93 | 1.7% |
| Europe | 146 | 2.7% |
| Germany | 19 | 0.4% |
| Italy | 10 | 0.2% |
| Lebanon | 25 | 0.5% |
| Northern Europe | 24 | 0.4% |
| Romania | 58 | 1.1% |
| Russia | 35 | 0.6% |
| South Eastern Asia | 37 | 0.7% |
| Southern Europe | 10 | 0.2% |
| Vietnam | 37 | 0.7% |
| Western Asia | 25 | 0.5% |
| Western Europe | 19 | 0.4% | View All 14 Rows |
Sex and Age in Manchester
Sex and Age in Manchester
The most populous age groups in Manchester are 55 to 59 Years (319 | 11.8%) for men and 60 to 64 Years (249 | 9.2%) for women.
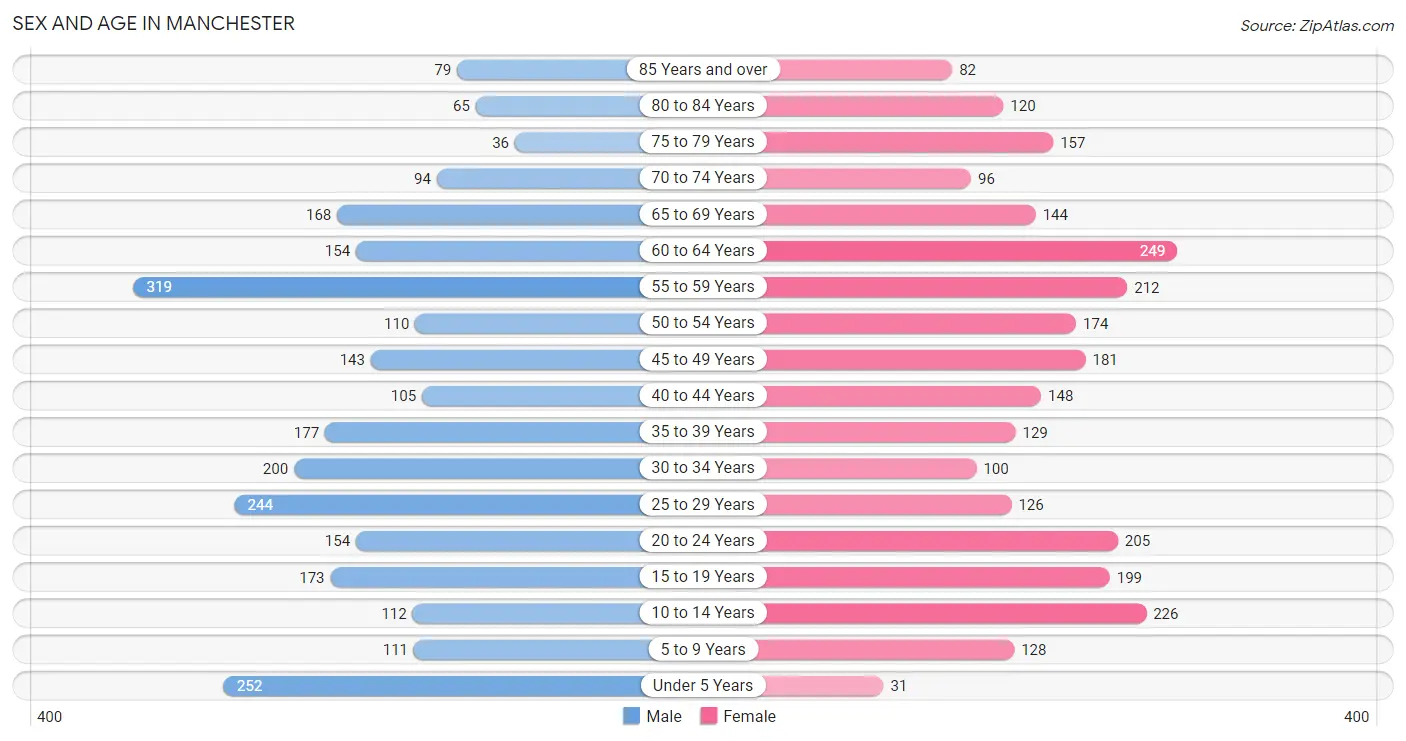
| Age Bracket | Male | Female |
| Under 5 Years | 252 (9.3%) | 31 (1.1%) |
| 5 to 9 Years | 111 (4.1%) | 128 (4.7%) |
| 10 to 14 Years | 112 (4.2%) | 226 (8.4%) |
| 15 to 19 Years | 173 (6.4%) | 199 (7.3%) |
| 20 to 24 Years | 154 (5.7%) | 205 (7.6%) |
| 25 to 29 Years | 244 (9.0%) | 126 (4.6%) |
| 30 to 34 Years | 200 (7.4%) | 100 (3.7%) |
| 35 to 39 Years | 177 (6.6%) | 129 (4.8%) |
| 40 to 44 Years | 105 (3.9%) | 148 (5.5%) |
| 45 to 49 Years | 143 (5.3%) | 181 (6.7%) |
| 50 to 54 Years | 110 (4.1%) | 174 (6.4%) |
| 55 to 59 Years | 319 (11.8%) | 212 (7.8%) |
| 60 to 64 Years | 154 (5.7%) | 249 (9.2%) |
| 65 to 69 Years | 168 (6.2%) | 144 (5.3%) |
| 70 to 74 Years | 94 (3.5%) | 96 (3.5%) |
| 75 to 79 Years | 36 (1.3%) | 157 (5.8%) |
| 80 to 84 Years | 65 (2.4%) | 120 (4.4%) |
| 85 Years and over | 79 (2.9%) | 82 (3.0%) |
| Total | 2,696 (100.0%) | 2,707 (100.0%) |
Families and Households in Manchester
Median Family Size in Manchester
The median family size in Manchester is 3.30 persons per family, with married-couple families (1,150 | 85.9%) accounting for the largest median family size of 3.34 persons per family. On the other hand, single male/father families (90 | 6.7%) represent the smallest median family size with 3.04 persons per family.
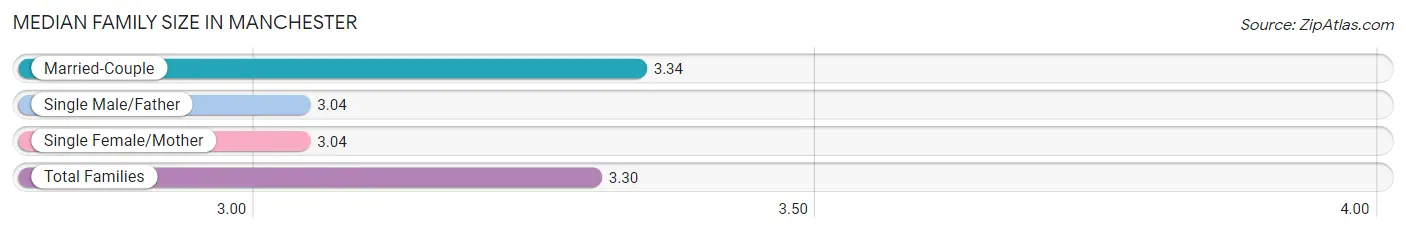
| Family Type | # Families | Family Size |
| Married-Couple | 1,150 (85.9%) | 3.34 |
| Single Male/Father | 90 (6.7%) | 3.04 |
| Single Female/Mother | 99 (7.4%) | 3.04 |
| Total Families | 1,339 (100.0%) | 3.30 |
Median Household Size in Manchester
The median household size in Manchester is 2.55 persons per household, with single male/father households (90 | 4.3%) accounting for the largest median household size of 3.8 persons per household. non-family households (737 | 35.5%) represent the smallest median household size with 1.03 persons per household.
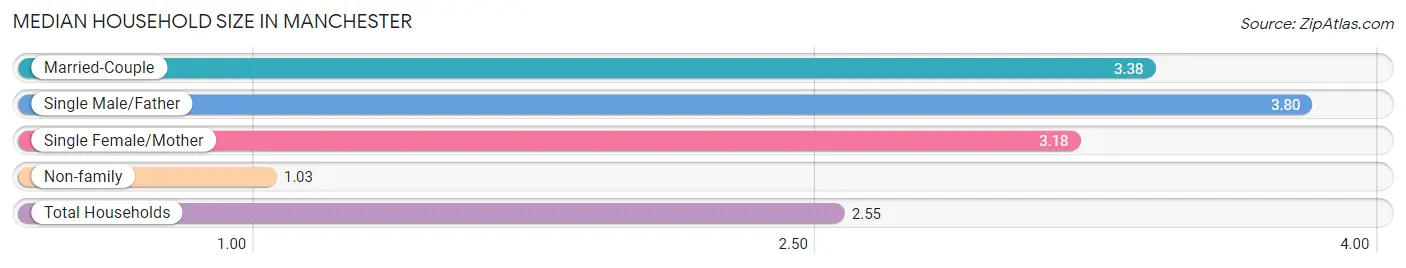
| Household Type | # Households | Household Size |
| Married-Couple | 1,150 (55.4%) | 3.38 |
| Single Male/Father | 90 (4.3%) | 3.80 |
| Single Female/Mother | 99 (4.8%) | 3.18 |
| Non-family | 737 (35.5%) | 1.03 |
| Total Households | 2,076 (100.0%) | 2.55 |
Household Size by Marriage Status in Manchester
Out of a total of 2,076 households in Manchester, 1,339 (64.5%) are family households, while 737 (35.5%) are nonfamily households. The most numerous type of family households are 2-person households, comprising 514, and the most common type of nonfamily households are 1-person households, comprising 716.
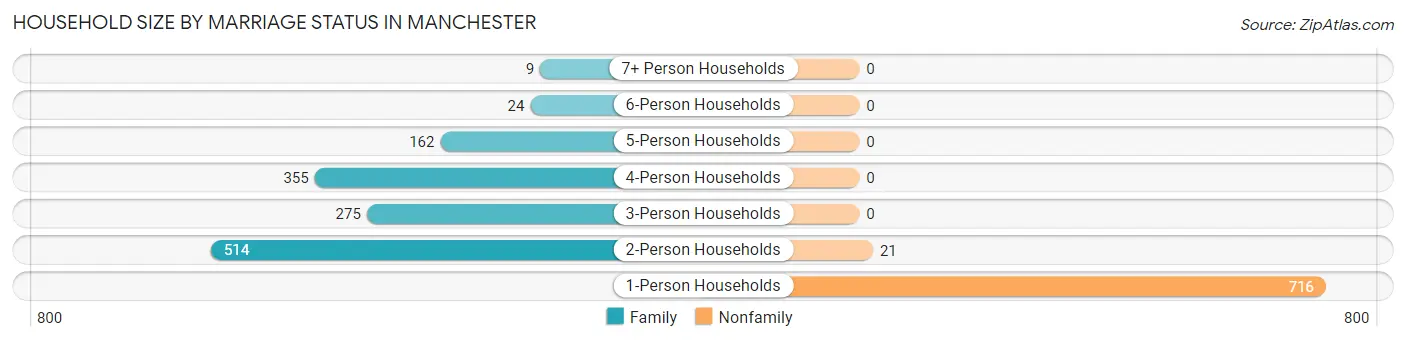
| Household Size | Family Households | Nonfamily Households |
| 1-Person Households | - | 716 (34.5%) |
| 2-Person Households | 514 (24.8%) | 21 (1.0%) |
| 3-Person Households | 275 (13.3%) | 0 (0.0%) |
| 4-Person Households | 355 (17.1%) | 0 (0.0%) |
| 5-Person Households | 162 (7.8%) | 0 (0.0%) |
| 6-Person Households | 24 (1.2%) | 0 (0.0%) |
| 7+ Person Households | 9 (0.4%) | 0 (0.0%) |
| Total | 1,339 (64.5%) | 737 (35.5%) |
Female Fertility in Manchester
Fertility by Age in Manchester
Average fertility rate in Manchester is 35.0 births per 1,000 women. Women in the age bracket of 20 to 34 years have the highest fertility rate with 51.0 births per 1,000 women. Women in the age bracket of 20 to 34 years acount for 55.0% of all women with births.
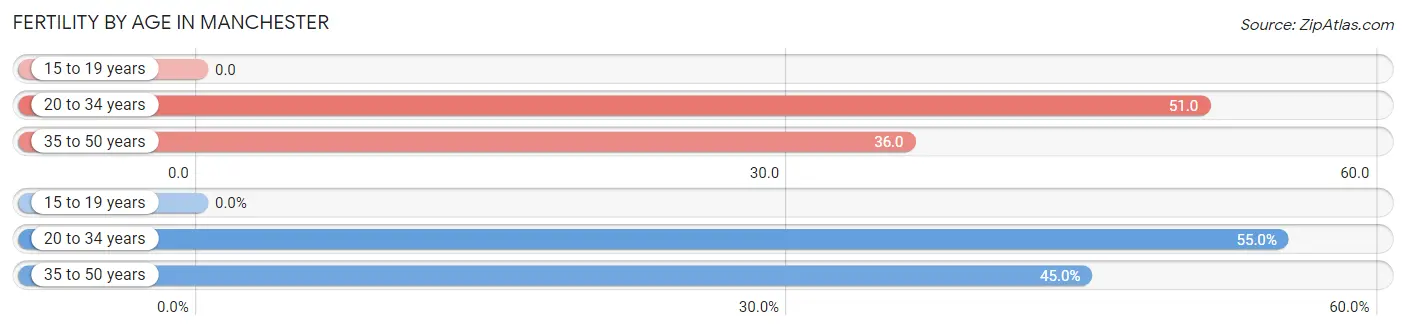
| Age Bracket | Women with Births | Births / 1,000 Women |
| 15 to 19 years | 0 (0.0%) | 0.0 |
| 20 to 34 years | 22 (55.0%) | 51.0 |
| 35 to 50 years | 18 (45.0%) | 36.0 |
| Total | 40 (100.0%) | 35.0 |
Fertility by Age by Marriage Status in Manchester
80.0% of women with births (40) in Manchester are married. The highest percentage of unmarried women with births falls into 20 to 34 years age bracket with 36.4% of them unmarried at the time of birth, while the lowest percentage of unmarried women with births belong to 35 to 50 years age bracket with 0.0% of them unmarried.
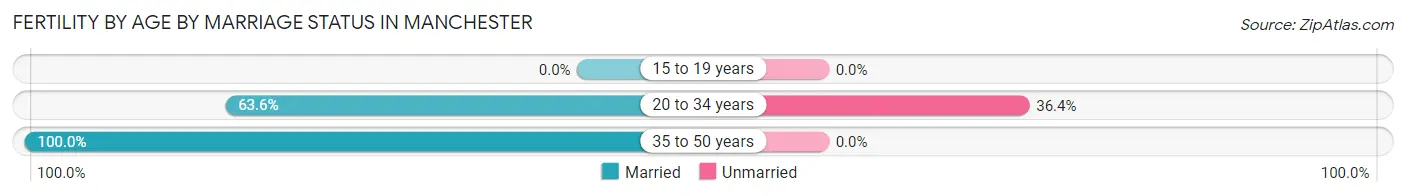
| Age Bracket | Married | Unmarried |
| 15 to 19 years | 0 (0.0%) | 0 (0.0%) |
| 20 to 34 years | 14 (63.6%) | 8 (36.4%) |
| 35 to 50 years | 18 (100.0%) | 0 (0.0%) |
| Total | 32 (80.0%) | 8 (20.0%) |
Fertility by Education in Manchester
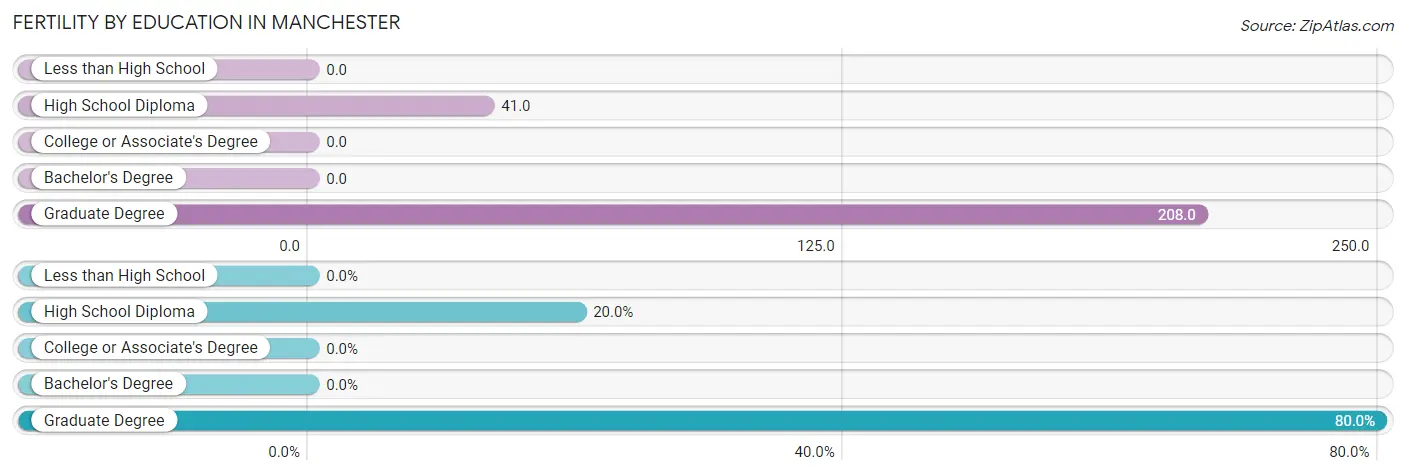
| Educational Attainment | Women with Births | Births / 1,000 Women |
| Less than High School | 0 (0.0%) | 0.0 |
| High School Diploma | 8 (20.0%) | 41.0 |
| College or Associate's Degree | 0 (0.0%) | 0.0 |
| Bachelor's Degree | 0 (0.0%) | 0.0 |
| Graduate Degree | 32 (80.0%) | 208.0 |
| Total | 40 (100.0%) | 35.0 |
Fertility by Education by Marriage Status in Manchester
20.0% of women with births in Manchester are unmarried. Women with the educational attainment of graduate degree are most likely to be married with 100.0% of them married at childbirth, while women with the educational attainment of high school diploma are least likely to be married with 100.0% of them unmarried at childbirth.
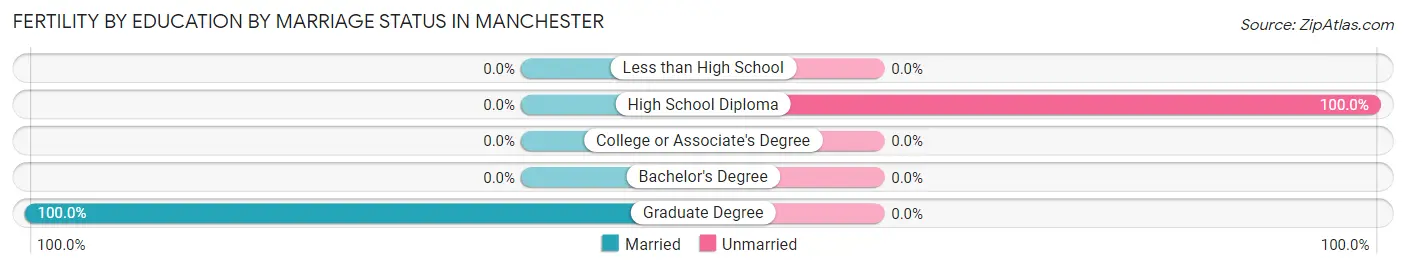
| Educational Attainment | Married | Unmarried |
| Less than High School | 0 (0.0%) | 0 (0.0%) |
| High School Diploma | 0 (0.0%) | 8 (100.0%) |
| College or Associate's Degree | 0 (0.0%) | 0 (0.0%) |
| Bachelor's Degree | 0 (0.0%) | 0 (0.0%) |
| Graduate Degree | 32 (100.0%) | 0 (0.0%) |
| Total | 32 (80.0%) | 8 (20.0%) |
Employment Characteristics in Manchester
Employment by Class of Employer in Manchester
Among the 2,928 employed individuals in Manchester, private company employees (1,933 | 66.0%), local government employees (334 | 11.4%), and not-for-profit organizations (188 | 6.4%) make up the most common classes of employment.
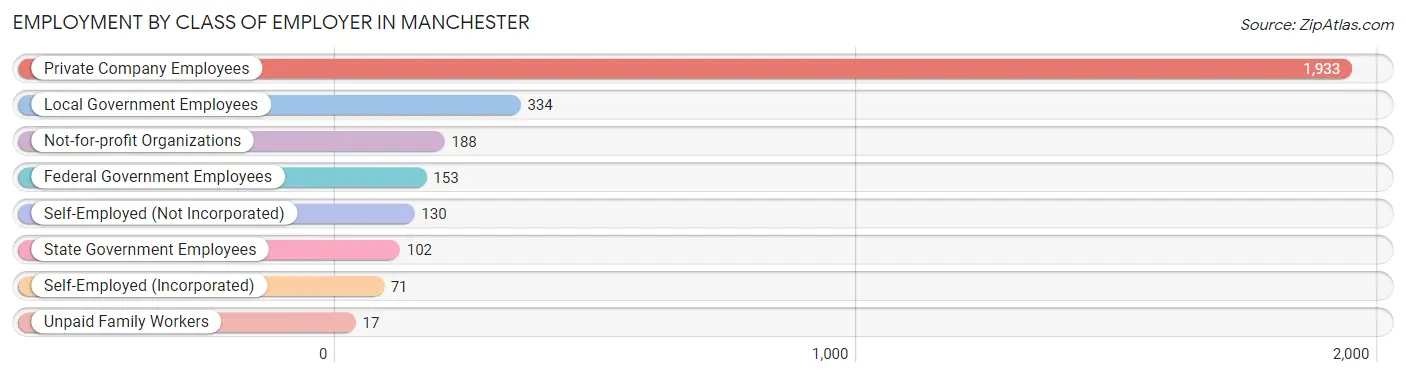
| Employer Class | # Employees | % Employees |
| Private Company Employees | 1,933 | 66.0% |
| Self-Employed (Incorporated) | 71 | 2.4% |
| Self-Employed (Not Incorporated) | 130 | 4.4% |
| Not-for-profit Organizations | 188 | 6.4% |
| Local Government Employees | 334 | 11.4% |
| State Government Employees | 102 | 3.5% |
| Federal Government Employees | 153 | 5.2% |
| Unpaid Family Workers | 17 | 0.6% |
| Total | 2,928 | 100.0% |
Employment Status by Age in Manchester
According to the labor force statistics for Manchester, out of the total population over 16 years of age (4,426), 68.4% or 3,027 individuals are in the labor force, with 0.9% or 27 of them unemployed. The age group with the highest labor force participation rate is 25 to 29 years, with 100.0% or 370 individuals in the labor force. Within the labor force, the 16 to 19 years age range has the highest percentage of unemployed individuals, with 5.0% or 9 of them being unemployed.
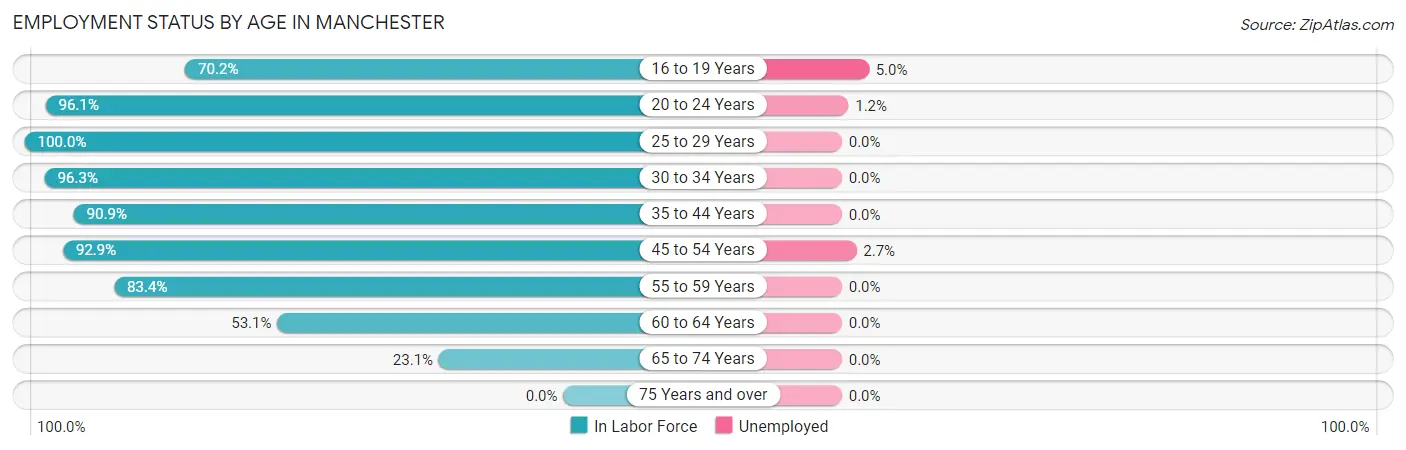
| Age Bracket | In Labor Force | Unemployed |
| 16 to 19 Years | 179 (70.2%) | 9 (5.0%) |
| 20 to 24 Years | 345 (96.1%) | 4 (1.2%) |
| 25 to 29 Years | 370 (100.0%) | 0 (0.0%) |
| 30 to 34 Years | 289 (96.3%) | 0 (0.0%) |
| 35 to 44 Years | 508 (90.9%) | 0 (0.0%) |
| 45 to 54 Years | 565 (92.9%) | 15 (2.7%) |
| 55 to 59 Years | 443 (83.4%) | 0 (0.0%) |
| 60 to 64 Years | 214 (53.1%) | 0 (0.0%) |
| 65 to 74 Years | 116 (23.1%) | 0 (0.0%) |
| 75 Years and over | 0 (0.0%) | 0 (0.0%) |
| Total | 3,027 (68.4%) | 27 (0.9%) |
Employment Status by Educational Attainment in Manchester
According to labor force statistics for Manchester, 86.2% of individuals (2,389) out of the total population between 25 and 64 years of age (2,771) are in the labor force, with 0.6% or 14 of them being unemployed. The group with the highest labor force participation rate are those with the educational attainment of college / associate degree, with 90.3% or 846 individuals in the labor force. Within the labor force, individuals with college / associate degree education have the highest percentage of unemployment, with 1.8% or 15 of them being unemployed.
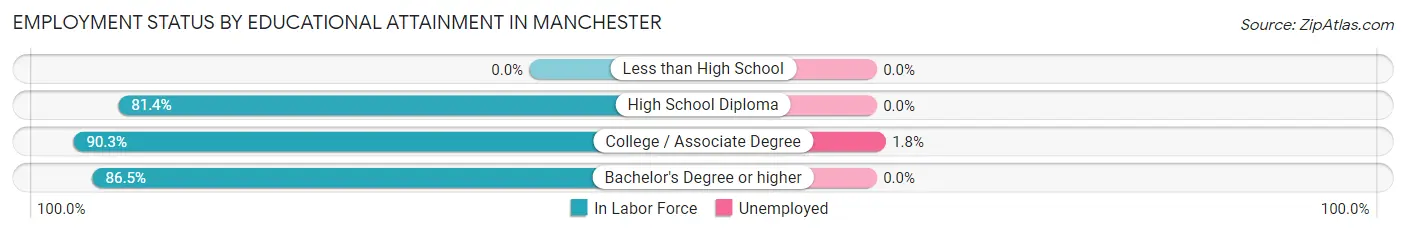
| Educational Attainment | In Labor Force | Unemployed |
| Less than High School | 0 (0.0%) | 0 (0.0%) |
| High School Diploma | 577 (81.4%) | 0 (0.0%) |
| College / Associate Degree | 846 (90.3%) | 17 (1.8%) |
| Bachelor's Degree or higher | 966 (86.5%) | 0 (0.0%) |
| Total | 2,389 (86.2%) | 17 (0.6%) |
Employment Occupations by Sex in Manchester
Management, Business, Science and Arts Occupations
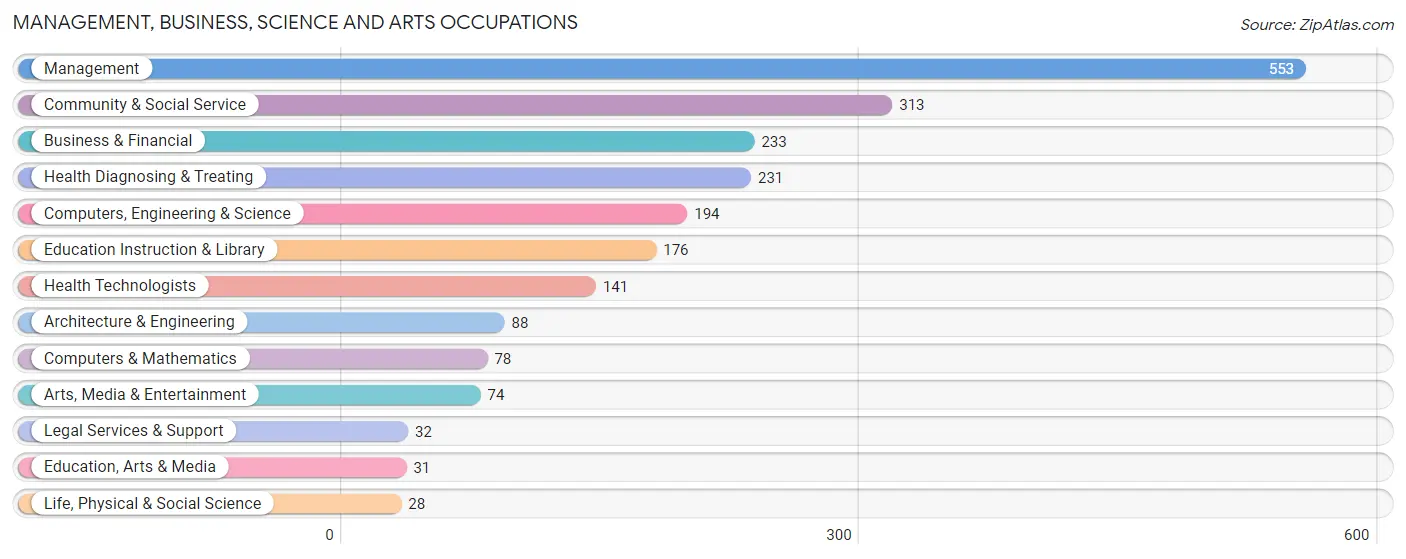
The most common Management, Business, Science and Arts occupations in Manchester are Management (553 | 18.4%), Community & Social Service (313 | 10.4%), Business & Financial (233 | 7.8%), Health Diagnosing & Treating (231 | 7.7%), and Computers, Engineering & Science (194 | 6.5%).
Management, Business, Science and Arts Occupations by Sex
Within the Management, Business, Science and Arts occupations in Manchester, the most male-oriented occupations are Arts, Media & Entertainment (100.0%), Computers & Mathematics (88.5%), and Architecture & Engineering (79.5%), while the most female-oriented occupations are Life, Physical & Social Science (100.0%), Education, Arts & Media (100.0%), and Legal Services & Support (100.0%).
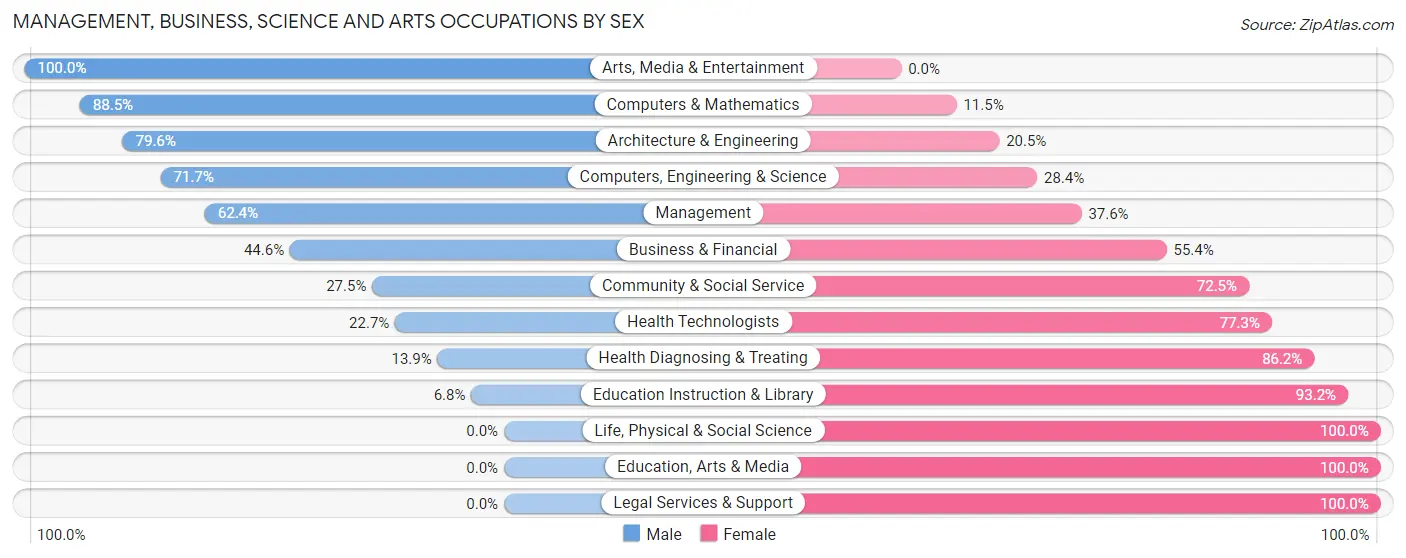
| Occupation | Male | Female |
| Management | 345 (62.4%) | 208 (37.6%) |
| Business & Financial | 104 (44.6%) | 129 (55.4%) |
| Computers, Engineering & Science | 139 (71.7%) | 55 (28.3%) |
| Computers & Mathematics | 69 (88.5%) | 9 (11.5%) |
| Architecture & Engineering | 70 (79.5%) | 18 (20.4%) |
| Life, Physical & Social Science | 0 (0.0%) | 28 (100.0%) |
| Community & Social Service | 86 (27.5%) | 227 (72.5%) |
| Education, Arts & Media | 0 (0.0%) | 31 (100.0%) |
| Legal Services & Support | 0 (0.0%) | 32 (100.0%) |
| Education Instruction & Library | 12 (6.8%) | 164 (93.2%) |
| Arts, Media & Entertainment | 74 (100.0%) | 0 (0.0%) |
| Health Diagnosing & Treating | 32 (13.9%) | 199 (86.2%) |
| Health Technologists | 32 (22.7%) | 109 (77.3%) |
| Total (Category) | 706 (46.3%) | 818 (53.7%) |
| Total (Overall) | 1,648 (54.9%) | 1,353 (45.1%) |
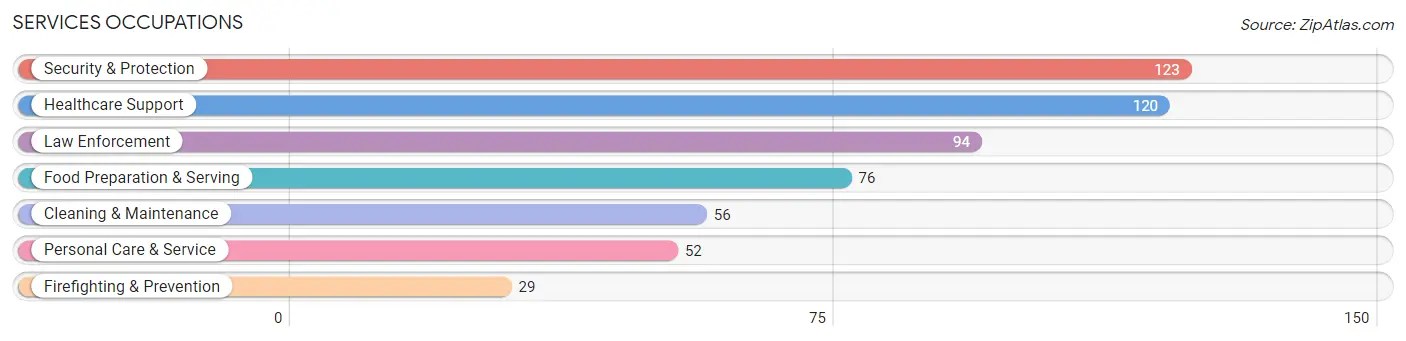
Services Occupations
The most common Services occupations in Manchester are Security & Protection (123 | 4.1%), Healthcare Support (120 | 4.0%), Law Enforcement (94 | 3.1%), Food Preparation & Serving (76 | 2.5%), and Cleaning & Maintenance (56 | 1.9%).
Services Occupations by Sex
Within the Services occupations in Manchester, the most male-oriented occupations are Security & Protection (100.0%), Firefighting & Prevention (100.0%), and Law Enforcement (100.0%), while the most female-oriented occupations are Personal Care & Service (82.7%), Healthcare Support (75.8%), and Food Preparation & Serving (25.0%).
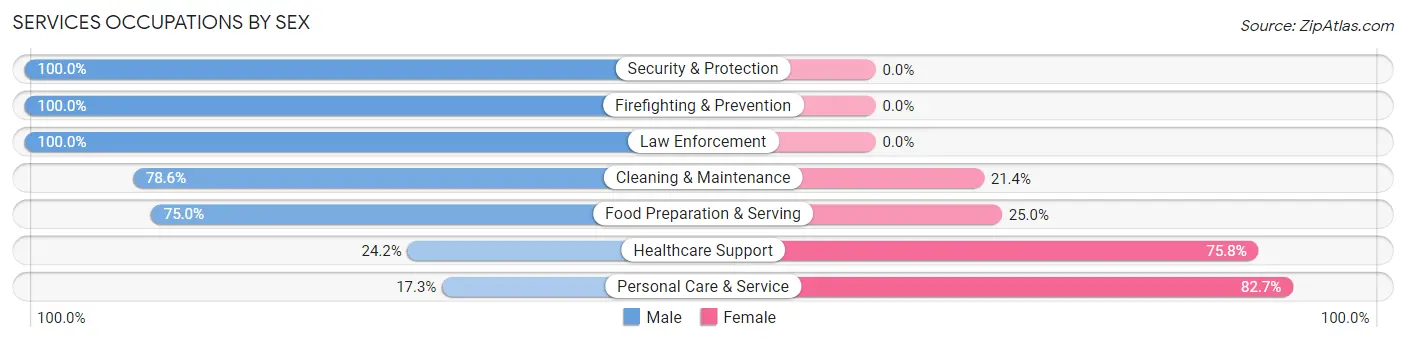
| Occupation | Male | Female |
| Healthcare Support | 29 (24.2%) | 91 (75.8%) |
| Security & Protection | 123 (100.0%) | 0 (0.0%) |
| Firefighting & Prevention | 29 (100.0%) | 0 (0.0%) |
| Law Enforcement | 94 (100.0%) | 0 (0.0%) |
| Food Preparation & Serving | 57 (75.0%) | 19 (25.0%) |
| Cleaning & Maintenance | 44 (78.6%) | 12 (21.4%) |
| Personal Care & Service | 9 (17.3%) | 43 (82.7%) |
| Total (Category) | 262 (61.4%) | 165 (38.6%) |
| Total (Overall) | 1,648 (54.9%) | 1,353 (45.1%) |
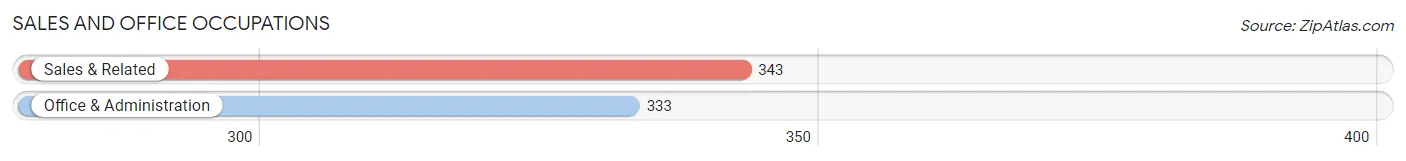
Sales and Office Occupations
The most common Sales and Office occupations in Manchester are Sales & Related (343 | 11.4%), and Office & Administration (333 | 11.1%).
Sales and Office Occupations by Sex
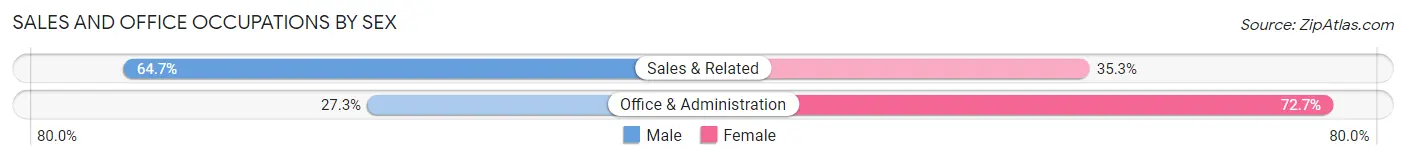
| Occupation | Male | Female |
| Sales & Related | 222 (64.7%) | 121 (35.3%) |
| Office & Administration | 91 (27.3%) | 242 (72.7%) |
| Total (Category) | 313 (46.3%) | 363 (53.7%) |
| Total (Overall) | 1,648 (54.9%) | 1,353 (45.1%) |
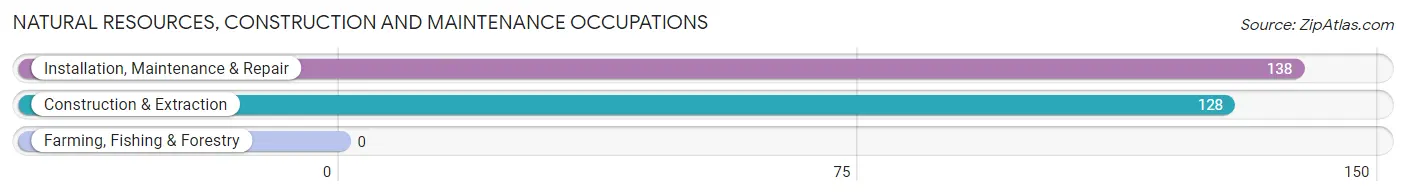
Natural Resources, Construction and Maintenance Occupations
The most common Natural Resources, Construction and Maintenance occupations in Manchester are Installation, Maintenance & Repair (138 | 4.6%), and Construction & Extraction (128 | 4.3%).
Natural Resources, Construction and Maintenance Occupations by Sex
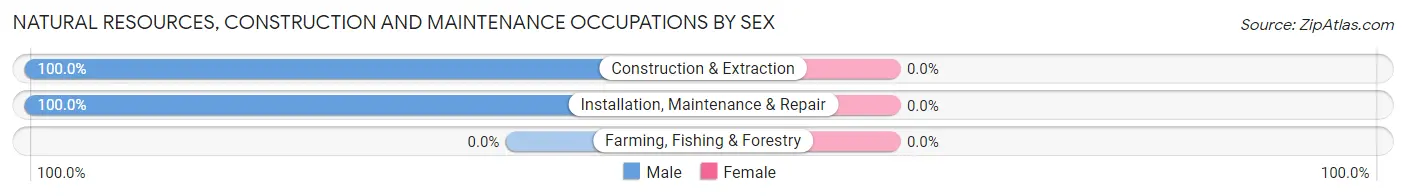
| Occupation | Male | Female |
| Farming, Fishing & Forestry | 0 (0.0%) | 0 (0.0%) |
| Construction & Extraction | 128 (100.0%) | 0 (0.0%) |
| Installation, Maintenance & Repair | 138 (100.0%) | 0 (0.0%) |
| Total (Category) | 266 (100.0%) | 0 (0.0%) |
| Total (Overall) | 1,648 (54.9%) | 1,353 (45.1%) |
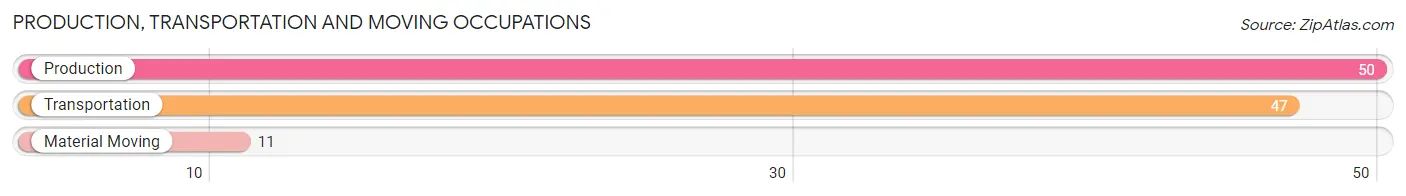
Production, Transportation and Moving Occupations
The most common Production, Transportation and Moving occupations in Manchester are Production (50 | 1.7%), Transportation (47 | 1.6%), and Material Moving (11 | 0.4%).
Production, Transportation and Moving Occupations by Sex
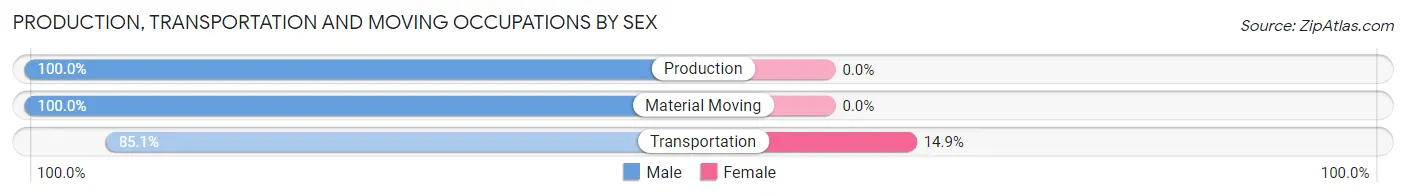
| Occupation | Male | Female |
| Production | 50 (100.0%) | 0 (0.0%) |
| Transportation | 40 (85.1%) | 7 (14.9%) |
| Material Moving | 11 (100.0%) | 0 (0.0%) |
| Total (Category) | 101 (93.5%) | 7 (6.5%) |
| Total (Overall) | 1,648 (54.9%) | 1,353 (45.1%) |
Employment Industries by Sex in Manchester
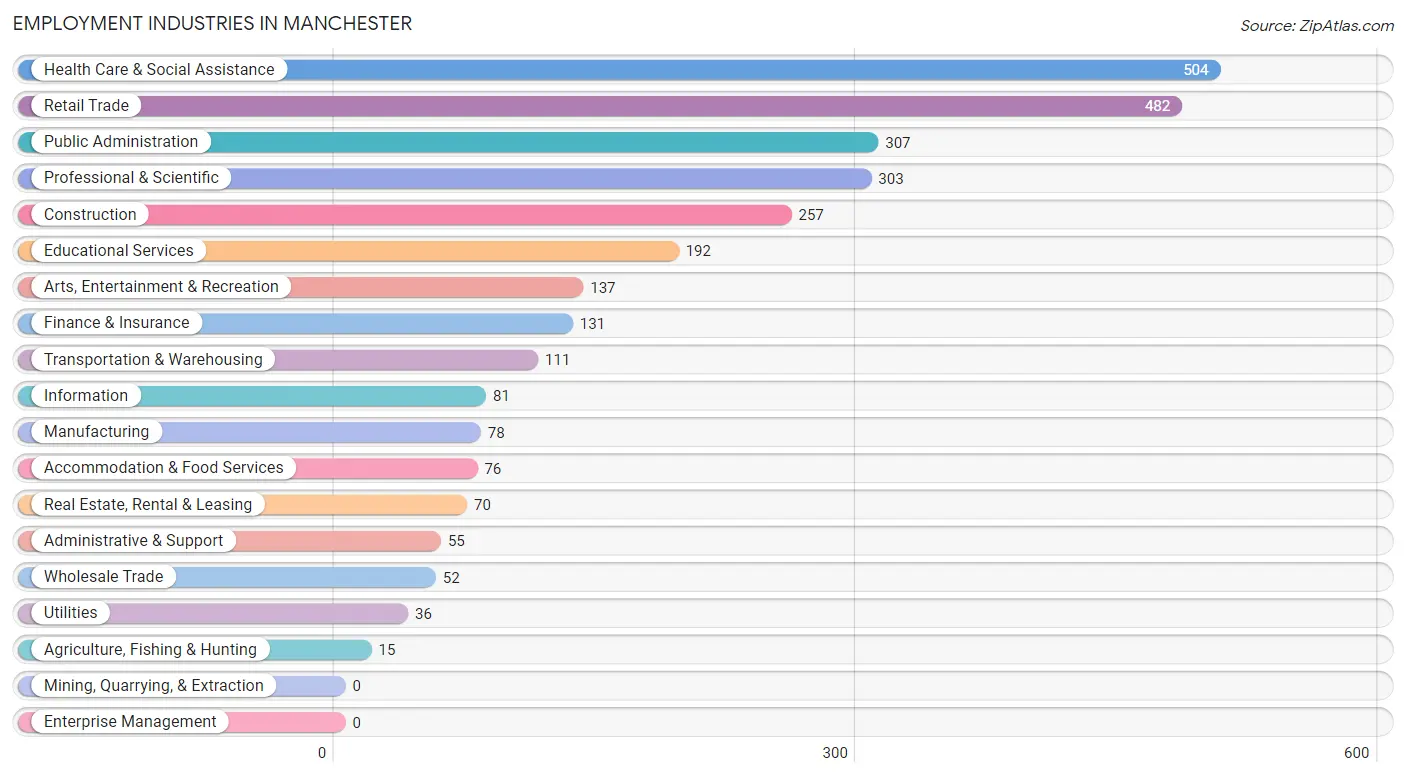
Employment Industries in Manchester
The major employment industries in Manchester include Health Care & Social Assistance (504 | 16.8%), Retail Trade (482 | 16.1%), Public Administration (307 | 10.2%), Professional & Scientific (303 | 10.1%), and Construction (257 | 8.6%).
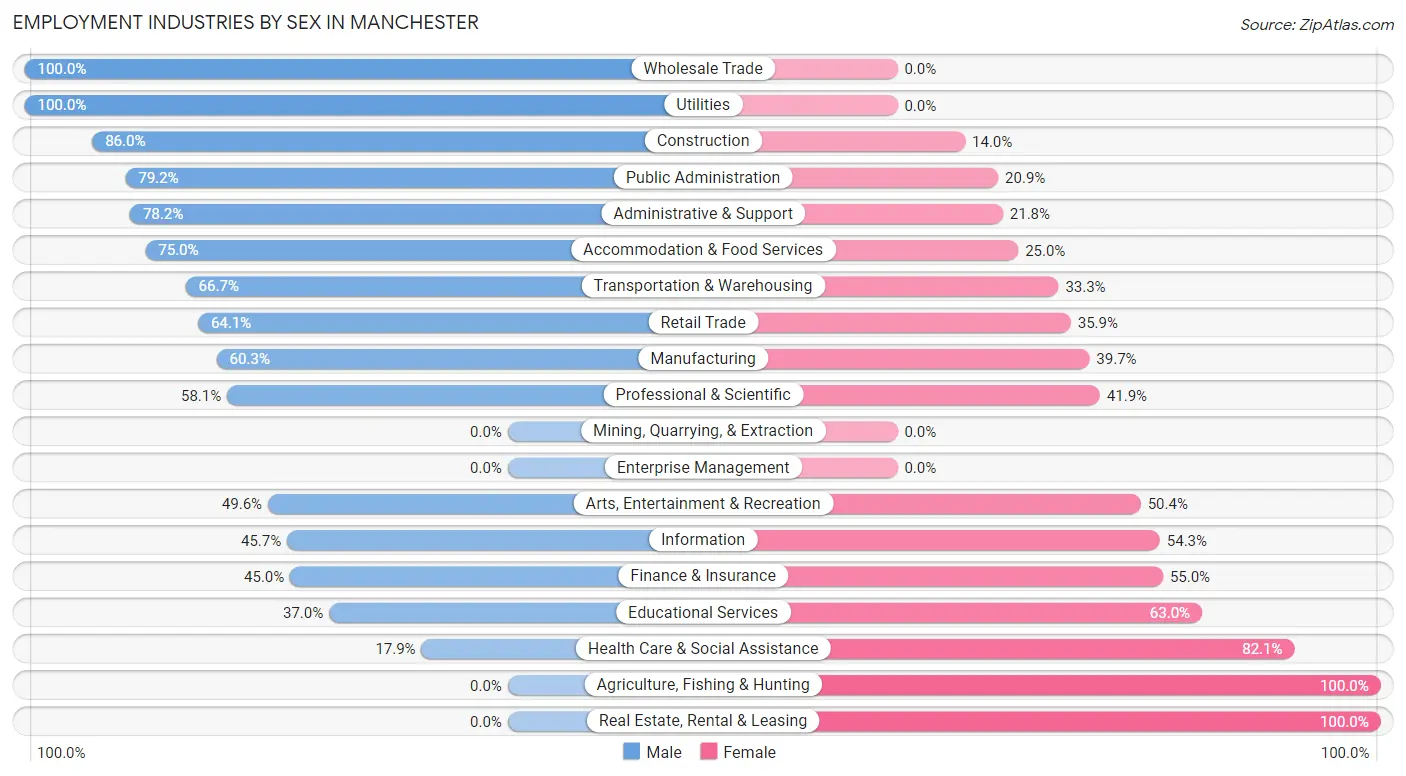
Employment Industries by Sex in Manchester
The Manchester industries that see more men than women are Wholesale Trade (100.0%), Utilities (100.0%), and Construction (86.0%), whereas the industries that tend to have a higher number of women are Agriculture, Fishing & Hunting (100.0%), Real Estate, Rental & Leasing (100.0%), and Health Care & Social Assistance (82.1%).
| Industry | Male | Female |
| Agriculture, Fishing & Hunting | 0 (0.0%) | 15 (100.0%) |
| Mining, Quarrying, & Extraction | 0 (0.0%) | 0 (0.0%) |
| Construction | 221 (86.0%) | 36 (14.0%) |
| Manufacturing | 47 (60.3%) | 31 (39.7%) |
| Wholesale Trade | 52 (100.0%) | 0 (0.0%) |
| Retail Trade | 309 (64.1%) | 173 (35.9%) |
| Transportation & Warehousing | 74 (66.7%) | 37 (33.3%) |
| Utilities | 36 (100.0%) | 0 (0.0%) |
| Information | 37 (45.7%) | 44 (54.3%) |
| Finance & Insurance | 59 (45.0%) | 72 (55.0%) |
| Real Estate, Rental & Leasing | 0 (0.0%) | 70 (100.0%) |
| Professional & Scientific | 176 (58.1%) | 127 (41.9%) |
| Enterprise Management | 0 (0.0%) | 0 (0.0%) |
| Administrative & Support | 43 (78.2%) | 12 (21.8%) |
| Educational Services | 71 (37.0%) | 121 (63.0%) |
| Health Care & Social Assistance | 90 (17.9%) | 414 (82.1%) |
| Arts, Entertainment & Recreation | 68 (49.6%) | 69 (50.4%) |
| Accommodation & Food Services | 57 (75.0%) | 19 (25.0%) |
| Public Administration | 243 (79.1%) | 64 (20.8%) |
| Total | 1,648 (54.9%) | 1,353 (45.1%) |
Education in Manchester
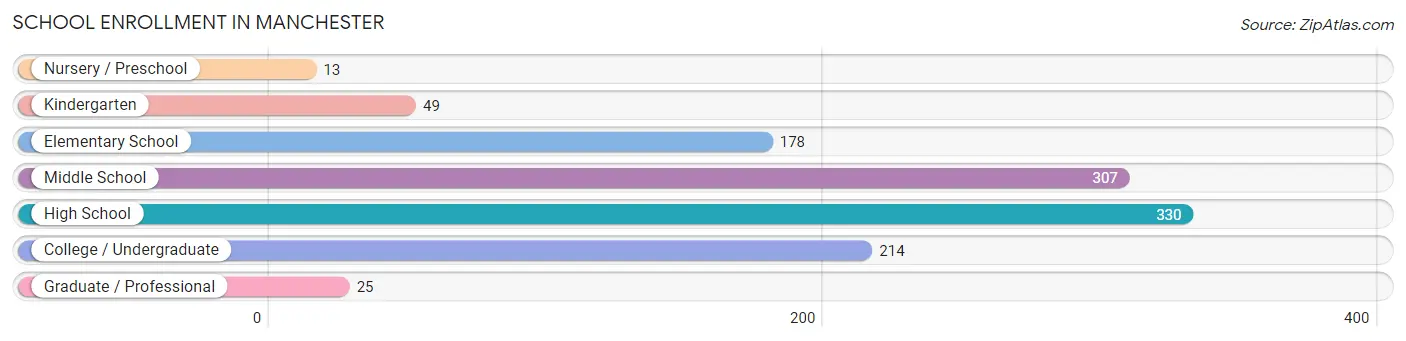
School Enrollment in Manchester
The most common levels of schooling among the 1,116 students in Manchester are high school (330 | 29.6%), middle school (307 | 27.5%), and college / undergraduate (214 | 19.2%).
| School Level | # Students | % Students |
| Nursery / Preschool | 13 | 1.2% |
| Kindergarten | 49 | 4.4% |
| Elementary School | 178 | 16.0% |
| Middle School | 307 | 27.5% |
| High School | 330 | 29.6% |
| College / Undergraduate | 214 | 19.2% |
| Graduate / Professional | 25 | 2.2% |
| Total | 1,116 | 100.0% |
School Enrollment by Age by Funding Source in Manchester
Out of a total of 1,116 students who are enrolled in schools in Manchester, 246 (22.0%) attend a private institution, while the remaining 870 (78.0%) are enrolled in public schools. The age group of 25 to 34 year olds has the highest likelihood of being enrolled in private schools, with 38 (100.0% in the age bracket) enrolled. Conversely, the age group of 5 to 9 year old has the lowest likelihood of being enrolled in a private school, with 202 (96.7% in the age bracket) attending a public institution.
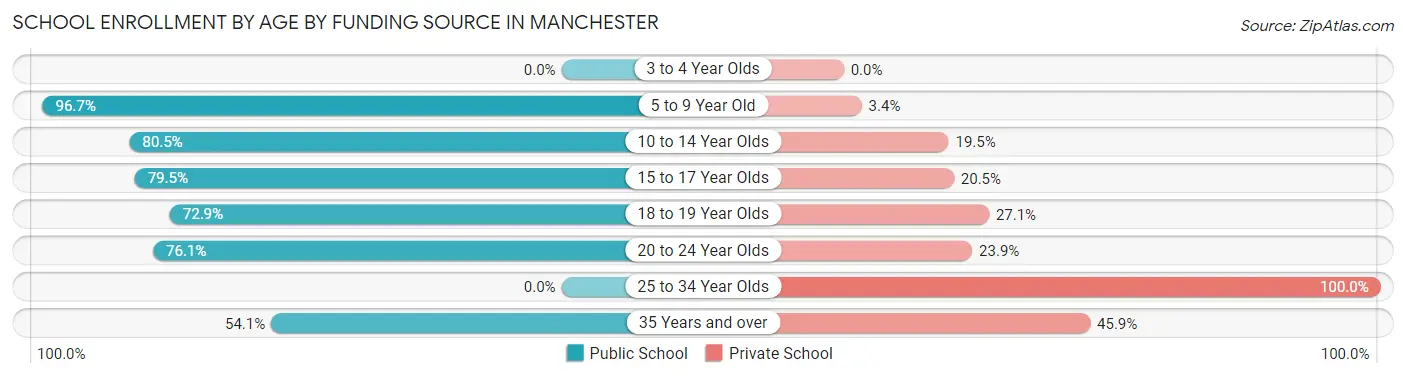
| Age Bracket | Public School | Private School |
| 3 to 4 Year Olds | 0 (0.0%) | 0 (0.0%) |
| 5 to 9 Year Old | 202 (96.7%) | 7 (3.4%) |
| 10 to 14 Year Olds | 272 (80.5%) | 66 (19.5%) |
| 15 to 17 Year Olds | 213 (79.5%) | 55 (20.5%) |
| 18 to 19 Year Olds | 62 (72.9%) | 23 (27.1%) |
| 20 to 24 Year Olds | 89 (76.1%) | 28 (23.9%) |
| 25 to 34 Year Olds | 0 (0.0%) | 38 (100.0%) |
| 35 Years and over | 33 (54.1%) | 28 (45.9%) |
| Total | 870 (78.0%) | 246 (22.0%) |
Educational Attainment by Field of Study in Manchester
Business (327 | 23.5%), education (167 | 12.0%), computers & mathematics (146 | 10.5%), arts & humanities (128 | 9.2%), and social sciences (108 | 7.8%) are the most common fields of study among 1,390 individuals in Manchester who have obtained a bachelor's degree or higher.
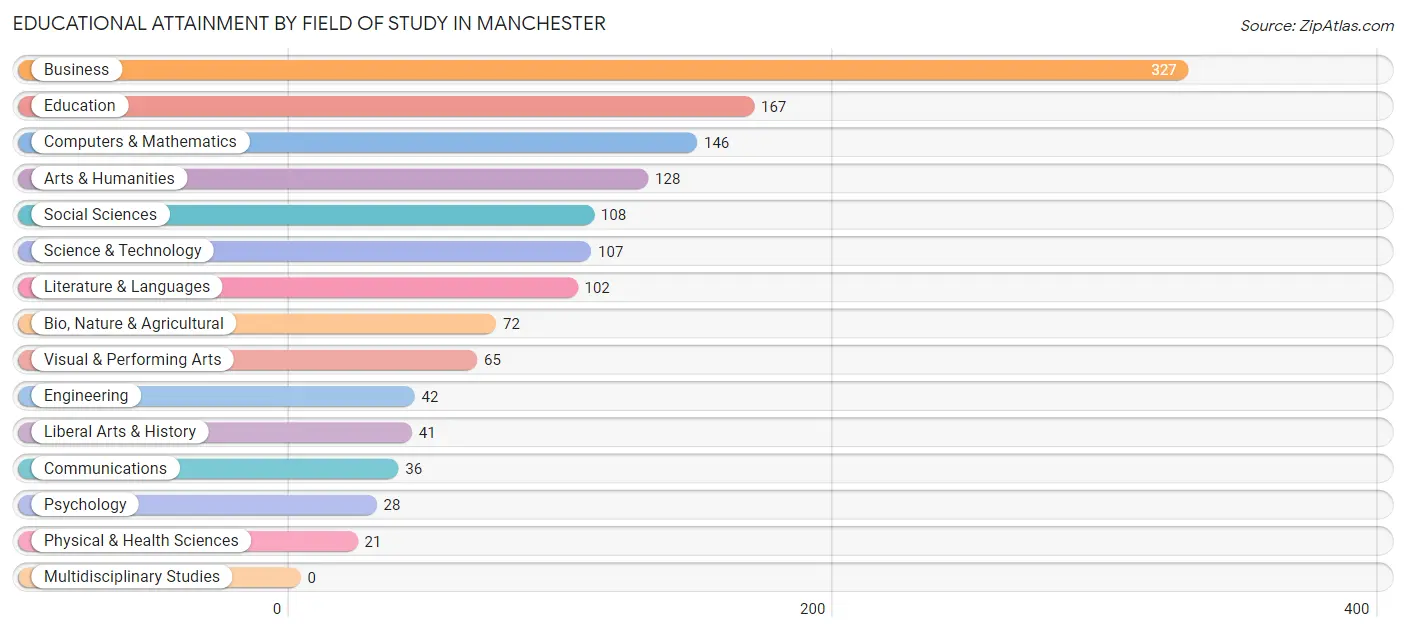
| Field of Study | # Graduates | % Graduates |
| Computers & Mathematics | 146 | 10.5% |
| Bio, Nature & Agricultural | 72 | 5.2% |
| Physical & Health Sciences | 21 | 1.5% |
| Psychology | 28 | 2.0% |
| Social Sciences | 108 | 7.8% |
| Engineering | 42 | 3.0% |
| Multidisciplinary Studies | 0 | 0.0% |
| Science & Technology | 107 | 7.7% |
| Business | 327 | 23.5% |
| Education | 167 | 12.0% |
| Literature & Languages | 102 | 7.3% |
| Liberal Arts & History | 41 | 2.9% |
| Visual & Performing Arts | 65 | 4.7% |
| Communications | 36 | 2.6% |
| Arts & Humanities | 128 | 9.2% |
| Total | 1,390 | 100.0% |
Transportation & Commute in Manchester
Vehicle Availability by Sex in Manchester
The most prevalent vehicle ownership categories in Manchester are males with 2 vehicles (526, accounting for 33.4%) and females with 2 vehicles (488, making up 38.9%).
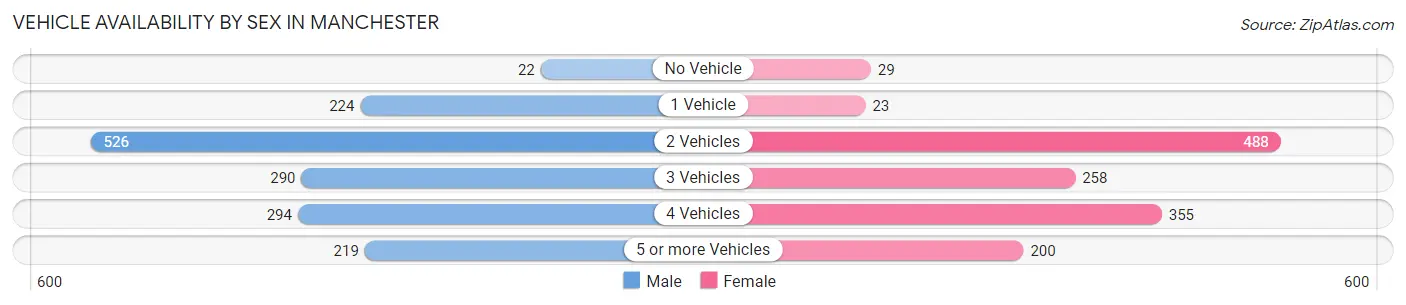
| Vehicles Available | Male | Female |
| No Vehicle | 22 (1.4%) | 29 (2.1%) |
| 1 Vehicle | 224 (14.2%) | 23 (1.7%) |
| 2 Vehicles | 526 (33.4%) | 488 (36.1%) |
| 3 Vehicles | 290 (18.4%) | 258 (19.1%) |
| 4 Vehicles | 294 (18.7%) | 355 (26.2%) |
| 5 or more Vehicles | 219 (13.9%) | 200 (14.8%) |
| Total | 1,575 (100.0%) | 1,353 (100.0%) |
Commute Time in Manchester
The most frequently occuring commute durations in Manchester are 60 to 89 minutes (510 commuters, 19.4%), 45 to 59 minutes (372 commuters, 14.1%), and 15 to 19 minutes (332 commuters, 12.6%).
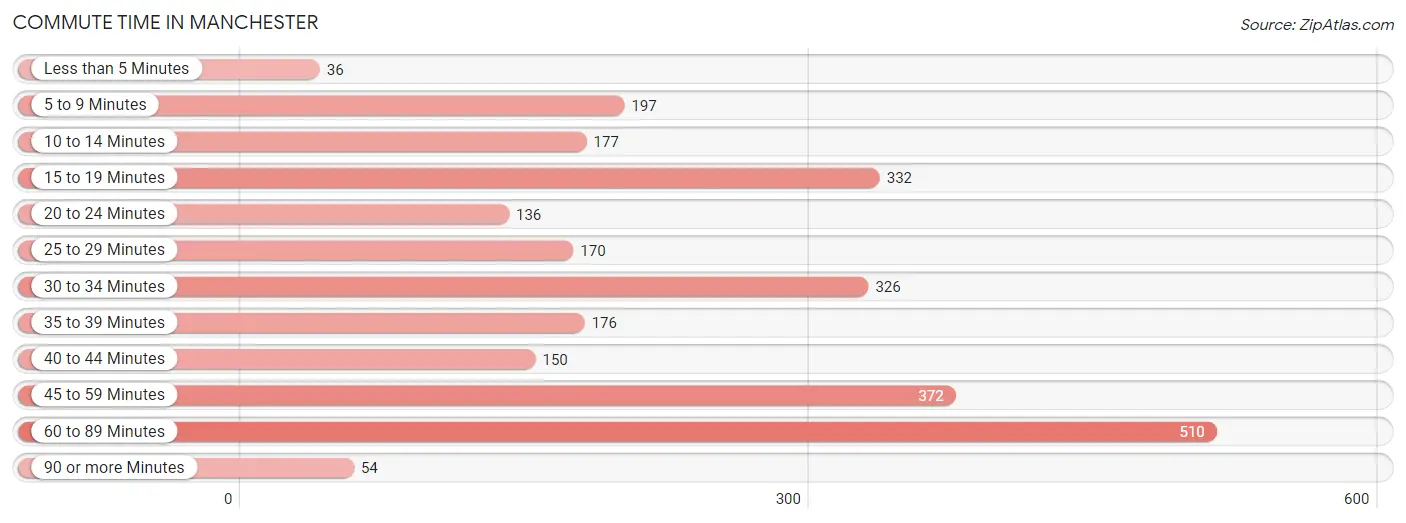
| Commute Time | # Commuters | % Commuters |
| Less than 5 Minutes | 36 | 1.4% |
| 5 to 9 Minutes | 197 | 7.5% |
| 10 to 14 Minutes | 177 | 6.7% |
| 15 to 19 Minutes | 332 | 12.6% |
| 20 to 24 Minutes | 136 | 5.2% |
| 25 to 29 Minutes | 170 | 6.5% |
| 30 to 34 Minutes | 326 | 12.4% |
| 35 to 39 Minutes | 176 | 6.7% |
| 40 to 44 Minutes | 150 | 5.7% |
| 45 to 59 Minutes | 372 | 14.1% |
| 60 to 89 Minutes | 510 | 19.4% |
| 90 or more Minutes | 54 | 2.1% |
Commute Time by Sex in Manchester
The most common commute times in Manchester are 60 to 89 minutes (390 commuters, 27.3%) for males and 15 to 19 minutes (197 commuters, 16.3%) for females.
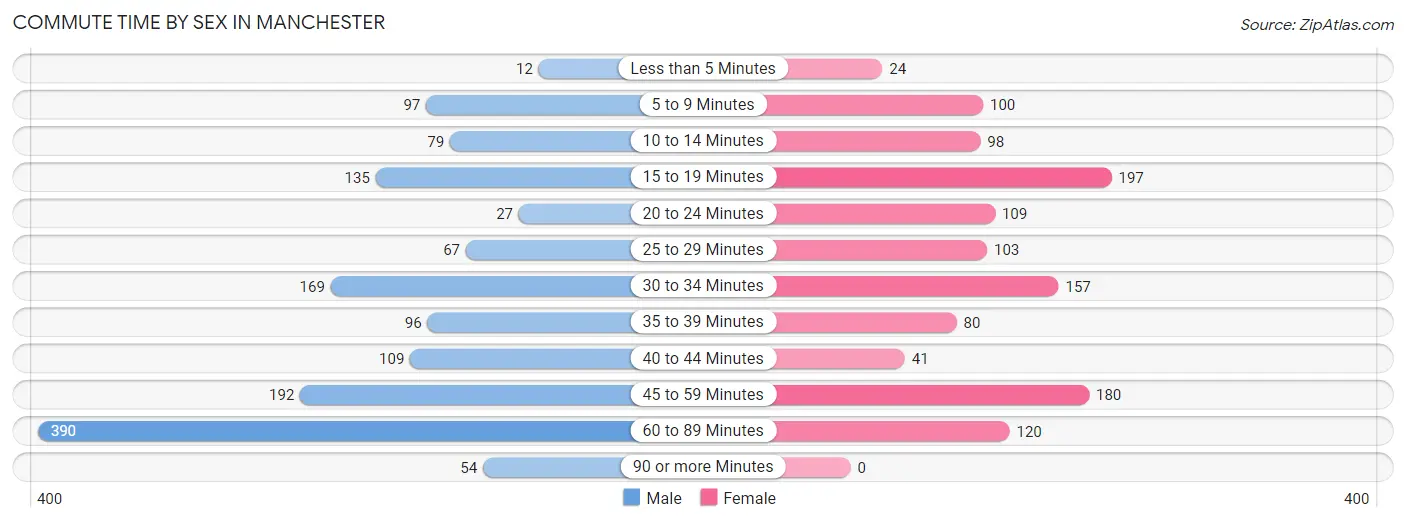
| Commute Time | Male | Female |
| Less than 5 Minutes | 12 (0.8%) | 24 (2.0%) |
| 5 to 9 Minutes | 97 (6.8%) | 100 (8.3%) |
| 10 to 14 Minutes | 79 (5.5%) | 98 (8.1%) |
| 15 to 19 Minutes | 135 (9.5%) | 197 (16.3%) |
| 20 to 24 Minutes | 27 (1.9%) | 109 (9.0%) |
| 25 to 29 Minutes | 67 (4.7%) | 103 (8.5%) |
| 30 to 34 Minutes | 169 (11.8%) | 157 (13.0%) |
| 35 to 39 Minutes | 96 (6.7%) | 80 (6.6%) |
| 40 to 44 Minutes | 109 (7.6%) | 41 (3.4%) |
| 45 to 59 Minutes | 192 (13.5%) | 180 (14.9%) |
| 60 to 89 Minutes | 390 (27.3%) | 120 (9.9%) |
| 90 or more Minutes | 54 (3.8%) | 0 (0.0%) |
Time of Departure to Work by Sex in Manchester
The most frequent times of departure to work in Manchester are 7:00 AM to 7:29 AM (228, 16.0%) for males and 7:30 AM to 7:59 AM (254, 21.0%) for females.
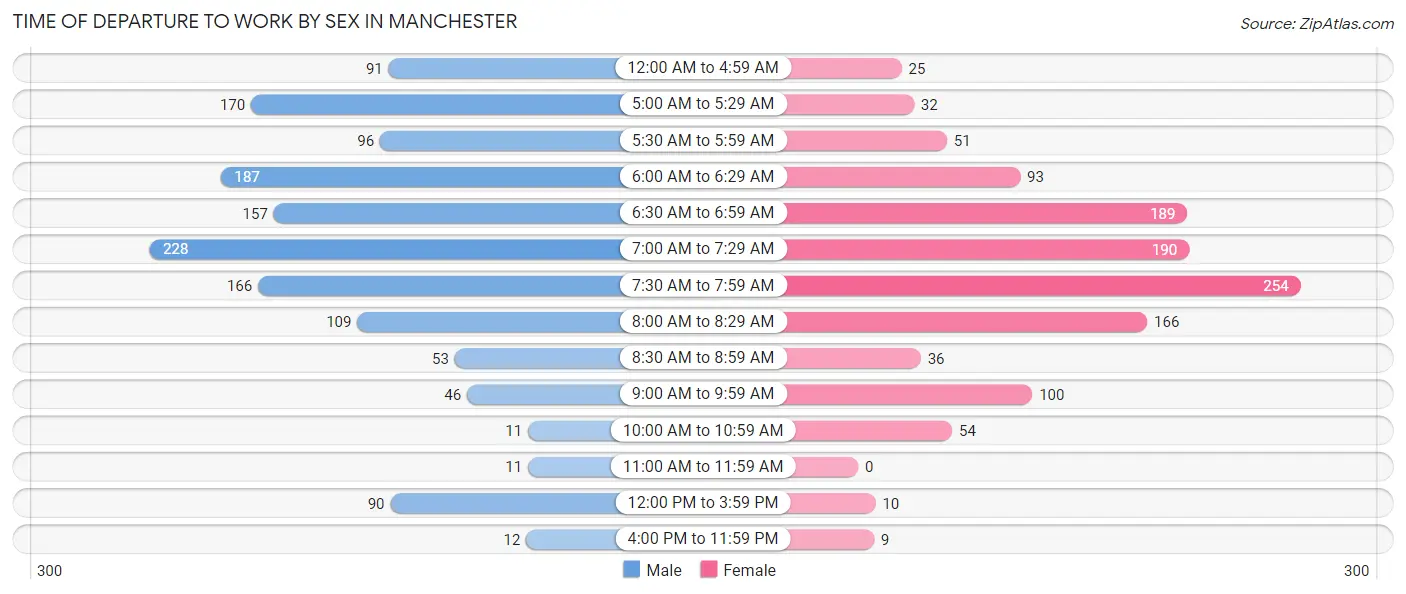
| Time of Departure | Male | Female |
| 12:00 AM to 4:59 AM | 91 (6.4%) | 25 (2.1%) |
| 5:00 AM to 5:29 AM | 170 (11.9%) | 32 (2.6%) |
| 5:30 AM to 5:59 AM | 96 (6.7%) | 51 (4.2%) |
| 6:00 AM to 6:29 AM | 187 (13.1%) | 93 (7.7%) |
| 6:30 AM to 6:59 AM | 157 (11.0%) | 189 (15.6%) |
| 7:00 AM to 7:29 AM | 228 (16.0%) | 190 (15.7%) |
| 7:30 AM to 7:59 AM | 166 (11.6%) | 254 (21.0%) |
| 8:00 AM to 8:29 AM | 109 (7.6%) | 166 (13.7%) |
| 8:30 AM to 8:59 AM | 53 (3.7%) | 36 (3.0%) |
| 9:00 AM to 9:59 AM | 46 (3.2%) | 100 (8.3%) |
| 10:00 AM to 10:59 AM | 11 (0.8%) | 54 (4.5%) |
| 11:00 AM to 11:59 AM | 11 (0.8%) | 0 (0.0%) |
| 12:00 PM to 3:59 PM | 90 (6.3%) | 10 (0.8%) |
| 4:00 PM to 11:59 PM | 12 (0.8%) | 9 (0.7%) |
| Total | 1,427 (100.0%) | 1,209 (100.0%) |
Housing Occupancy in Manchester
Occupancy by Ownership in Manchester
Of the total 2,076 dwellings in Manchester, owner-occupied units account for 1,714 (82.6%), while renter-occupied units make up 362 (17.4%).
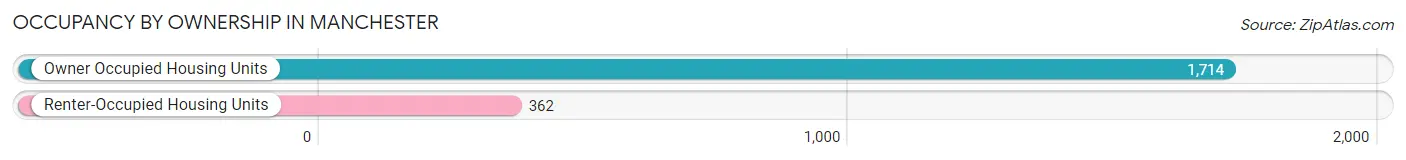
| Occupancy | # Housing Units | % Housing Units |
| Owner Occupied Housing Units | 1,714 | 82.6% |
| Renter-Occupied Housing Units | 362 | 17.4% |
| Total Occupied Housing Units | 2,076 | 100.0% |
Occupancy by Household Size in Manchester
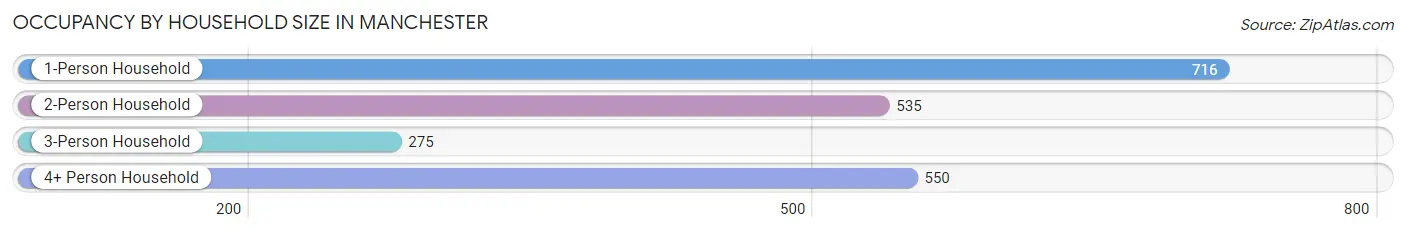
| Household Size | # Housing Units | % Housing Units |
| 1-Person Household | 716 | 34.5% |
| 2-Person Household | 535 | 25.8% |
| 3-Person Household | 275 | 13.3% |
| 4+ Person Household | 550 | 26.5% |
| Total Housing Units | 2,076 | 100.0% |
Occupancy by Ownership by Household Size in Manchester
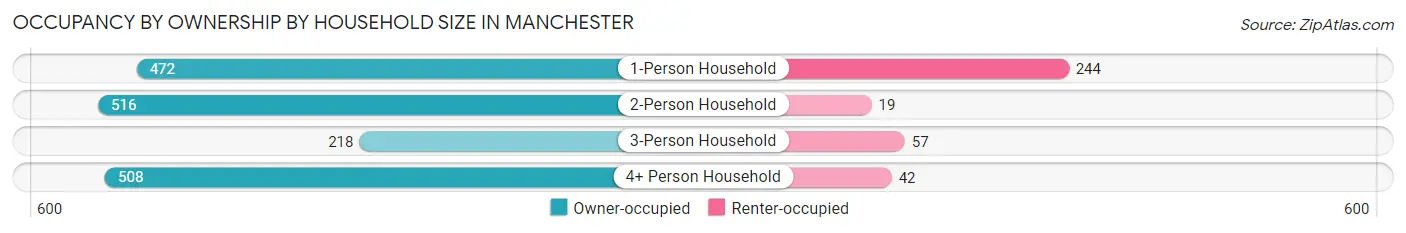
| Household Size | Owner-occupied | Renter-occupied |
| 1-Person Household | 472 (65.9%) | 244 (34.1%) |
| 2-Person Household | 516 (96.5%) | 19 (3.5%) |
| 3-Person Household | 218 (79.3%) | 57 (20.7%) |
| 4+ Person Household | 508 (92.4%) | 42 (7.6%) |
| Total Housing Units | 1,714 (82.6%) | 362 (17.4%) |
Occupancy by Educational Attainment in Manchester
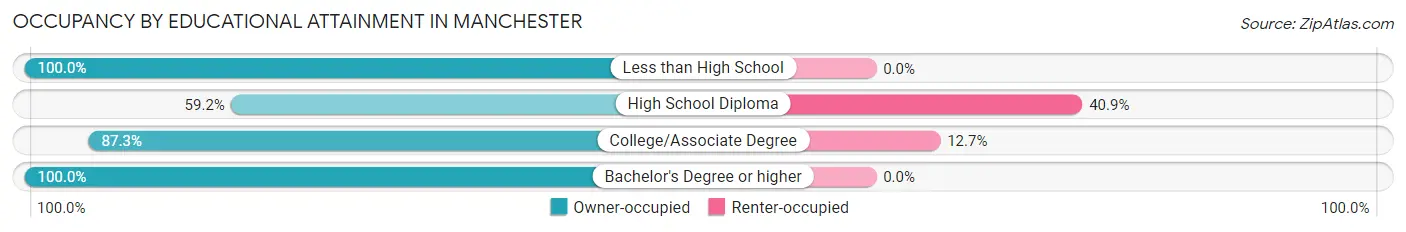
| Household Size | Owner-occupied | Renter-occupied |
| Less than High School | 48 (100.0%) | 0 (0.0%) |
| High School Diploma | 388 (59.2%) | 268 (40.8%) |
| College/Associate Degree | 646 (87.3%) | 94 (12.7%) |
| Bachelor's Degree or higher | 632 (100.0%) | 0 (0.0%) |
Occupancy by Age of Householder in Manchester
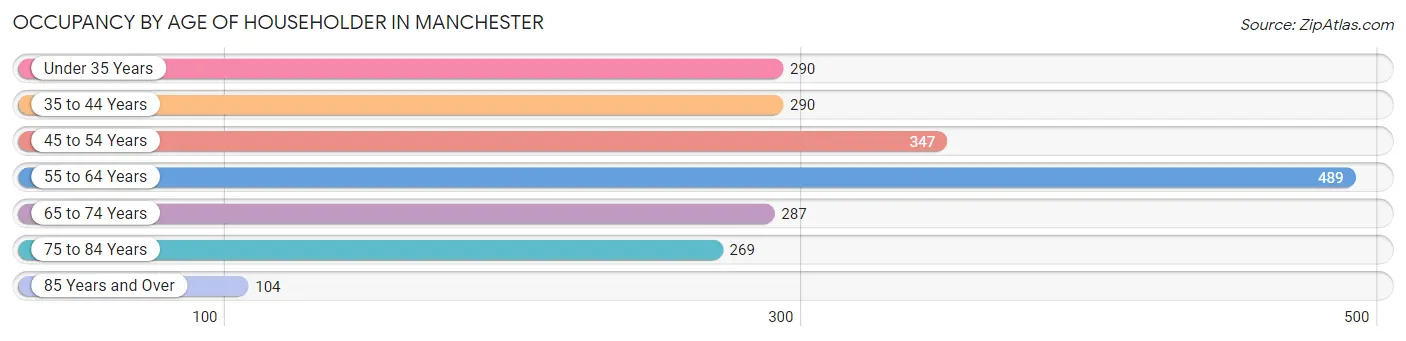
| Age Bracket | # Households | % Households |
| Under 35 Years | 290 | 14.0% |
| 35 to 44 Years | 290 | 14.0% |
| 45 to 54 Years | 347 | 16.7% |
| 55 to 64 Years | 489 | 23.5% |
| 65 to 74 Years | 287 | 13.8% |
| 75 to 84 Years | 269 | 13.0% |
| 85 Years and Over | 104 | 5.0% |
| Total | 2,076 | 100.0% |
Housing Finances in Manchester
Median Income by Occupancy in Manchester
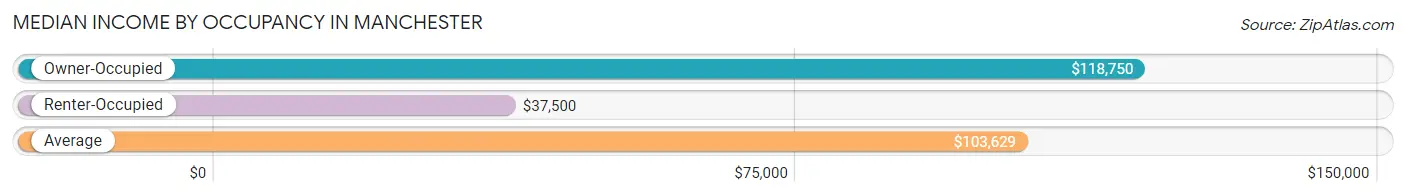
| Occupancy Type | # Households | Median Income |
| Owner-Occupied | 1,714 (82.6%) | $118,750 |
| Renter-Occupied | 362 (17.4%) | $37,500 |
| Average | 2,076 (100.0%) | $103,629 |
Occupancy by Householder Income Bracket in Manchester
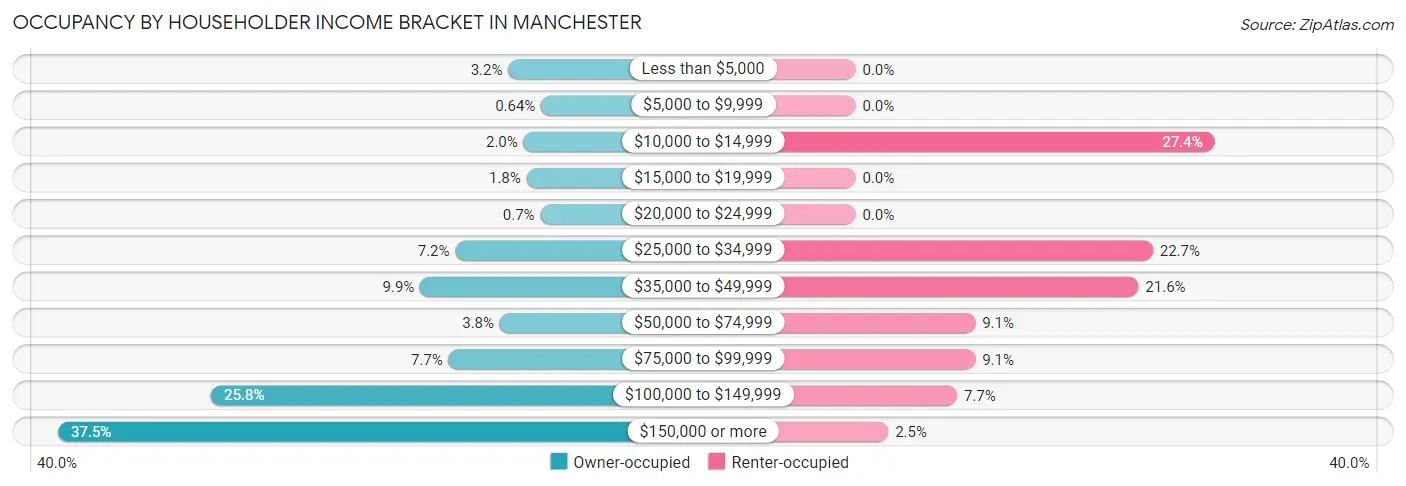
| Income Bracket | Owner-occupied | Renter-occupied |
| Less than $5,000 | 54 (3.2%) | 0 (0.0%) |
| $5,000 to $9,999 | 11 (0.6%) | 0 (0.0%) |
| $10,000 to $14,999 | 34 (2.0%) | 99 (27.4%) |
| $15,000 to $19,999 | 30 (1.8%) | 0 (0.0%) |
| $20,000 to $24,999 | 12 (0.7%) | 0 (0.0%) |
| $25,000 to $34,999 | 123 (7.2%) | 82 (22.7%) |
| $35,000 to $49,999 | 169 (9.9%) | 78 (21.5%) |
| $50,000 to $74,999 | 65 (3.8%) | 33 (9.1%) |
| $75,000 to $99,999 | 132 (7.7%) | 33 (9.1%) |
| $100,000 to $149,999 | 442 (25.8%) | 28 (7.7%) |
| $150,000 or more | 642 (37.5%) | 9 (2.5%) |
| Total | 1,714 (100.0%) | 362 (100.0%) |
Monthly Housing Cost Tiers in Manchester
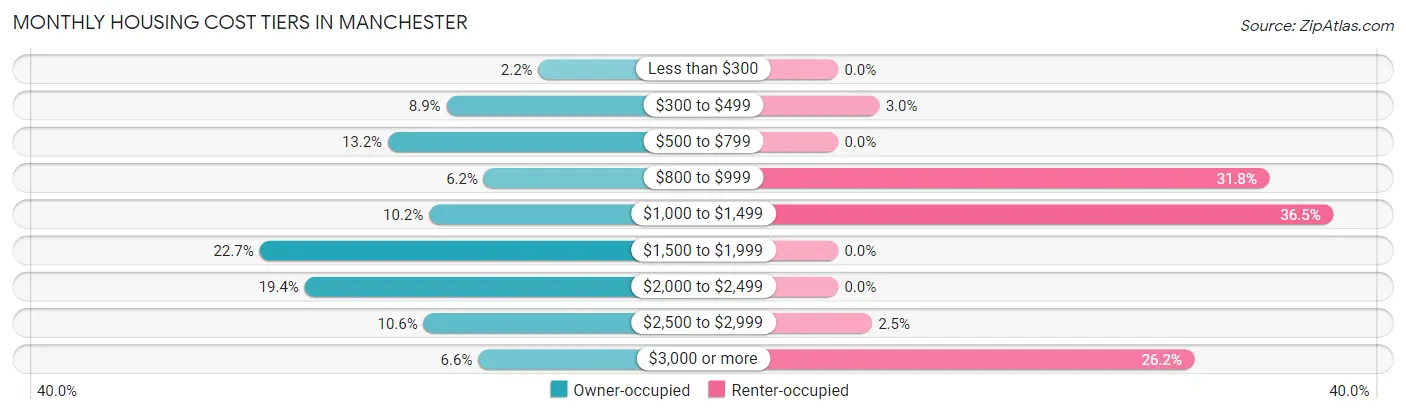
| Monthly Cost | Owner-occupied | Renter-occupied |
| Less than $300 | 37 (2.2%) | 0 (0.0%) |
| $300 to $499 | 153 (8.9%) | 11 (3.0%) |
| $500 to $799 | 227 (13.2%) | 0 (0.0%) |
| $800 to $999 | 106 (6.2%) | 115 (31.8%) |
| $1,000 to $1,499 | 175 (10.2%) | 132 (36.5%) |
| $1,500 to $1,999 | 389 (22.7%) | 0 (0.0%) |
| $2,000 to $2,499 | 332 (19.4%) | 0 (0.0%) |
| $2,500 to $2,999 | 182 (10.6%) | 9 (2.5%) |
| $3,000 or more | 113 (6.6%) | 95 (26.2%) |
| Total | 1,714 (100.0%) | 362 (100.0%) |
Physical Housing Characteristics in Manchester
Housing Structures in Manchester
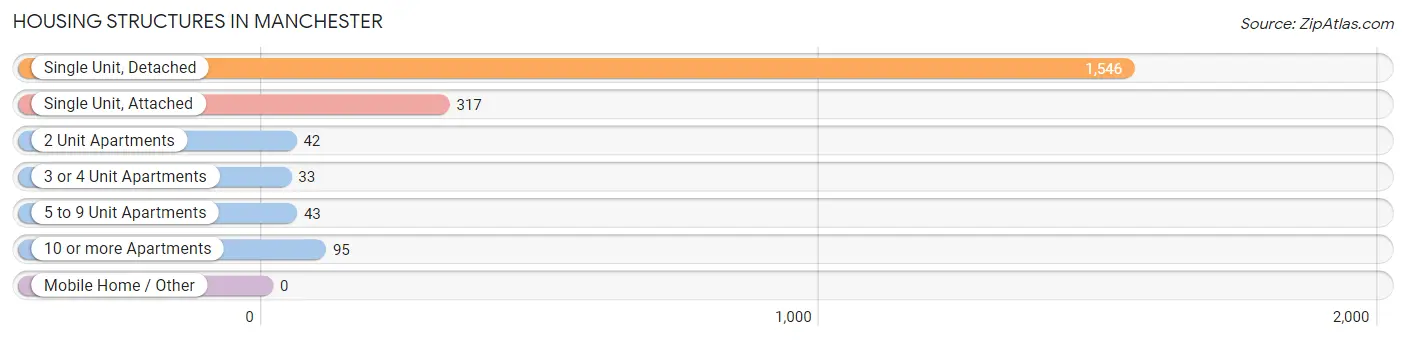
| Structure Type | # Housing Units | % Housing Units |
| Single Unit, Detached | 1,546 | 74.5% |
| Single Unit, Attached | 317 | 15.3% |
| 2 Unit Apartments | 42 | 2.0% |
| 3 or 4 Unit Apartments | 33 | 1.6% |
| 5 to 9 Unit Apartments | 43 | 2.1% |
| 10 or more Apartments | 95 | 4.6% |
| Mobile Home / Other | 0 | 0.0% |
| Total | 2,076 | 100.0% |
Housing Structures by Occupancy in Manchester
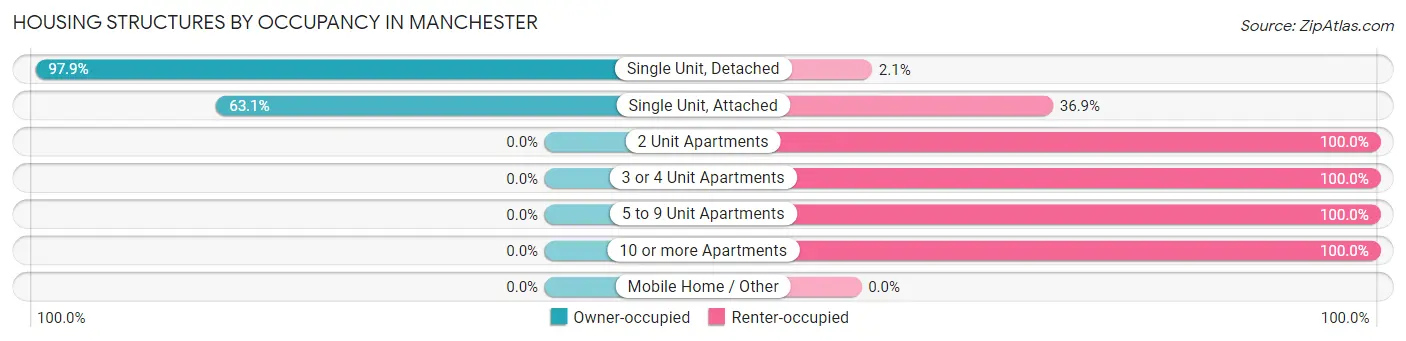
| Structure Type | Owner-occupied | Renter-occupied |
| Single Unit, Detached | 1,514 (97.9%) | 32 (2.1%) |
| Single Unit, Attached | 200 (63.1%) | 117 (36.9%) |
| 2 Unit Apartments | 0 (0.0%) | 42 (100.0%) |
| 3 or 4 Unit Apartments | 0 (0.0%) | 33 (100.0%) |
| 5 to 9 Unit Apartments | 0 (0.0%) | 43 (100.0%) |
| 10 or more Apartments | 0 (0.0%) | 95 (100.0%) |
| Mobile Home / Other | 0 (0.0%) | 0 (0.0%) |
| Total | 1,714 (82.6%) | 362 (17.4%) |
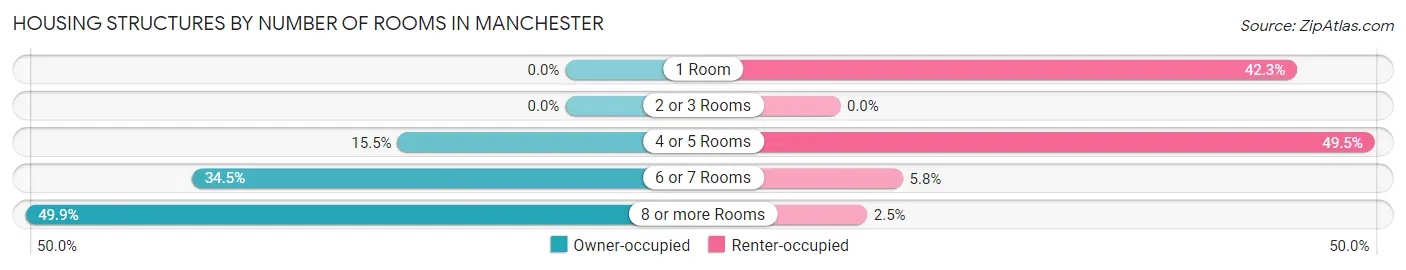
Housing Structures by Number of Rooms in Manchester
| Number of Rooms | Owner-occupied | Renter-occupied |
| 1 Room | 0 (0.0%) | 153 (42.3%) |
| 2 or 3 Rooms | 0 (0.0%) | 0 (0.0%) |
| 4 or 5 Rooms | 266 (15.5%) | 179 (49.4%) |
| 6 or 7 Rooms | 592 (34.5%) | 21 (5.8%) |
| 8 or more Rooms | 856 (49.9%) | 9 (2.5%) |
| Total | 1,714 (100.0%) | 362 (100.0%) |
Housing Structure by Heating Type in Manchester
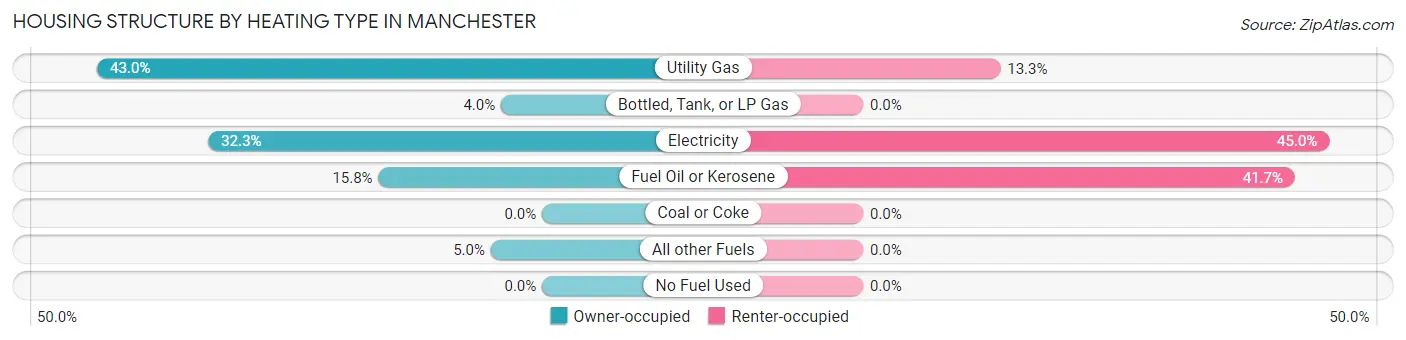
| Heating Type | Owner-occupied | Renter-occupied |
| Utility Gas | 737 (43.0%) | 48 (13.3%) |
| Bottled, Tank, or LP Gas | 68 (4.0%) | 0 (0.0%) |
| Electricity | 553 (32.3%) | 163 (45.0%) |
| Fuel Oil or Kerosene | 271 (15.8%) | 151 (41.7%) |
| Coal or Coke | 0 (0.0%) | 0 (0.0%) |
| All other Fuels | 85 (5.0%) | 0 (0.0%) |
| No Fuel Used | 0 (0.0%) | 0 (0.0%) |
| Total | 1,714 (100.0%) | 362 (100.0%) |
Household Vehicle Usage in Manchester
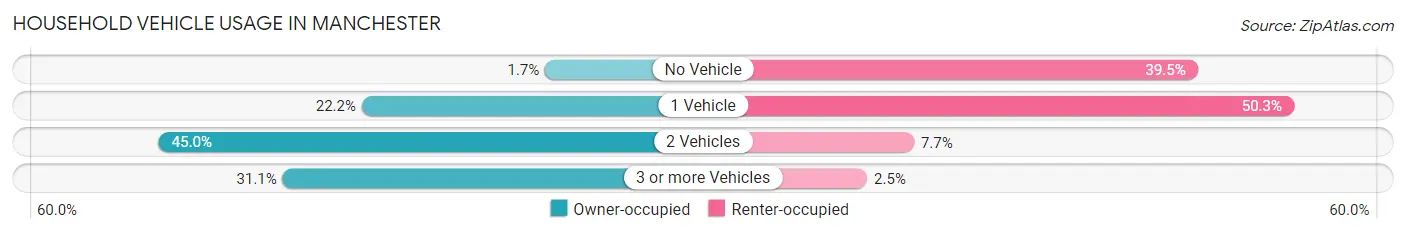
| Vehicles per Household | Owner-occupied | Renter-occupied |
| No Vehicle | 29 (1.7%) | 143 (39.5%) |
| 1 Vehicle | 381 (22.2%) | 182 (50.3%) |
| 2 Vehicles | 771 (45.0%) | 28 (7.7%) |
| 3 or more Vehicles | 533 (31.1%) | 9 (2.5%) |
| Total | 1,714 (100.0%) | 362 (100.0%) |
Real Estate & Mortgages in Manchester
Real Estate and Mortgage Overview in Manchester
| Characteristic | Without Mortgage | With Mortgage |
| Housing Units | 593 | 1,121 |
| Median Property Value | $331,400 | $351,500 |
| Median Household Income | $45,591 | $510 |
| Monthly Housing Costs | $577 | $113 |
| Real Estate Taxes | $3,197 | $42 |
Property Value by Mortgage Status in Manchester
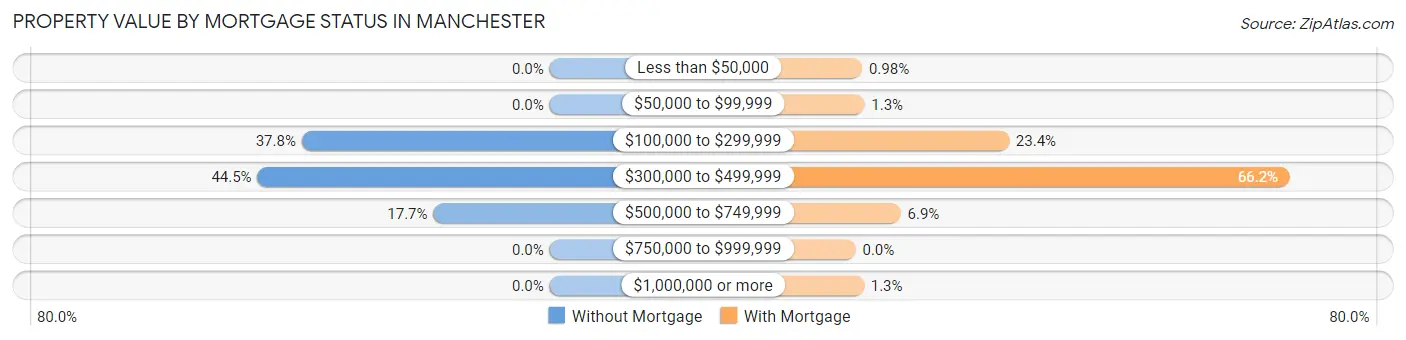
| Property Value | Without Mortgage | With Mortgage |
| Less than $50,000 | 0 (0.0%) | 11 (1.0%) |
| $50,000 to $99,999 | 0 (0.0%) | 15 (1.3%) |
| $100,000 to $299,999 | 224 (37.8%) | 262 (23.4%) |
| $300,000 to $499,999 | 264 (44.5%) | 742 (66.2%) |
| $500,000 to $749,999 | 105 (17.7%) | 77 (6.9%) |
| $750,000 to $999,999 | 0 (0.0%) | 0 (0.0%) |
| $1,000,000 or more | 0 (0.0%) | 14 (1.3%) |
| Total | 593 (100.0%) | 1,121 (100.0%) |
Household Income by Mortgage Status in Manchester
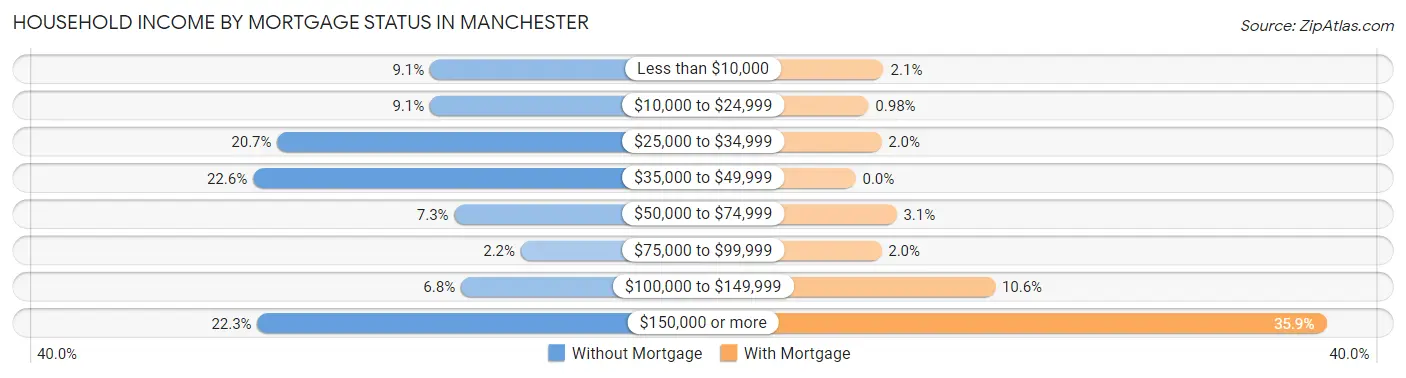
| Household Income | Without Mortgage | With Mortgage |
| Less than $10,000 | 54 (9.1%) | 24 (2.1%) |
| $10,000 to $24,999 | 54 (9.1%) | 11 (1.0%) |
| $25,000 to $34,999 | 123 (20.7%) | 22 (2.0%) |
| $35,000 to $49,999 | 134 (22.6%) | 0 (0.0%) |
| $50,000 to $74,999 | 43 (7.2%) | 35 (3.1%) |
| $75,000 to $99,999 | 13 (2.2%) | 22 (2.0%) |
| $100,000 to $149,999 | 40 (6.8%) | 119 (10.6%) |
| $150,000 or more | 132 (22.3%) | 402 (35.9%) |
| Total | 593 (100.0%) | 1,121 (100.0%) |
Property Value to Household Income Ratio in Manchester
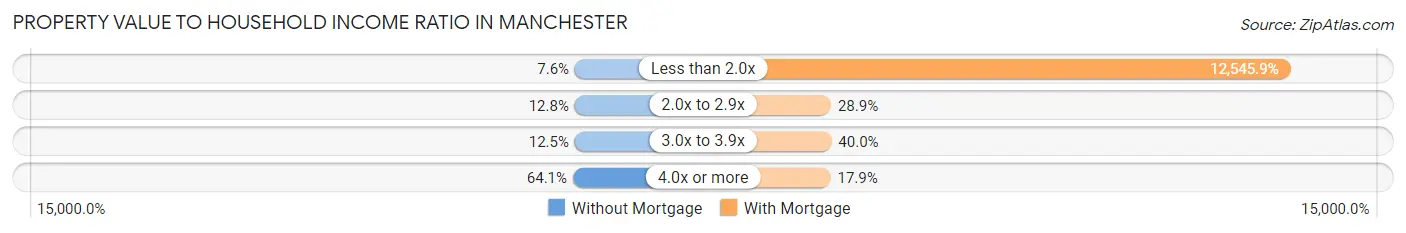
| Value-to-Income Ratio | Without Mortgage | With Mortgage |
| Less than 2.0x | 45 (7.6%) | 140,640 (12,545.9%) |
| 2.0x to 2.9x | 76 (12.8%) | 324 (28.9%) |
| 3.0x to 3.9x | 74 (12.5%) | 448 (40.0%) |
| 4.0x or more | 380 (64.1%) | 201 (17.9%) |
| Total | 593 (100.0%) | 1,121 (100.0%) |
Real Estate Taxes by Mortgage Status in Manchester
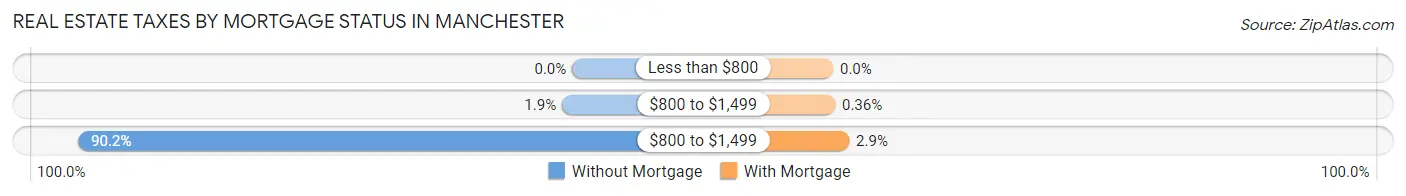
| Property Taxes | Without Mortgage | With Mortgage |
| Less than $800 | 0 (0.0%) | 0 (0.0%) |
| $800 to $1,499 | 11 (1.8%) | 4 (0.4%) |
| $800 to $1,499 | 535 (90.2%) | 33 (2.9%) |
| Total | 593 (100.0%) | 1,121 (100.0%) |
Health & Disability in Manchester
Health Insurance Coverage by Age in Manchester
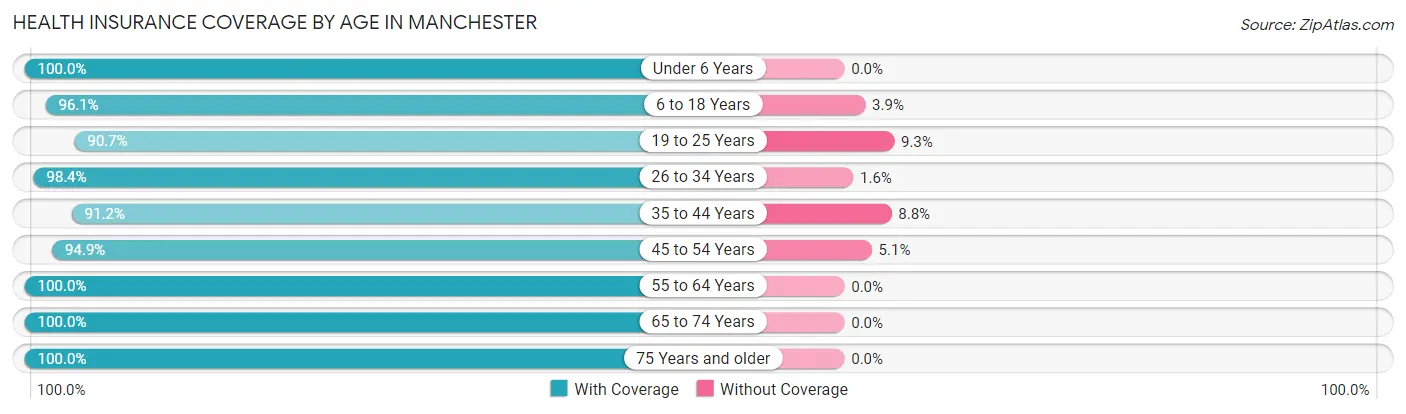
| Age Bracket | With Coverage | Without Coverage |
| Under 6 Years | 359 (100.0%) | 0 (0.0%) |
| 6 to 18 Years | 790 (96.1%) | 32 (3.9%) |
| 19 to 25 Years | 372 (90.7%) | 38 (9.3%) |
| 26 to 34 Years | 659 (98.4%) | 11 (1.6%) |
| 35 to 44 Years | 510 (91.2%) | 49 (8.8%) |
| 45 to 54 Years | 577 (94.9%) | 31 (5.1%) |
| 55 to 64 Years | 914 (100.0%) | 0 (0.0%) |
| 65 to 74 Years | 480 (100.0%) | 0 (0.0%) |
| 75 Years and older | 479 (100.0%) | 0 (0.0%) |
| Total | 5,140 (97.0%) | 161 (3.0%) |
Health Insurance Coverage by Citizenship Status in Manchester
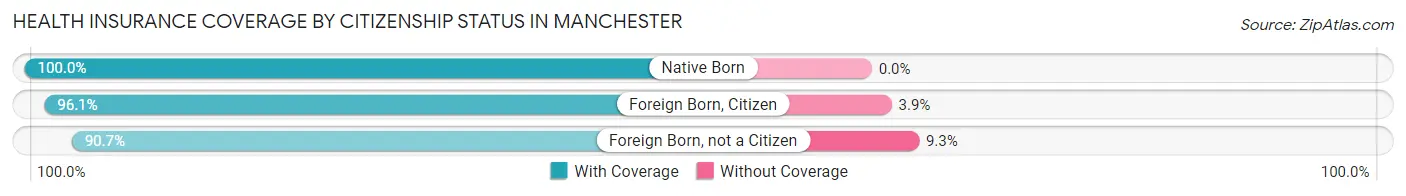
| Citizenship Status | With Coverage | Without Coverage |
| Native Born | 359 (100.0%) | 0 (0.0%) |
| Foreign Born, Citizen | 790 (96.1%) | 32 (3.9%) |
| Foreign Born, not a Citizen | 372 (90.7%) | 38 (9.3%) |
Health Insurance Coverage by Household Income in Manchester
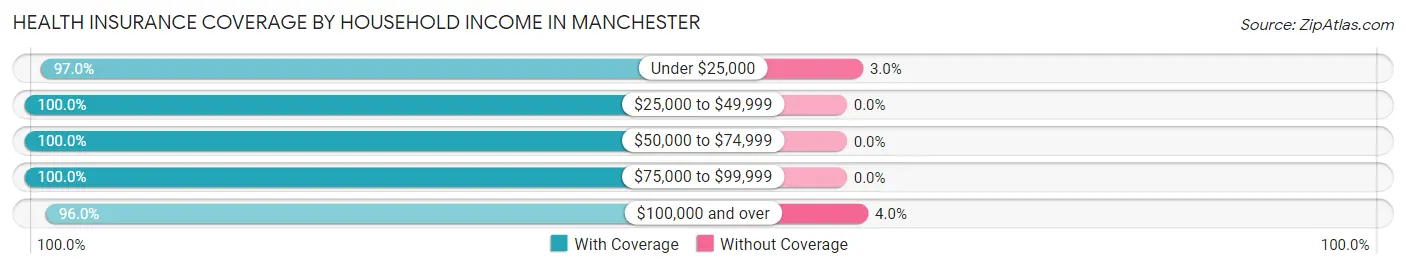
| Household Income | With Coverage | Without Coverage |
| Under $25,000 | 352 (97.0%) | 11 (3.0%) |
| $25,000 to $49,999 | 583 (100.0%) | 0 (0.0%) |
| $50,000 to $74,999 | 257 (100.0%) | 0 (0.0%) |
| $75,000 to $99,999 | 352 (100.0%) | 0 (0.0%) |
| $100,000 and over | 3,596 (96.0%) | 150 (4.0%) |
Public vs Private Health Insurance Coverage by Age in Manchester
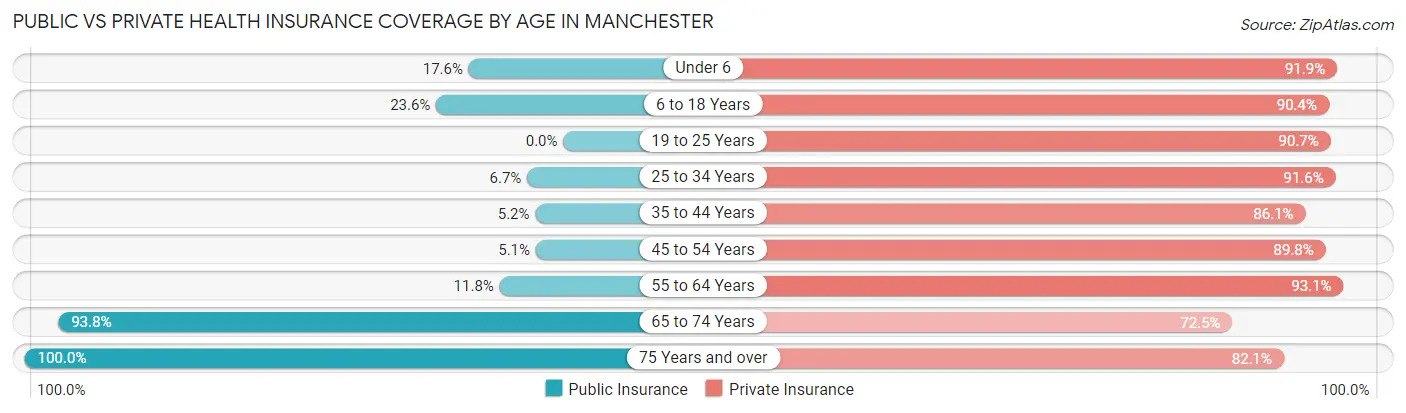
| Age Bracket | Public Insurance | Private Insurance |
| Under 6 | 63 (17.5%) | 330 (91.9%) |
| 6 to 18 Years | 194 (23.6%) | 743 (90.4%) |
| 19 to 25 Years | 0 (0.0%) | 372 (90.7%) |
| 25 to 34 Years | 45 (6.7%) | 614 (91.6%) |
| 35 to 44 Years | 29 (5.2%) | 481 (86.1%) |
| 45 to 54 Years | 31 (5.1%) | 546 (89.8%) |
| 55 to 64 Years | 108 (11.8%) | 851 (93.1%) |
| 65 to 74 Years | 450 (93.8%) | 348 (72.5%) |
| 75 Years and over | 479 (100.0%) | 393 (82.1%) |
| Total | 1,399 (26.4%) | 4,678 (88.2%) |
Disability Status by Sex by Age in Manchester
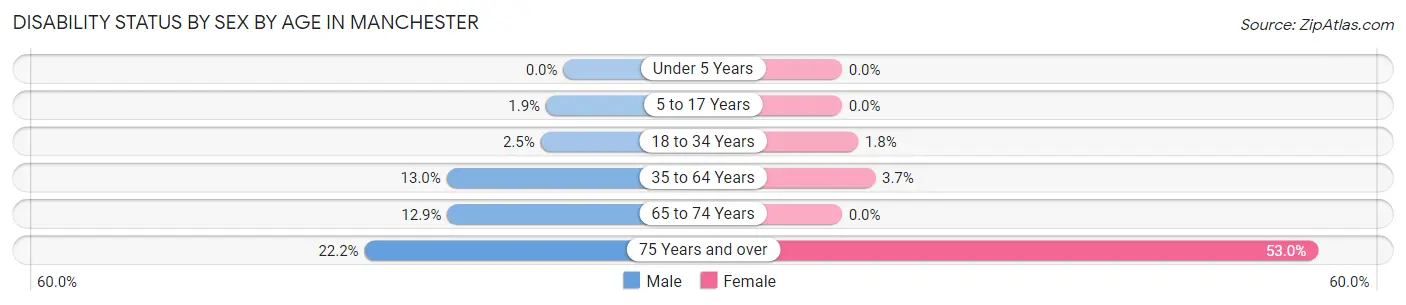
| Age Bracket | Male | Female |
| Under 5 Years | 0 (0.0%) | 0 (0.0%) |
| 5 to 17 Years | 7 (1.9%) | 0 (0.0%) |
| 18 to 34 Years | 16 (2.5%) | 9 (1.8%) |
| 35 to 64 Years | 130 (13.0%) | 40 (3.7%) |
| 65 to 74 Years | 31 (12.9%) | 0 (0.0%) |
| 75 Years and over | 33 (22.2%) | 175 (53.0%) |
Disability Class by Sex by Age in Manchester
Disability Class: Hearing Difficulty
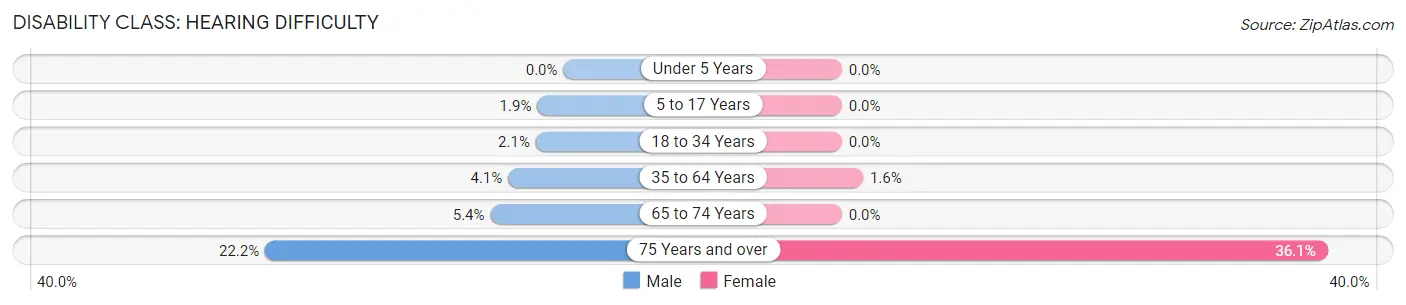
| Age Bracket | Male | Female |
| Under 5 Years | 0 (0.0%) | 0 (0.0%) |
| 5 to 17 Years | 7 (1.9%) | 0 (0.0%) |
| 18 to 34 Years | 13 (2.1%) | 0 (0.0%) |
| 35 to 64 Years | 41 (4.1%) | 17 (1.6%) |
| 65 to 74 Years | 13 (5.4%) | 0 (0.0%) |
| 75 Years and over | 33 (22.2%) | 119 (36.1%) |
Disability Class: Vision Difficulty
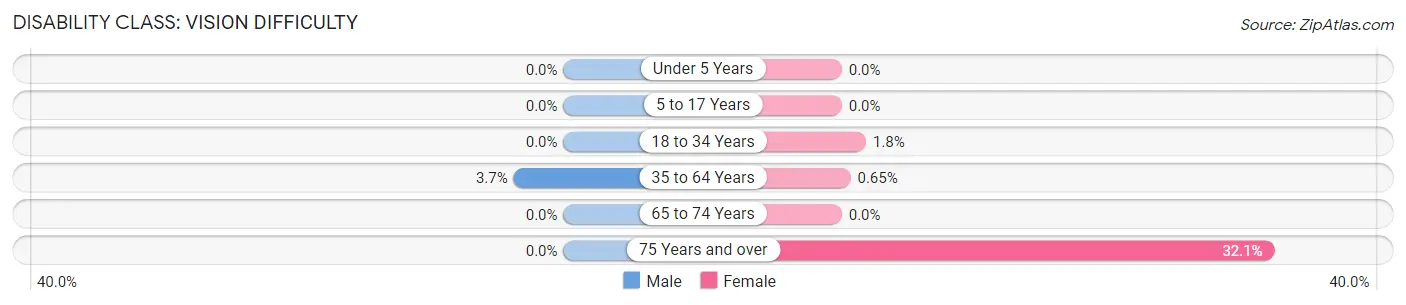
| Age Bracket | Male | Female |
| Under 5 Years | 0 (0.0%) | 0 (0.0%) |
| 5 to 17 Years | 0 (0.0%) | 0 (0.0%) |
| 18 to 34 Years | 0 (0.0%) | 9 (1.8%) |
| 35 to 64 Years | 37 (3.7%) | 7 (0.6%) |
| 65 to 74 Years | 0 (0.0%) | 0 (0.0%) |
| 75 Years and over | 0 (0.0%) | 106 (32.1%) |
Disability Class: Cognitive Difficulty
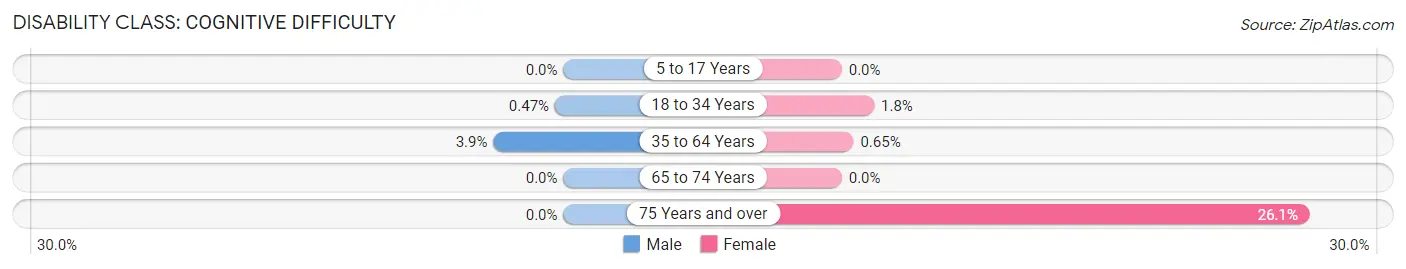
| Age Bracket | Male | Female |
| 5 to 17 Years | 0 (0.0%) | 0 (0.0%) |
| 18 to 34 Years | 3 (0.5%) | 9 (1.8%) |
| 35 to 64 Years | 39 (3.9%) | 7 (0.6%) |
| 65 to 74 Years | 0 (0.0%) | 0 (0.0%) |
| 75 Years and over | 0 (0.0%) | 86 (26.1%) |
Disability Class: Ambulatory Difficulty
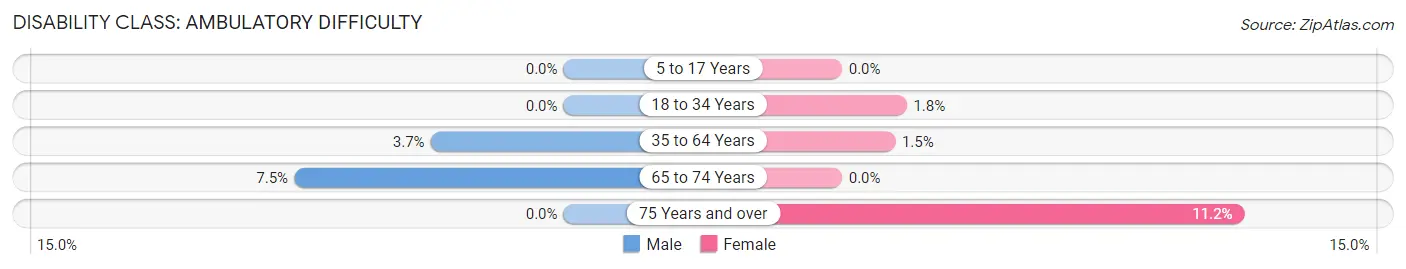
| Age Bracket | Male | Female |
| 5 to 17 Years | 0 (0.0%) | 0 (0.0%) |
| 18 to 34 Years | 0 (0.0%) | 9 (1.8%) |
| 35 to 64 Years | 37 (3.7%) | 16 (1.5%) |
| 65 to 74 Years | 18 (7.5%) | 0 (0.0%) |
| 75 Years and over | 0 (0.0%) | 37 (11.2%) |
Disability Class: Self-Care Difficulty
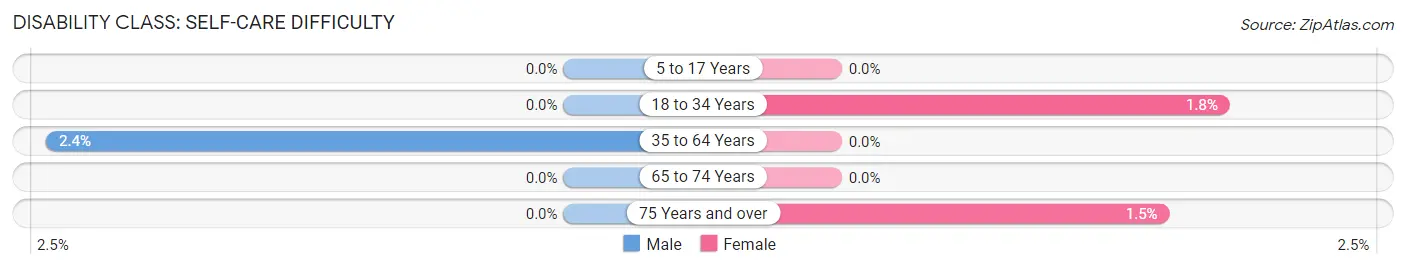
| Age Bracket | Male | Female |
| 5 to 17 Years | 0 (0.0%) | 0 (0.0%) |
| 18 to 34 Years | 0 (0.0%) | 9 (1.8%) |
| 35 to 64 Years | 24 (2.4%) | 0 (0.0%) |
| 65 to 74 Years | 0 (0.0%) | 0 (0.0%) |
| 75 Years and over | 0 (0.0%) | 5 (1.5%) |
Technology Access in Manchester
Computing Device Access in Manchester
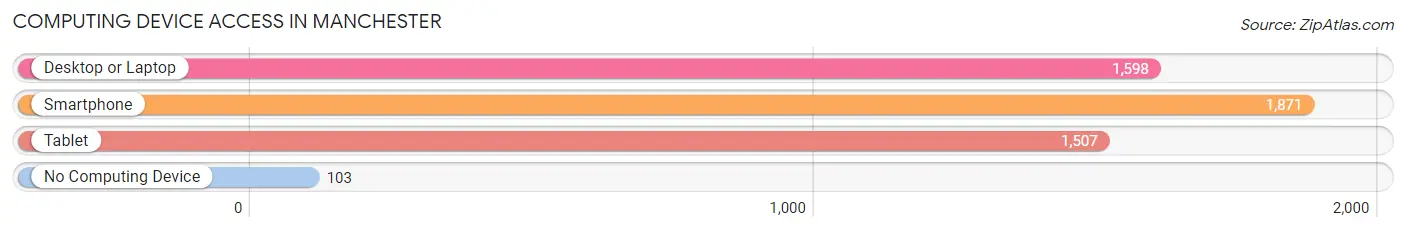
| Device Type | # Households | % Households |
| Desktop or Laptop | 1,598 | 77.0% |
| Smartphone | 1,871 | 90.1% |
| Tablet | 1,507 | 72.6% |
| No Computing Device | 103 | 5.0% |
| Total | 2,076 | 100.0% |
Internet Access in Manchester
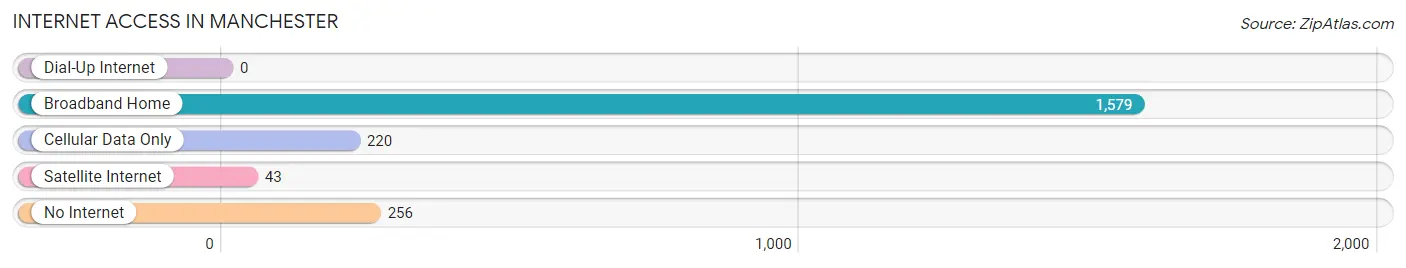
| Internet Type | # Households | % Households |
| Dial-Up Internet | 0 | 0.0% |
| Broadband Home | 1,579 | 76.1% |
| Cellular Data Only | 220 | 10.6% |
| Satellite Internet | 43 | 2.1% |
| No Internet | 256 | 12.3% |
| Total | 2,076 | 100.0% |
Manchester Summary
Manchester, Maryland is a small town located in the northeastern part of the state, in Carroll County. It is situated along the banks of the North Branch of the Patapsco River, and is bordered by the towns of Hampstead, Westminster, and Lineboro. The town has a population of approximately 4,000 people, and is known for its rural charm and small-town atmosphere.
Geography
Manchester is located in the Piedmont region of Maryland, and is situated in the northern part of the state. The town is located along the banks of the North Branch of the Patapsco River, and is bordered by the towns of Hampstead, Westminster, and Lineboro. The town is located at an elevation of approximately 500 feet above sea level, and is situated in a valley surrounded by rolling hills. The town is located approximately 30 miles north of Baltimore, and is accessible via Interstate 795.
Economy
Manchester is a small town with a limited economy. The town is home to several small businesses, including a grocery store, a hardware store, a pharmacy, and a few restaurants. The town is also home to a few manufacturing companies, including a furniture manufacturer and a plastics manufacturer. The town is also home to a few small farms, which produce a variety of crops, including corn, soybeans, and hay.
Demographics
As of the 2010 census, Manchester had a population of 4,000 people. The town is predominantly white, with approximately 90% of the population identifying as Caucasian. The town also has a small African American population, with approximately 5% of the population identifying as African American. The town also has a small Hispanic population, with approximately 3% of the population identifying as Hispanic or Latino. The median household income in Manchester is approximately $50,000, and the median home value is approximately $200,000.
History
Manchester was founded in 1765 by a group of German settlers. The town was originally known as “Manchester-on-the-Patapsco”, and was named after the city of Manchester in England. The town was incorporated in 1837, and was home to a variety of industries, including a flour mill, a sawmill, and a paper mill. The town was also home to a number of small farms, which produced a variety of crops, including corn, soybeans, and hay. The town was also home to a number of small businesses, including a grocery store, a hardware store, a pharmacy, and a few restaurants. The town was also home to a few manufacturing companies, including a furniture manufacturer and a plastics manufacturer. The town was also home to a number of churches, including the Manchester United Methodist Church, which was founded in 1845. The town was also home to a number of schools, including the Manchester Academy, which was founded in 1848. The town was also home to a number of fraternal organizations, including the Manchester Masonic Lodge, which was founded in 1867. The town was also home to a number of social clubs, including the Manchester Social Club, which was founded in 1875.
Common Questions
What is Per Capita Income in Manchester?
Per Capita income in Manchester is $47,720.
What is the Median Family Income in Manchester?
Median Family Income in Manchester is $141,042.
What is the Median Household income in Manchester?
Median Household Income in Manchester is $103,629.
What is Income or Wage Gap in Manchester?
Income or Wage Gap in Manchester is 30.0%.
Women in Manchester earn 70.0 cents for every dollar earned by a man.
What is Inequality or Gini Index in Manchester?
Inequality or Gini Index in Manchester is 0.43.
What is the Total Population of Manchester?
Total Population of Manchester is 5,403.
What is the Total Male Population of Manchester?
Total Male Population of Manchester is 2,696.
What is the Total Female Population of Manchester?
Total Female Population of Manchester is 2,707.
What is the Ratio of Males per 100 Females in Manchester?
There are 99.59 Males per 100 Females in Manchester.
What is the Ratio of Females per 100 Males in Manchester?
There are 100.41 Females per 100 Males in Manchester.
What is the Median Population Age in Manchester?
Median Population Age in Manchester is 42.8 Years.
What is the Average Family Size in Manchester
Average Family Size in Manchester is 3.3 People.
What is the Average Household Size in Manchester
Average Household Size in Manchester is 2.5 People.
How Large is the Labor Force in Manchester?
There are 3,027 People in the Labor Forcein in Manchester.
What is the Percentage of People in the Labor Force in Manchester?
68.4% of People are in the Labor Force in Manchester.
What is the Unemployment Rate in Manchester?
Unemployment Rate in Manchester is 0.9%.