Cities with the Highest Percentage of Indian (Asian) Population in Maryland
RELATED REPORTS & OPTIONS
Indian (Asian)
Maryland
Compare Cities
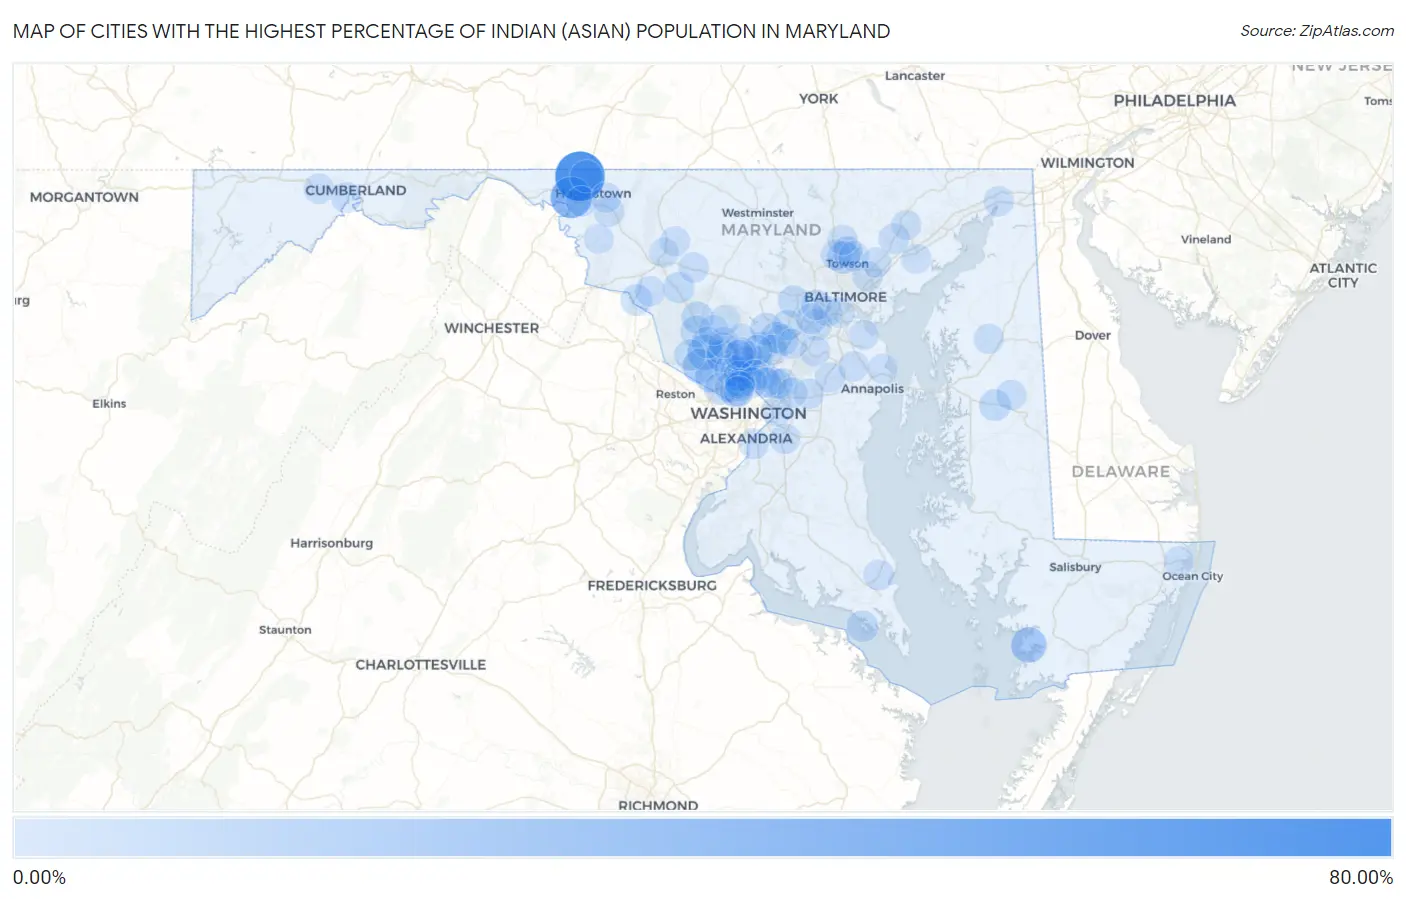
Map of Cities with the Highest Percentage of Indian (Asian) Population in Maryland
0.00%
80.00%
Cities with the Highest Percentage of Indian (Asian) Population in Maryland
| City | Indian (Asian) | vs State | vs National | |
| 1. | Cearfoss | 70.75% | 1.62%(+69.1)#1 | 1.61%(+69.1)#2 |
| 2. | Kemps Mill | 40.74% | 1.62%(+39.1)#2 | 1.61%(+39.1)#11 |
| 3. | Fairmount | 19.76% | 1.62%(+18.1)#3 | 1.61%(+18.1)#69 |
| 4. | North Potomac | 18.98% | 1.62%(+17.4)#4 | 1.61%(+17.4)#81 |
| 5. | Travilah | 17.02% | 1.62%(+15.4)#5 | 1.61%(+15.4)#109 |
| 6. | Lutherville | 10.20% | 1.62%(+8.58)#6 | 1.61%(+8.60)#291 |
| 7. | Potomac | 9.73% | 1.62%(+8.10)#7 | 1.61%(+8.12)#313 |
| 8. | Maugansville | 9.68% | 1.62%(+8.05)#8 | 1.61%(+8.07)#316 |
| 9. | Rockville | 9.46% | 1.62%(+7.84)#9 | 1.61%(+7.85)#325 |
| 10. | Kensington | 9.06% | 1.62%(+7.43)#10 | 1.61%(+7.45)#351 |
| 11. | Derwood | 8.76% | 1.62%(+7.13)#11 | 1.61%(+7.15)#368 |
| 12. | Cabin John | 7.97% | 1.62%(+6.35)#12 | 1.61%(+6.36)#412 |
| 13. | Clarksburg | 7.65% | 1.62%(+6.03)#13 | 1.61%(+6.05)#433 |
| 14. | Highland | 7.01% | 1.62%(+5.39)#14 | 1.61%(+5.40)#478 |
| 15. | Spencerville | 6.97% | 1.62%(+5.35)#15 | 1.61%(+5.36)#483 |
| 16. | Queen Anne | 6.57% | 1.62%(+4.94)#16 | 1.61%(+4.96)#517 |
| 17. | Germantown | 6.53% | 1.62%(+4.91)#17 | 1.61%(+4.92)#525 |
| 18. | Gaithersburg | 6.39% | 1.62%(+4.76)#18 | 1.61%(+4.78)#544 |
| 19. | Ellicott City | 6.37% | 1.62%(+4.75)#19 | 1.61%(+4.76)#548 |
| 20. | Tall Timbers | 6.25% | 1.62%(+4.63)#20 | 1.61%(+4.64)#561 |
| 21. | Scaggsville | 6.18% | 1.62%(+4.56)#21 | 1.61%(+4.57)#570 |
| 22. | Urbana | 5.85% | 1.62%(+4.22)#22 | 1.61%(+4.24)#616 |
| 23. | Point Of Rocks | 5.85% | 1.62%(+4.22)#23 | 1.61%(+4.24)#617 |
| 24. | Fulton | 5.57% | 1.62%(+3.95)#24 | 1.61%(+3.97)#649 |
| 25. | Elkridge | 5.51% | 1.62%(+3.89)#25 | 1.61%(+3.90)#656 |
| 26. | Darnestown | 5.50% | 1.62%(+3.88)#26 | 1.61%(+3.89)#658 |
| 27. | College Park | 5.16% | 1.62%(+3.53)#27 | 1.61%(+3.55)#722 |
| 28. | Brown Station | 4.88% | 1.62%(+3.26)#28 | 1.61%(+3.27)#771 |
| 29. | Garrett Park | 4.66% | 1.62%(+3.03)#29 | 1.61%(+3.05)#815 |
| 30. | North Bethesda | 4.55% | 1.62%(+2.93)#30 | 1.61%(+2.94)#851 |
| 31. | Redland | 4.26% | 1.62%(+2.63)#31 | 1.61%(+2.65)#908 |
| 32. | Friendship Heights Village | 4.10% | 1.62%(+2.48)#32 | 1.61%(+2.49)#937 |
| 33. | Hillandale | 4.06% | 1.62%(+2.43)#33 | 1.61%(+2.45)#944 |
| 34. | Mays Chapel | 3.98% | 1.62%(+2.36)#34 | 1.61%(+2.37)#975 |
| 35. | Ilchester | 3.84% | 1.62%(+2.22)#35 | 1.61%(+2.23)#1,012 |
| 36. | Pleasant Hills | 3.64% | 1.62%(+2.02)#36 | 1.61%(+2.03)#1,063 |
| 37. | Columbia | 3.64% | 1.62%(+2.02)#37 | 1.61%(+2.03)#1,064 |
| 38. | Beaver Creek | 3.55% | 1.62%(+1.93)#38 | 1.61%(+1.95)#1,087 |
| 39. | North Chevy Chase | 3.52% | 1.62%(+1.90)#39 | 1.61%(+1.92)#1,095 |
| 40. | Greenbelt | 3.48% | 1.62%(+1.85)#40 | 1.61%(+1.87)#1,114 |
| 41. | Somerset | 3.40% | 1.62%(+1.78)#41 | 1.61%(+1.80)#1,137 |
| 42. | Bethesda | 3.40% | 1.62%(+1.78)#42 | 1.61%(+1.79)#1,139 |
| 43. | Forest Glen | 3.34% | 1.62%(+1.71)#43 | 1.61%(+1.73)#1,163 |
| 44. | Colesville | 3.16% | 1.62%(+1.54)#44 | 1.61%(+1.55)#1,228 |
| 45. | Wheaton | 3.12% | 1.62%(+1.50)#45 | 1.61%(+1.52)#1,243 |
| 46. | Solomons | 3.12% | 1.62%(+1.50)#46 | 1.61%(+1.51)#1,244 |
| 47. | Fairmount Heights | 3.02% | 1.62%(+1.40)#47 | 1.61%(+1.41)#1,288 |
| 48. | Romancoke | 3.01% | 1.62%(+1.39)#48 | 1.61%(+1.40)#1,297 |
| 49. | Fairwood | 3.01% | 1.62%(+1.38)#49 | 1.61%(+1.40)#1,303 |
| 50. | Olney | 2.91% | 1.62%(+1.29)#50 | 1.61%(+1.30)#1,334 |
| 51. | Bowling Green | 2.90% | 1.62%(+1.28)#51 | 1.61%(+1.30)#1,337 |
| 52. | Halfway | 2.82% | 1.62%(+1.19)#52 | 1.61%(+1.21)#1,371 |
| 53. | Burtonsville | 2.78% | 1.62%(+1.16)#53 | 1.61%(+1.17)#1,394 |
| 54. | Timonium | 2.78% | 1.62%(+1.16)#54 | 1.61%(+1.17)#1,395 |
| 55. | National Harbor | 2.76% | 1.62%(+1.14)#55 | 1.61%(+1.16)#1,405 |
| 56. | Robinwood | 2.66% | 1.62%(+1.04)#56 | 1.61%(+1.05)#1,472 |
| 57. | Herald Harbor | 2.60% | 1.62%(+0.978)#57 | 1.61%(+0.993)#1,503 |
| 58. | Fort Meade | 2.57% | 1.62%(+0.943)#58 | 1.61%(+0.958)#1,528 |
| 59. | New Market | 2.54% | 1.62%(+0.919)#59 | 1.61%(+0.934)#1,545 |
| 60. | Glenmont | 2.54% | 1.62%(+0.913)#60 | 1.61%(+0.929)#1,551 |
| 61. | Layhill | 2.52% | 1.62%(+0.897)#61 | 1.61%(+0.912)#1,564 |
| 62. | Hampton | 2.52% | 1.62%(+0.896)#62 | 1.61%(+0.911)#1,567 |
| 63. | Overlea | 2.51% | 1.62%(+0.885)#63 | 1.61%(+0.900)#1,572 |
| 64. | Arbutus | 2.49% | 1.62%(+0.864)#64 | 1.61%(+0.879)#1,589 |
| 65. | Frostburg | 2.49% | 1.62%(+0.863)#65 | 1.61%(+0.878)#1,591 |
| 66. | North East | 2.44% | 1.62%(+0.814)#66 | 1.61%(+0.829)#1,612 |
| 67. | Crofton | 2.37% | 1.62%(+0.750)#67 | 1.61%(+0.765)#1,667 |
| 68. | South Kensington | 2.32% | 1.62%(+0.694)#68 | 1.61%(+0.709)#1,709 |
| 69. | Andrews Afb | 2.29% | 1.62%(+0.667)#69 | 1.61%(+0.682)#1,726 |
| 70. | Cloverly | 2.25% | 1.62%(+0.621)#70 | 1.61%(+0.636)#1,759 |
| 71. | Honeygo | 2.24% | 1.62%(+0.618)#71 | 1.61%(+0.633)#1,761 |
| 72. | Church Hill | 2.21% | 1.62%(+0.590)#72 | 1.61%(+0.605)#1,782 |
| 73. | Adamstown | 2.17% | 1.62%(+0.548)#73 | 1.61%(+0.563)#1,811 |
| 74. | Catonsville | 2.16% | 1.62%(+0.534)#74 | 1.61%(+0.549)#1,823 |
| 75. | Ridgely | 2.14% | 1.62%(+0.519)#75 | 1.61%(+0.534)#1,837 |
| 76. | Leisure World | 2.14% | 1.62%(+0.515)#76 | 1.61%(+0.531)#1,840 |
| 77. | Berwyn Heights | 2.08% | 1.62%(+0.460)#77 | 1.61%(+0.475)#1,877 |
| 78. | Aspen Hill | 2.07% | 1.62%(+0.449)#78 | 1.61%(+0.465)#1,881 |
| 79. | Four Corners | 2.02% | 1.62%(+0.398)#79 | 1.61%(+0.413)#1,916 |
| 80. | Cockeysville | 2.01% | 1.62%(+0.389)#80 | 1.61%(+0.404)#1,927 |
| 81. | Bel Air | 1.91% | 1.62%(+0.286)#81 | 1.61%(+0.301)#2,035 |
| 82. | Walkersville | 1.91% | 1.62%(+0.284)#82 | 1.61%(+0.299)#2,038 |
| 83. | Flower Hill | 1.77% | 1.62%(+0.146)#83 | 1.61%(+0.161)#2,183 |
| 84. | Laytonsville | 1.77% | 1.62%(+0.143)#84 | 1.61%(+0.158)#2,188 |
| 85. | Baltimore Highlands | 1.75% | 1.62%(+0.126)#85 | 1.61%(+0.141)#2,210 |
| 86. | Adelphi | 1.71% | 1.62%(+0.088)#86 | 1.61%(+0.103)#2,260 |
| 87. | Keedysville | 1.71% | 1.62%(+0.083)#87 | 1.61%(+0.098)#2,271 |
| 88. | Silver Spring | 1.71% | 1.62%(+0.081)#88 | 1.61%(+0.096)#2,276 |
| 89. | Lanham | 1.70% | 1.62%(+0.074)#89 | 1.61%(+0.089)#2,282 |
| 90. | Frederick | 1.66% | 1.62%(+0.033)#90 | 1.61%(+0.048)#2,333 |
| 91. | Perry Hall | 1.65% | 1.62%(+0.031)#91 | 1.61%(+0.046)#2,341 |
| 92. | Edgewood | 1.64% | 1.62%(+0.017)#92 | 1.61%(+0.032)#2,356 |
| 93. | Montgomery Village | 1.58% | 1.62%(-0.047)#93 | 1.61%(-0.032)#2,424 |
| 94. | Cape St Claire | 1.57% | 1.62%(-0.050)#94 | 1.61%(-0.035)#2,431 |
| 95. | Chevy Chase | 1.53% | 1.62%(-0.091)#95 | 1.61%(-0.076)#2,483 |
| 96. | Chevy Chase Section Five | 1.51% | 1.62%(-0.116)#96 | 1.61%(-0.101)#2,520 |
| 97. | North Laurel | 1.50% | 1.62%(-0.129)#97 | 1.61%(-0.114)#2,546 |
| 98. | Riviera Beach | 1.49% | 1.62%(-0.131)#98 | 1.61%(-0.115)#2,548 |
| 99. | Chevy Chase Village | 1.49% | 1.62%(-0.138)#99 | 1.61%(-0.123)#2,557 |
| 100. | Ocean Pines | 1.48% | 1.62%(-0.146)#100 | 1.61%(-0.131)#2,570 |
Common Questions
What are the Top 10 Cities with the Highest Percentage of Indian (Asian) Population in Maryland?
Top 10 Cities with the Highest Percentage of Indian (Asian) Population in Maryland are:
#1
70.75%
#2
40.74%
#3
19.76%
#4
18.98%
#5
17.02%
#6
10.20%
#7
9.73%
#8
9.68%
#9
9.46%
#10
9.06%
What city has the Highest Percentage of Indian (Asian) Population in Maryland?
Cearfoss has the Highest Percentage of Indian (Asian) Population in Maryland with 70.75%.
What is the Percentage of Indian (Asian) Population in the State of Maryland?
Percentage of Indian (Asian) Population in Maryland is 1.62%.
What is the Percentage of Indian (Asian) Population in the United States?
Percentage of Indian (Asian) Population in the United States is 1.61%.