Kensington, MD
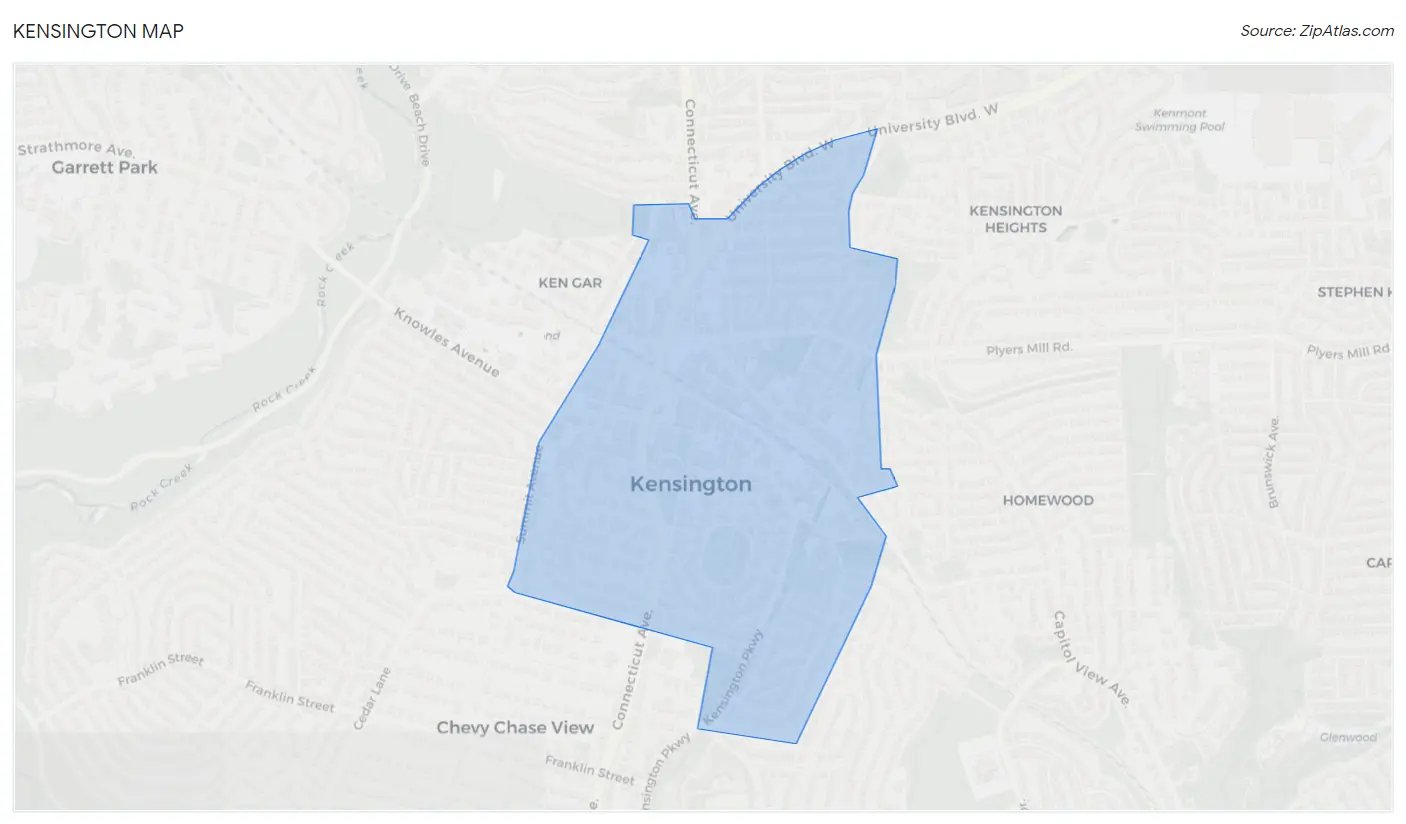
Kensington Map
Kensington Overview
2,241
TOTAL POPULATION
1,104
MALE POPULATION
1,137
FEMALE POPULATION
97.10
MALES / 100 FEMALES
102.99
FEMALES / 100 MALES
40.4
MEDIAN AGE
3.5
AVG FAMILY SIZE
2.8
AVG HOUSEHOLD SIZE
$78,964
PER CAPITA INCOME
$228,889
AVG FAMILY INCOME
$143,021
AVG HOUSEHOLD INCOME
33.9%
WAGE / INCOME GAP [ % ]
66.1¢/ $1
WAGE / INCOME GAP [ $ ]
0.48
INEQUALITY / GINI INDEX
1,115
LABOR FORCE [ PEOPLE ]
70.3%
PERCENT IN LABOR FORCE
5.8%
UNEMPLOYMENT RATE
Kensington Zip Codes
Race in Kensington
The most populous races in Kensington are White / Caucasian (1,606 | 71.7%), Asian (317 | 14.1%), and Hispanic or Latino (298 | 13.3%).
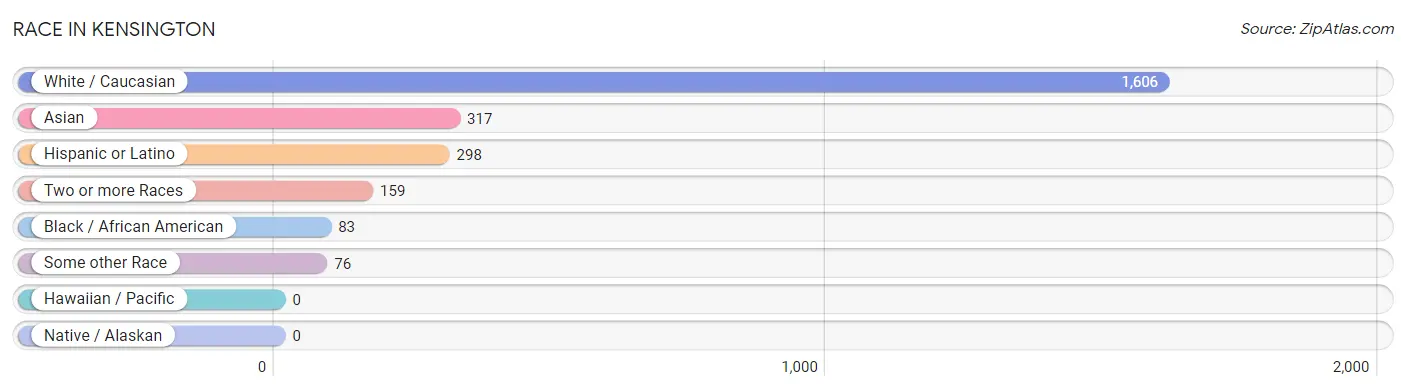
| Race | # Population | % Population |
| Asian | 317 | 14.1% |
| Black / African American | 83 | 3.7% |
| Hawaiian / Pacific | 0 | 0.0% |
| Hispanic or Latino | 298 | 13.3% |
| Native / Alaskan | 0 | 0.0% |
| White / Caucasian | 1,606 | 71.7% |
| Two or more Races | 159 | 7.1% |
| Some other Race | 76 | 3.4% |
| Total | 2,241 | 100.0% |
Ancestry in Kensington
The most populous ancestries reported in Kensington are English (372 | 16.6%), Irish (333 | 14.9%), German (245 | 10.9%), Indian (Asian) (203 | 9.1%), and Italian (149 | 6.7%), together accounting for 58.1% of all Kensington residents.
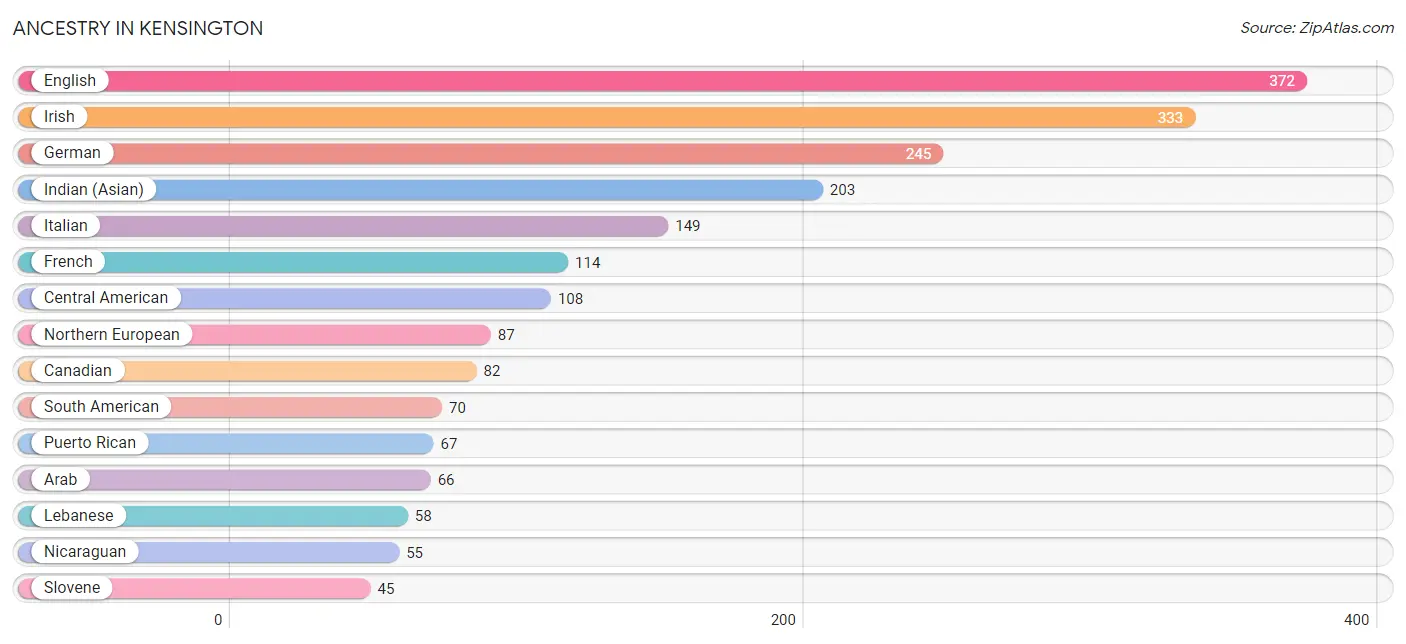
| Ancestry | # Population | % Population |
| American | 42 | 1.9% |
| Arab | 66 | 2.9% |
| Argentinean | 29 | 1.3% |
| Australian | 37 | 1.7% |
| Belgian | 6 | 0.3% |
| Bhutanese | 15 | 0.7% |
| Bolivian | 5 | 0.2% |
| Brazilian | 6 | 0.3% |
| British | 19 | 0.9% |
| Burmese | 26 | 1.2% |
| Canadian | 82 | 3.7% |
| Central American | 108 | 4.8% |
| Chilean | 5 | 0.2% |
| Colombian | 15 | 0.7% |
| Costa Rican | 6 | 0.3% |
| Croatian | 5 | 0.2% |
| Cuban | 17 | 0.8% |
| Dutch | 12 | 0.5% |
| Eastern European | 18 | 0.8% |
| Ecuadorian | 5 | 0.2% |
| English | 372 | 16.6% |
| Estonian | 4 | 0.2% |
| European | 34 | 1.5% |
| French | 114 | 5.1% |
| French Canadian | 15 | 0.7% |
| German | 245 | 10.9% |
| Guatemalan | 33 | 1.5% |
| Hungarian | 8 | 0.4% |
| Indian (Asian) | 203 | 9.1% |
| Indonesian | 16 | 0.7% |
| Iranian | 13 | 0.6% |
| Irish | 333 | 14.9% |
| Italian | 149 | 6.7% |
| Jamaican | 3 | 0.1% |
| Korean | 19 | 0.9% |
| Laotian | 43 | 1.9% |
| Lebanese | 58 | 2.6% |
| Mexican | 31 | 1.4% |
| Nicaraguan | 55 | 2.5% |
| Northern European | 87 | 3.9% |
| Norwegian | 15 | 0.7% |
| Palestinian | 10 | 0.4% |
| Paraguayan | 5 | 0.2% |
| Peruvian | 6 | 0.3% |
| Polish | 37 | 1.7% |
| Puerto Rican | 67 | 3.0% |
| Romanian | 7 | 0.3% |
| Russian | 29 | 1.3% |
| Salvadoran | 14 | 0.6% |
| Scandinavian | 4 | 0.2% |
| Scotch-Irish | 25 | 1.1% |
| Scottish | 26 | 1.2% |
| Slovak | 5 | 0.2% |
| Slovene | 45 | 2.0% |
| South American | 70 | 3.1% |
| Spaniard | 5 | 0.2% |
| Sri Lankan | 25 | 1.1% |
| Swedish | 14 | 0.6% |
| Thai | 41 | 1.8% |
| Ukrainian | 13 | 0.6% |
| Welsh | 24 | 1.1% | View All 61 Rows |
Immigrants in Kensington
The most numerous immigrant groups reported in Kensington came from Asia (188 | 8.4%), South Eastern Asia (122 | 5.4%), Latin America (98 | 4.4%), Canada (86 | 3.8%), and Europe (75 | 3.4%), together accounting for 25.4% of all Kensington residents.
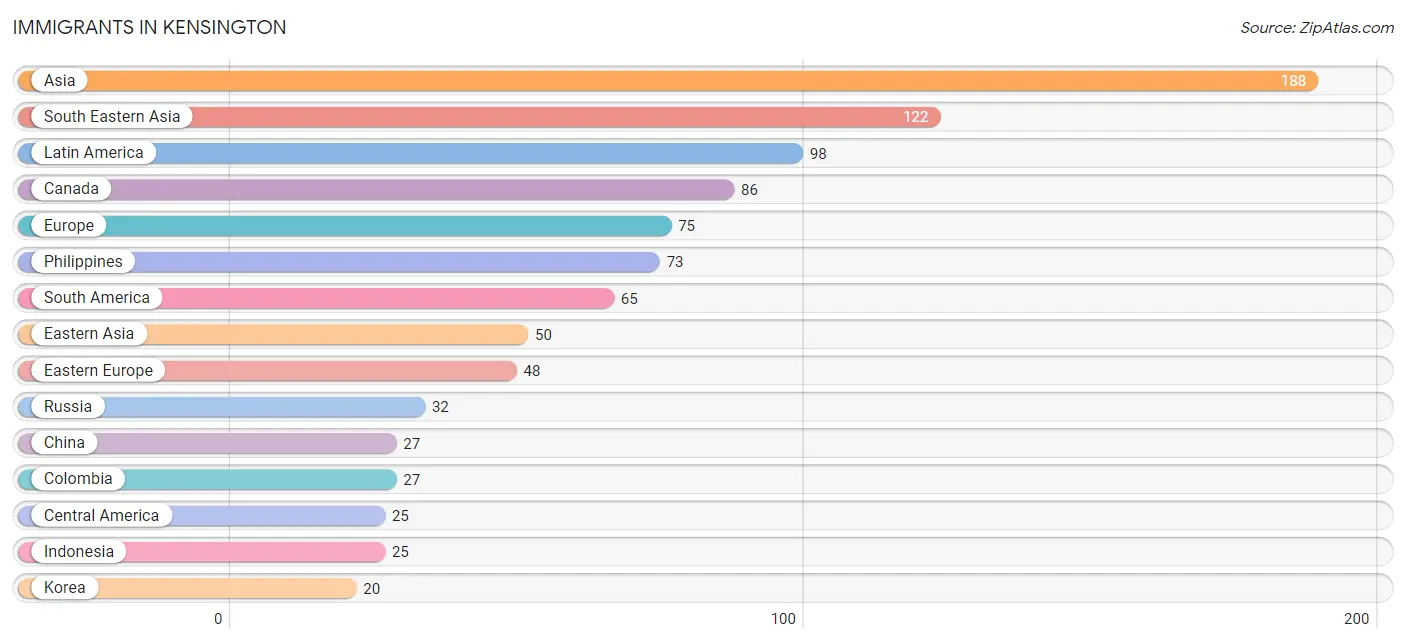
| Immigration Origin | # Population | % Population |
| Africa | 11 | 0.5% |
| Argentina | 12 | 0.5% |
| Asia | 188 | 8.4% |
| Australia | 4 | 0.2% |
| Brazil | 6 | 0.3% |
| Canada | 86 | 3.8% |
| Caribbean | 8 | 0.4% |
| Central America | 25 | 1.1% |
| China | 27 | 1.2% |
| Colombia | 27 | 1.2% |
| Costa Rica | 6 | 0.3% |
| Cuba | 5 | 0.2% |
| Eastern Africa | 11 | 0.5% |
| Eastern Asia | 50 | 2.2% |
| Eastern Europe | 48 | 2.1% |
| Ecuador | 5 | 0.2% |
| England | 3 | 0.1% |
| Europe | 75 | 3.4% |
| France | 6 | 0.3% |
| Germany | 9 | 0.4% |
| Hong Kong | 9 | 0.4% |
| Indonesia | 25 | 1.1% |
| Italy | 4 | 0.2% |
| Jamaica | 3 | 0.1% |
| Japan | 3 | 0.1% |
| Kenya | 6 | 0.3% |
| Korea | 20 | 0.9% |
| Latin America | 98 | 4.4% |
| Lebanon | 4 | 0.2% |
| Nicaragua | 19 | 0.9% |
| Northern Europe | 8 | 0.4% |
| Oceania | 4 | 0.2% |
| Philippines | 73 | 3.3% |
| Poland | 5 | 0.2% |
| Russia | 32 | 1.4% |
| South America | 65 | 2.9% |
| South Eastern Asia | 122 | 5.4% |
| Southern Europe | 4 | 0.2% |
| Uganda | 5 | 0.2% |
| Venezuela | 5 | 0.2% |
| Vietnam | 8 | 0.4% |
| Western Asia | 11 | 0.5% |
| Western Europe | 15 | 0.7% | View All 43 Rows |
Sex and Age in Kensington
Sex and Age in Kensington
The most populous age groups in Kensington are 40 to 44 Years (156 | 14.1%) for men and Under 5 Years (141 | 12.4%) for women.
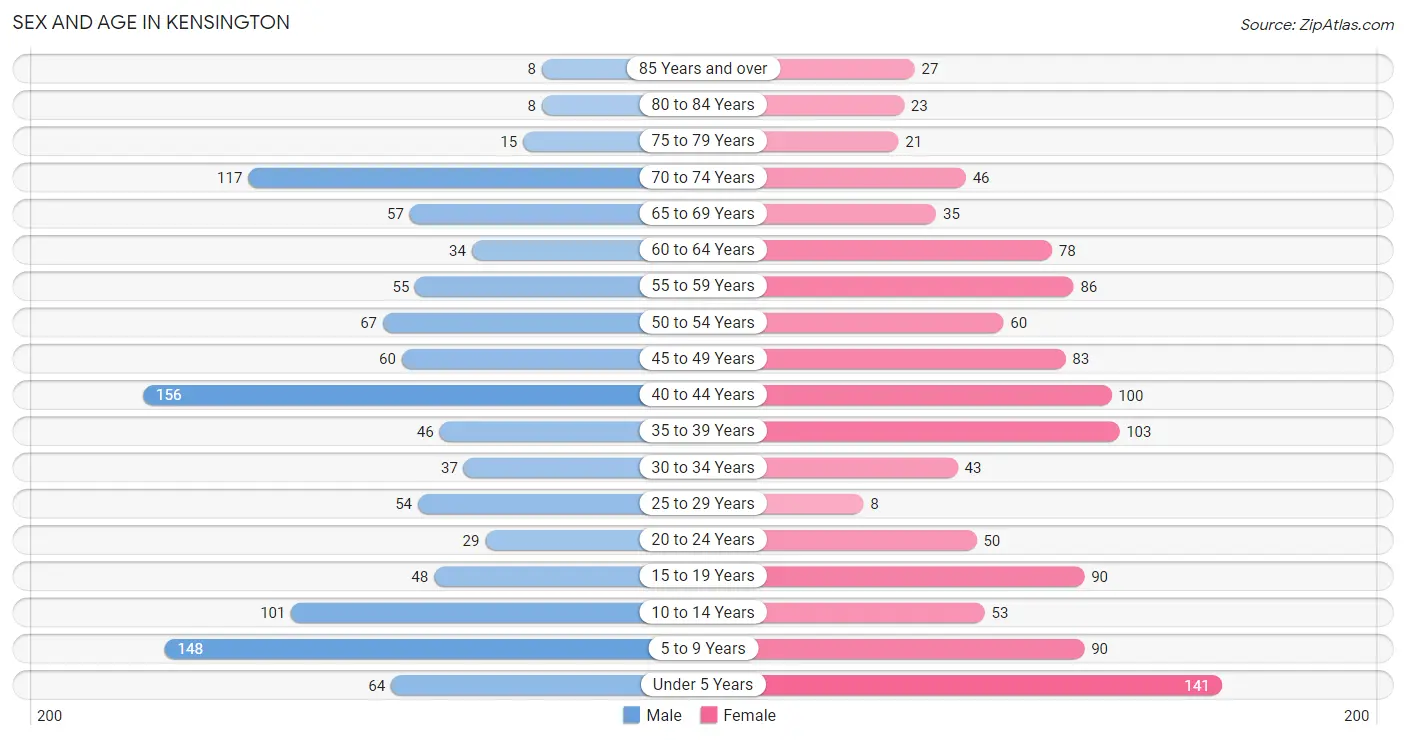
| Age Bracket | Male | Female |
| Under 5 Years | 64 (5.8%) | 141 (12.4%) |
| 5 to 9 Years | 148 (13.4%) | 90 (7.9%) |
| 10 to 14 Years | 101 (9.1%) | 53 (4.7%) |
| 15 to 19 Years | 48 (4.3%) | 90 (7.9%) |
| 20 to 24 Years | 29 (2.6%) | 50 (4.4%) |
| 25 to 29 Years | 54 (4.9%) | 8 (0.7%) |
| 30 to 34 Years | 37 (3.4%) | 43 (3.8%) |
| 35 to 39 Years | 46 (4.2%) | 103 (9.1%) |
| 40 to 44 Years | 156 (14.1%) | 100 (8.8%) |
| 45 to 49 Years | 60 (5.4%) | 83 (7.3%) |
| 50 to 54 Years | 67 (6.1%) | 60 (5.3%) |
| 55 to 59 Years | 55 (5.0%) | 86 (7.6%) |
| 60 to 64 Years | 34 (3.1%) | 78 (6.9%) |
| 65 to 69 Years | 57 (5.2%) | 35 (3.1%) |
| 70 to 74 Years | 117 (10.6%) | 46 (4.1%) |
| 75 to 79 Years | 15 (1.4%) | 21 (1.8%) |
| 80 to 84 Years | 8 (0.7%) | 23 (2.0%) |
| 85 Years and over | 8 (0.7%) | 27 (2.4%) |
| Total | 1,104 (100.0%) | 1,137 (100.0%) |
Families and Households in Kensington
Median Family Size in Kensington
The median family size in Kensington is 3.46 persons per family, with married-couple families (449 | 85.4%) accounting for the largest median family size of 3.59 persons per family. On the other hand, single female/mother families (64 | 12.2%) represent the smallest median family size with 2.67 persons per family.
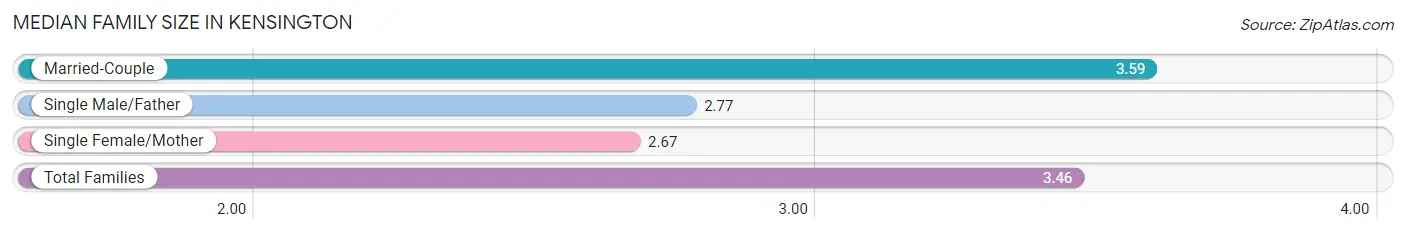
| Family Type | # Families | Family Size |
| Married-Couple | 449 (85.4%) | 3.59 |
| Single Male/Father | 13 (2.5%) | 2.77 |
| Single Female/Mother | 64 (12.2%) | 2.67 |
| Total Families | 526 (100.0%) | 3.46 |
Median Household Size in Kensington
The median household size in Kensington is 2.76 persons per household, with married-couple households (449 | 55.2%) accounting for the largest median household size of 3.63 persons per household. non-family households (287 | 35.3%) represent the smallest median household size with 1.39 persons per household.
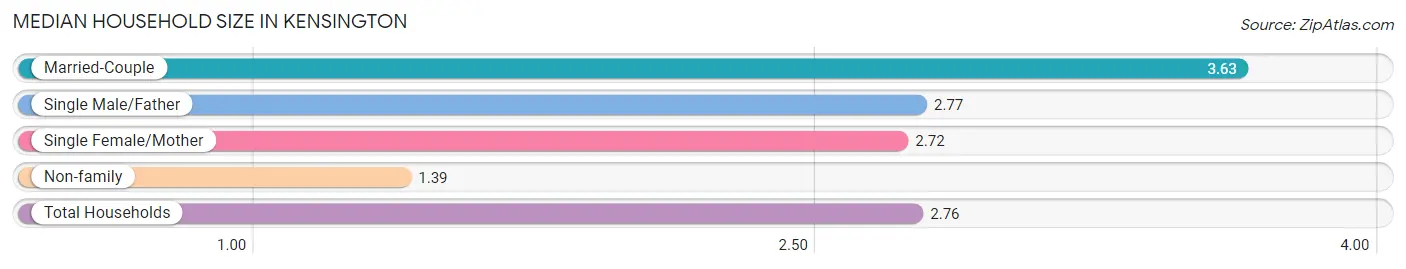
| Household Type | # Households | Household Size |
| Married-Couple | 449 (55.2%) | 3.63 |
| Single Male/Father | 13 (1.6%) | 2.77 |
| Single Female/Mother | 64 (7.9%) | 2.72 |
| Non-family | 287 (35.3%) | 1.39 |
| Total Households | 813 (100.0%) | 2.76 |
Household Size by Marriage Status in Kensington
Out of a total of 813 households in Kensington, 526 (64.7%) are family households, while 287 (35.3%) are nonfamily households. The most numerous type of family households are 2-person households, comprising 172, and the most common type of nonfamily households are 1-person households, comprising 182.
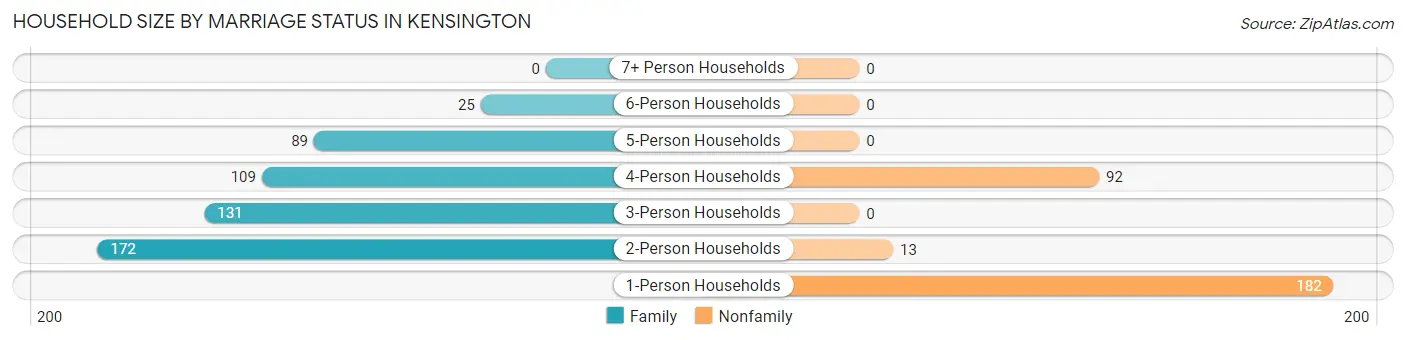
| Household Size | Family Households | Nonfamily Households |
| 1-Person Households | - | 182 (22.4%) |
| 2-Person Households | 172 (21.2%) | 13 (1.6%) |
| 3-Person Households | 131 (16.1%) | 0 (0.0%) |
| 4-Person Households | 109 (13.4%) | 92 (11.3%) |
| 5-Person Households | 89 (11.0%) | 0 (0.0%) |
| 6-Person Households | 25 (3.1%) | 0 (0.0%) |
| 7+ Person Households | 0 (0.0%) | 0 (0.0%) |
| Total | 526 (64.7%) | 287 (35.3%) |
Female Fertility in Kensington
Fertility by Age in Kensington
Average fertility rate in Kensington is 101.0 births per 1,000 women. Women in the age bracket of 20 to 34 years have the highest fertility rate with 218.0 births per 1,000 women. Women in the age bracket of 35 to 50 years acount for 56.0% of all women with births.
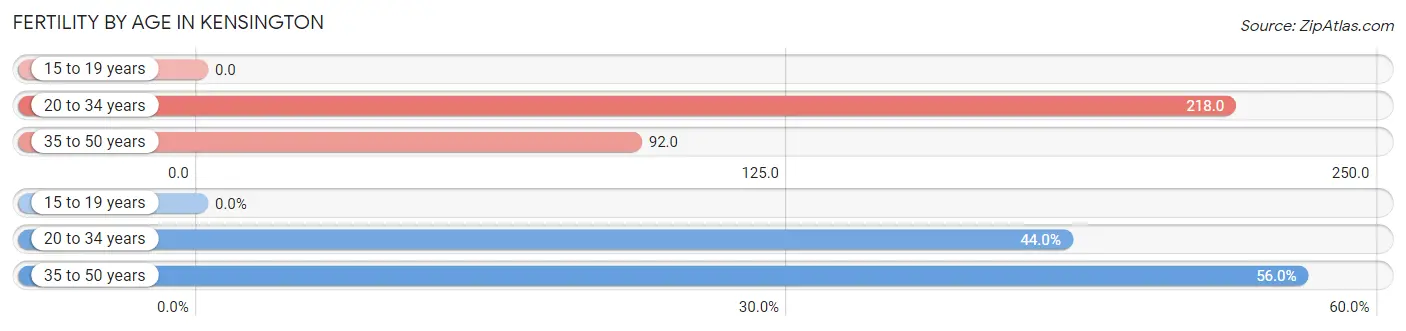
| Age Bracket | Women with Births | Births / 1,000 Women |
| 15 to 19 years | 0 (0.0%) | 0.0 |
| 20 to 34 years | 22 (44.0%) | 218.0 |
| 35 to 50 years | 28 (56.0%) | 92.0 |
| Total | 50 (100.0%) | 101.0 |
Fertility by Age by Marriage Status in Kensington
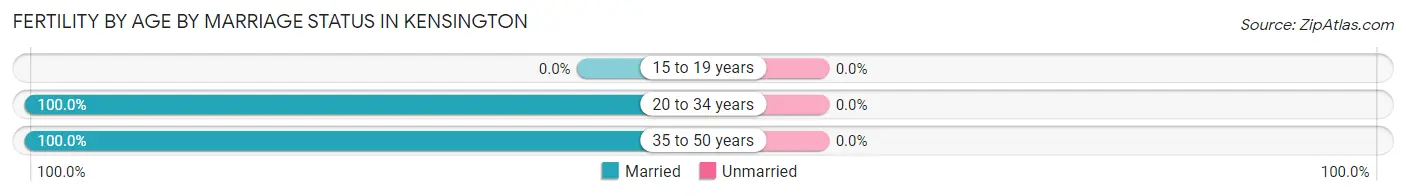
| Age Bracket | Married | Unmarried |
| 15 to 19 years | 0 (0.0%) | 0 (0.0%) |
| 20 to 34 years | 22 (100.0%) | 0 (0.0%) |
| 35 to 50 years | 28 (100.0%) | 0 (0.0%) |
| Total | 50 (100.0%) | 0 (0.0%) |
Fertility by Education in Kensington
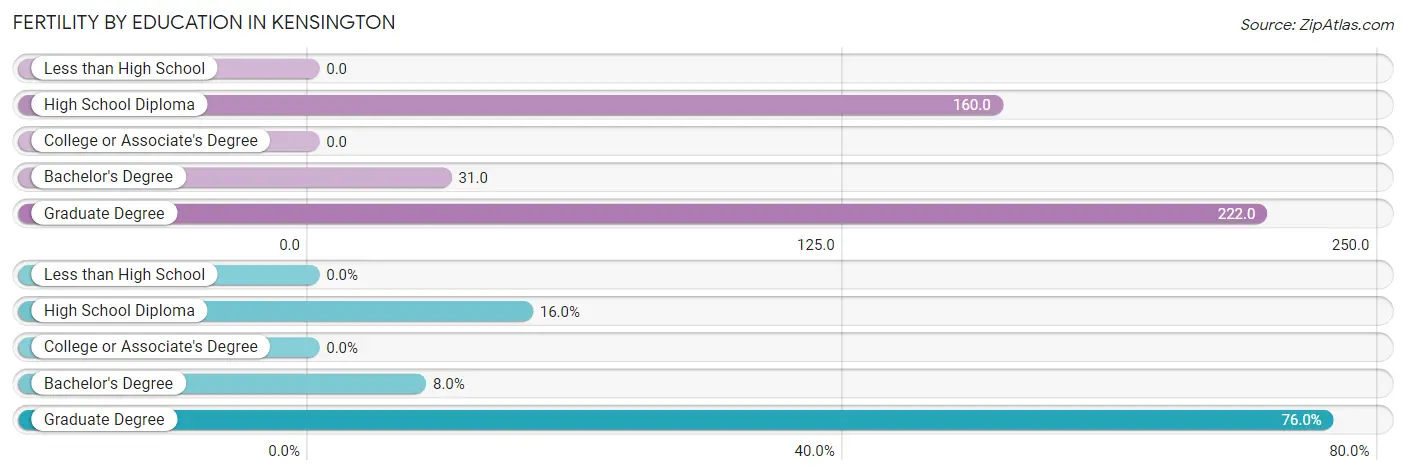
| Educational Attainment | Women with Births | Births / 1,000 Women |
| Less than High School | 0 (0.0%) | 0.0 |
| High School Diploma | 8 (16.0%) | 160.0 |
| College or Associate's Degree | 0 (0.0%) | 0.0 |
| Bachelor's Degree | 4 (8.0%) | 31.0 |
| Graduate Degree | 38 (76.0%) | 222.0 |
| Total | 50 (100.0%) | 101.0 |
Fertility by Education by Marriage Status in Kensington
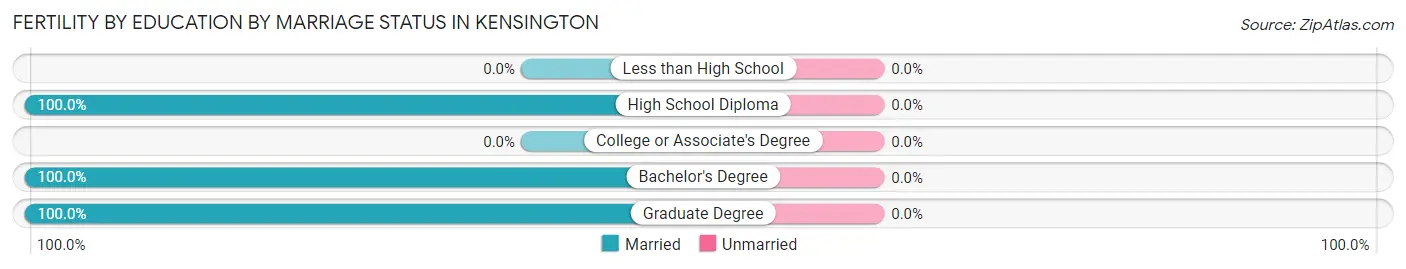
| Educational Attainment | Married | Unmarried |
| Less than High School | 0 (0.0%) | 0 (0.0%) |
| High School Diploma | 8 (100.0%) | 0 (0.0%) |
| College or Associate's Degree | 0 (0.0%) | 0 (0.0%) |
| Bachelor's Degree | 4 (100.0%) | 0 (0.0%) |
| Graduate Degree | 38 (100.0%) | 0 (0.0%) |
| Total | 50 (100.0%) | 0 (0.0%) |
Income in Kensington
Income Overview in Kensington
Per Capita Income in Kensington is $78,964, while median incomes of families and households are $228,889 and $143,021 respectively.
| Characteristic | Number | Measure |
| Per Capita Income | 2,241 | $78,964 |
| Median Family Income | 526 | $228,889 |
| Mean Family Income | 526 | $278,524 |
| Median Household Income | 813 | $143,021 |
| Mean Household Income | 813 | $221,236 |
| Income Deficit | 526 | $0 |
| Wage / Income Gap (%) | 2,241 | 33.95% |
| Wage / Income Gap ($) | 2,241 | 66.05¢ per $1 |
| Gini / Inequality Index | 2,241 | 0.48 |
Earnings by Sex in Kensington
Average Earnings in Kensington are $77,656, $98,214 for men and $64,871 for women, a difference of 34.0%.
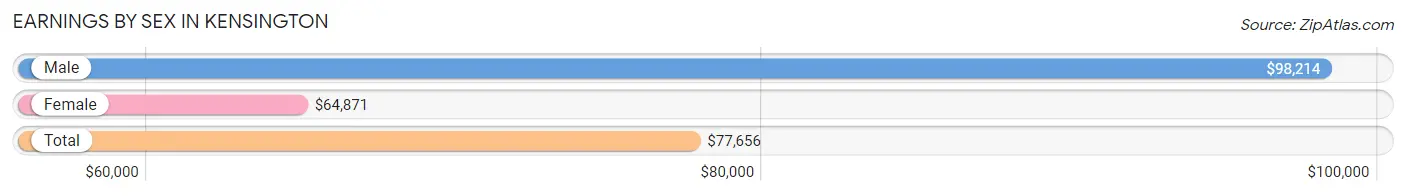
| Sex | Number | Average Earnings |
| Male | 564 (48.0%) | $98,214 |
| Female | 611 (52.0%) | $64,871 |
| Total | 1,175 (100.0%) | $77,656 |
Earnings by Sex by Income Bracket in Kensington
The most common earnings brackets in Kensington are $100,000+ for men (277 | 49.1%) and $100,000+ for women (231 | 37.8%).
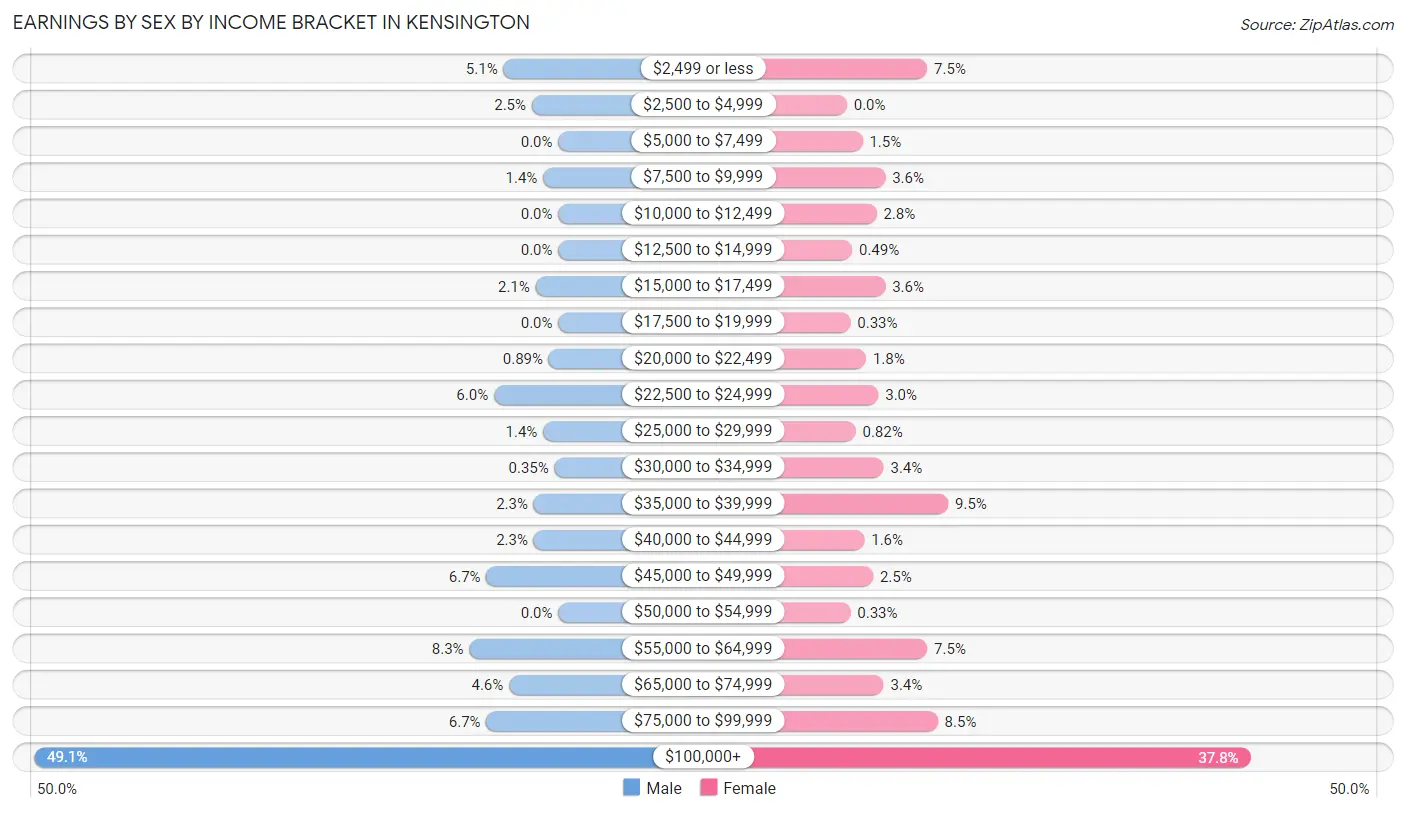
| Income | Male | Female |
| $2,499 or less | 29 (5.1%) | 46 (7.5%) |
| $2,500 to $4,999 | 14 (2.5%) | 0 (0.0%) |
| $5,000 to $7,499 | 0 (0.0%) | 9 (1.5%) |
| $7,500 to $9,999 | 8 (1.4%) | 22 (3.6%) |
| $10,000 to $12,499 | 0 (0.0%) | 17 (2.8%) |
| $12,500 to $14,999 | 0 (0.0%) | 3 (0.5%) |
| $15,000 to $17,499 | 12 (2.1%) | 22 (3.6%) |
| $17,500 to $19,999 | 0 (0.0%) | 2 (0.3%) |
| $20,000 to $22,499 | 5 (0.9%) | 11 (1.8%) |
| $22,500 to $24,999 | 34 (6.0%) | 18 (2.9%) |
| $25,000 to $29,999 | 8 (1.4%) | 5 (0.8%) |
| $30,000 to $34,999 | 2 (0.4%) | 21 (3.4%) |
| $35,000 to $39,999 | 13 (2.3%) | 58 (9.5%) |
| $40,000 to $44,999 | 13 (2.3%) | 10 (1.6%) |
| $45,000 to $49,999 | 38 (6.7%) | 15 (2.5%) |
| $50,000 to $54,999 | 0 (0.0%) | 2 (0.3%) |
| $55,000 to $64,999 | 47 (8.3%) | 46 (7.5%) |
| $65,000 to $74,999 | 26 (4.6%) | 21 (3.4%) |
| $75,000 to $99,999 | 38 (6.7%) | 52 (8.5%) |
| $100,000+ | 277 (49.1%) | 231 (37.8%) |
| Total | 564 (100.0%) | 611 (100.0%) |
Earnings by Sex by Educational Attainment in Kensington
Average earnings in Kensington are $118,333 for men and $80,417 for women, a difference of 32.0%. Men with an educational attainment of graduate degree enjoy the highest average annual earnings of $156,250, while those with bachelor's degree education earn the least with $129,583. Women with an educational attainment of graduate degree earn the most with the average annual earnings of $113,750, while those with high school diploma education have the smallest earnings of $2,499.
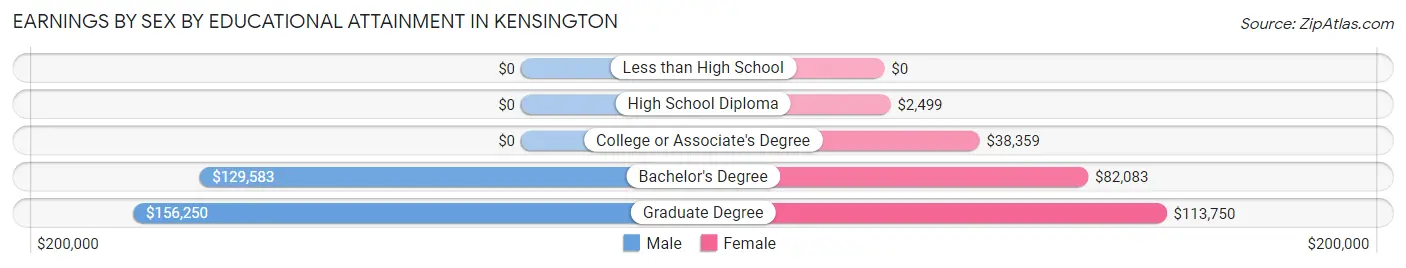
| Educational Attainment | Male Income | Female Income |
| Less than High School | - | - |
| High School Diploma | - | - |
| College or Associate's Degree | - | - |
| Bachelor's Degree | $129,583 | $82,083 |
| Graduate Degree | $156,250 | $113,750 |
| Total | $118,333 | $80,417 |
Family Income in Kensington
Family Income Brackets in Kensington
According to the Kensington family income data, there are 290 families falling into the $200,000+ income range, which is the most common income bracket and makes up 55.1% of all families.
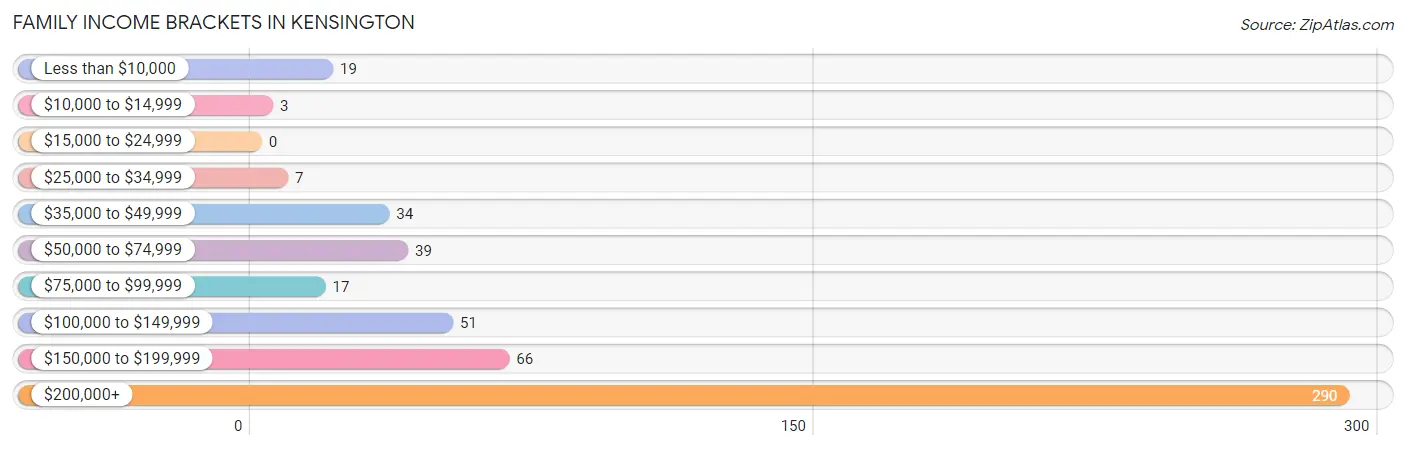
| Income Bracket | # Families | % Families |
| Less than $10,000 | 19 | 3.6% |
| $10,000 to $14,999 | 3 | 0.6% |
| $15,000 to $24,999 | 0 | 0.0% |
| $25,000 to $34,999 | 7 | 1.3% |
| $35,000 to $49,999 | 34 | 6.5% |
| $50,000 to $74,999 | 39 | 7.4% |
| $75,000 to $99,999 | 17 | 3.2% |
| $100,000 to $149,999 | 51 | 9.7% |
| $150,000 to $199,999 | 66 | 12.5% |
| $200,000+ | 290 | 55.1% |
Family Income by Famaliy Size in Kensington
4-person families (119 | 22.6%) account for the highest median family income in Kensington with $250,001 per family, while 2-person families (178 | 33.8%) have the highest median income of $67,032 per family member.
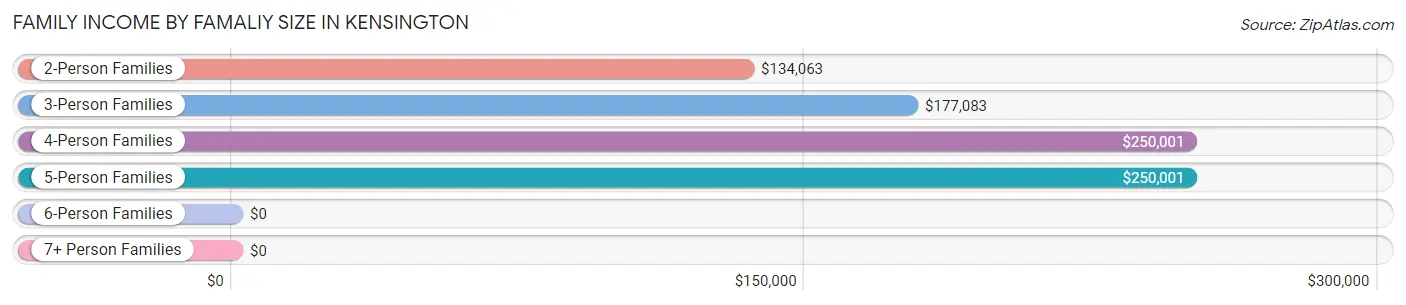
| Income Bracket | # Families | Median Income |
| 2-Person Families | 178 (33.8%) | $134,063 |
| 3-Person Families | 125 (23.8%) | $177,083 |
| 4-Person Families | 119 (22.6%) | $250,001 |
| 5-Person Families | 83 (15.8%) | $250,001 |
| 6-Person Families | 21 (4.0%) | $0 |
| 7+ Person Families | 0 (0.0%) | $0 |
| Total | 526 (100.0%) | $228,889 |
Family Income by Number of Earners in Kensington
The median family income in Kensington is $228,889, with families comprising 2 earners (326) having the highest median family income of $250,001, while families with 1 earner (131) have the lowest median family income of $115,417, accounting for 62.0% and 24.9% of families, respectively.
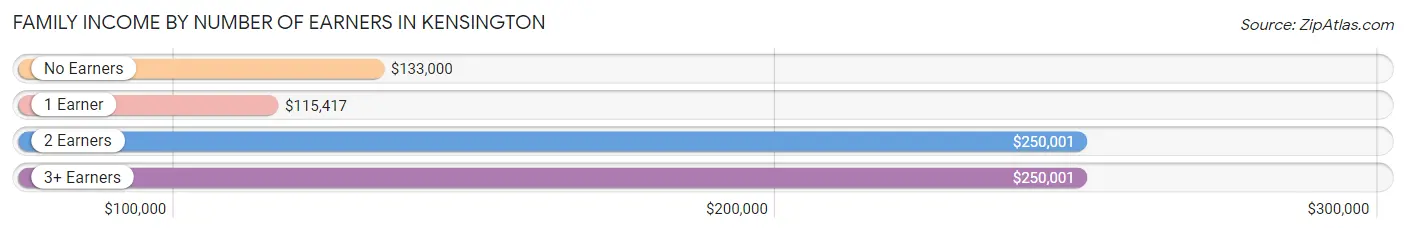
| Number of Earners | # Families | Median Income |
| No Earners | 24 (4.6%) | $133,000 |
| 1 Earner | 131 (24.9%) | $115,417 |
| 2 Earners | 326 (62.0%) | $250,001 |
| 3+ Earners | 45 (8.6%) | $250,001 |
| Total | 526 (100.0%) | $228,889 |
Household Income in Kensington
Household Income Brackets in Kensington
With 315 households falling in the category, the $200,000+ income range is the most frequent in Kensington, accounting for 38.8% of all households.
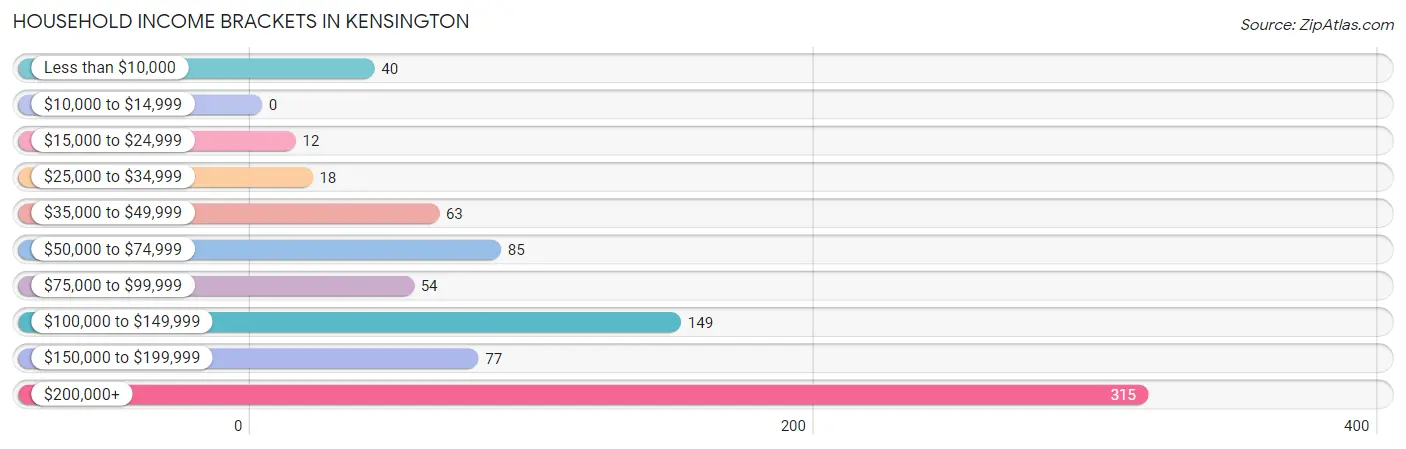
| Income Bracket | # Households | % Households |
| Less than $10,000 | 40 | 4.9% |
| $10,000 to $14,999 | 0 | 0.0% |
| $15,000 to $24,999 | 12 | 1.5% |
| $25,000 to $34,999 | 18 | 2.2% |
| $35,000 to $49,999 | 63 | 7.7% |
| $50,000 to $74,999 | 85 | 10.5% |
| $75,000 to $99,999 | 54 | 6.6% |
| $100,000 to $149,999 | 149 | 18.3% |
| $150,000 to $199,999 | 77 | 9.5% |
| $200,000+ | 315 | 38.7% |
Household Income by Householder Age in Kensington
The median household income in Kensington is $143,021, with the highest median household income of $230,833 found in the 25 to 44 years age bracket for the primary householder. A total of 254 households (31.2%) fall into this category. Meanwhile, the 15 to 24 years age bracket for the primary householder has the lowest median household income of $0, with 7 households (0.9%) in this group.
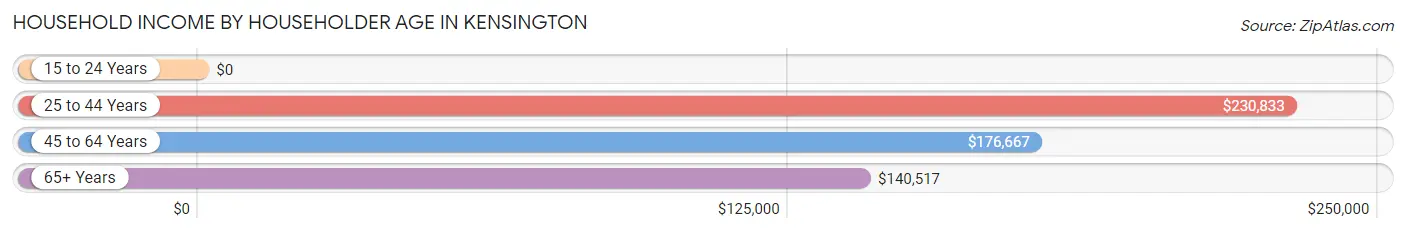
| Income Bracket | # Households | Median Income |
| 15 to 24 Years | 7 (0.9%) | $0 |
| 25 to 44 Years | 254 (31.2%) | $230,833 |
| 45 to 64 Years | 278 (34.2%) | $176,667 |
| 65+ Years | 274 (33.7%) | $140,517 |
| Total | 813 (100.0%) | $143,021 |
Poverty in Kensington
Income Below Poverty by Sex and Age in Kensington
With 6.7% poverty level for males and 4.8% for females among the residents of Kensington, 25 to 34 year old males and 18 to 24 year old females are the most vulnerable to poverty, with 26 males (28.6%) and 15 females (25.4%) in their respective age groups living below the poverty level.
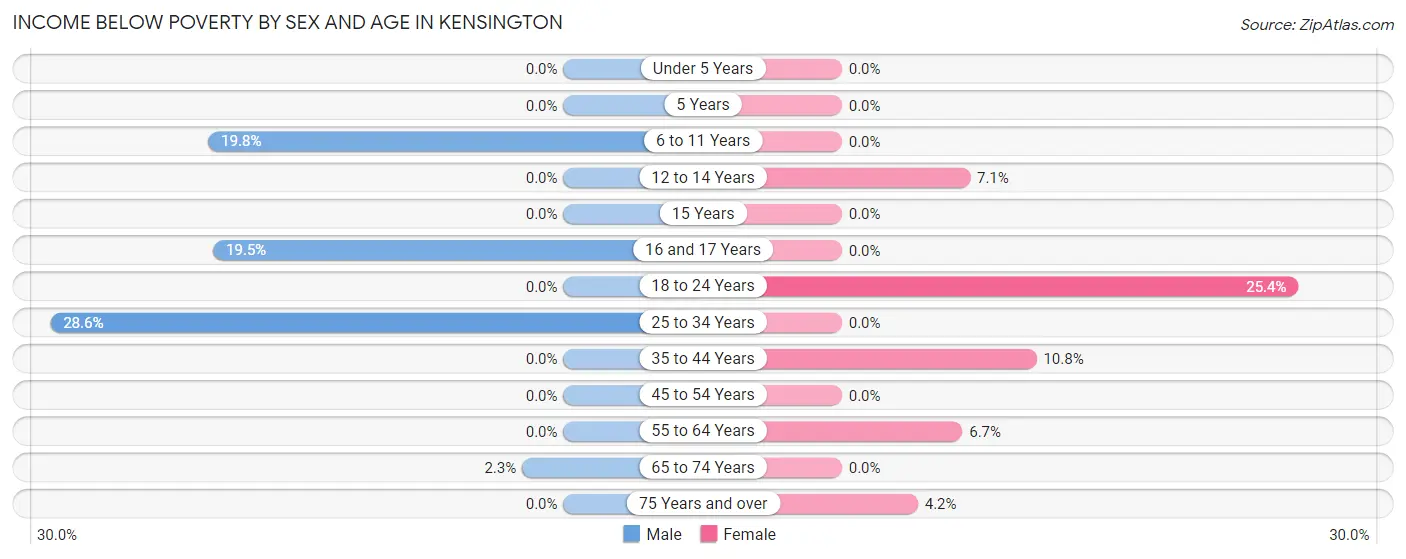
| Age Bracket | Male | Female |
| Under 5 Years | 0 (0.0%) | 0 (0.0%) |
| 5 Years | 0 (0.0%) | 0 (0.0%) |
| 6 to 11 Years | 36 (19.8%) | 0 (0.0%) |
| 12 to 14 Years | 0 (0.0%) | 3 (7.1%) |
| 15 Years | 0 (0.0%) | 0 (0.0%) |
| 16 and 17 Years | 8 (19.5%) | 0 (0.0%) |
| 18 to 24 Years | 0 (0.0%) | 15 (25.4%) |
| 25 to 34 Years | 26 (28.6%) | 0 (0.0%) |
| 35 to 44 Years | 0 (0.0%) | 22 (10.8%) |
| 45 to 54 Years | 0 (0.0%) | 0 (0.0%) |
| 55 to 64 Years | 0 (0.0%) | 11 (6.7%) |
| 65 to 74 Years | 4 (2.3%) | 0 (0.0%) |
| 75 Years and over | 0 (0.0%) | 3 (4.2%) |
| Total | 74 (6.7%) | 54 (4.8%) |
Income Above Poverty by Sex and Age in Kensington
According to the poverty statistics in Kensington, males aged under 5 years and females aged under 5 years are the age groups that are most secure financially, with 100.0% of males and 100.0% of females in these age groups living above the poverty line.
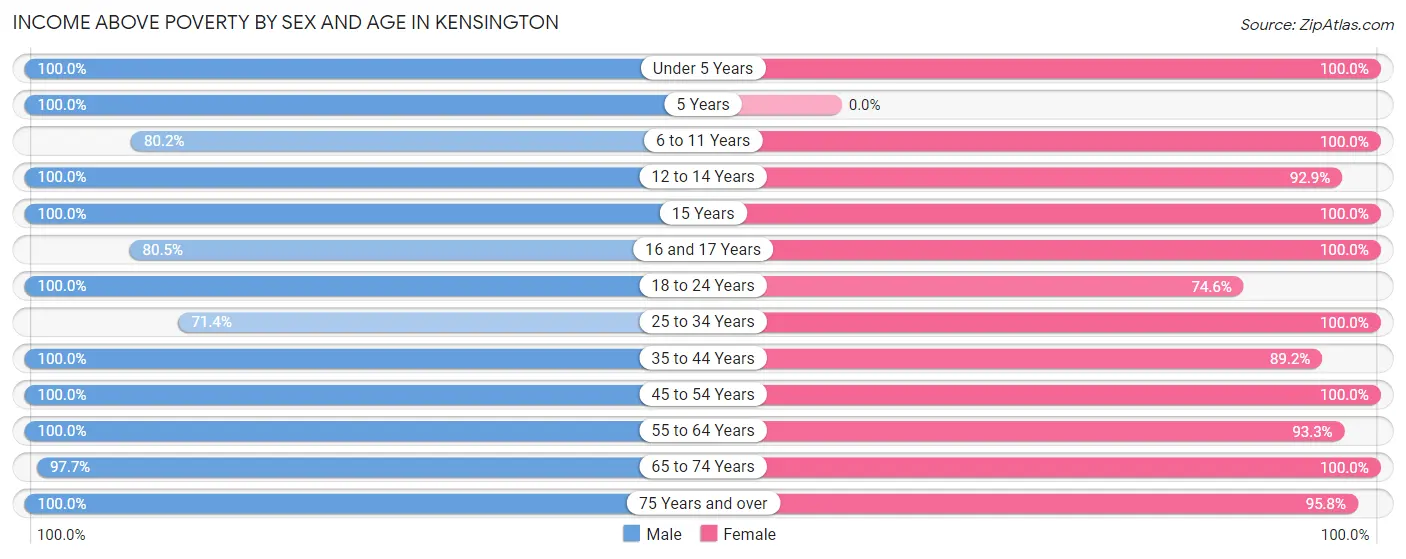
| Age Bracket | Male | Female |
| Under 5 Years | 64 (100.0%) | 141 (100.0%) |
| 5 Years | 3 (100.0%) | 0 (0.0%) |
| 6 to 11 Years | 146 (80.2%) | 101 (100.0%) |
| 12 to 14 Years | 64 (100.0%) | 39 (92.9%) |
| 15 Years | 7 (100.0%) | 51 (100.0%) |
| 16 and 17 Years | 33 (80.5%) | 30 (100.0%) |
| 18 to 24 Years | 29 (100.0%) | 44 (74.6%) |
| 25 to 34 Years | 65 (71.4%) | 51 (100.0%) |
| 35 to 44 Years | 202 (100.0%) | 181 (89.2%) |
| 45 to 54 Years | 127 (100.0%) | 143 (100.0%) |
| 55 to 64 Years | 89 (100.0%) | 153 (93.3%) |
| 65 to 74 Years | 170 (97.7%) | 81 (100.0%) |
| 75 Years and over | 31 (100.0%) | 68 (95.8%) |
| Total | 1,030 (93.3%) | 1,083 (95.3%) |
Income Below Poverty Among Married-Couple Families in Kensington
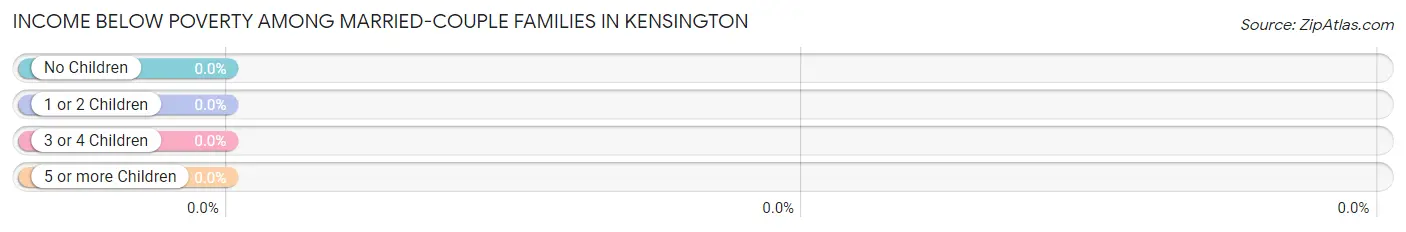
| Children | Above Poverty | Below Poverty |
| No Children | 155 (100.0%) | 0 (0.0%) |
| 1 or 2 Children | 197 (100.0%) | 0 (0.0%) |
| 3 or 4 Children | 97 (100.0%) | 0 (0.0%) |
| 5 or more Children | 0 (0.0%) | 0 (0.0%) |
| Total | 449 (100.0%) | 0 (0.0%) |
Income Below Poverty Among Single-Parent Households in Kensington
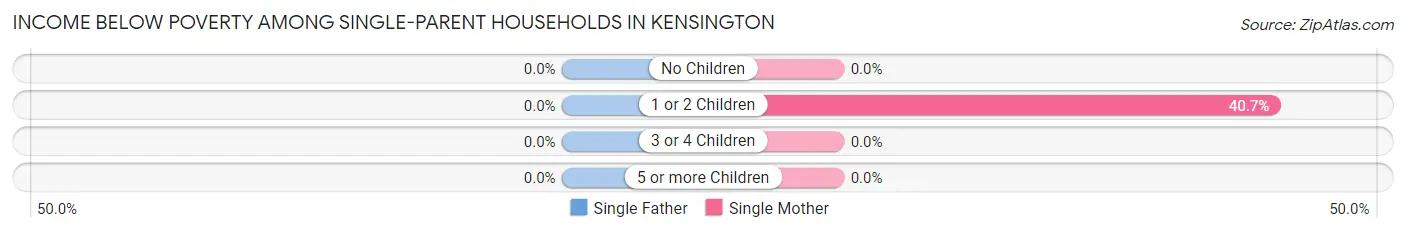
| Children | Single Father | Single Mother |
| No Children | 0 (0.0%) | 0 (0.0%) |
| 1 or 2 Children | 0 (0.0%) | 22 (40.7%) |
| 3 or 4 Children | 0 (0.0%) | 0 (0.0%) |
| 5 or more Children | 0 (0.0%) | 0 (0.0%) |
| Total | 0 (0.0%) | 22 (34.4%) |
Income Below Poverty Among Married-Couple vs Single-Parent Households in Kensington
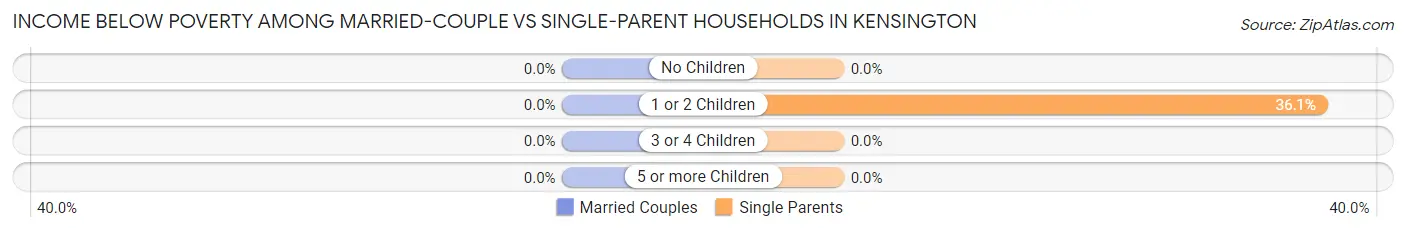
| Children | Married-Couple Families | Single-Parent Households |
| No Children | 0 (0.0%) | 0 (0.0%) |
| 1 or 2 Children | 0 (0.0%) | 22 (36.1%) |
| 3 or 4 Children | 0 (0.0%) | 0 (0.0%) |
| 5 or more Children | 0 (0.0%) | 0 (0.0%) |
| Total | 0 (0.0%) | 22 (28.6%) |
Employment Characteristics in Kensington
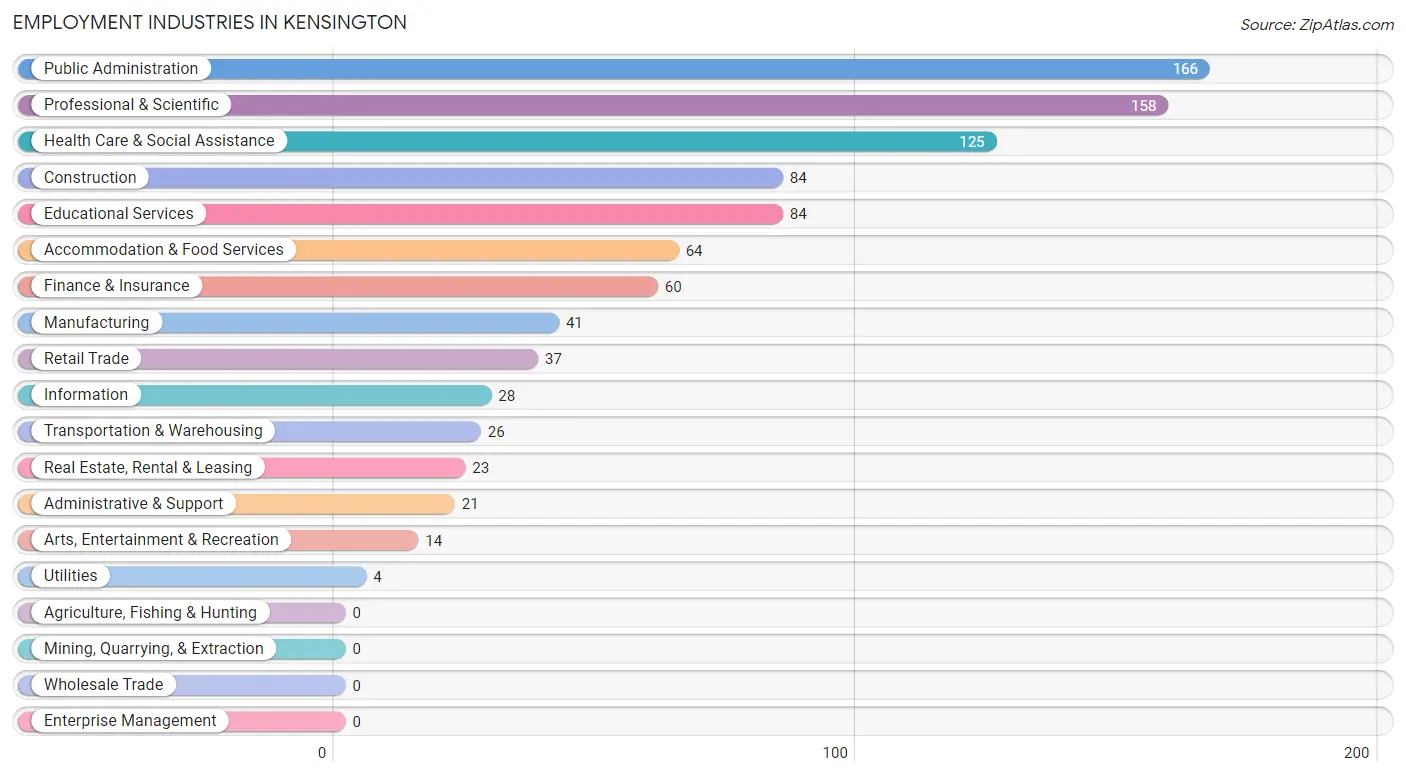
Employment by Class of Employer in Kensington
Among the 1,042 employed individuals in Kensington, private company employees (525 | 50.4%), federal government employees (165 | 15.8%), and not-for-profit organizations (157 | 15.1%) make up the most common classes of employment.
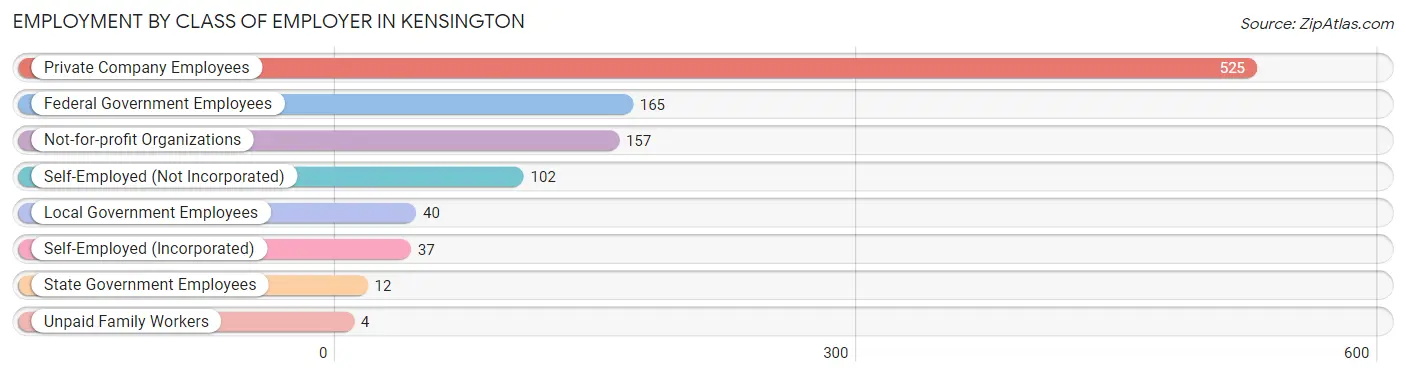
| Employer Class | # Employees | % Employees |
| Private Company Employees | 525 | 50.4% |
| Self-Employed (Incorporated) | 37 | 3.5% |
| Self-Employed (Not Incorporated) | 102 | 9.8% |
| Not-for-profit Organizations | 157 | 15.1% |
| Local Government Employees | 40 | 3.8% |
| State Government Employees | 12 | 1.1% |
| Federal Government Employees | 165 | 15.8% |
| Unpaid Family Workers | 4 | 0.4% |
| Total | 1,042 | 100.0% |
Employment Status by Age in Kensington
According to the labor force statistics for Kensington, out of the total population over 16 years of age (1,586), 70.3% or 1,115 individuals are in the labor force, with 5.8% or 65 of them unemployed. The age group with the highest labor force participation rate is 45 to 54 years, with 97.0% or 262 individuals in the labor force. Within the labor force, the 20 to 24 years age range has the highest percentage of unemployed individuals, with 39.3% or 22 of them being unemployed.
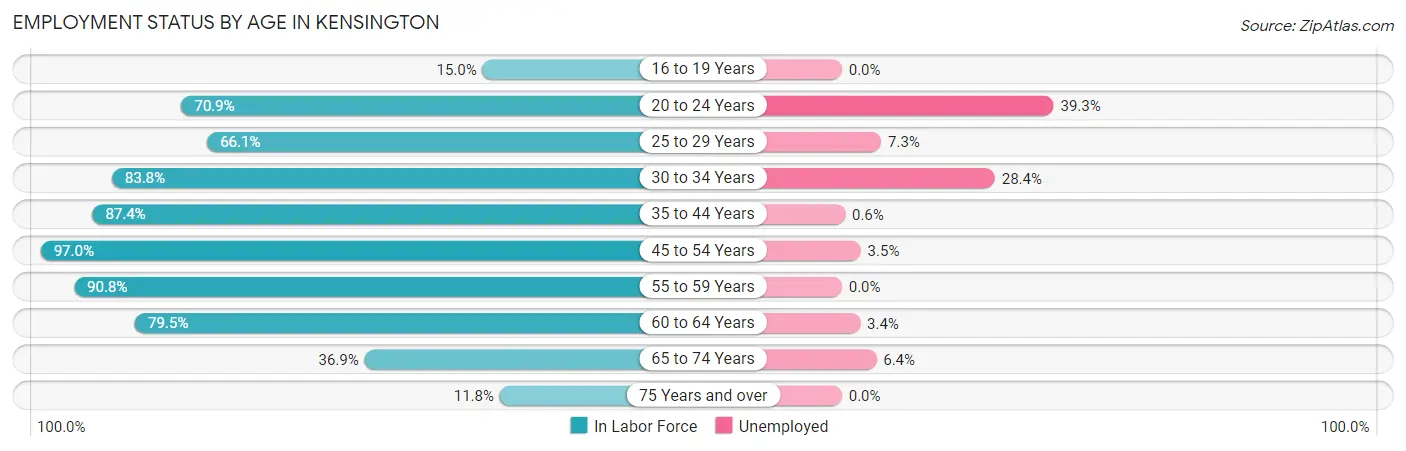
| Age Bracket | In Labor Force | Unemployed |
| 16 to 19 Years | 12 (15.0%) | 0 (0.0%) |
| 20 to 24 Years | 56 (70.9%) | 22 (39.3%) |
| 25 to 29 Years | 41 (66.1%) | 3 (7.3%) |
| 30 to 34 Years | 67 (83.8%) | 19 (28.4%) |
| 35 to 44 Years | 354 (87.4%) | 2 (0.6%) |
| 45 to 54 Years | 262 (97.0%) | 9 (3.5%) |
| 55 to 59 Years | 128 (90.8%) | 0 (0.0%) |
| 60 to 64 Years | 89 (79.5%) | 3 (3.4%) |
| 65 to 74 Years | 94 (36.9%) | 6 (6.4%) |
| 75 Years and over | 12 (11.8%) | 0 (0.0%) |
| Total | 1,115 (70.3%) | 65 (5.8%) |
Employment Status by Educational Attainment in Kensington
According to labor force statistics for Kensington, 87.9% of individuals (941) out of the total population between 25 and 64 years of age (1,070) are in the labor force, with 3.8% or 36 of them being unemployed. The group with the highest labor force participation rate are those with the educational attainment of bachelor's degree or higher, with 93.0% or 809 individuals in the labor force. Within the labor force, individuals with college / associate degree education have the highest percentage of unemployment, with 9.2% or 7 of them being unemployed.
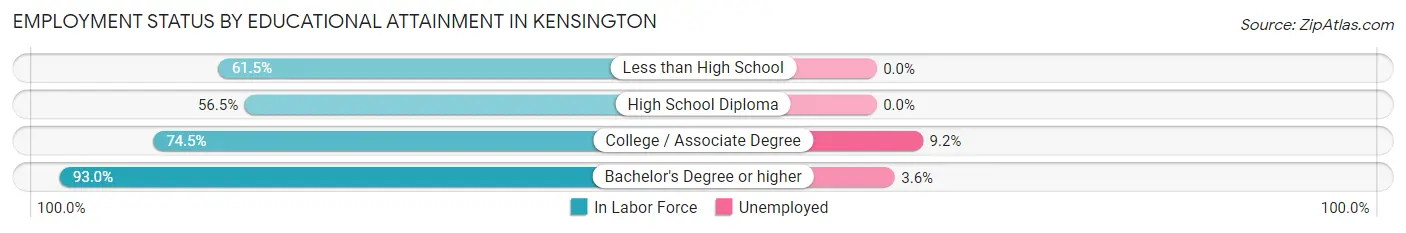
| Educational Attainment | In Labor Force | Unemployed |
| Less than High School | 8 (61.5%) | 0 (0.0%) |
| High School Diploma | 48 (56.5%) | 0 (0.0%) |
| College / Associate Degree | 76 (74.5%) | 9 (9.2%) |
| Bachelor's Degree or higher | 809 (93.0%) | 31 (3.6%) |
| Total | 941 (87.9%) | 41 (3.8%) |
Employment Occupations by Sex in Kensington
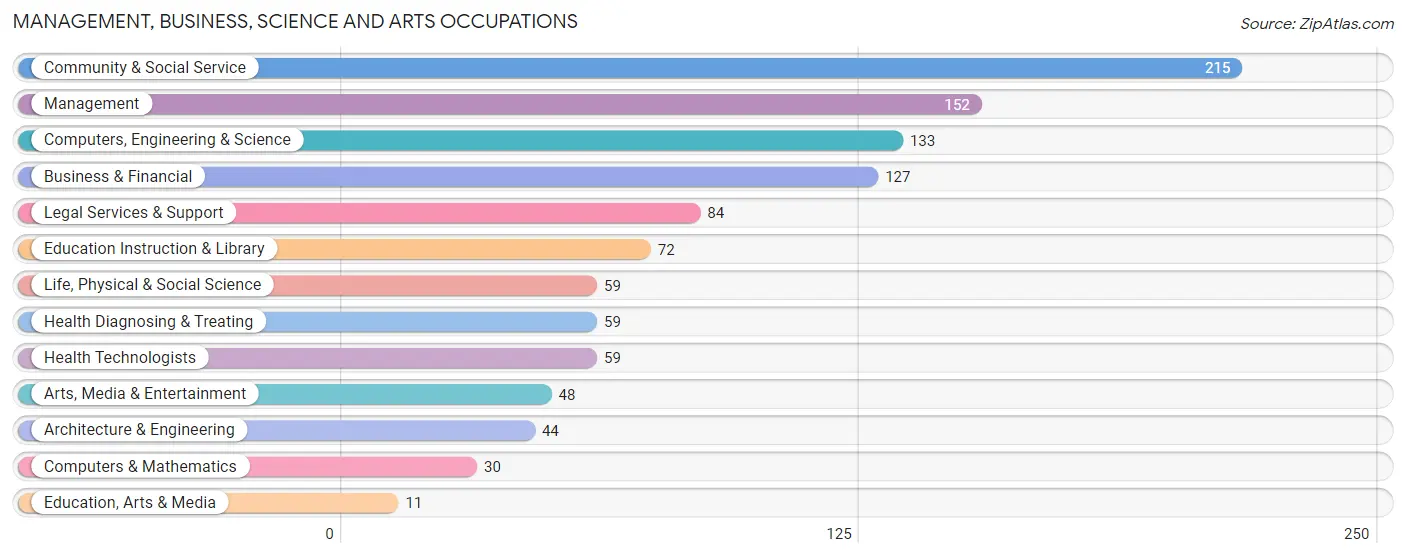
Management, Business, Science and Arts Occupations
The most common Management, Business, Science and Arts occupations in Kensington are Community & Social Service (215 | 20.5%), Management (152 | 14.5%), Computers, Engineering & Science (133 | 12.7%), Business & Financial (127 | 12.1%), and Legal Services & Support (84 | 8.0%).
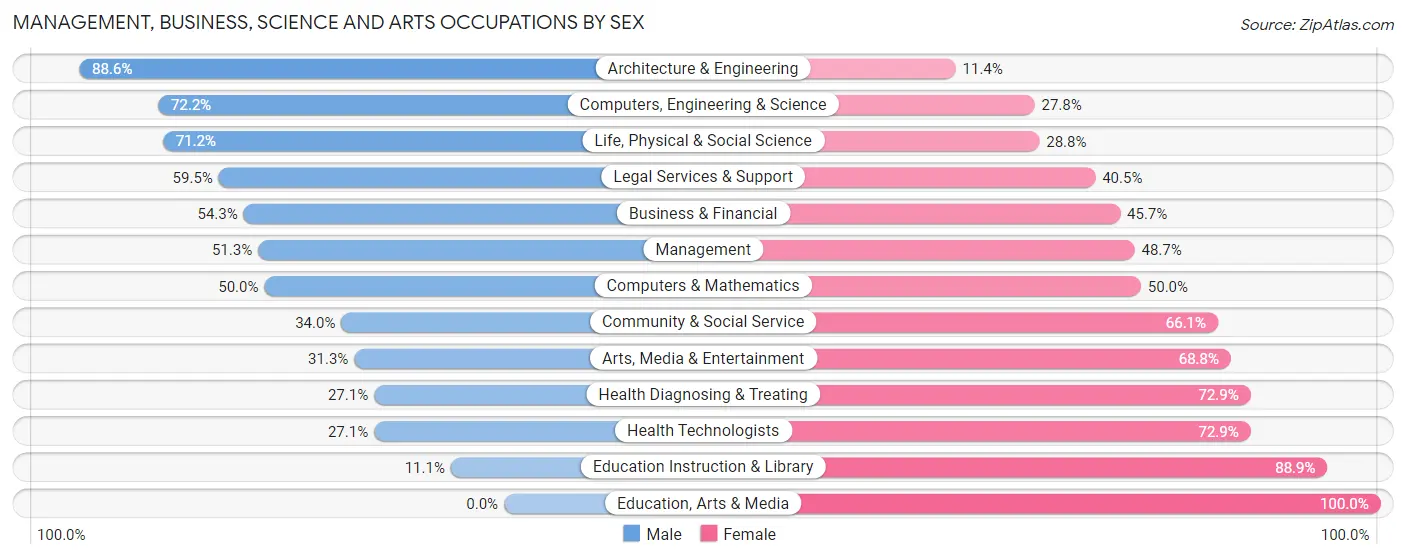
Management, Business, Science and Arts Occupations by Sex
Within the Management, Business, Science and Arts occupations in Kensington, the most male-oriented occupations are Architecture & Engineering (88.6%), Computers, Engineering & Science (72.2%), and Life, Physical & Social Science (71.2%), while the most female-oriented occupations are Education, Arts & Media (100.0%), Education Instruction & Library (88.9%), and Health Diagnosing & Treating (72.9%).
| Occupation | Male | Female |
| Management | 78 (51.3%) | 74 (48.7%) |
| Business & Financial | 69 (54.3%) | 58 (45.7%) |
| Computers, Engineering & Science | 96 (72.2%) | 37 (27.8%) |
| Computers & Mathematics | 15 (50.0%) | 15 (50.0%) |
| Architecture & Engineering | 39 (88.6%) | 5 (11.4%) |
| Life, Physical & Social Science | 42 (71.2%) | 17 (28.8%) |
| Community & Social Service | 73 (34.0%) | 142 (66.0%) |
| Education, Arts & Media | 0 (0.0%) | 11 (100.0%) |
| Legal Services & Support | 50 (59.5%) | 34 (40.5%) |
| Education Instruction & Library | 8 (11.1%) | 64 (88.9%) |
| Arts, Media & Entertainment | 15 (31.2%) | 33 (68.8%) |
| Health Diagnosing & Treating | 16 (27.1%) | 43 (72.9%) |
| Health Technologists | 16 (27.1%) | 43 (72.9%) |
| Total (Category) | 332 (48.4%) | 354 (51.6%) |
| Total (Overall) | 517 (49.4%) | 529 (50.6%) |
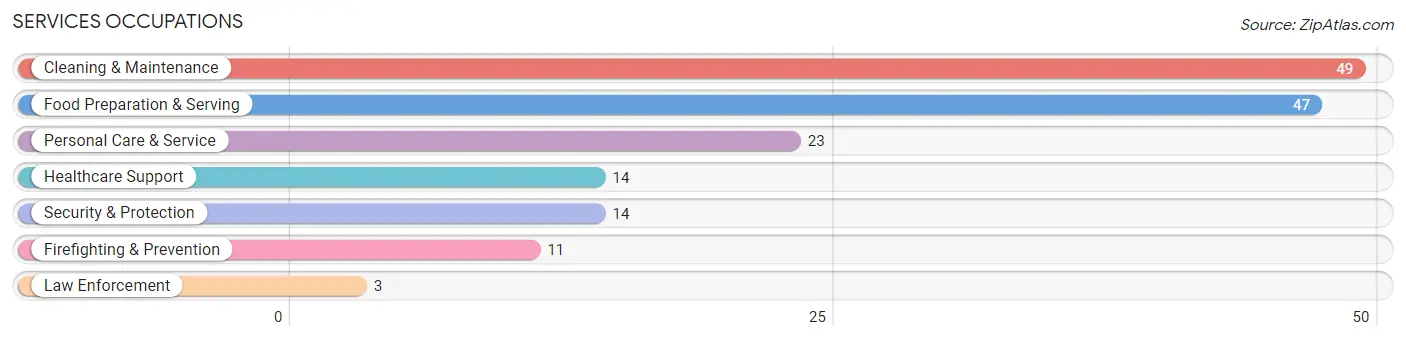
Services Occupations
The most common Services occupations in Kensington are Cleaning & Maintenance (49 | 4.7%), Food Preparation & Serving (47 | 4.5%), Personal Care & Service (23 | 2.2%), Healthcare Support (14 | 1.3%), and Security & Protection (14 | 1.3%).
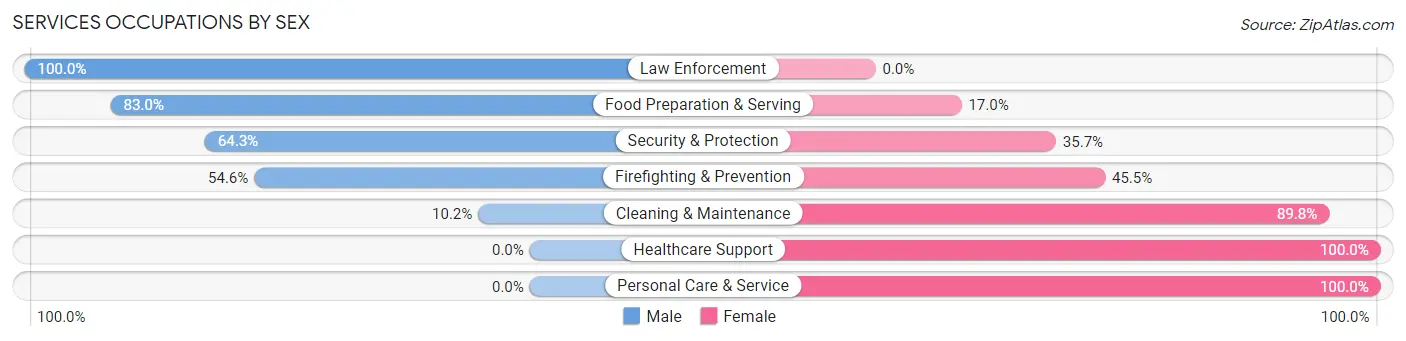
Services Occupations by Sex
Within the Services occupations in Kensington, the most male-oriented occupations are Law Enforcement (100.0%), Food Preparation & Serving (83.0%), and Security & Protection (64.3%), while the most female-oriented occupations are Healthcare Support (100.0%), Personal Care & Service (100.0%), and Cleaning & Maintenance (89.8%).
| Occupation | Male | Female |
| Healthcare Support | 0 (0.0%) | 14 (100.0%) |
| Security & Protection | 9 (64.3%) | 5 (35.7%) |
| Firefighting & Prevention | 6 (54.5%) | 5 (45.5%) |
| Law Enforcement | 3 (100.0%) | 0 (0.0%) |
| Food Preparation & Serving | 39 (83.0%) | 8 (17.0%) |
| Cleaning & Maintenance | 5 (10.2%) | 44 (89.8%) |
| Personal Care & Service | 0 (0.0%) | 23 (100.0%) |
| Total (Category) | 53 (36.0%) | 94 (63.9%) |
| Total (Overall) | 517 (49.4%) | 529 (50.6%) |
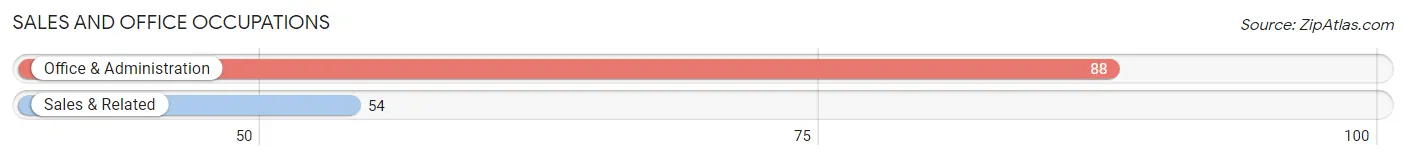
Sales and Office Occupations
The most common Sales and Office occupations in Kensington are Office & Administration (88 | 8.4%), and Sales & Related (54 | 5.2%).
Sales and Office Occupations by Sex
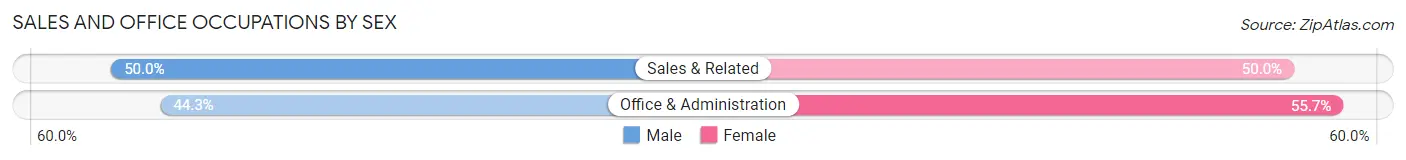
| Occupation | Male | Female |
| Sales & Related | 27 (50.0%) | 27 (50.0%) |
| Office & Administration | 39 (44.3%) | 49 (55.7%) |
| Total (Category) | 66 (46.5%) | 76 (53.5%) |
| Total (Overall) | 517 (49.4%) | 529 (50.6%) |
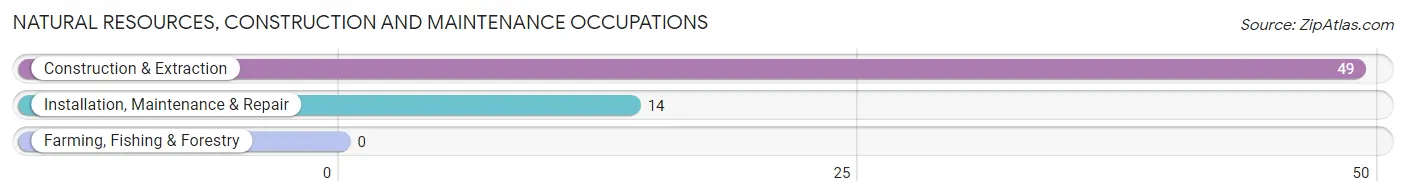
Natural Resources, Construction and Maintenance Occupations
The most common Natural Resources, Construction and Maintenance occupations in Kensington are Construction & Extraction (49 | 4.7%), and Installation, Maintenance & Repair (14 | 1.3%).
Natural Resources, Construction and Maintenance Occupations by Sex
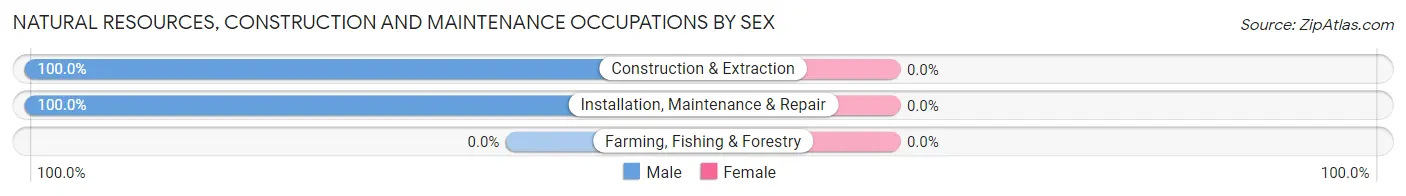
| Occupation | Male | Female |
| Farming, Fishing & Forestry | 0 (0.0%) | 0 (0.0%) |
| Construction & Extraction | 49 (100.0%) | 0 (0.0%) |
| Installation, Maintenance & Repair | 14 (100.0%) | 0 (0.0%) |
| Total (Category) | 63 (100.0%) | 0 (0.0%) |
| Total (Overall) | 517 (49.4%) | 529 (50.6%) |
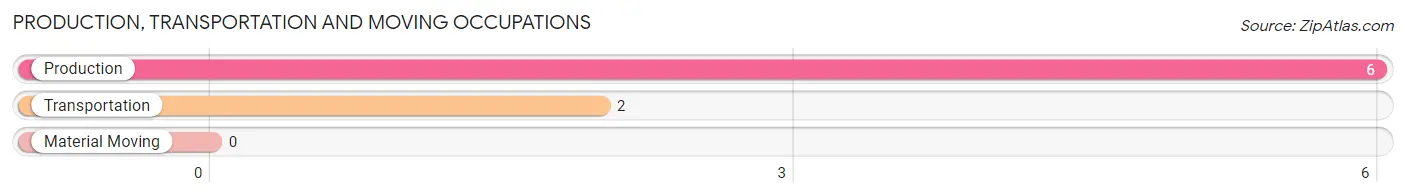
Production, Transportation and Moving Occupations
The most common Production, Transportation and Moving occupations in Kensington are Production (6 | 0.6%), and Transportation (2 | 0.2%).
Production, Transportation and Moving Occupations by Sex
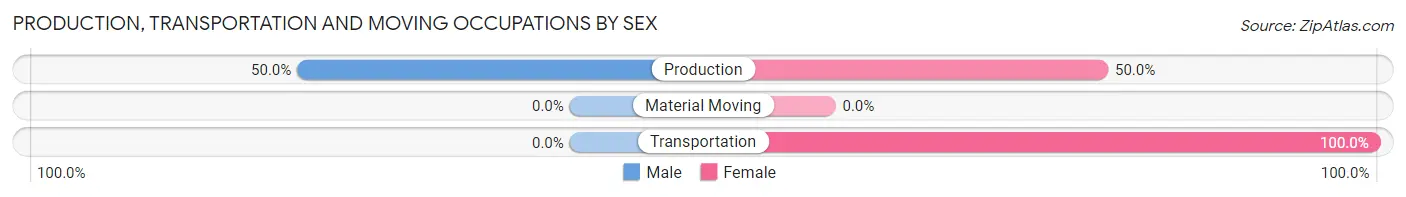
| Occupation | Male | Female |
| Production | 3 (50.0%) | 3 (50.0%) |
| Transportation | 0 (0.0%) | 2 (100.0%) |
| Material Moving | 0 (0.0%) | 0 (0.0%) |
| Total (Category) | 3 (37.5%) | 5 (62.5%) |
| Total (Overall) | 517 (49.4%) | 529 (50.6%) |
Employment Industries by Sex in Kensington
Employment Industries in Kensington
The major employment industries in Kensington include Public Administration (166 | 15.9%), Professional & Scientific (158 | 15.1%), Health Care & Social Assistance (125 | 11.9%), Construction (84 | 8.0%), and Educational Services (84 | 8.0%).
Employment Industries by Sex in Kensington
The Kensington industries that see more men than women are Transportation & Warehousing (100.0%), Construction (95.2%), and Real Estate, Rental & Leasing (87.0%), whereas the industries that tend to have a higher number of women are Utilities (100.0%), Educational Services (94.1%), and Health Care & Social Assistance (84.8%).
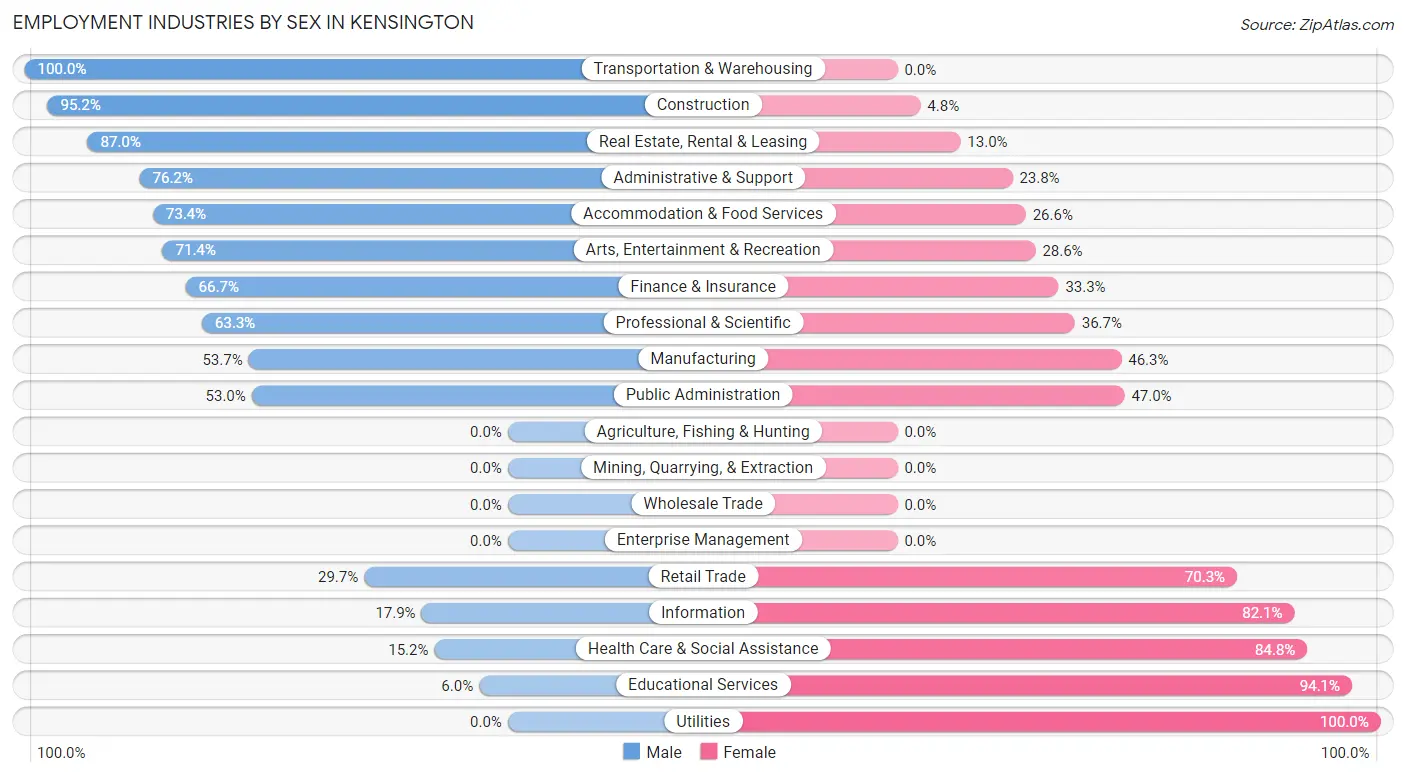
| Industry | Male | Female |
| Agriculture, Fishing & Hunting | 0 (0.0%) | 0 (0.0%) |
| Mining, Quarrying, & Extraction | 0 (0.0%) | 0 (0.0%) |
| Construction | 80 (95.2%) | 4 (4.8%) |
| Manufacturing | 22 (53.7%) | 19 (46.3%) |
| Wholesale Trade | 0 (0.0%) | 0 (0.0%) |
| Retail Trade | 11 (29.7%) | 26 (70.3%) |
| Transportation & Warehousing | 26 (100.0%) | 0 (0.0%) |
| Utilities | 0 (0.0%) | 4 (100.0%) |
| Information | 5 (17.9%) | 23 (82.1%) |
| Finance & Insurance | 40 (66.7%) | 20 (33.3%) |
| Real Estate, Rental & Leasing | 20 (87.0%) | 3 (13.0%) |
| Professional & Scientific | 100 (63.3%) | 58 (36.7%) |
| Enterprise Management | 0 (0.0%) | 0 (0.0%) |
| Administrative & Support | 16 (76.2%) | 5 (23.8%) |
| Educational Services | 5 (5.9%) | 79 (94.1%) |
| Health Care & Social Assistance | 19 (15.2%) | 106 (84.8%) |
| Arts, Entertainment & Recreation | 10 (71.4%) | 4 (28.6%) |
| Accommodation & Food Services | 47 (73.4%) | 17 (26.6%) |
| Public Administration | 88 (53.0%) | 78 (47.0%) |
| Total | 517 (49.4%) | 529 (50.6%) |
Education in Kensington
School Enrollment in Kensington
The most common levels of schooling among the 716 students in Kensington are elementary school (236 | 33.0%), high school (130 | 18.2%), and middle school (120 | 16.8%).
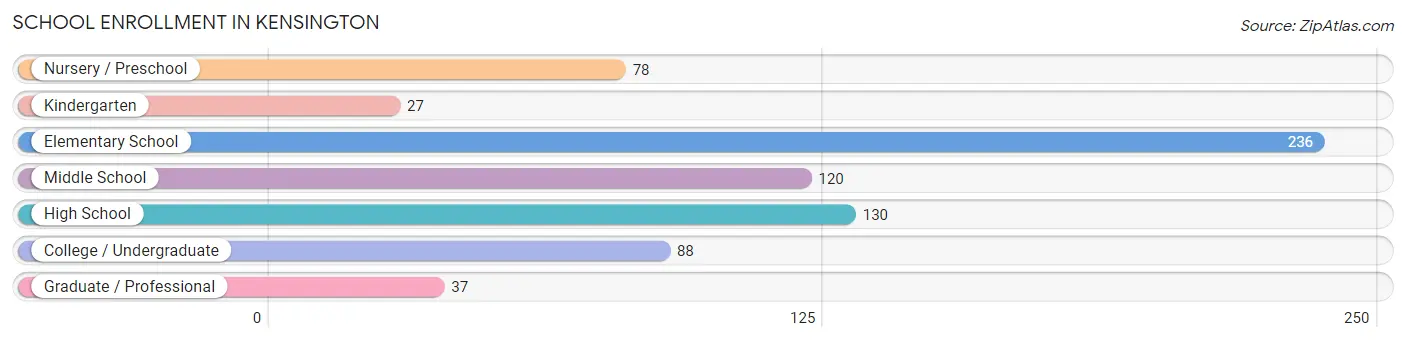
| School Level | # Students | % Students |
| Nursery / Preschool | 78 | 10.9% |
| Kindergarten | 27 | 3.8% |
| Elementary School | 236 | 33.0% |
| Middle School | 120 | 16.8% |
| High School | 130 | 18.2% |
| College / Undergraduate | 88 | 12.3% |
| Graduate / Professional | 37 | 5.2% |
| Total | 716 | 100.0% |
School Enrollment by Age by Funding Source in Kensington
Out of a total of 716 students who are enrolled in schools in Kensington, 315 (44.0%) attend a private institution, while the remaining 401 (56.0%) are enrolled in public schools. The age group of 3 to 4 year olds has the highest likelihood of being enrolled in private schools, with 69 (92.0% in the age bracket) enrolled. Conversely, the age group of 18 to 19 year olds has the lowest likelihood of being enrolled in a private school, with 5 (100.0% in the age bracket) attending a public institution.
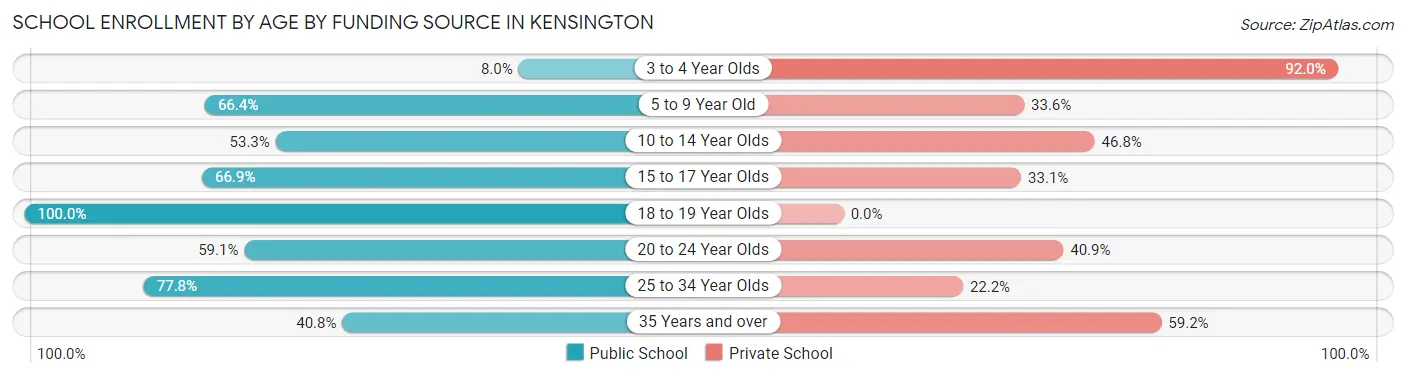
| Age Bracket | Public School | Private School |
| 3 to 4 Year Olds | 6 (8.0%) | 69 (92.0%) |
| 5 to 9 Year Old | 158 (66.4%) | 80 (33.6%) |
| 10 to 14 Year Olds | 82 (53.2%) | 72 (46.8%) |
| 15 to 17 Year Olds | 83 (66.9%) | 41 (33.1%) |
| 18 to 19 Year Olds | 5 (100.0%) | 0 (0.0%) |
| 20 to 24 Year Olds | 26 (59.1%) | 18 (40.9%) |
| 25 to 34 Year Olds | 21 (77.8%) | 6 (22.2%) |
| 35 Years and over | 20 (40.8%) | 29 (59.2%) |
| Total | 401 (56.0%) | 315 (44.0%) |
Educational Attainment by Field of Study in Kensington
Social sciences (209 | 17.0%), business (174 | 14.1%), literature & languages (155 | 12.6%), science & technology (135 | 11.0%), and engineering (85 | 6.9%) are the most common fields of study among 1,231 individuals in Kensington who have obtained a bachelor's degree or higher.
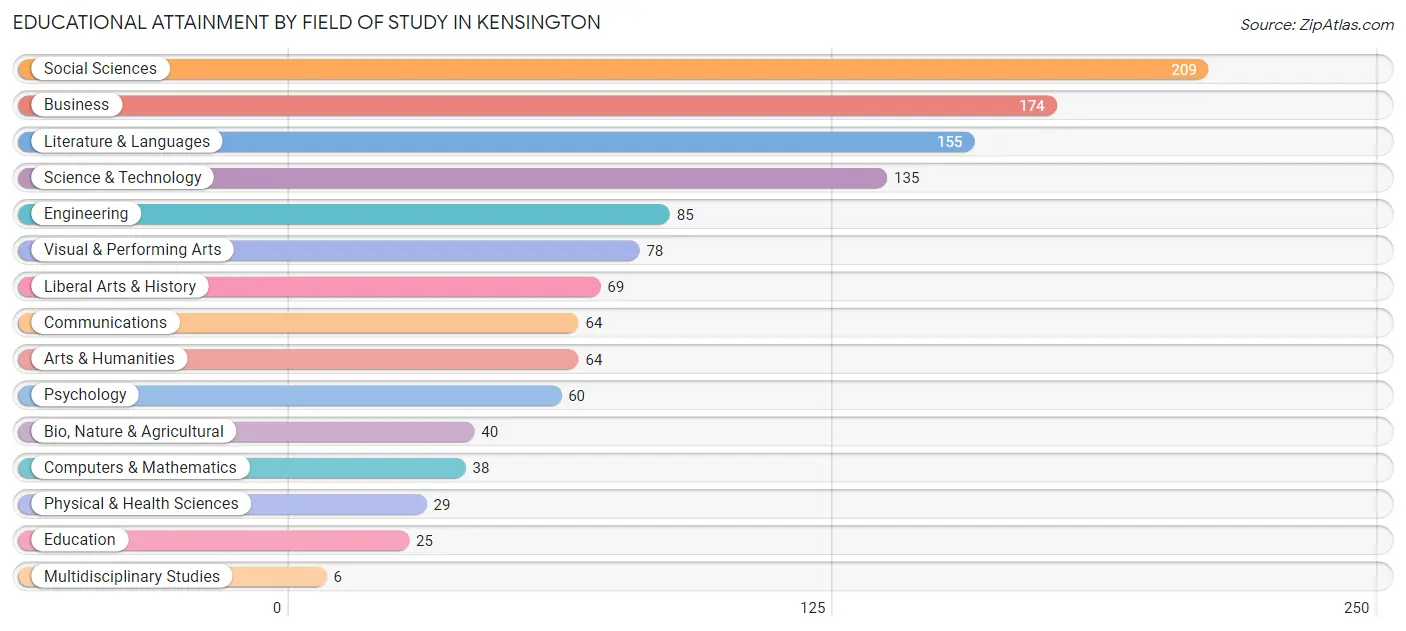
| Field of Study | # Graduates | % Graduates |
| Computers & Mathematics | 38 | 3.1% |
| Bio, Nature & Agricultural | 40 | 3.3% |
| Physical & Health Sciences | 29 | 2.4% |
| Psychology | 60 | 4.9% |
| Social Sciences | 209 | 17.0% |
| Engineering | 85 | 6.9% |
| Multidisciplinary Studies | 6 | 0.5% |
| Science & Technology | 135 | 11.0% |
| Business | 174 | 14.1% |
| Education | 25 | 2.0% |
| Literature & Languages | 155 | 12.6% |
| Liberal Arts & History | 69 | 5.6% |
| Visual & Performing Arts | 78 | 6.3% |
| Communications | 64 | 5.2% |
| Arts & Humanities | 64 | 5.2% |
| Total | 1,231 | 100.0% |
Transportation & Commute in Kensington
Vehicle Availability by Sex in Kensington
The most prevalent vehicle ownership categories in Kensington are males with 2 vehicles (293, accounting for 56.7%) and females with 2 vehicles (318, making up 55.8%).
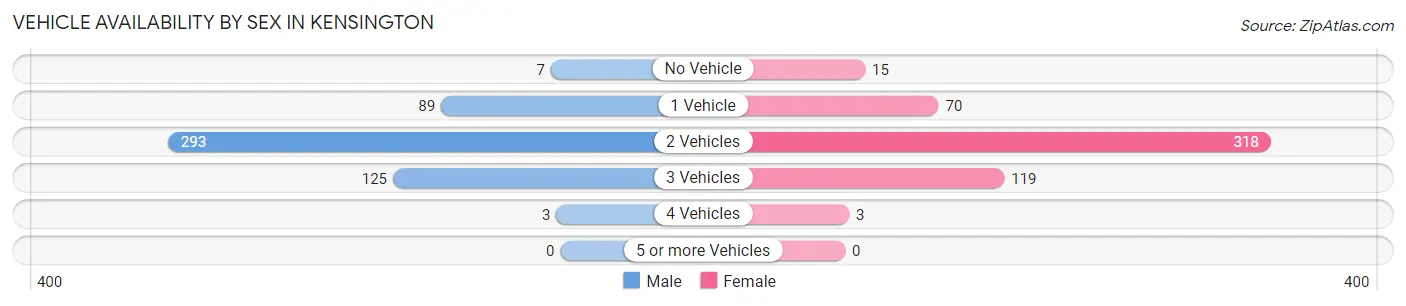
| Vehicles Available | Male | Female |
| No Vehicle | 7 (1.3%) | 15 (2.9%) |
| 1 Vehicle | 89 (17.2%) | 70 (13.3%) |
| 2 Vehicles | 293 (56.7%) | 318 (60.6%) |
| 3 Vehicles | 125 (24.2%) | 119 (22.7%) |
| 4 Vehicles | 3 (0.6%) | 3 (0.6%) |
| 5 or more Vehicles | 0 (0.0%) | 0 (0.0%) |
| Total | 517 (100.0%) | 525 (100.0%) |
Commute Time in Kensington
The most frequently occuring commute durations in Kensington are 60 to 89 minutes (122 commuters, 15.3%), 45 to 59 minutes (120 commuters, 15.0%), and 20 to 24 minutes (118 commuters, 14.8%).
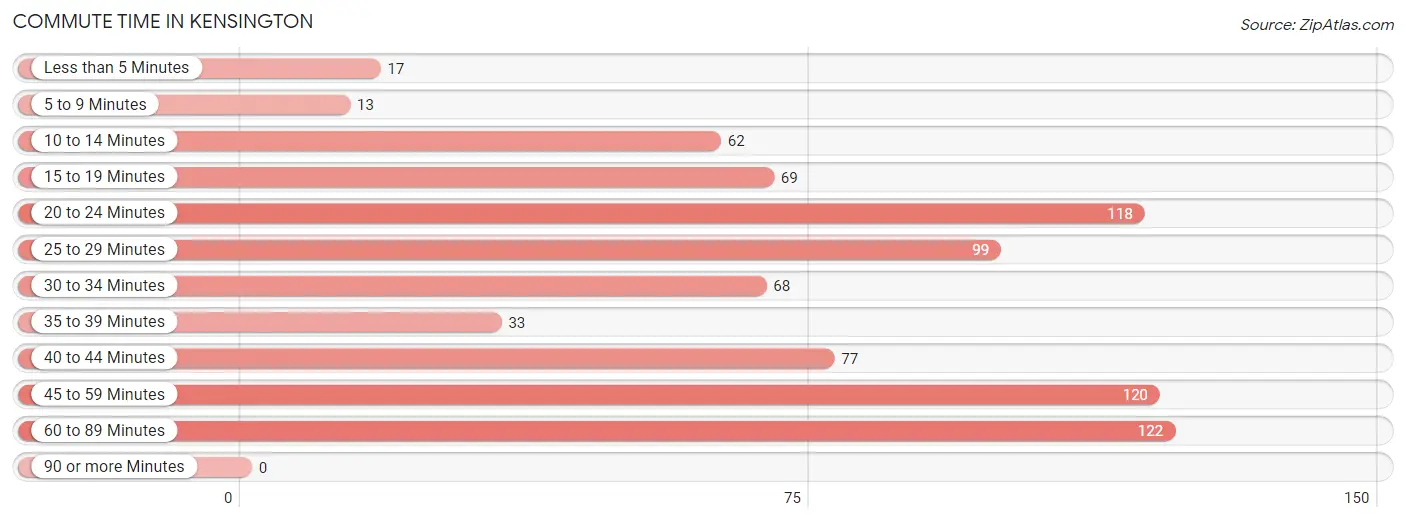
| Commute Time | # Commuters | % Commuters |
| Less than 5 Minutes | 17 | 2.1% |
| 5 to 9 Minutes | 13 | 1.6% |
| 10 to 14 Minutes | 62 | 7.8% |
| 15 to 19 Minutes | 69 | 8.6% |
| 20 to 24 Minutes | 118 | 14.8% |
| 25 to 29 Minutes | 99 | 12.4% |
| 30 to 34 Minutes | 68 | 8.5% |
| 35 to 39 Minutes | 33 | 4.1% |
| 40 to 44 Minutes | 77 | 9.7% |
| 45 to 59 Minutes | 120 | 15.0% |
| 60 to 89 Minutes | 122 | 15.3% |
| 90 or more Minutes | 0 | 0.0% |
Commute Time by Sex in Kensington
The most common commute times in Kensington are 45 to 59 minutes (72 commuters, 17.6%) for males and 20 to 24 minutes (70 commuters, 18.0%) for females.
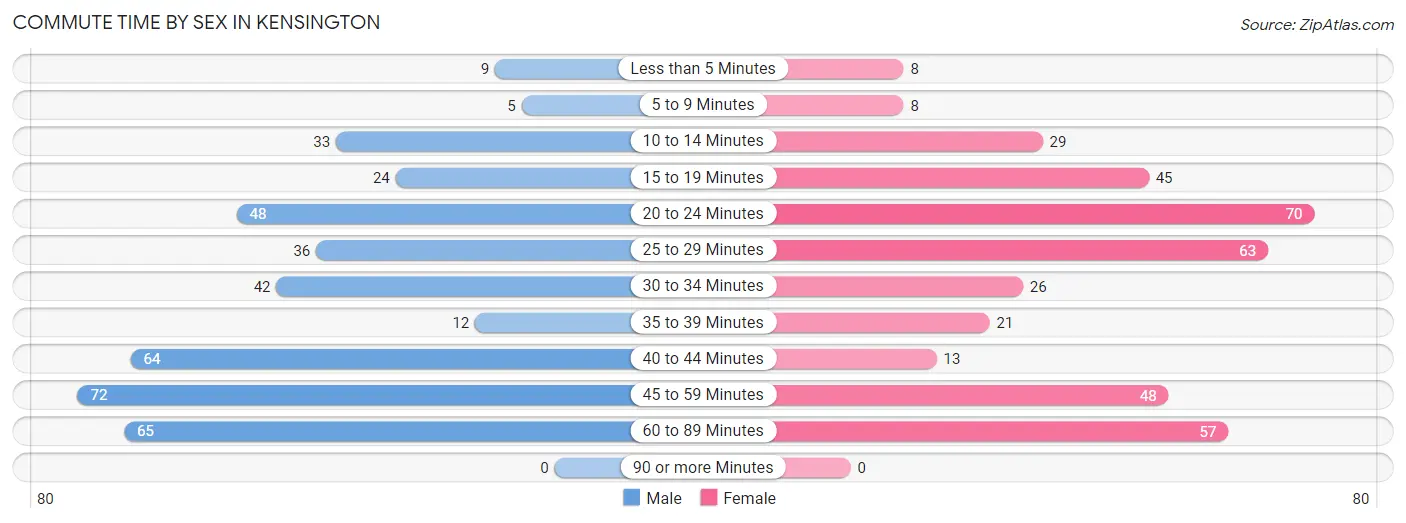
| Commute Time | Male | Female |
| Less than 5 Minutes | 9 (2.2%) | 8 (2.1%) |
| 5 to 9 Minutes | 5 (1.2%) | 8 (2.1%) |
| 10 to 14 Minutes | 33 (8.1%) | 29 (7.5%) |
| 15 to 19 Minutes | 24 (5.9%) | 45 (11.6%) |
| 20 to 24 Minutes | 48 (11.7%) | 70 (18.0%) |
| 25 to 29 Minutes | 36 (8.8%) | 63 (16.2%) |
| 30 to 34 Minutes | 42 (10.2%) | 26 (6.7%) |
| 35 to 39 Minutes | 12 (2.9%) | 21 (5.4%) |
| 40 to 44 Minutes | 64 (15.6%) | 13 (3.4%) |
| 45 to 59 Minutes | 72 (17.6%) | 48 (12.4%) |
| 60 to 89 Minutes | 65 (15.9%) | 57 (14.7%) |
| 90 or more Minutes | 0 (0.0%) | 0 (0.0%) |
Time of Departure to Work by Sex in Kensington
The most frequent times of departure to work in Kensington are 8:00 AM to 8:29 AM (113, 27.6%) for males and 7:00 AM to 7:29 AM (96, 24.7%) for females.
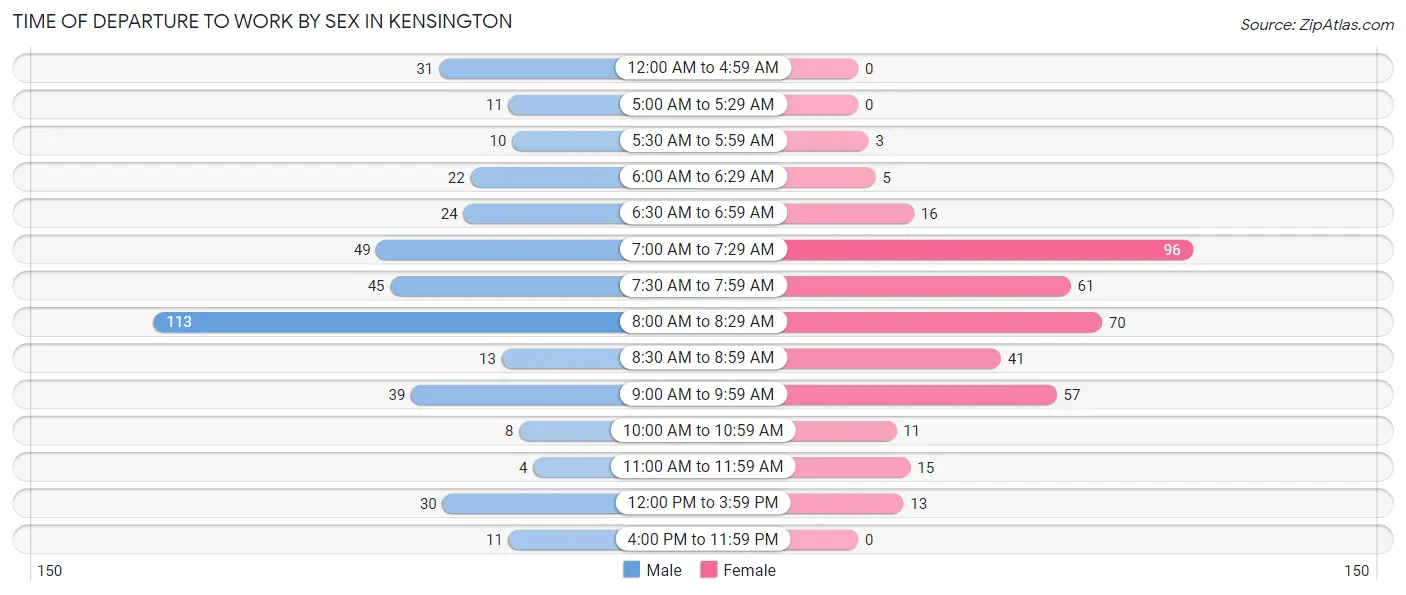
| Time of Departure | Male | Female |
| 12:00 AM to 4:59 AM | 31 (7.6%) | 0 (0.0%) |
| 5:00 AM to 5:29 AM | 11 (2.7%) | 0 (0.0%) |
| 5:30 AM to 5:59 AM | 10 (2.4%) | 3 (0.8%) |
| 6:00 AM to 6:29 AM | 22 (5.4%) | 5 (1.3%) |
| 6:30 AM to 6:59 AM | 24 (5.9%) | 16 (4.1%) |
| 7:00 AM to 7:29 AM | 49 (11.9%) | 96 (24.7%) |
| 7:30 AM to 7:59 AM | 45 (11.0%) | 61 (15.7%) |
| 8:00 AM to 8:29 AM | 113 (27.6%) | 70 (18.0%) |
| 8:30 AM to 8:59 AM | 13 (3.2%) | 41 (10.6%) |
| 9:00 AM to 9:59 AM | 39 (9.5%) | 57 (14.7%) |
| 10:00 AM to 10:59 AM | 8 (1.9%) | 11 (2.8%) |
| 11:00 AM to 11:59 AM | 4 (1.0%) | 15 (3.9%) |
| 12:00 PM to 3:59 PM | 30 (7.3%) | 13 (3.4%) |
| 4:00 PM to 11:59 PM | 11 (2.7%) | 0 (0.0%) |
| Total | 410 (100.0%) | 388 (100.0%) |
Housing Occupancy in Kensington
Occupancy by Ownership in Kensington
Of the total 813 dwellings in Kensington, owner-occupied units account for 470 (57.8%), while renter-occupied units make up 343 (42.2%).
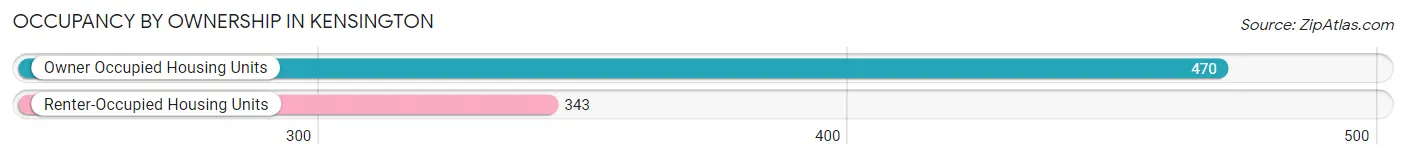
| Occupancy | # Housing Units | % Housing Units |
| Owner Occupied Housing Units | 470 | 57.8% |
| Renter-Occupied Housing Units | 343 | 42.2% |
| Total Occupied Housing Units | 813 | 100.0% |
Occupancy by Household Size in Kensington
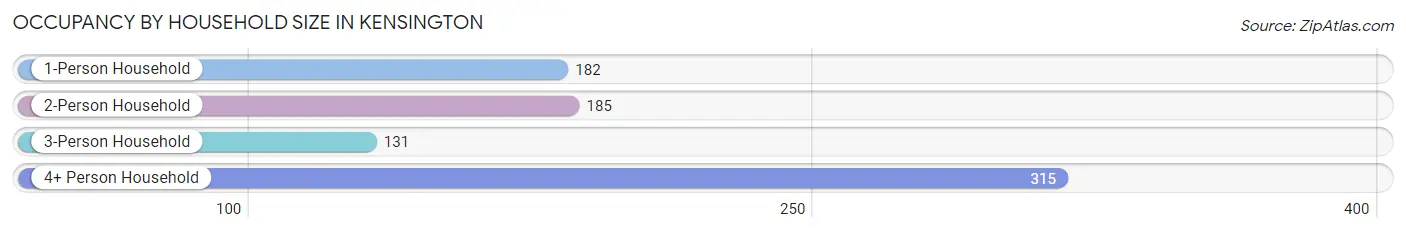
| Household Size | # Housing Units | % Housing Units |
| 1-Person Household | 182 | 22.4% |
| 2-Person Household | 185 | 22.8% |
| 3-Person Household | 131 | 16.1% |
| 4+ Person Household | 315 | 38.8% |
| Total Housing Units | 813 | 100.0% |
Occupancy by Ownership by Household Size in Kensington
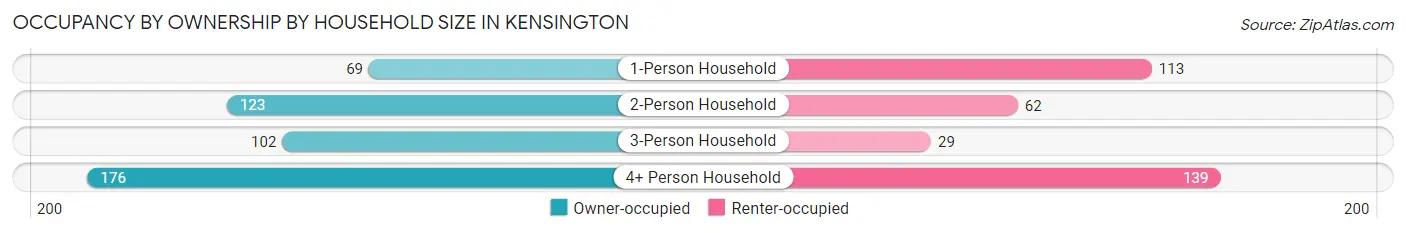
| Household Size | Owner-occupied | Renter-occupied |
| 1-Person Household | 69 (37.9%) | 113 (62.1%) |
| 2-Person Household | 123 (66.5%) | 62 (33.5%) |
| 3-Person Household | 102 (77.9%) | 29 (22.1%) |
| 4+ Person Household | 176 (55.9%) | 139 (44.1%) |
| Total Housing Units | 470 (57.8%) | 343 (42.2%) |
Occupancy by Educational Attainment in Kensington
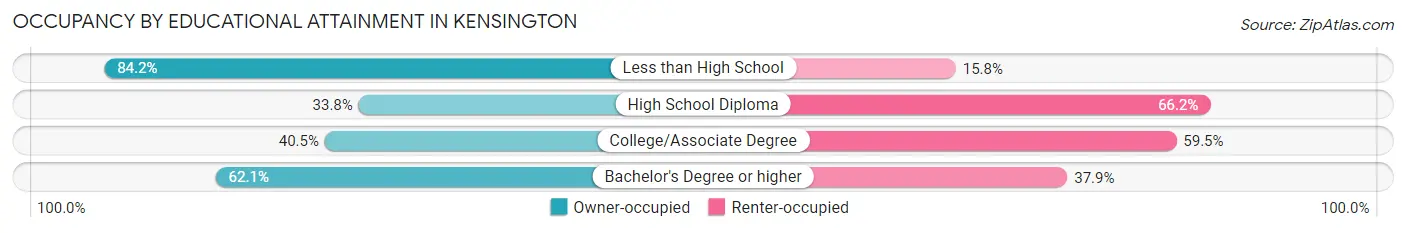
| Household Size | Owner-occupied | Renter-occupied |
| Less than High School | 16 (84.2%) | 3 (15.8%) |
| High School Diploma | 25 (33.8%) | 49 (66.2%) |
| College/Associate Degree | 34 (40.5%) | 50 (59.5%) |
| Bachelor's Degree or higher | 395 (62.1%) | 241 (37.9%) |
Occupancy by Age of Householder in Kensington
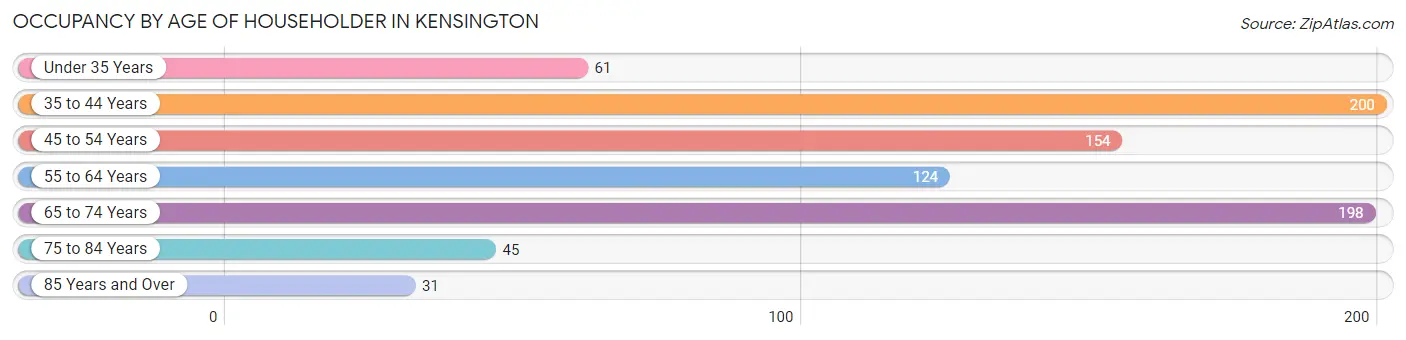
| Age Bracket | # Households | % Households |
| Under 35 Years | 61 | 7.5% |
| 35 to 44 Years | 200 | 24.6% |
| 45 to 54 Years | 154 | 18.9% |
| 55 to 64 Years | 124 | 15.2% |
| 65 to 74 Years | 198 | 24.3% |
| 75 to 84 Years | 45 | 5.5% |
| 85 Years and Over | 31 | 3.8% |
| Total | 813 | 100.0% |
Housing Finances in Kensington
Median Income by Occupancy in Kensington
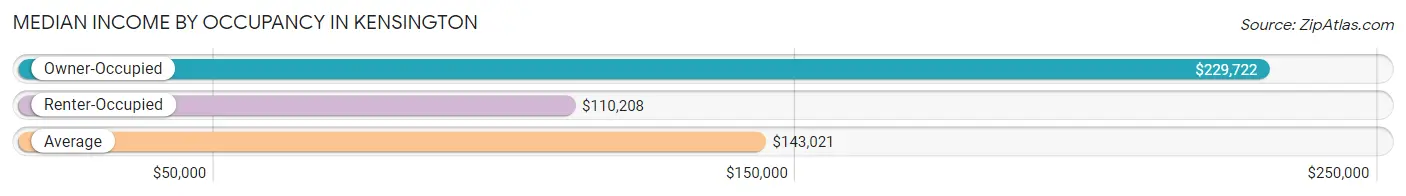
| Occupancy Type | # Households | Median Income |
| Owner-Occupied | 470 (57.8%) | $229,722 |
| Renter-Occupied | 343 (42.2%) | $110,208 |
| Average | 813 (100.0%) | $143,021 |
Occupancy by Householder Income Bracket in Kensington
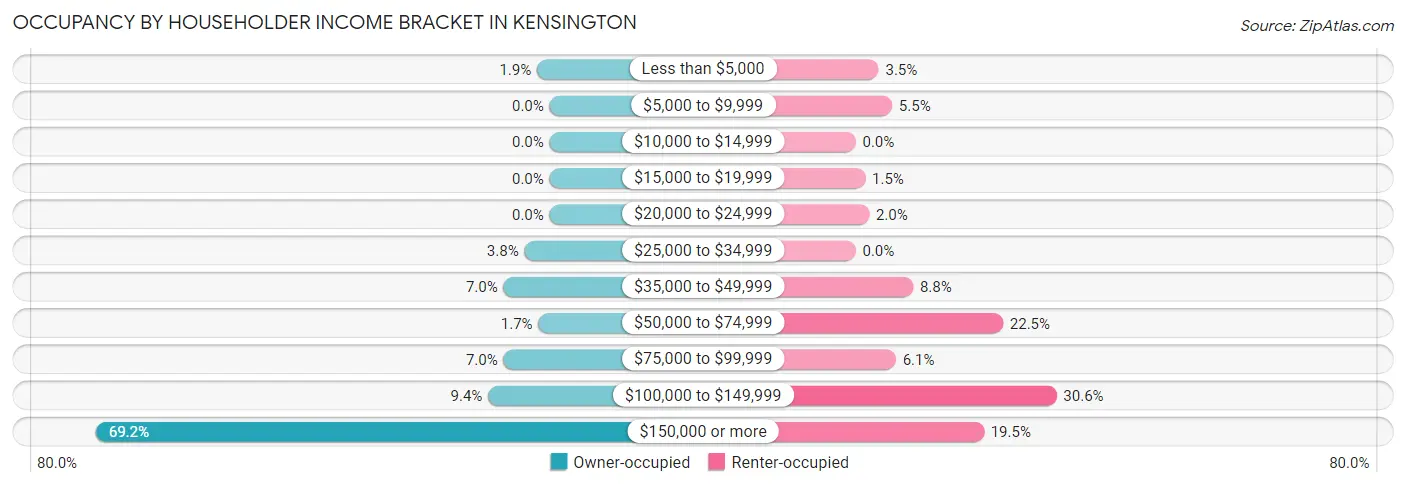
| Income Bracket | Owner-occupied | Renter-occupied |
| Less than $5,000 | 9 (1.9%) | 12 (3.5%) |
| $5,000 to $9,999 | 0 (0.0%) | 19 (5.5%) |
| $10,000 to $14,999 | 0 (0.0%) | 0 (0.0%) |
| $15,000 to $19,999 | 0 (0.0%) | 5 (1.5%) |
| $20,000 to $24,999 | 0 (0.0%) | 7 (2.0%) |
| $25,000 to $34,999 | 18 (3.8%) | 0 (0.0%) |
| $35,000 to $49,999 | 33 (7.0%) | 30 (8.7%) |
| $50,000 to $74,999 | 8 (1.7%) | 77 (22.5%) |
| $75,000 to $99,999 | 33 (7.0%) | 21 (6.1%) |
| $100,000 to $149,999 | 44 (9.4%) | 105 (30.6%) |
| $150,000 or more | 325 (69.2%) | 67 (19.5%) |
| Total | 470 (100.0%) | 343 (100.0%) |
Monthly Housing Cost Tiers in Kensington
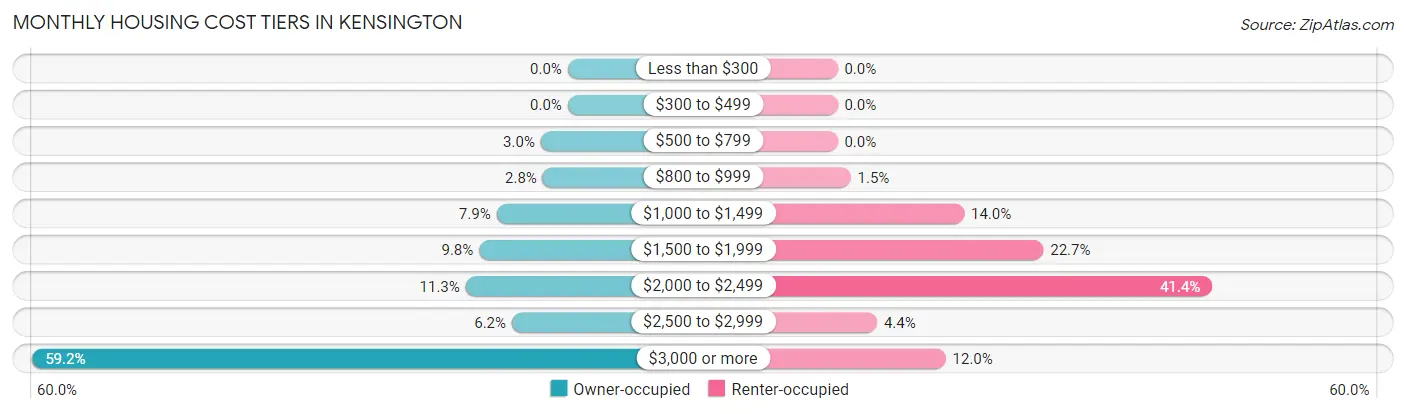
| Monthly Cost | Owner-occupied | Renter-occupied |
| Less than $300 | 0 (0.0%) | 0 (0.0%) |
| $300 to $499 | 0 (0.0%) | 0 (0.0%) |
| $500 to $799 | 14 (3.0%) | 0 (0.0%) |
| $800 to $999 | 13 (2.8%) | 5 (1.5%) |
| $1,000 to $1,499 | 37 (7.9%) | 48 (14.0%) |
| $1,500 to $1,999 | 46 (9.8%) | 78 (22.7%) |
| $2,000 to $2,499 | 53 (11.3%) | 142 (41.4%) |
| $2,500 to $2,999 | 29 (6.2%) | 15 (4.4%) |
| $3,000 or more | 278 (59.2%) | 41 (11.9%) |
| Total | 470 (100.0%) | 343 (100.0%) |
Physical Housing Characteristics in Kensington
Housing Structures in Kensington
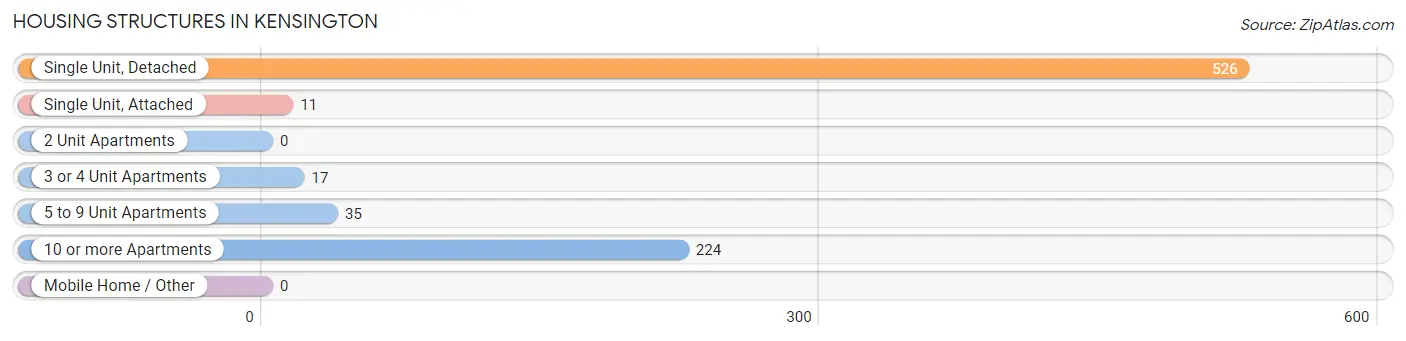
| Structure Type | # Housing Units | % Housing Units |
| Single Unit, Detached | 526 | 64.7% |
| Single Unit, Attached | 11 | 1.3% |
| 2 Unit Apartments | 0 | 0.0% |
| 3 or 4 Unit Apartments | 17 | 2.1% |
| 5 to 9 Unit Apartments | 35 | 4.3% |
| 10 or more Apartments | 224 | 27.6% |
| Mobile Home / Other | 0 | 0.0% |
| Total | 813 | 100.0% |
Housing Structures by Occupancy in Kensington
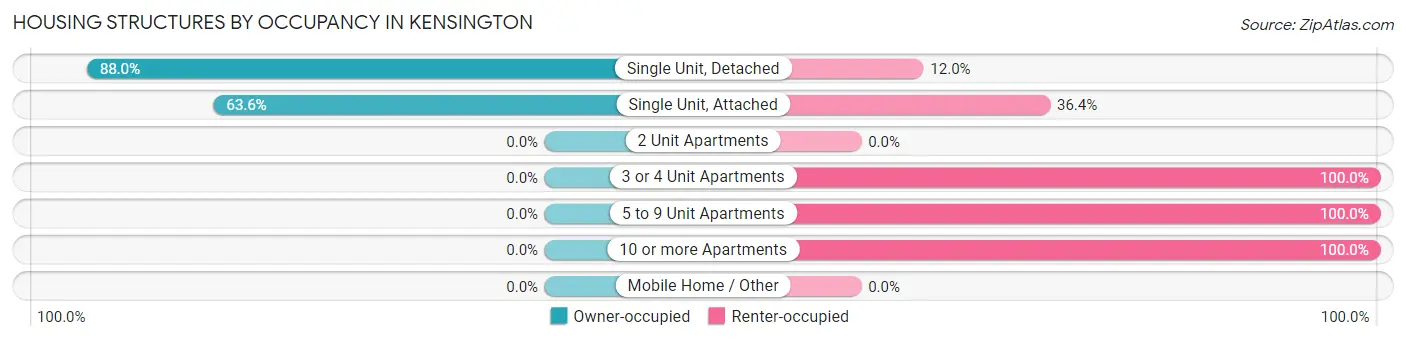
| Structure Type | Owner-occupied | Renter-occupied |
| Single Unit, Detached | 463 (88.0%) | 63 (12.0%) |
| Single Unit, Attached | 7 (63.6%) | 4 (36.4%) |
| 2 Unit Apartments | 0 (0.0%) | 0 (0.0%) |
| 3 or 4 Unit Apartments | 0 (0.0%) | 17 (100.0%) |
| 5 to 9 Unit Apartments | 0 (0.0%) | 35 (100.0%) |
| 10 or more Apartments | 0 (0.0%) | 224 (100.0%) |
| Mobile Home / Other | 0 (0.0%) | 0 (0.0%) |
| Total | 470 (57.8%) | 343 (42.2%) |
Housing Structures by Number of Rooms in Kensington
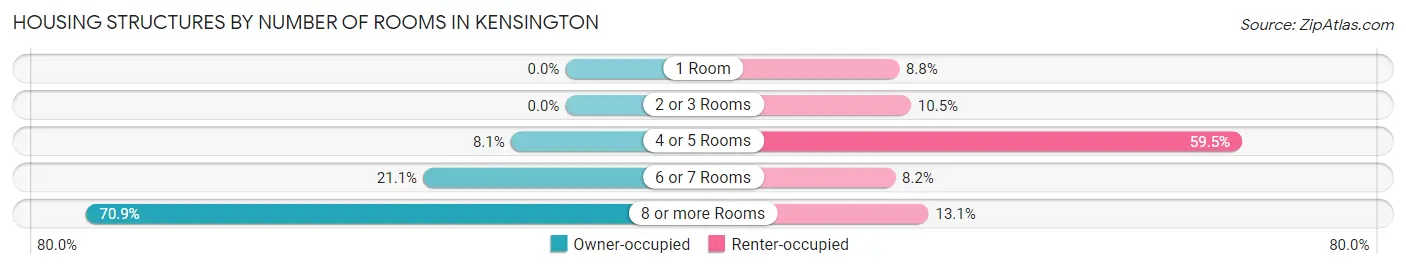
| Number of Rooms | Owner-occupied | Renter-occupied |
| 1 Room | 0 (0.0%) | 30 (8.7%) |
| 2 or 3 Rooms | 0 (0.0%) | 36 (10.5%) |
| 4 or 5 Rooms | 38 (8.1%) | 204 (59.5%) |
| 6 or 7 Rooms | 99 (21.1%) | 28 (8.2%) |
| 8 or more Rooms | 333 (70.9%) | 45 (13.1%) |
| Total | 470 (100.0%) | 343 (100.0%) |
Housing Structure by Heating Type in Kensington
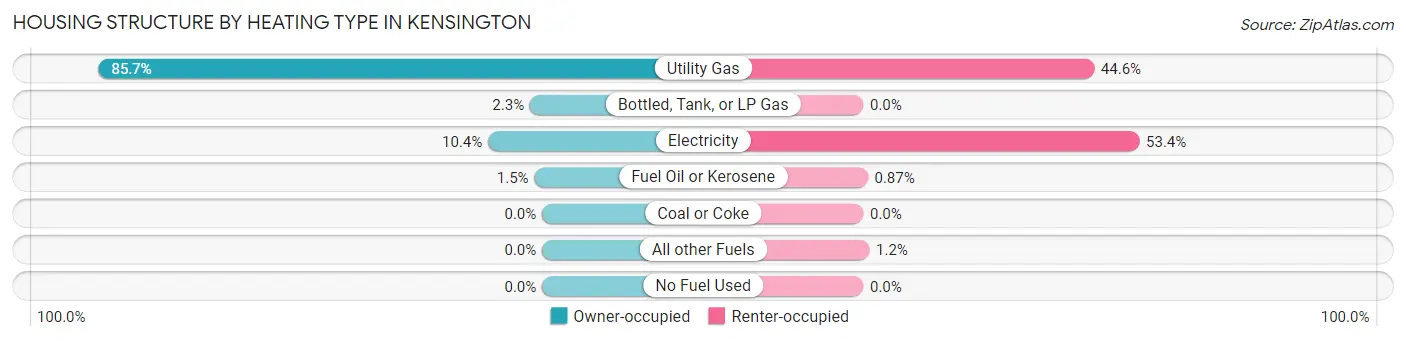
| Heating Type | Owner-occupied | Renter-occupied |
| Utility Gas | 403 (85.7%) | 153 (44.6%) |
| Bottled, Tank, or LP Gas | 11 (2.3%) | 0 (0.0%) |
| Electricity | 49 (10.4%) | 183 (53.3%) |
| Fuel Oil or Kerosene | 7 (1.5%) | 3 (0.9%) |
| Coal or Coke | 0 (0.0%) | 0 (0.0%) |
| All other Fuels | 0 (0.0%) | 4 (1.2%) |
| No Fuel Used | 0 (0.0%) | 0 (0.0%) |
| Total | 470 (100.0%) | 343 (100.0%) |
Household Vehicle Usage in Kensington
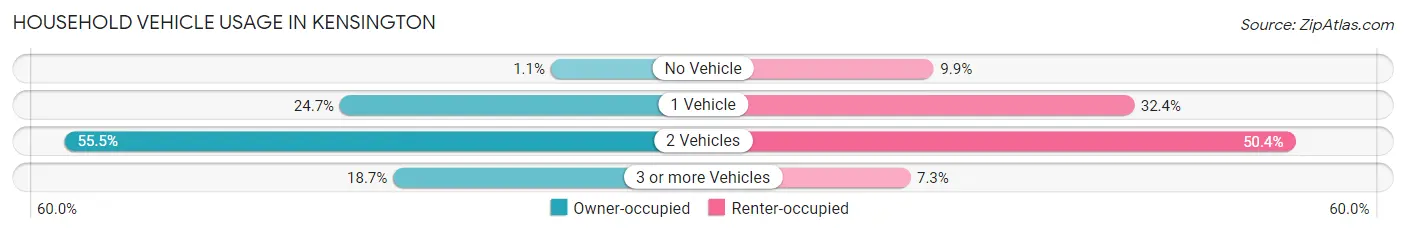
| Vehicles per Household | Owner-occupied | Renter-occupied |
| No Vehicle | 5 (1.1%) | 34 (9.9%) |
| 1 Vehicle | 116 (24.7%) | 111 (32.4%) |
| 2 Vehicles | 261 (55.5%) | 173 (50.4%) |
| 3 or more Vehicles | 88 (18.7%) | 25 (7.3%) |
| Total | 470 (100.0%) | 343 (100.0%) |
Real Estate & Mortgages in Kensington
Real Estate and Mortgage Overview in Kensington
| Characteristic | Without Mortgage | With Mortgage |
| Housing Units | 61 | 409 |
| Median Property Value | $774,000 | $904,400 |
| Median Household Income | $188,438 | $291 |
| Monthly Housing Costs | $1,088 | $278 |
| Real Estate Taxes | $8,578 | $0 |
Property Value by Mortgage Status in Kensington
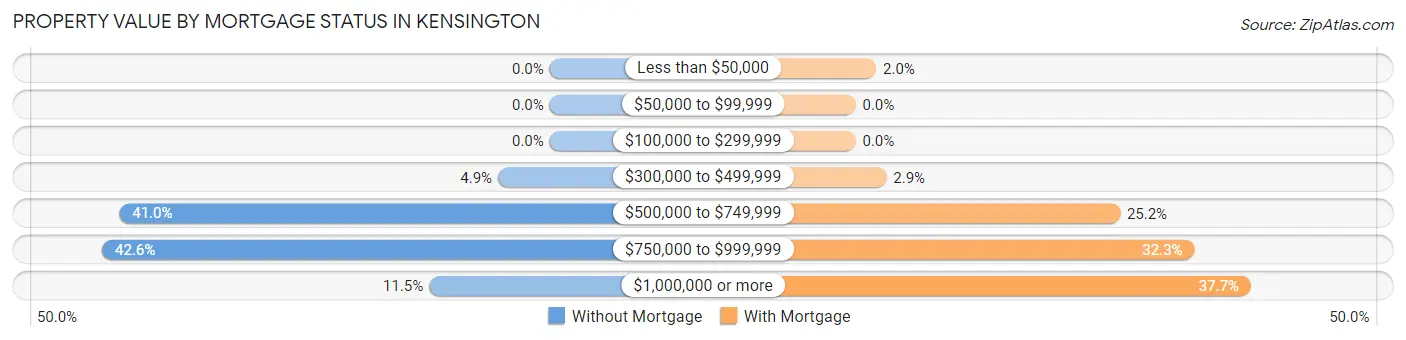
| Property Value | Without Mortgage | With Mortgage |
| Less than $50,000 | 0 (0.0%) | 8 (2.0%) |
| $50,000 to $99,999 | 0 (0.0%) | 0 (0.0%) |
| $100,000 to $299,999 | 0 (0.0%) | 0 (0.0%) |
| $300,000 to $499,999 | 3 (4.9%) | 12 (2.9%) |
| $500,000 to $749,999 | 25 (41.0%) | 103 (25.2%) |
| $750,000 to $999,999 | 26 (42.6%) | 132 (32.3%) |
| $1,000,000 or more | 7 (11.5%) | 154 (37.7%) |
| Total | 61 (100.0%) | 409 (100.0%) |
Household Income by Mortgage Status in Kensington
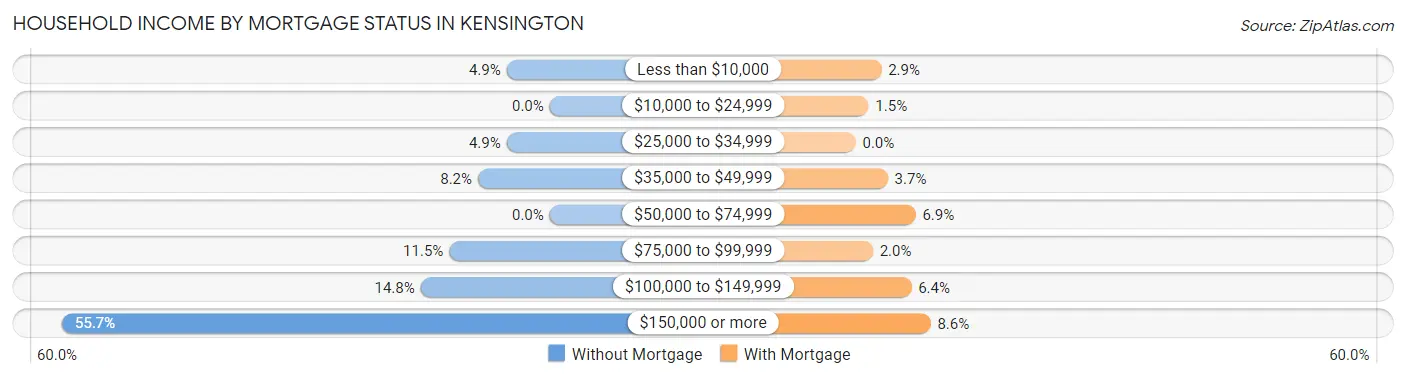
| Household Income | Without Mortgage | With Mortgage |
| Less than $10,000 | 3 (4.9%) | 12 (2.9%) |
| $10,000 to $24,999 | 0 (0.0%) | 6 (1.5%) |
| $25,000 to $34,999 | 3 (4.9%) | 0 (0.0%) |
| $35,000 to $49,999 | 5 (8.2%) | 15 (3.7%) |
| $50,000 to $74,999 | 0 (0.0%) | 28 (6.9%) |
| $75,000 to $99,999 | 7 (11.5%) | 8 (2.0%) |
| $100,000 to $149,999 | 9 (14.7%) | 26 (6.4%) |
| $150,000 or more | 34 (55.7%) | 35 (8.6%) |
| Total | 61 (100.0%) | 409 (100.0%) |
Property Value to Household Income Ratio in Kensington
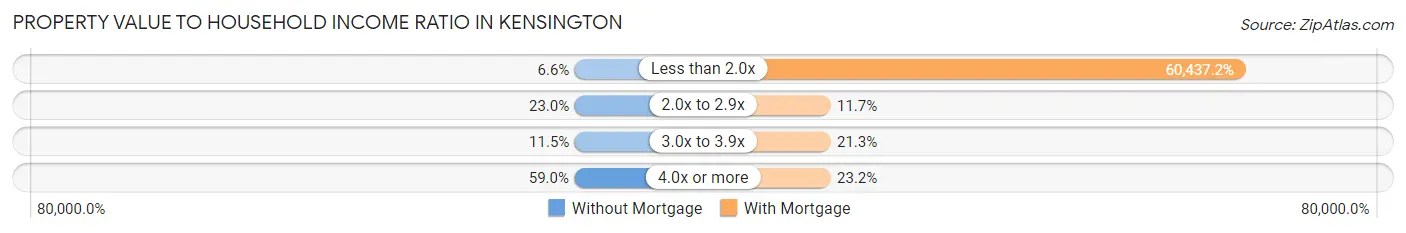
| Value-to-Income Ratio | Without Mortgage | With Mortgage |
| Less than 2.0x | 4 (6.6%) | 247,188 (60,437.2%) |
| 2.0x to 2.9x | 14 (23.0%) | 48 (11.7%) |
| 3.0x to 3.9x | 7 (11.5%) | 87 (21.3%) |
| 4.0x or more | 36 (59.0%) | 95 (23.2%) |
| Total | 61 (100.0%) | 409 (100.0%) |
Real Estate Taxes by Mortgage Status in Kensington
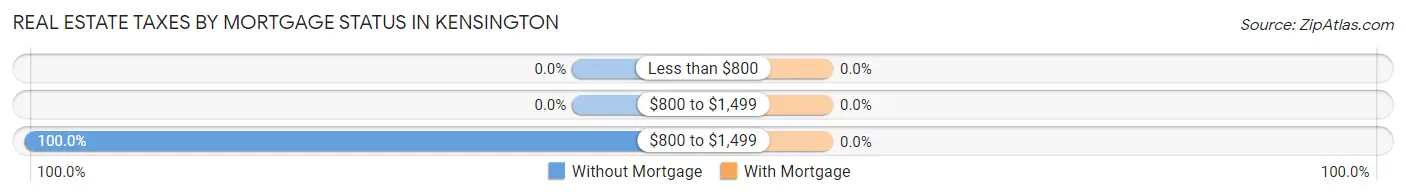
| Property Taxes | Without Mortgage | With Mortgage |
| Less than $800 | 0 (0.0%) | 0 (0.0%) |
| $800 to $1,499 | 0 (0.0%) | 0 (0.0%) |
| $800 to $1,499 | 61 (100.0%) | 0 (0.0%) |
| Total | 61 (100.0%) | 409 (100.0%) |
Health & Disability in Kensington
Health Insurance Coverage by Age in Kensington
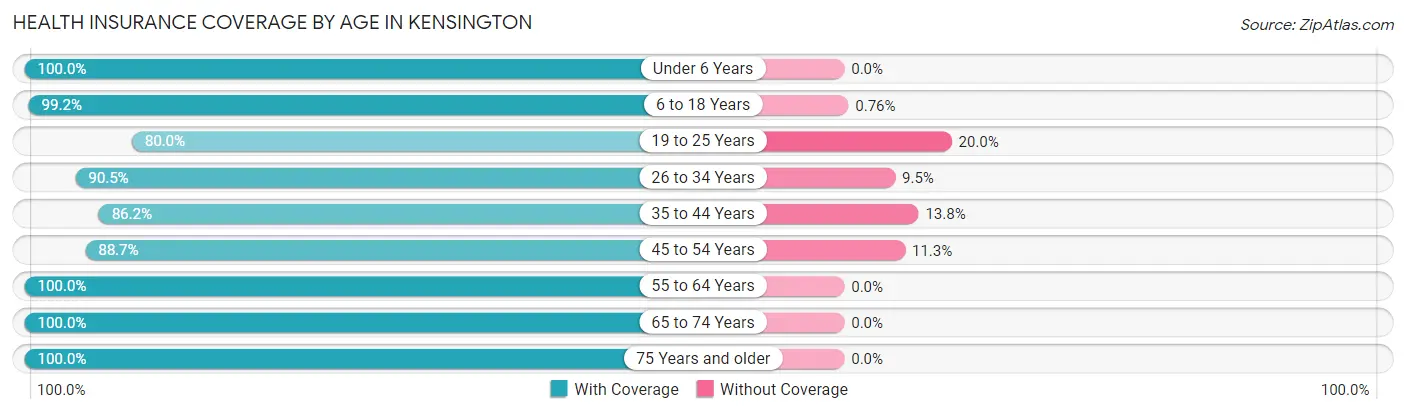
| Age Bracket | With Coverage | Without Coverage |
| Under 6 Years | 208 (100.0%) | 0 (0.0%) |
| 6 to 18 Years | 523 (99.2%) | 4 (0.8%) |
| 19 to 25 Years | 84 (80.0%) | 21 (20.0%) |
| 26 to 34 Years | 105 (90.5%) | 11 (9.5%) |
| 35 to 44 Years | 349 (86.2%) | 56 (13.8%) |
| 45 to 54 Years | 235 (88.7%) | 30 (11.3%) |
| 55 to 64 Years | 253 (100.0%) | 0 (0.0%) |
| 65 to 74 Years | 255 (100.0%) | 0 (0.0%) |
| 75 Years and older | 102 (100.0%) | 0 (0.0%) |
| Total | 2,114 (94.5%) | 122 (5.5%) |
Health Insurance Coverage by Citizenship Status in Kensington
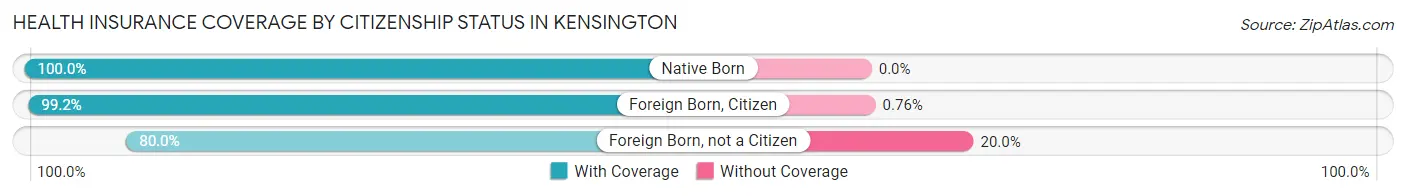
| Citizenship Status | With Coverage | Without Coverage |
| Native Born | 208 (100.0%) | 0 (0.0%) |
| Foreign Born, Citizen | 523 (99.2%) | 4 (0.8%) |
| Foreign Born, not a Citizen | 84 (80.0%) | 21 (20.0%) |
Health Insurance Coverage by Household Income in Kensington
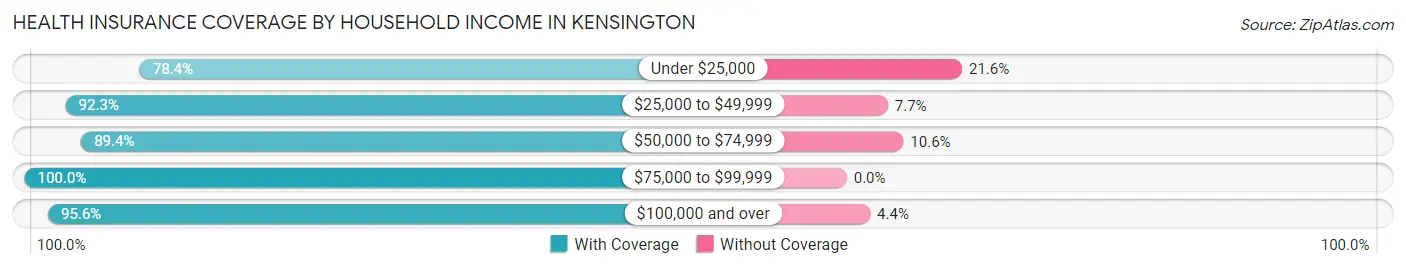
| Household Income | With Coverage | Without Coverage |
| Under $25,000 | 69 (78.4%) | 19 (21.6%) |
| $25,000 to $49,999 | 156 (92.3%) | 13 (7.7%) |
| $50,000 to $74,999 | 118 (89.4%) | 14 (10.6%) |
| $75,000 to $99,999 | 110 (100.0%) | 0 (0.0%) |
| $100,000 and over | 1,661 (95.6%) | 76 (4.4%) |
Public vs Private Health Insurance Coverage by Age in Kensington
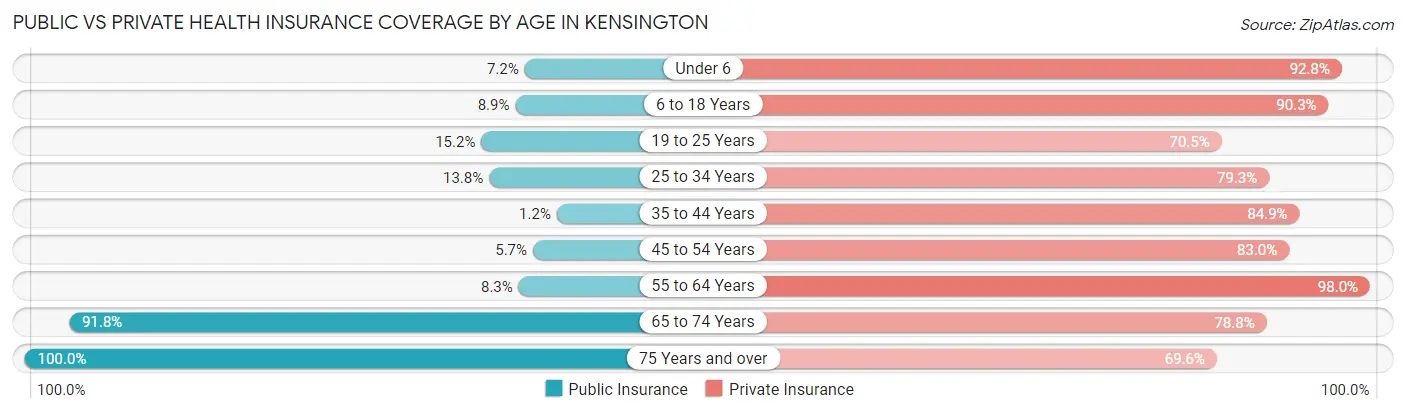
| Age Bracket | Public Insurance | Private Insurance |
| Under 6 | 15 (7.2%) | 193 (92.8%) |
| 6 to 18 Years | 47 (8.9%) | 476 (90.3%) |
| 19 to 25 Years | 16 (15.2%) | 74 (70.5%) |
| 25 to 34 Years | 16 (13.8%) | 92 (79.3%) |
| 35 to 44 Years | 5 (1.2%) | 344 (84.9%) |
| 45 to 54 Years | 15 (5.7%) | 220 (83.0%) |
| 55 to 64 Years | 21 (8.3%) | 248 (98.0%) |
| 65 to 74 Years | 234 (91.8%) | 201 (78.8%) |
| 75 Years and over | 102 (100.0%) | 71 (69.6%) |
| Total | 471 (21.1%) | 1,919 (85.8%) |
Disability Status by Sex by Age in Kensington
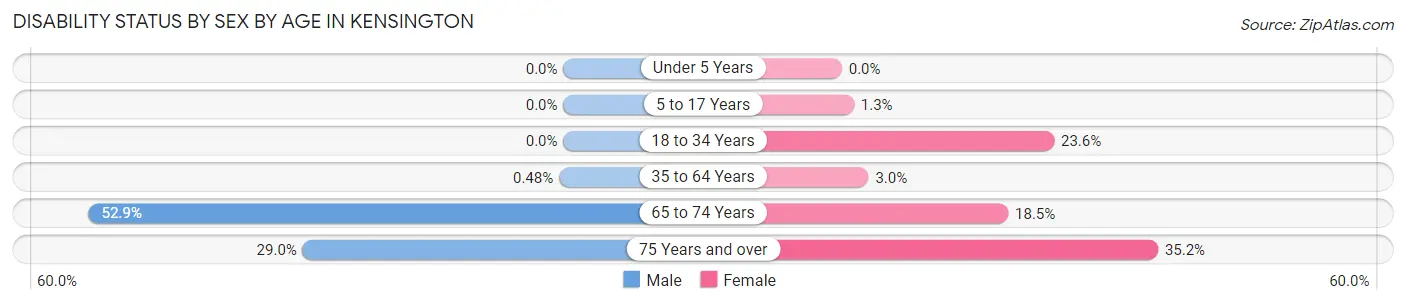
| Age Bracket | Male | Female |
| Under 5 Years | 0 (0.0%) | 0 (0.0%) |
| 5 to 17 Years | 0 (0.0%) | 3 (1.3%) |
| 18 to 34 Years | 0 (0.0%) | 26 (23.6%) |
| 35 to 64 Years | 2 (0.5%) | 15 (3.0%) |
| 65 to 74 Years | 92 (52.9%) | 15 (18.5%) |
| 75 Years and over | 9 (29.0%) | 25 (35.2%) |
Disability Class by Sex by Age in Kensington
Disability Class: Hearing Difficulty
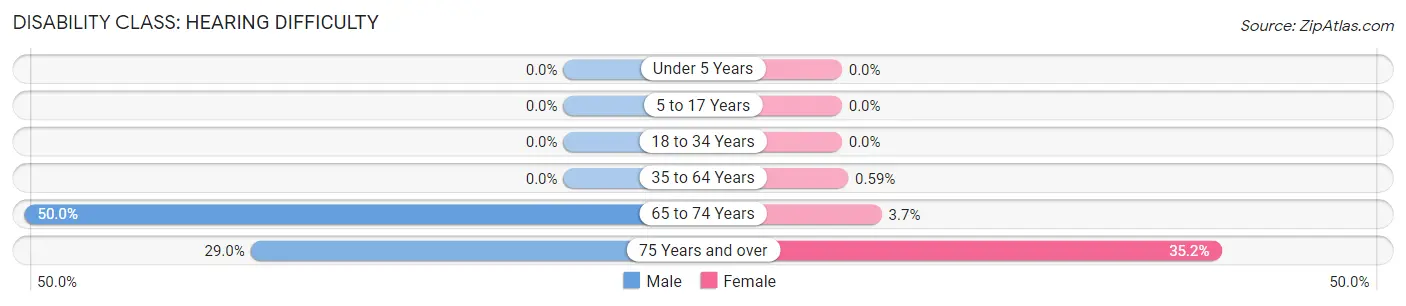
| Age Bracket | Male | Female |
| Under 5 Years | 0 (0.0%) | 0 (0.0%) |
| 5 to 17 Years | 0 (0.0%) | 0 (0.0%) |
| 18 to 34 Years | 0 (0.0%) | 0 (0.0%) |
| 35 to 64 Years | 0 (0.0%) | 3 (0.6%) |
| 65 to 74 Years | 87 (50.0%) | 3 (3.7%) |
| 75 Years and over | 9 (29.0%) | 25 (35.2%) |
Disability Class: Vision Difficulty
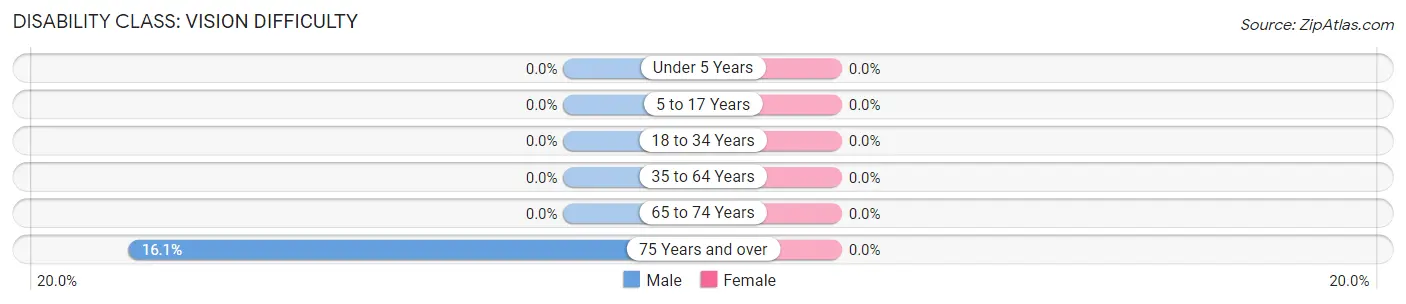
| Age Bracket | Male | Female |
| Under 5 Years | 0 (0.0%) | 0 (0.0%) |
| 5 to 17 Years | 0 (0.0%) | 0 (0.0%) |
| 18 to 34 Years | 0 (0.0%) | 0 (0.0%) |
| 35 to 64 Years | 0 (0.0%) | 0 (0.0%) |
| 65 to 74 Years | 0 (0.0%) | 0 (0.0%) |
| 75 Years and over | 5 (16.1%) | 0 (0.0%) |
Disability Class: Cognitive Difficulty
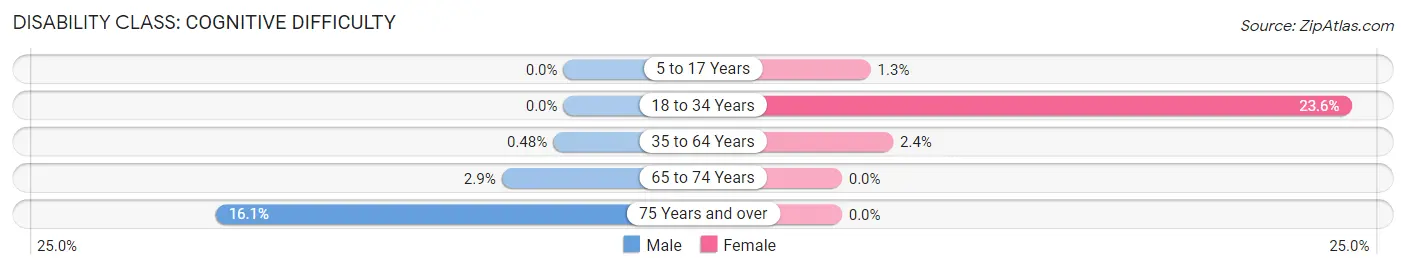
| Age Bracket | Male | Female |
| 5 to 17 Years | 0 (0.0%) | 3 (1.3%) |
| 18 to 34 Years | 0 (0.0%) | 26 (23.6%) |
| 35 to 64 Years | 2 (0.5%) | 12 (2.4%) |
| 65 to 74 Years | 5 (2.9%) | 0 (0.0%) |
| 75 Years and over | 5 (16.1%) | 0 (0.0%) |
Disability Class: Ambulatory Difficulty
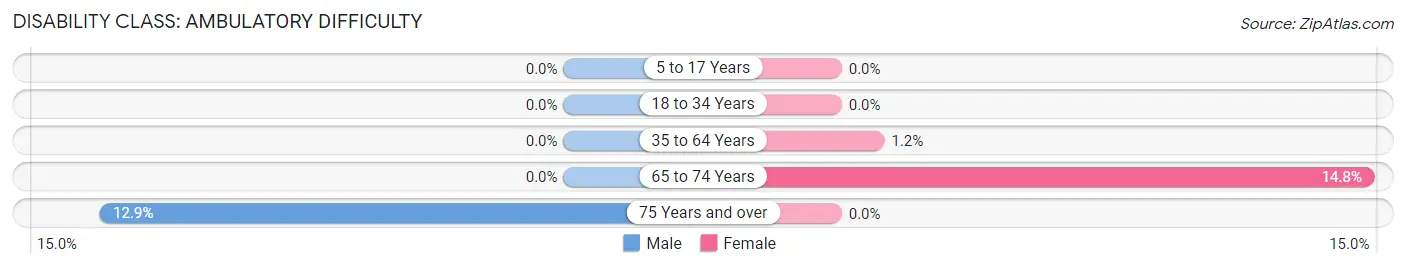
| Age Bracket | Male | Female |
| 5 to 17 Years | 0 (0.0%) | 0 (0.0%) |
| 18 to 34 Years | 0 (0.0%) | 0 (0.0%) |
| 35 to 64 Years | 0 (0.0%) | 6 (1.2%) |
| 65 to 74 Years | 0 (0.0%) | 12 (14.8%) |
| 75 Years and over | 4 (12.9%) | 0 (0.0%) |
Disability Class: Self-Care Difficulty
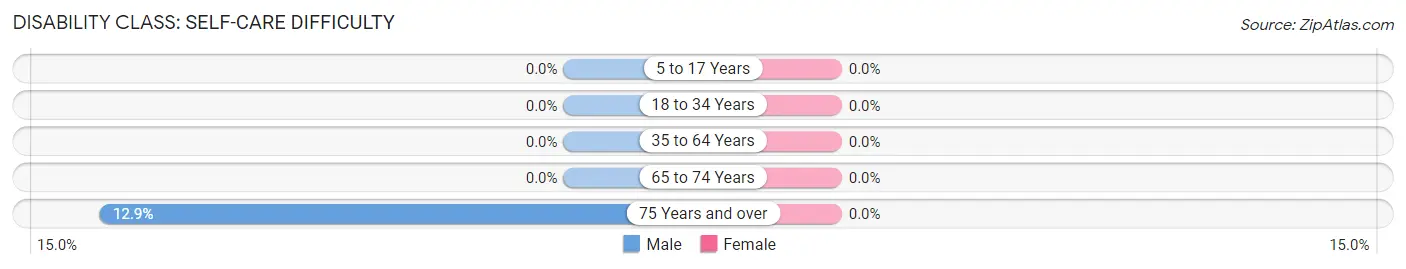
| Age Bracket | Male | Female |
| 5 to 17 Years | 0 (0.0%) | 0 (0.0%) |
| 18 to 34 Years | 0 (0.0%) | 0 (0.0%) |
| 35 to 64 Years | 0 (0.0%) | 0 (0.0%) |
| 65 to 74 Years | 0 (0.0%) | 0 (0.0%) |
| 75 Years and over | 4 (12.9%) | 0 (0.0%) |
Technology Access in Kensington
Computing Device Access in Kensington
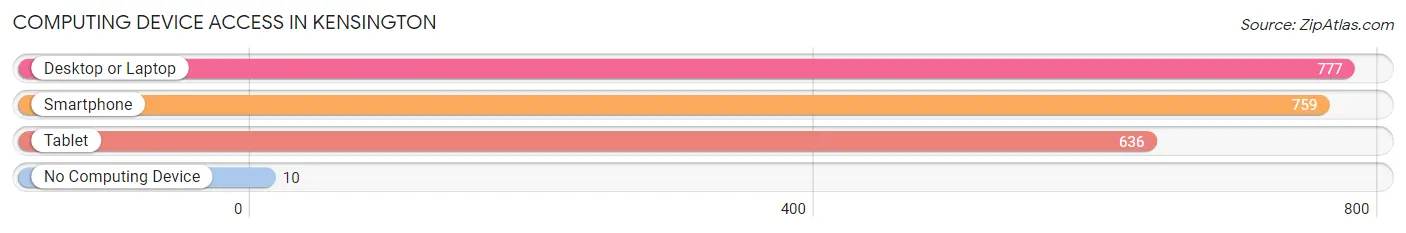
| Device Type | # Households | % Households |
| Desktop or Laptop | 777 | 95.6% |
| Smartphone | 759 | 93.4% |
| Tablet | 636 | 78.2% |
| No Computing Device | 10 | 1.2% |
| Total | 813 | 100.0% |
Internet Access in Kensington
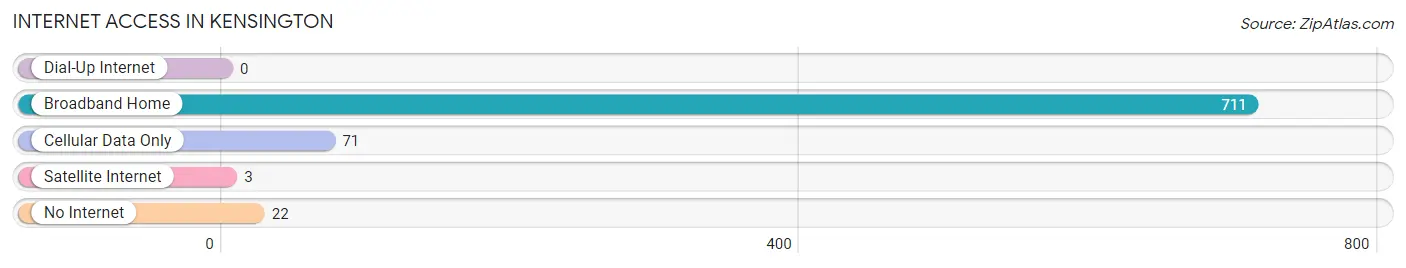
| Internet Type | # Households | % Households |
| Dial-Up Internet | 0 | 0.0% |
| Broadband Home | 711 | 87.5% |
| Cellular Data Only | 71 | 8.7% |
| Satellite Internet | 3 | 0.4% |
| No Internet | 22 | 2.7% |
| Total | 813 | 100.0% |
Kensington Summary
Kensington, Maryland is a small town located in Montgomery County, Maryland, just outside of Washington, D.C. It is a suburb of the nation’s capital and is home to a population of just over 2,000 people. The town is known for its historic charm and its close proximity to the nation’s capital.
History
Kensington was founded in 1894 by a group of businessmen from Washington, D.C. who wanted to create a residential community outside of the city. The town was named after a town in England and was originally intended to be a summer retreat for wealthy Washingtonians. The town was incorporated in 1898 and quickly grew in popularity as a residential community.
In the early 20th century, Kensington was a popular destination for wealthy Washingtonians who wanted to escape the hustle and bustle of the city. The town was known for its large Victorian homes and its quaint downtown area.
Geography
Kensington is located in Montgomery County, Maryland, just outside of Washington, D.C. The town is situated on the western edge of the county, near the border of Washington, D.C. The town is bordered by the towns of Garrett Park, North Bethesda, and Wheaton.
Kensington is located in the Piedmont region of Maryland, which is characterized by rolling hills and lush forests. The town is situated on the banks of Rock Creek, which flows through the town and provides a scenic backdrop.
Economy
Kensington’s economy is largely based on its proximity to Washington, D.C. The town is home to a number of small businesses, including restaurants, shops, and professional services. The town is also home to a number of government contractors, which provide employment opportunities for residents.
The town is also home to a number of historic sites, including the National Park Seminary, which is a former military school. The town is also home to a number of parks and recreational areas, which provide residents with a variety of outdoor activities.
Demographics
As of the 2010 census, Kensington had a population of 2,077 people. The town is predominantly white, with a population that is 87.3% white, 5.2% Hispanic or Latino, 3.2% African American, and 2.3% Asian. The median household income in the town is $107,917, which is significantly higher than the national average.
Kensington is a small town with a rich history and a vibrant economy. The town is home to a diverse population and is a popular destination for those looking to escape the hustle and bustle of Washington, D.C. The town is known for its historic charm and its close proximity to the nation’s capital.
Common Questions
What is the Total Population of Kensington?
Total Population of Kensington is 2,241.
What is the Total Male Population of Kensington?
Total Male Population of Kensington is 1,104.
What is the Total Female Population of Kensington?
Total Female Population of Kensington is 1,137.
What is the Ratio of Males per 100 Females in Kensington?
There are 97.10 Males per 100 Females in Kensington.
What is the Ratio of Females per 100 Males in Kensington?
There are 102.99 Females per 100 Males in Kensington.
What is the Median Population Age in Kensington?
Median Population Age in Kensington is 40.4 Years.
What is the Average Family Size in Kensington
Average Family Size in Kensington is 3.5 People.
What is the Average Household Size in Kensington
Average Household Size in Kensington is 2.8 People.
What is Per Capita Income in Kensington?
Per Capita income in Kensington is $78,964.
What is the Median Family Income in Kensington?
Median Family Income in Kensington is $228,889.
What is the Median Household income in Kensington?
Median Household Income in Kensington is $143,021.
What is Income or Wage Gap in Kensington?
Income or Wage Gap in Kensington is 33.9%.
Women in Kensington earn 66.1 cents for every dollar earned by a man.
What is Inequality or Gini Index in Kensington?
Inequality or Gini Index in Kensington is 0.48.
How Large is the Labor Force in Kensington?
There are 1,115 People in the Labor Forcein in Kensington.
What is the Percentage of People in the Labor Force in Kensington?
70.3% of People are in the Labor Force in Kensington.
What is the Unemployment Rate in Kensington?
Unemployment Rate in Kensington is 5.8%.